
 Facebook
 X
X
 Pinterest
 Copy Link
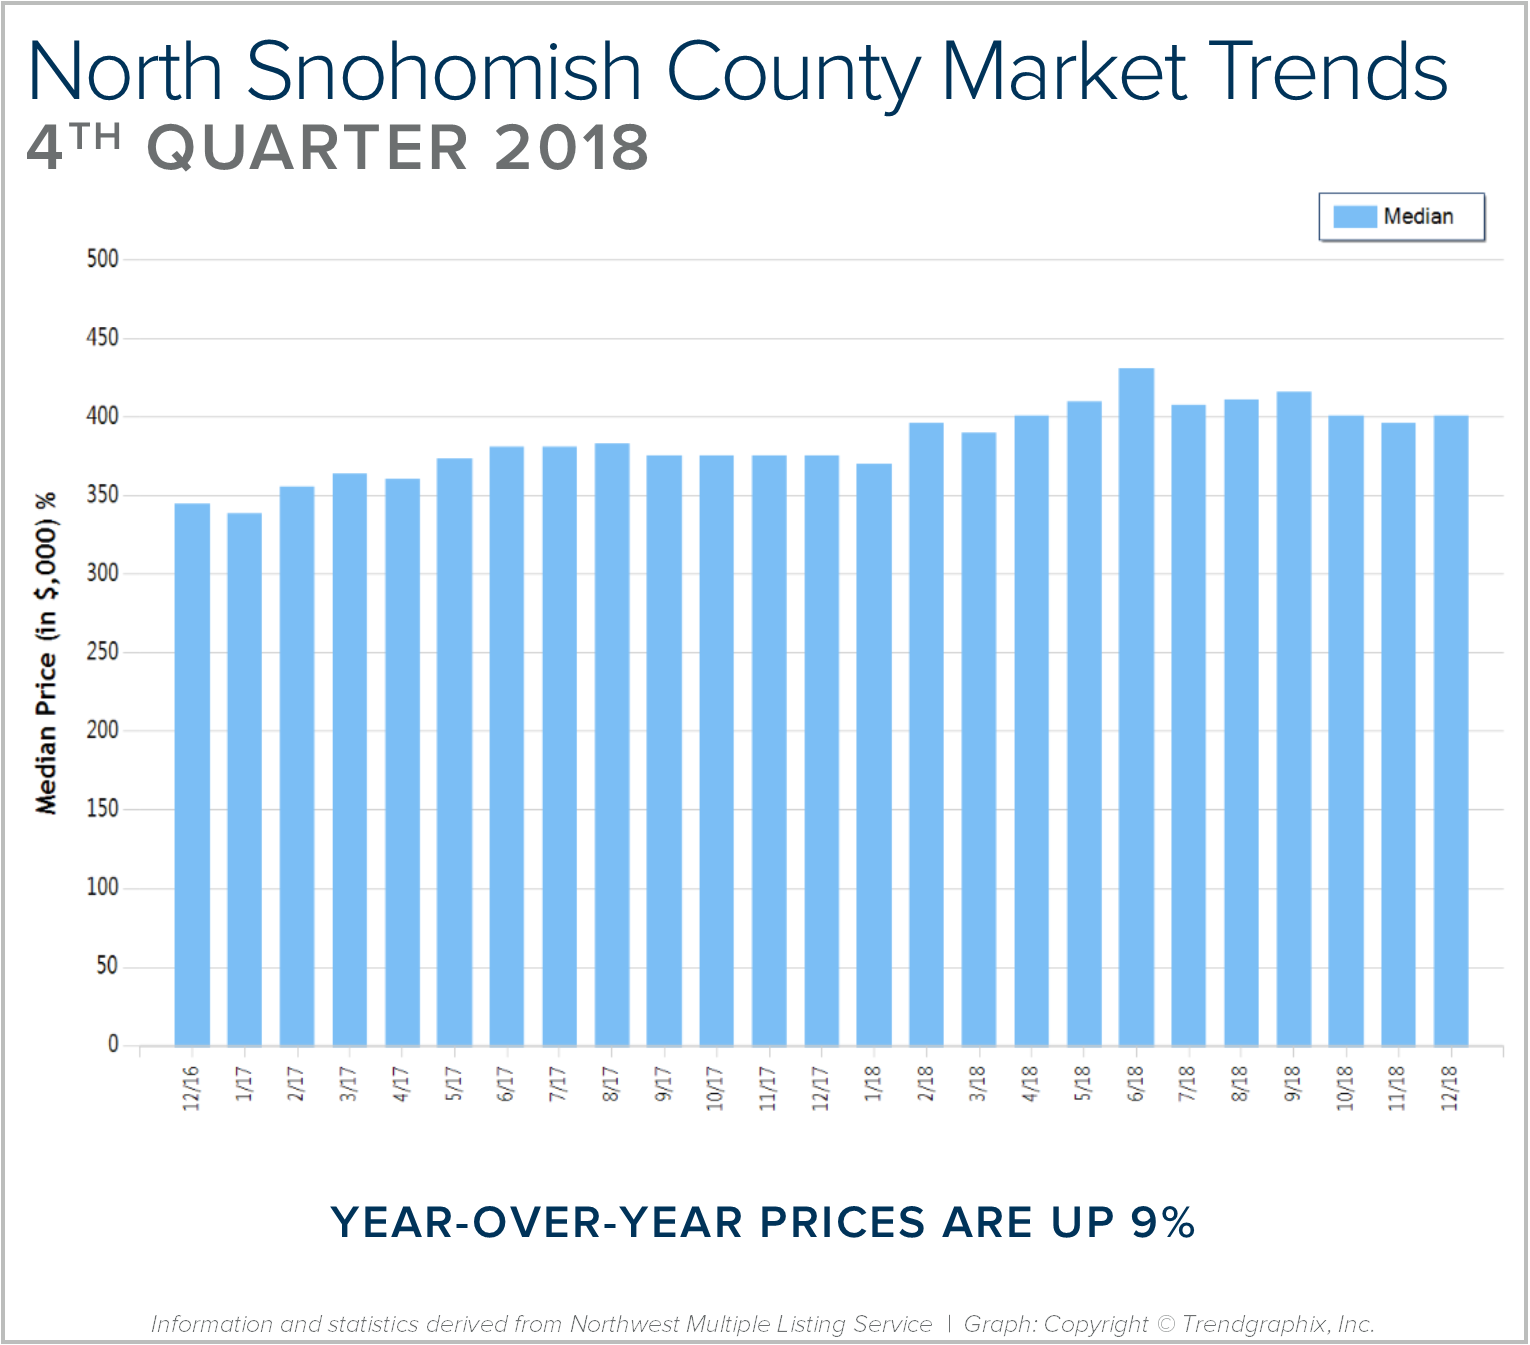
Quarterly Reports: Q4 North Snohomish County
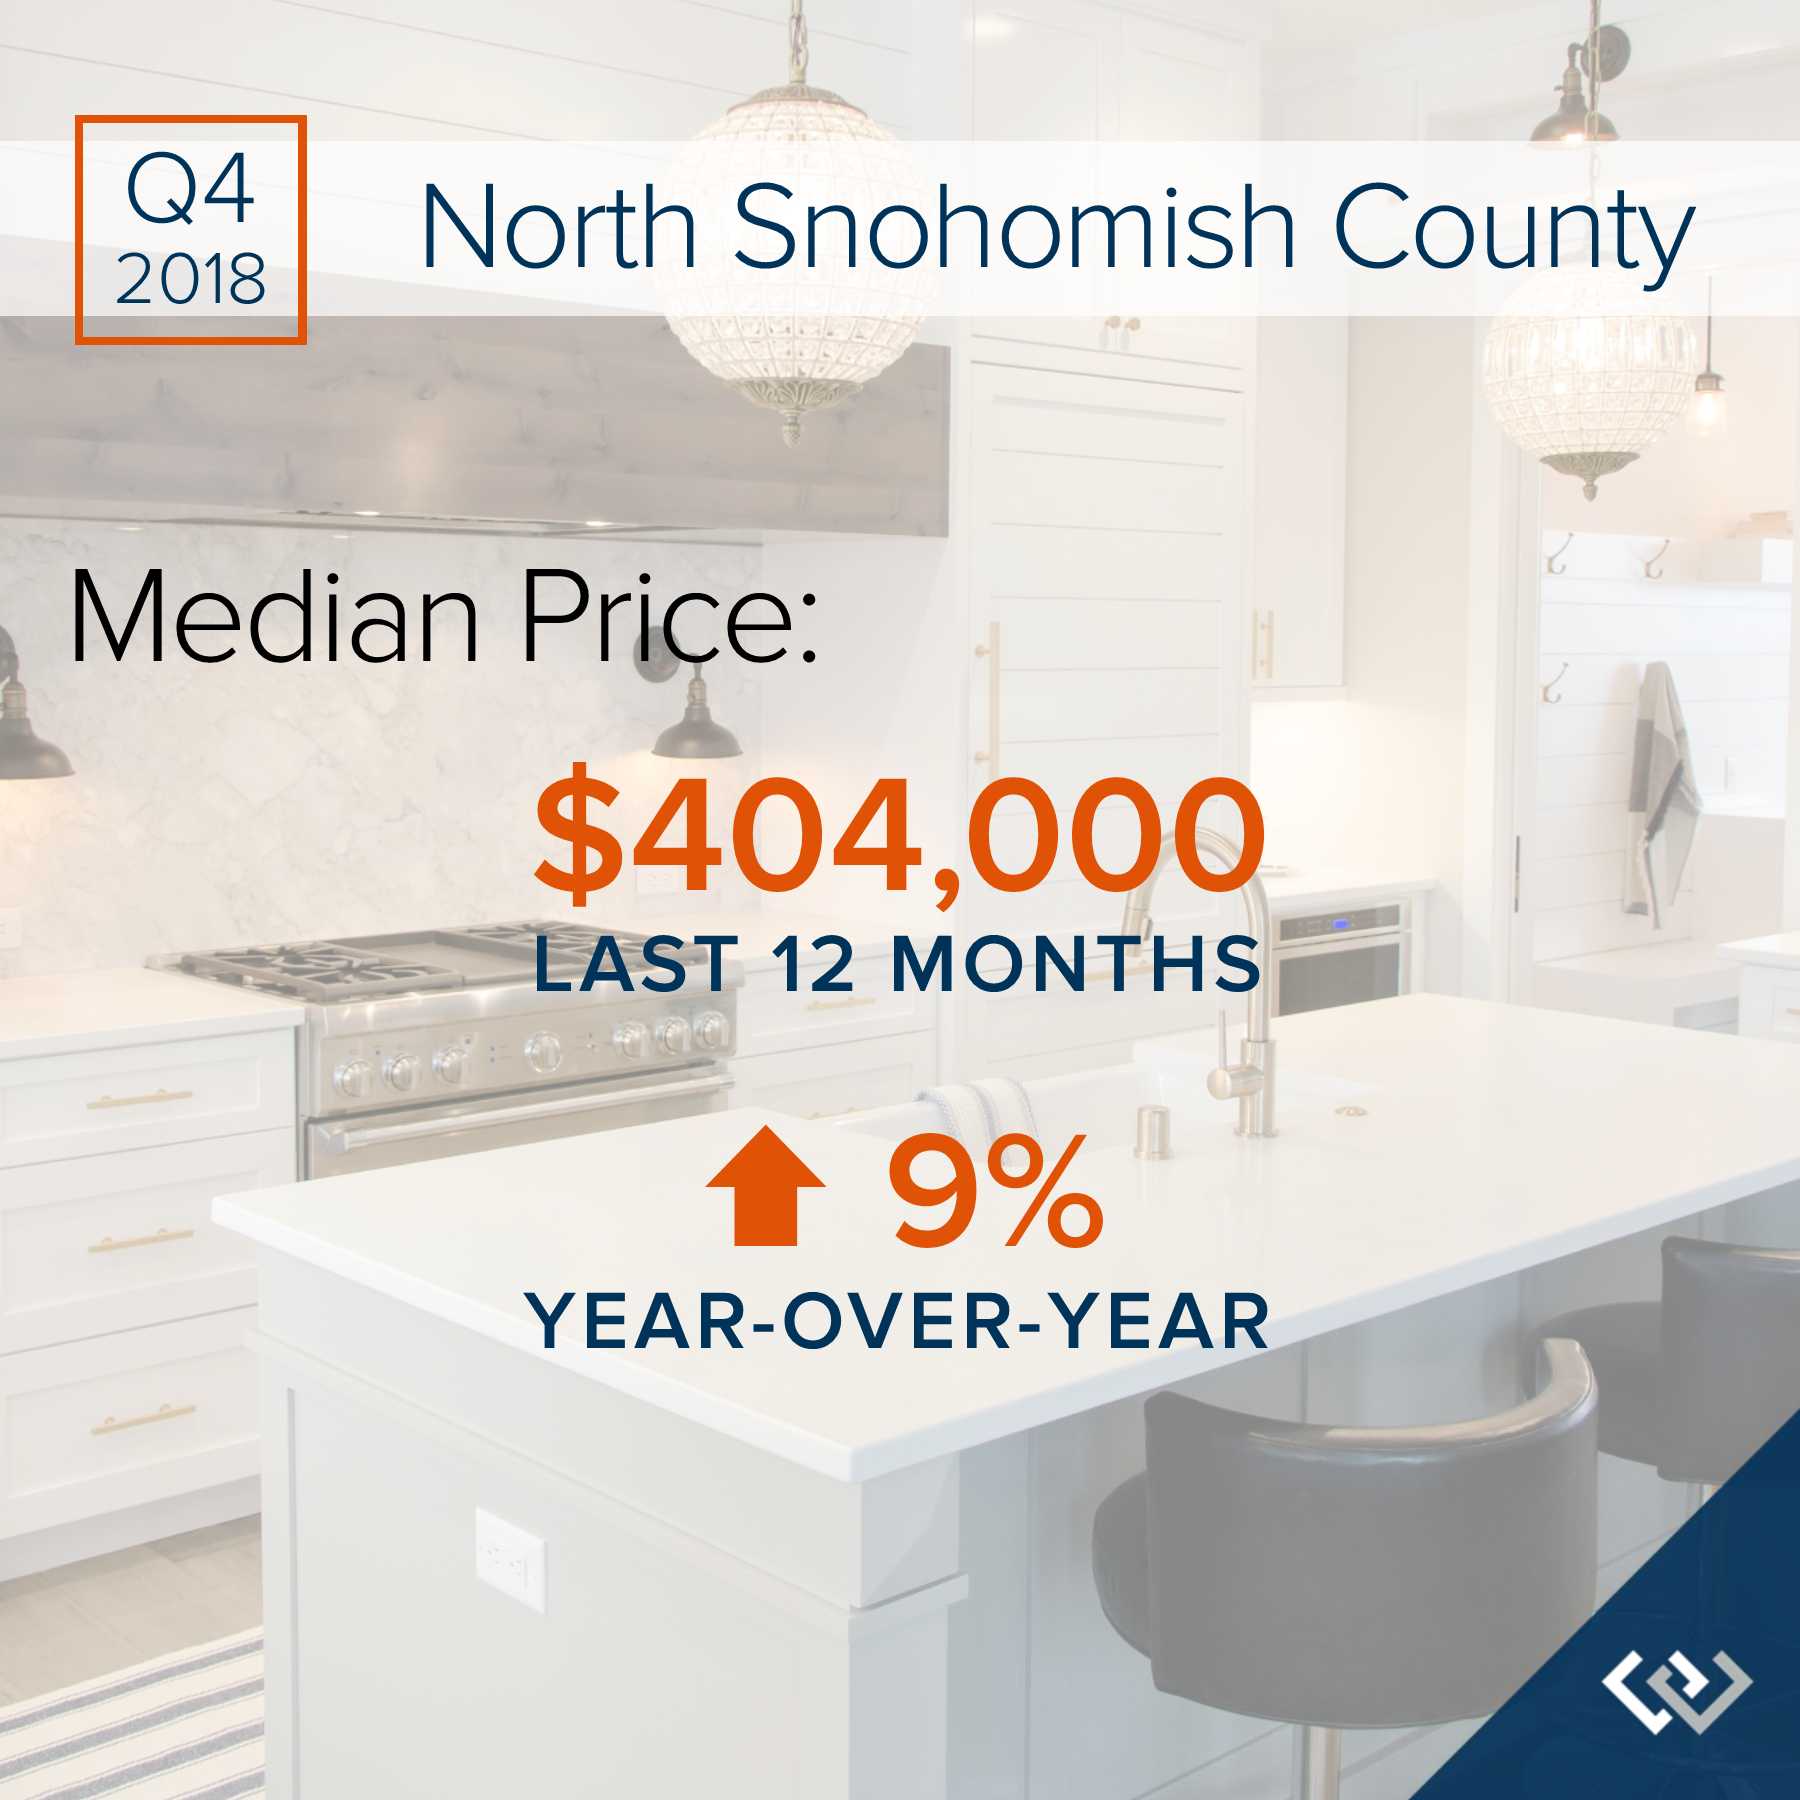
Q4: October 1 – December 31, 2018
NORTH SNOHOMISH COUNTY: 2018 was a year of change and growth. The market shifted from an extreme seller’s market, but still had strong gains. Year-over-year, median price is up 9% and since 2012 has increased 88%! Over the last 19 years, the average year-over-year price increase has been 6%. This puts into perspective the growth we have experienced, resulting in well-established equity levels. In 2018, inventory averaged 1.6 months, higher than 2017. This caused the month-over-month price gains to slow, and we experienced a price correction over the second half of the year. We expect to see more average levels of price appreciation in 2019 as the market continues to balance out.
After six years of expansion resulting in an extreme seller’s market, in 2018 we encountered a market shift in the late spring. Inventory increased, interest rates took a jump, and demand took a step back to re-evaluate the new playing field. This resulted in a tempering of month-over-month price appreciation, and has established some long-awaited balance. This balance has brought opportunities for both buyers and sellers. Buyers have more selection and are negotiating terms like inspection items and concessions. Sellers are sitting on 6+ years of equity growth, and are now able to sell their home and make a move without fearing where they will land next. Interest rates are still well below the 30-year average, currently hovering just under 5%. We are seeing demand start to re-engage now that the new normal has settled in.
This is only a snapshot of the trends in north Snohomish County; please contact us if you would like further explanation of how the latest trends relate to you.
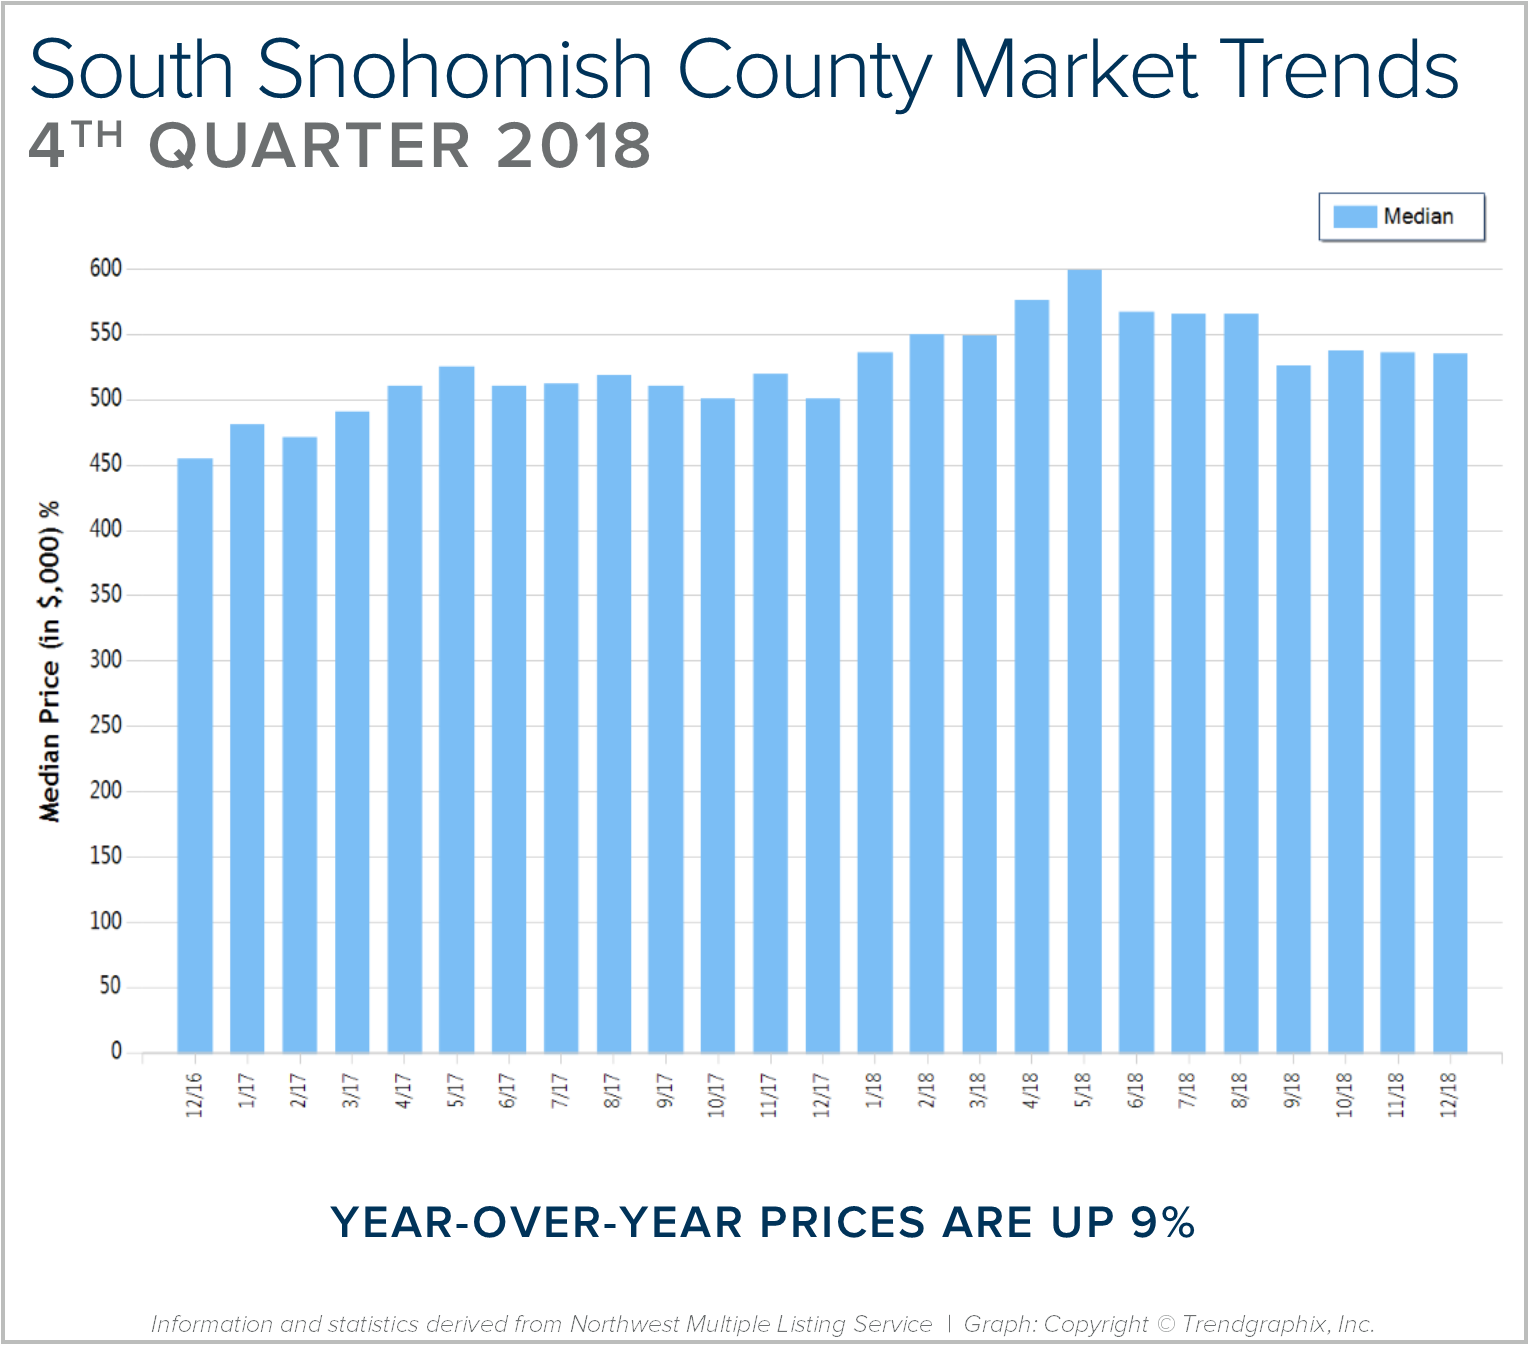
Quarterly Reports: Q4 South Snohomish County
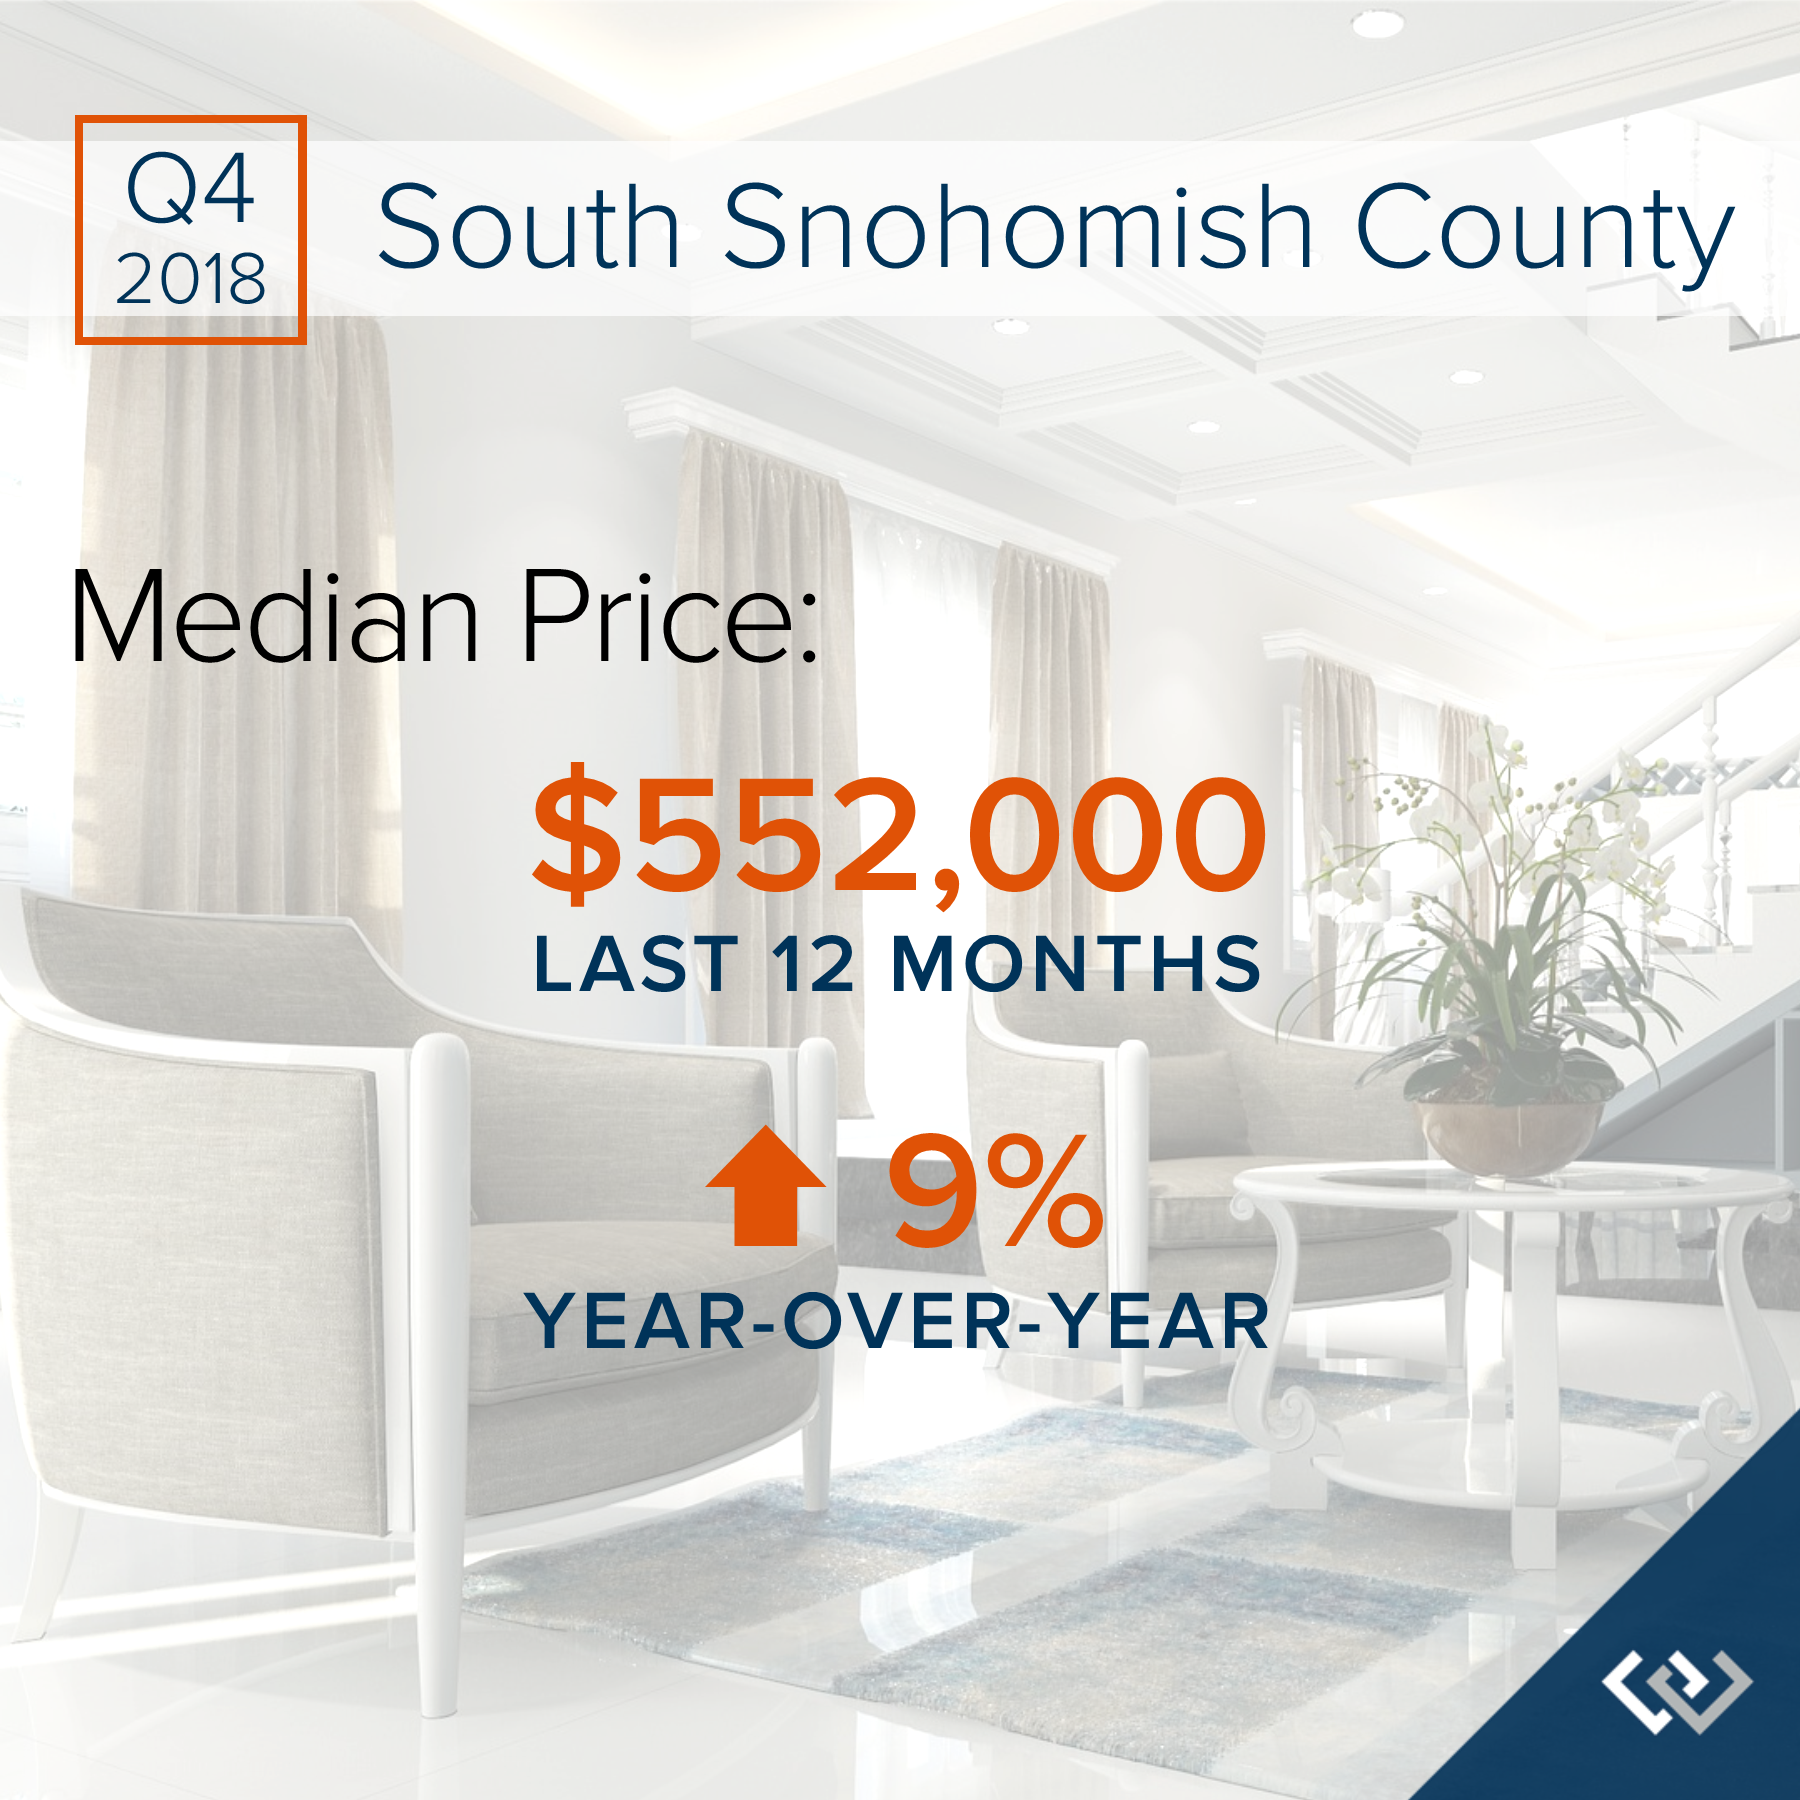
Q4: October 1 – December 31, 2018
SOUTH SNOHOMISH COUNTY: 2018 was a year of change and growth. The market shifted from an extreme seller’s market, but still had strong gains. Year-over-year, median price is up 9% and since 2012 has increased 85%! Over the last 19 years, the average year-over-year price increase has been 6%. This puts into perspective the growth we have experienced, resulting in well-established equity levels. In 2018, inventory averaged 1.5 months, double that of 2017. This caused the month-over-month price gains to slow, and we experienced a price correction over the second half of the year. We expect to see more average levels of price appreciation in 2019 as the market continues to balance out.
After six years of expansion resulting in an extreme seller’s market, in 2018 we encountered a market shift in the late spring. Inventory increased, interest rates took a jump, and demand took a step back to re-evaluate the new playing field. This resulted in a tempering of month-over-month price appreciation, and has established some long-awaited balance. This balance has brought opportunities for both buyers and sellers. Buyers have more selection and are negotiating terms like inspection items and concessions. Sellers are sitting on 6+ years of equity growth, and are now able to sell their home and make a move without fearing where they will land next. Interest rates are still well below the 30-year average, currently hovering just under 5%. We are seeing demand start to re-engage now that the new normal has settled in.
This is only a snapshot of the trends in south Snohomish County; please contact us if you would like further explanation of how the latest trends relate to you.
Quarterly Reports: Q3 South Snohomish
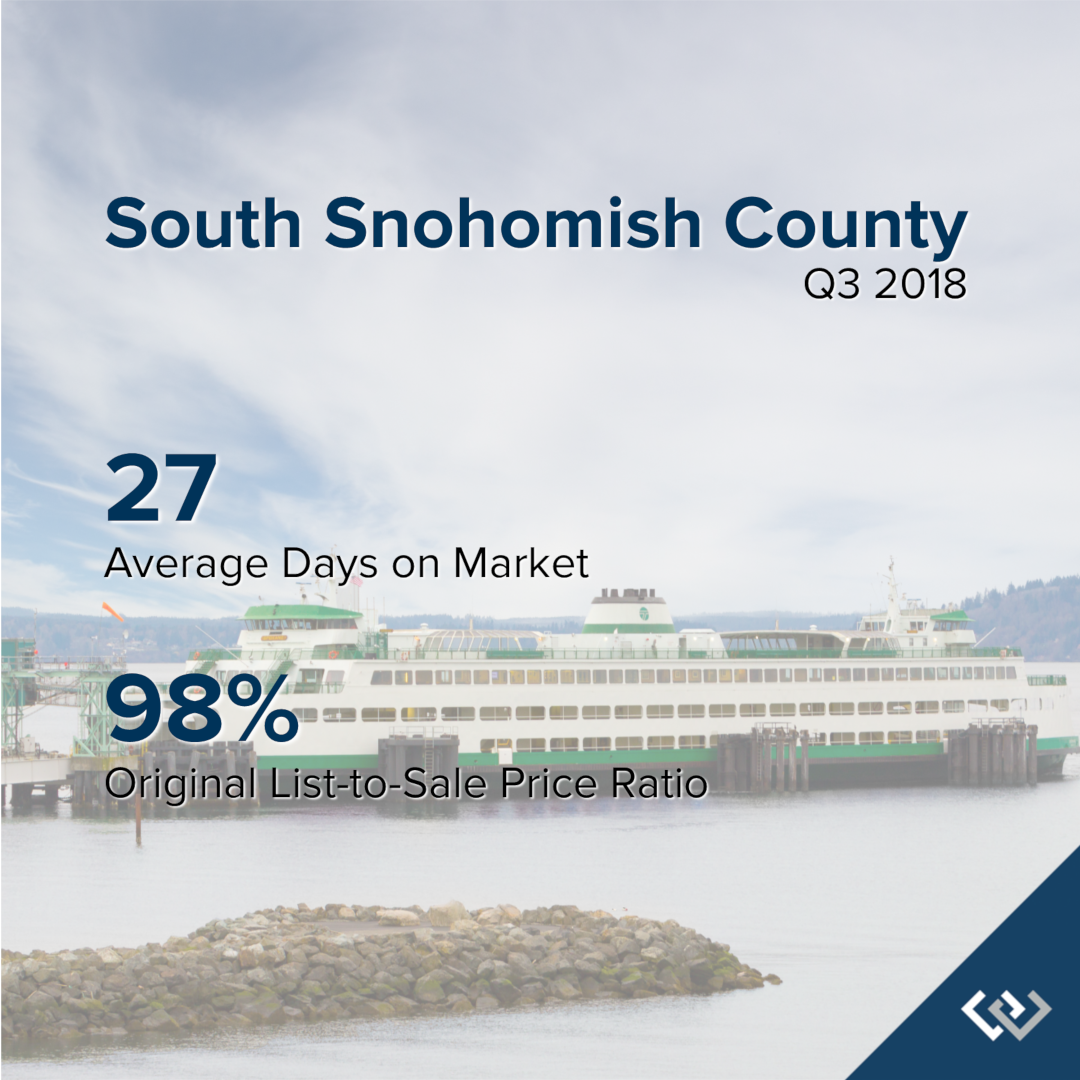
Q3: July 1 – September 30, 2018
SOUTH SNOHOMISH COUNTY: In September, the average days on market landed at 27 days and the original list-to-sale price ratio 98%. Since May, inventory growth has been noticeable, and has given buyers more options. This has led to more negotiations and fewer bidding wars, which is tempering month-over-month price growth to a more sustainable level.
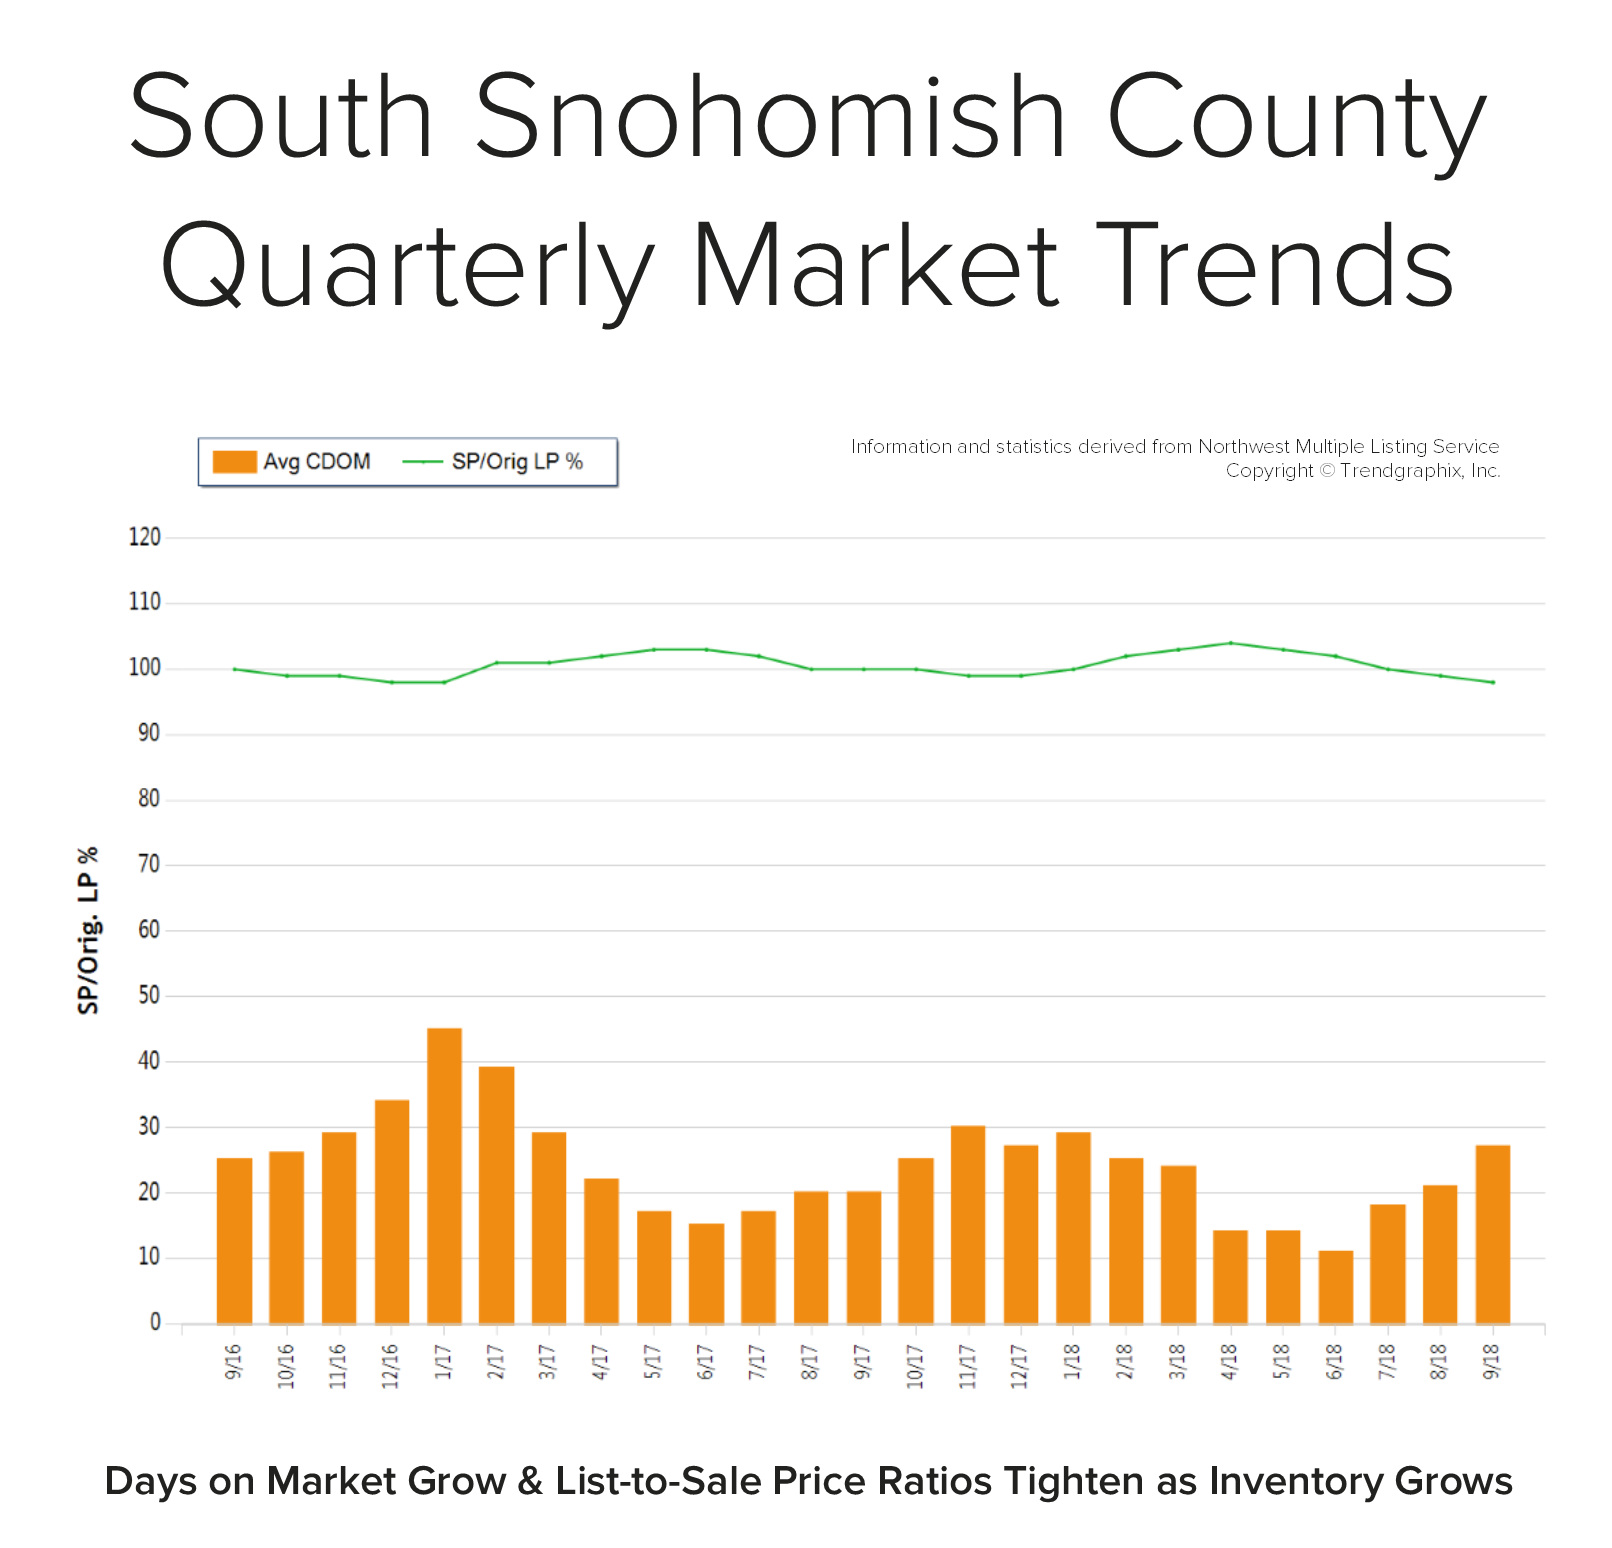 Back in April, the average days on market was 14 days and the original list-to-sale price ratio 104%; but months of inventory based on pending sales was 0.8 months, compared to 2.5 months currently. Year-over-year, prices are up 11%, still well above the historical norm of 3%-5% year-over-year gains—but note that the majority of this growth happened during the spring, due to constricted inventory levels.
Supply has increased, creating more options for buyers and helping to buffer affordability issues. Many sellers are deciding to make moves and cash in on the equity gained over the last six years. An average original list-to-sale price ratio of 98% is a positive return, yet illustrates a softening in the market after some very extreme times. With 11% price growth over the last 12-months in a seller’s favor, the increase in selection has led to more nimble moves from one house to another. Where sellers need to be careful is anticipating the month-over-month price growth we saw prior to the shift in inventory. Prospective buyers would be smart to take advantage of today’s historically low interest rates and the added inventory selection.
This is only a snapshot of the trends in south Snohomish County; please contact us if you would like further explanation of how the latest trends relate to you.
Quarterly Reports: Q3 North King
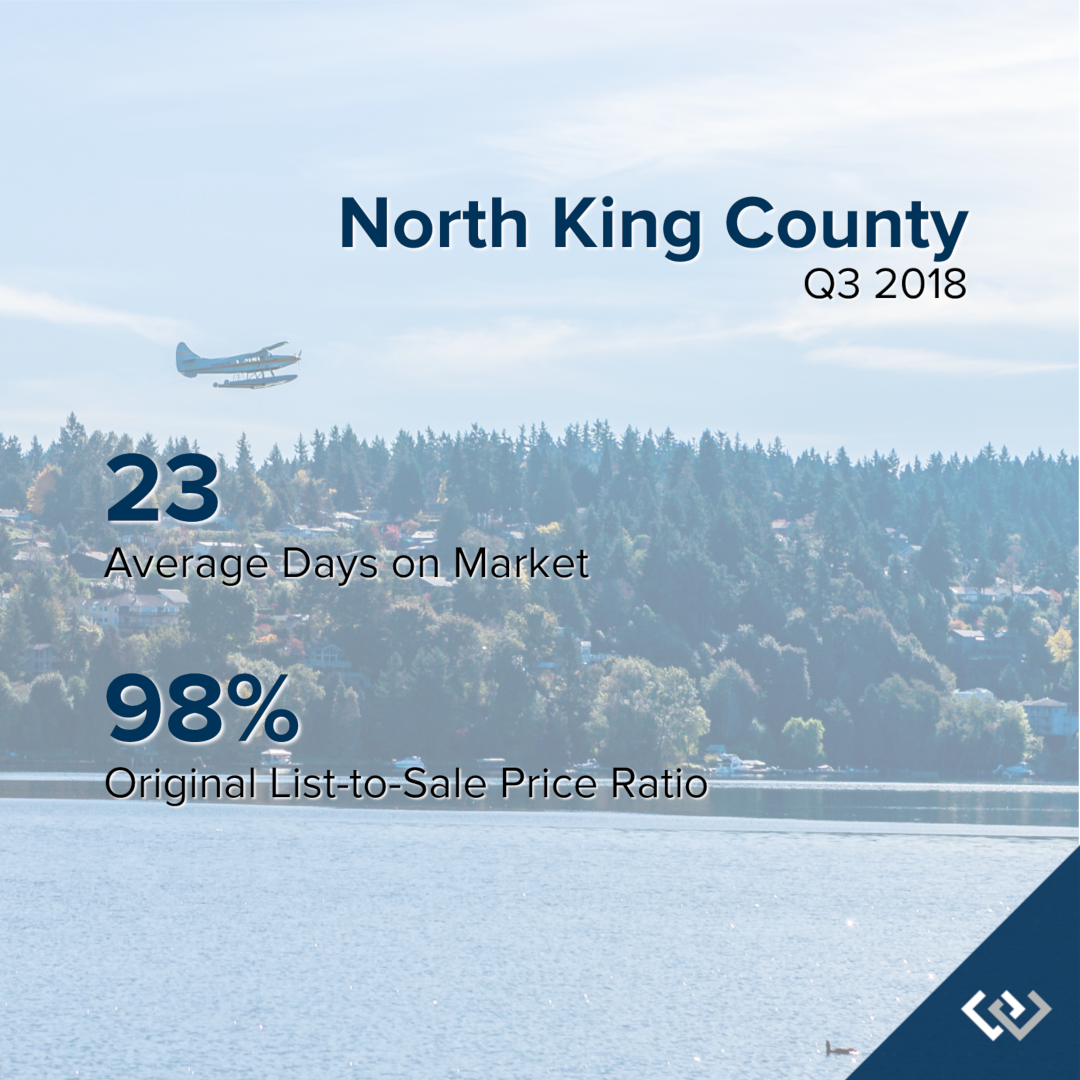
Q3: July 1 – September 30, 2018
NORTH KING COUNTY: In September, the average days on market landed at 23 days and the original list-to-sale price ratio 98%. Since May, inventory growth has been noticeable, and has given buyers more options. This has led to more negotiations and fewer bidding wars, which is tempering month-over-month price growth to a more sustainable level.
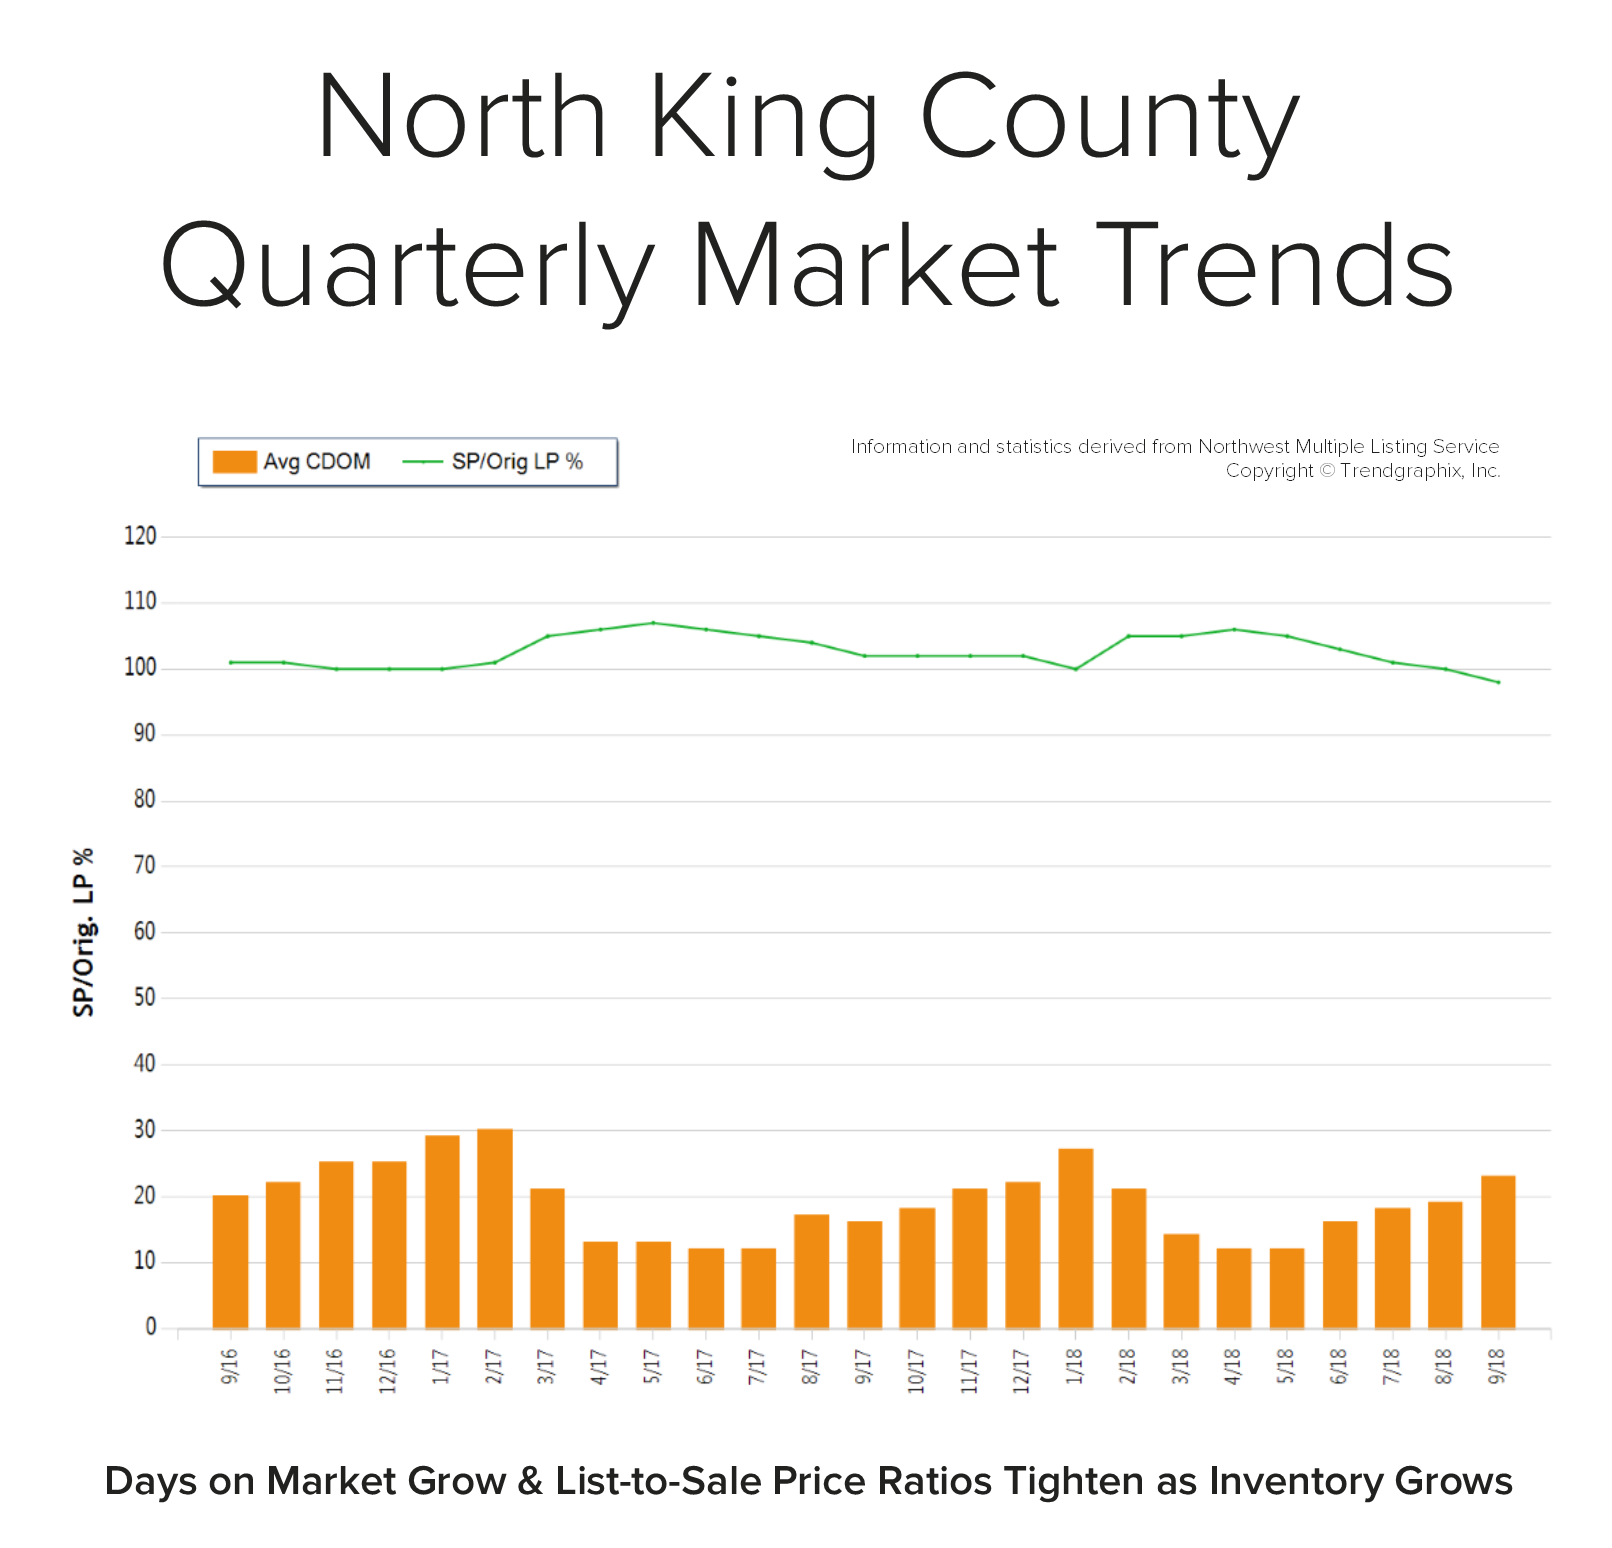 Back in April, the average days on market was 12 days and the original list-to-sale price ratio 106%; but months of inventory based on pending sales was 0.8 months, compared to 2.2 months currently. Year-over-year, prices are up 10%, still well above the historical norm of 3%-5% year-over-year gains—but note that the majority of this growth happened during the spring, due to constricted inventory levels.
Supply has increased, creating more options for buyers and helping to buffer affordability issues. Many sellers are deciding to make moves and cash in on the equity gained over the last six years. An average original list-to-sale price ratio of 98% is a positive return, yet illustrates a softening in the market after some very extreme times. With 10% price growth over the last 12-months in a seller’s favor, the increase in selection has led to more nimble moves from one house to another. Where sellers need to be careful is anticipating the month-over-month price growth we saw prior to the shift in inventory. Prospective buyers would be smart to take advantage of today’s historically low interest rates and the added inventory selection.
This is only a snapshot of the trends in north King County; please contact us if you would like further explanation of how the latest trends relate to you.
Quarterly Reports: Q3 Eastside
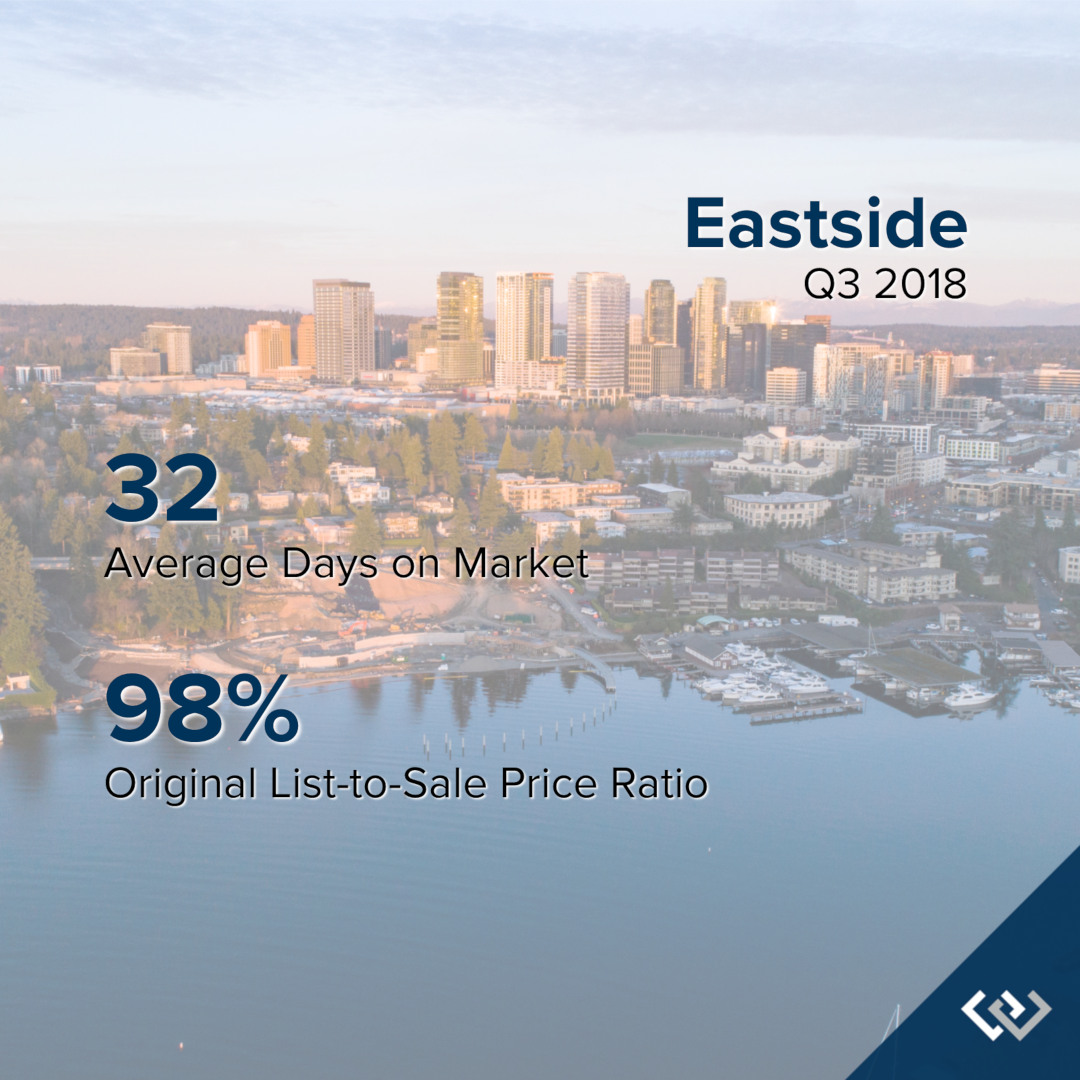
Q3: July 1 – September 30, 2018
THE EASTSIDE: In September, the average days on market landed at 32 days and the original list-to-sale price ratio 98%. Since May, inventory growth has been noticeable, and has given buyers more options. This has led to more negotiations and fewer bidding wars, which is tempering month-over-month price growth to a more sustainable level.
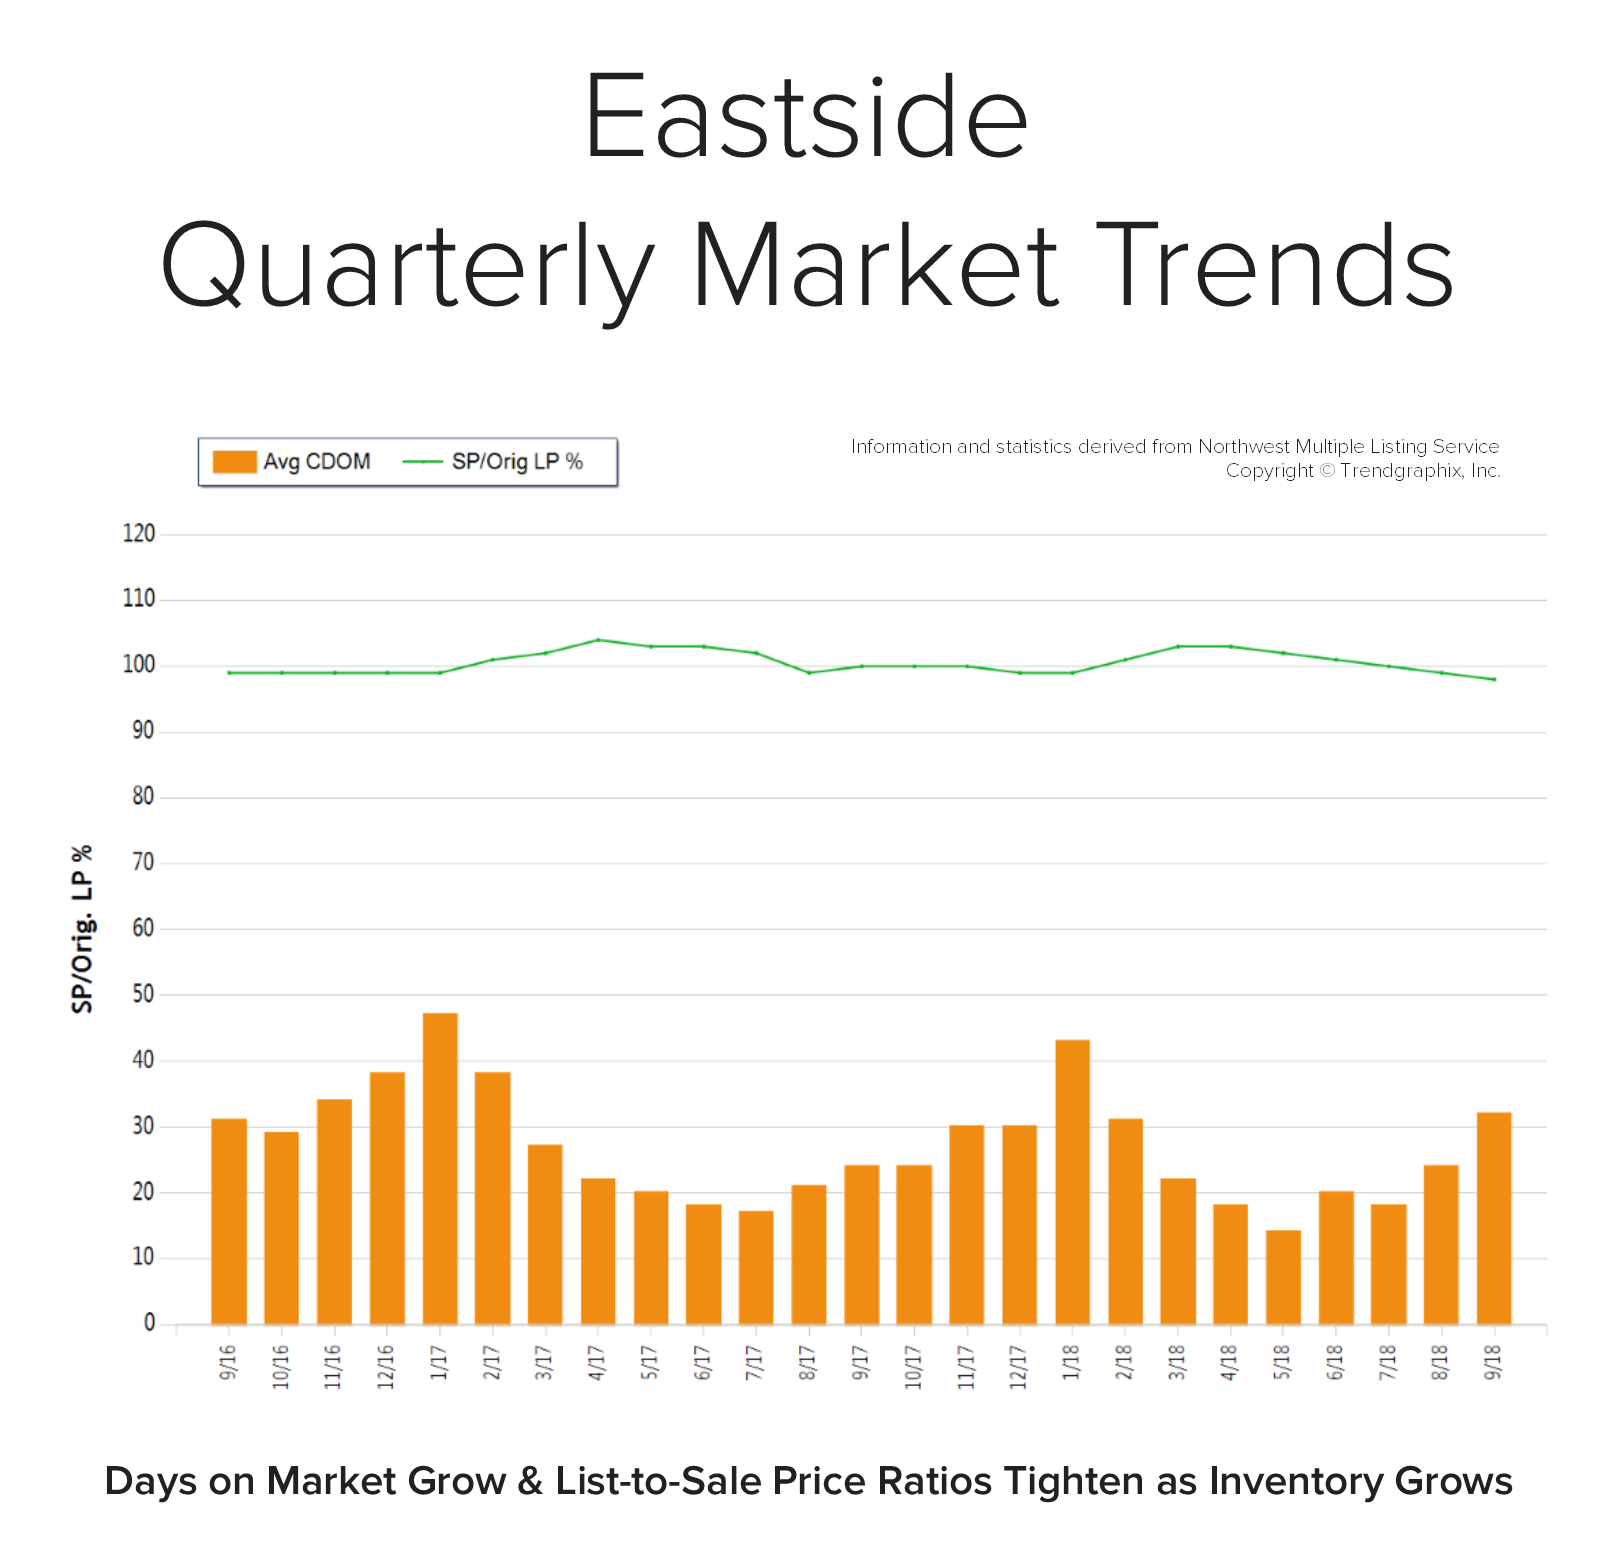 Back in April, the average days on market was 13 days and the original list-to-sale price ratio 103%; but months of inventory based on pending sales was 0.8 months, compared to 2.9 months currently. Year-over-year, prices are up 10%, still well above the historical norm of 3%-5% year-over-year gains—but note that the majority of this growth happened during the spring, due to constricted inventory levels.
Supply has increased, creating more options for buyers and helping to buffer affordability issues. Many sellers are deciding to make moves and cash in on the equity gained over the last six years. An average original list-to-sale price ratio of 98% is a positive return, yet illustrates a softening in the market after some very extreme times. With 10% price growth over the last 12-months in a seller’s favor, the increase in selection has led to more nimble moves from one house to another. Where sellers need to be careful is anticipating the month-over-month price growth we saw prior to the shift in inventory. Prospective buyers would be smart to take advantage of today’s historically low interest rates and the added inventory selection.
This is only a snapshot of the trends on the Eastside; please contact us if you would like further explanation of how the latest trends relate to you.
Quarterly Reports: Q3 North Snohomish
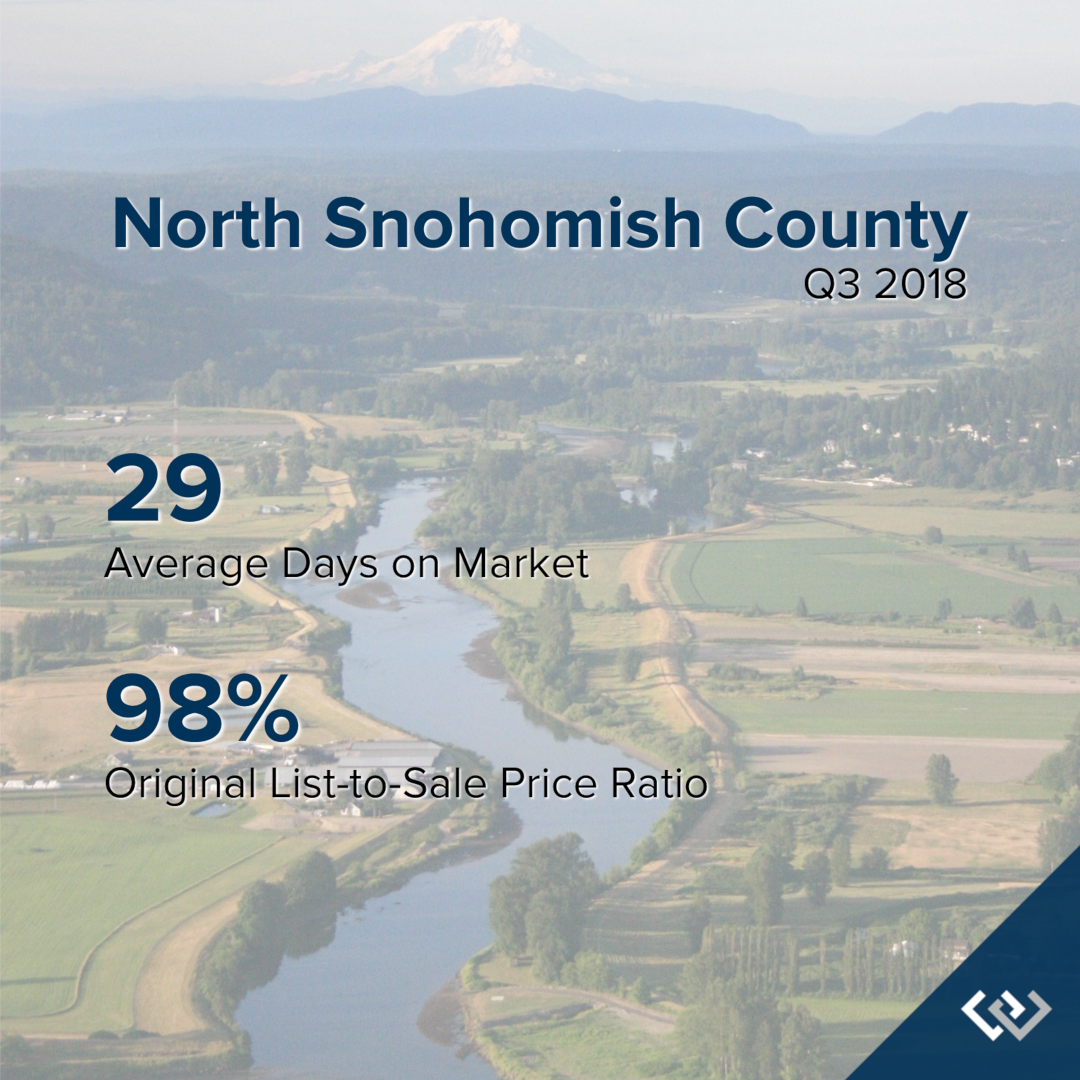
Q3: July 1 – September 30, 2018
NORTH SNOHOMISH COUNTY: In September, the average days on market landed at 29 days and the original list-to-sale price ratio at 98%. Since May, inventory growth has been noticeable, and has given buyers more options. This has led to more negotiations and fewer bidding wars, which is tempering month-over-month price growth to a more sustainable level.
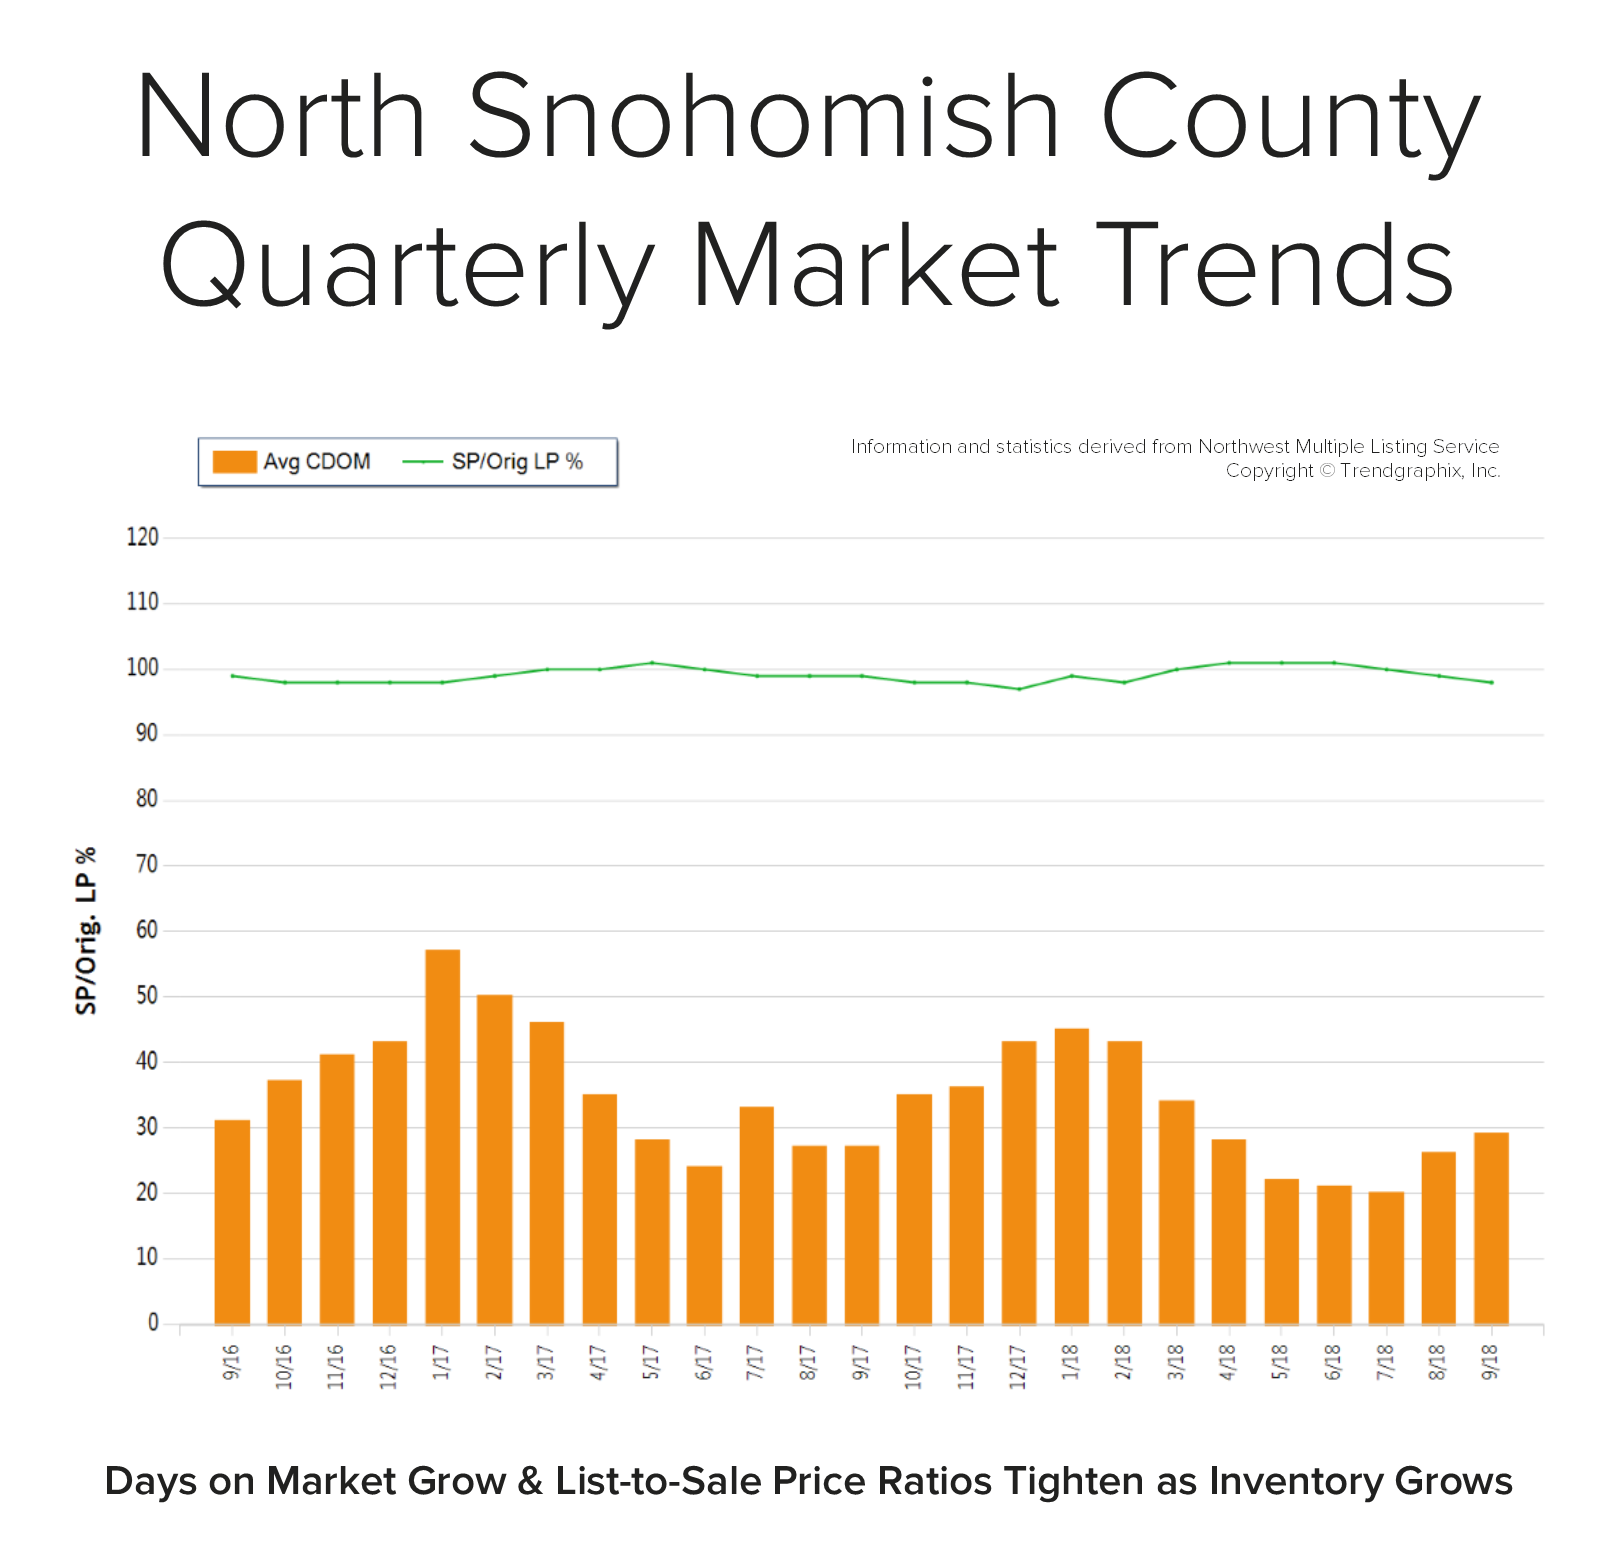 Back in May, the average days on market was 22 days and the original list-to-sale price ratio 101%; but months of inventory based on pending sales was 1 month compared to 2.3 months currently. Year-over-year, prices are up 11%, still well above the historical norm of 3%-5% year-over-year gains—but note that the majority of this growth happened during the spring, due to constricted inventory levels.
Supply has increased, creating more options for buyers and helping to buffer affordability issues. Many sellers are deciding to make moves and cash in on the equity gained over the last six years. An average original list-to-sale price ratio of 98% is a positive return, yet illustrates a softening in the market after some very extreme times. With 11% price growth over the last 12-months in a seller’s favor, the increase in selection has led to more nimble moves from one house to another. Where sellers need to be careful is anticipating the month-over-month price growth we saw prior to the shift in inventory. Prospective buyers would be smart to take advantage of today’s historically low interest rates and the added inventory selection.
This is only a snapshot of the trends in north Snohomish County; please contact me if you would like further explanation of how the latest trends relate to you.
Quarterly Reports: Q3 South King County
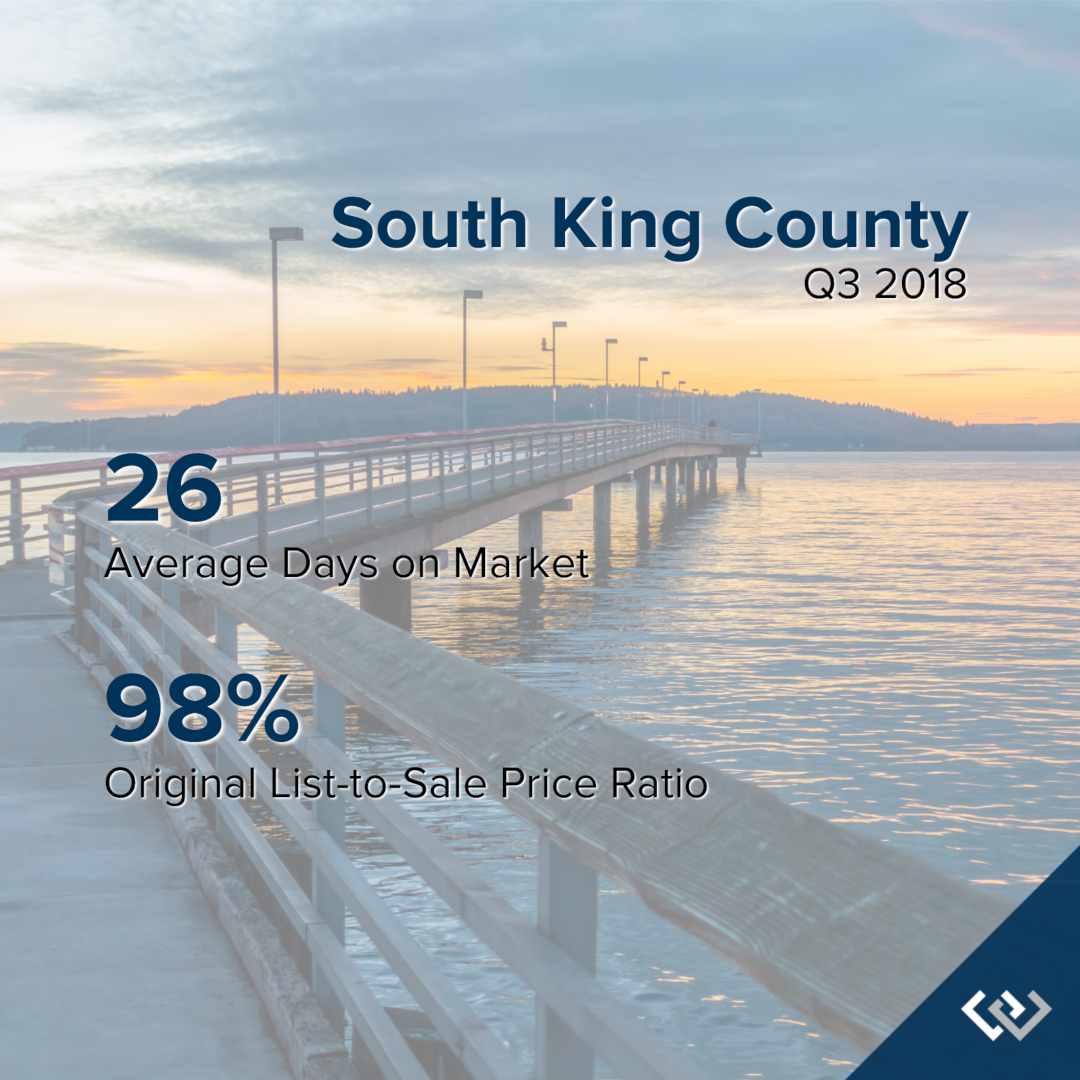
Q3: July 1 – September 30, 2018
SOUTH KING COUNTY: In September, the average days on market landed at 26 days and the original list-to-sale price ratio 98%. Since May, inventory growth has been noticeable, and has given buyers more options. This has led to more negotiations and fewer bidding wars, which is tempering month-over-month price growth to a more sustainable level.
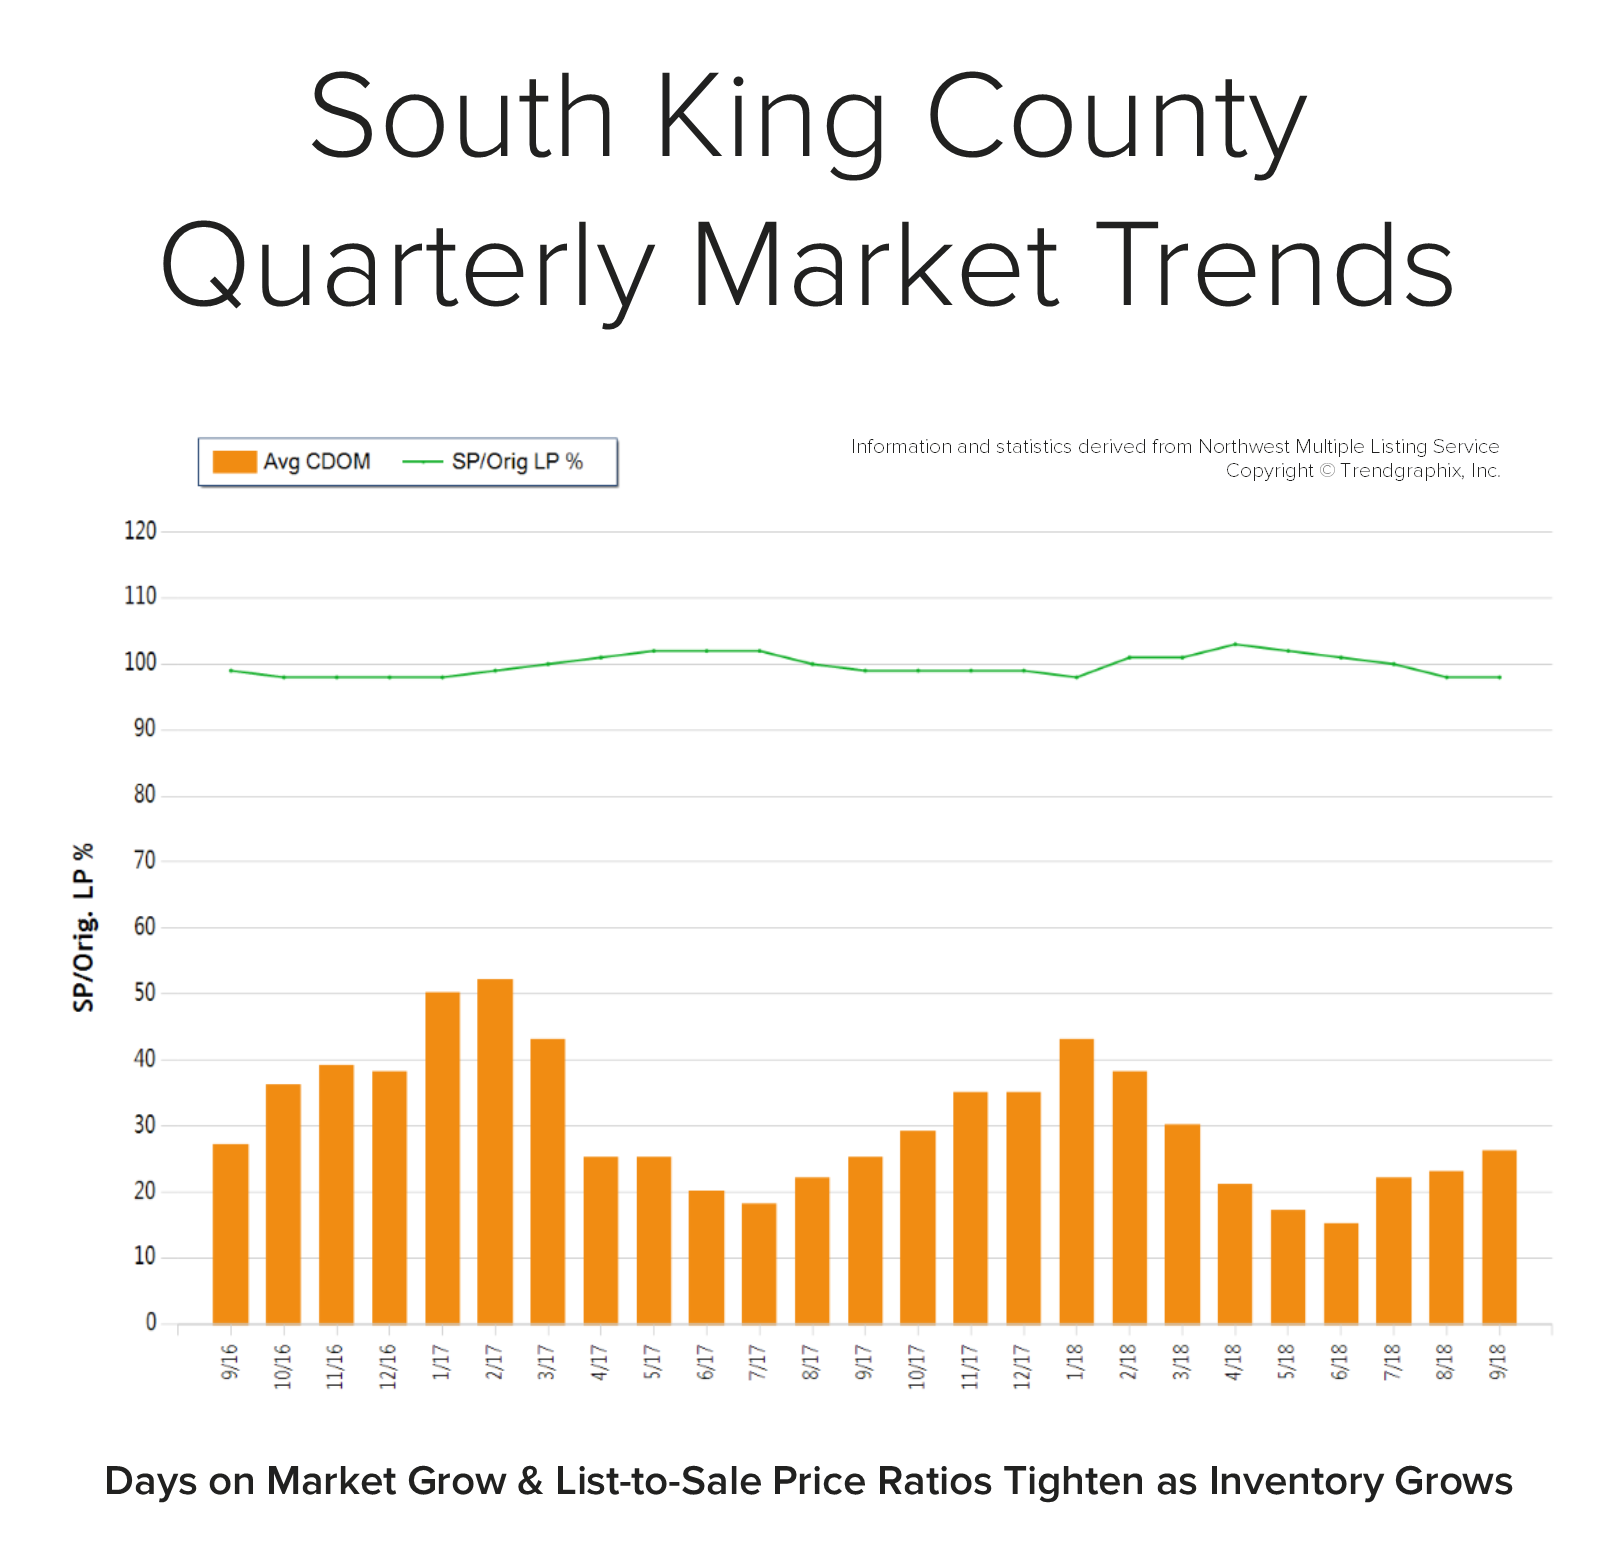 Back in April, the average days on market was 21 days and the original list-to-sale price ratio 103%; but months of inventory based on pending sales was 0.9 months, compared to 2.6 months currently. Year-over-year, prices are up 10%, still well above the historical norm of 3%-5% year-over-year gains—but note that the majority of this growth happened during the spring, due to constricted inventory levels.
Supply has increased, creating more options for buyers and helping to buffer affordability issues. Many sellers are deciding to make moves and cash in on the equity gained over the last six years. An average original list-to-sale price ratio of 98% is a positive return, yet illustrates a softening in the market after some very extreme times. With 10% price growth over the last 12-months in a seller’s favor, the increase in selection has led to more nimble moves from one house to another. Where sellers need to be careful is anticipating the month-over-month price growth we saw prior to the shift in inventory. Prospective buyers would be smart to take advantage of today’s historically low interest rates and the added inventory selection.
This is only a snapshot of the trends in south King County; please contact us if you would like further explanation of how the latest trends relate to you.
The Windermere Foundation Partners with Pearl Jam & Seahawks

 August 8th-10th will be an exciting time in Seattle. Pearl Jam, Seattle’s own original grunge band will be hosting two shows at Safeco Field on August 8th and 10th, and the Seattle Seahawks kick off their preseason schedule at Century Link on August 9th. Besides providing great entertainment for music and football fans, both of these events will give back to the community.
The two Pearl Jam shows have been coined The Home Shows as Seattle is Pearl Jam’s home town; but more importantly, proceeds from both shows will be donated to organizations such as Mary’s Place, the YMCA and The Mockingbird Society to help fight homelessness. These organizations have programs in place that are helping to improve the homeless crisis in our city. The Windermere Foundation has partnered with Pearl Jam and their Vitalogy Foundation and joined other organizations such as Alaska Airlines, Nordstrom, Tom Douglas, and The Bill and Melinda Gates Foundation to help sponsor these two benefit shows.
The Windermere Foundation has always been rooted in working towards overcoming homelessness and helping families and children get back on their feet. The Home Shows aligned with the Windermere Foundation’s mission, making it a natural fit for this partnership. Check out this video of Mike McCready, Pearl Jam’s guitarist serenading Windermere for our partnership.
On August 9th, the Seattle Seahawks kick off their pre-season schedule which also kicks off the Windermere Foundation’s third year of partnering with the Seattle Seahawks to Tackle Homelessness. For every defensive tackle that takes place at a regular season home game, the Windermere Foundation will donate $100 towards Youth Care, an organization that helps youth struggling with homelessness or transitional living.
Thanks to the generosity of Windermere agents, staff, franchise owners, and the community, the Windermere Foundation has proudly donated a total of $920,351 so far this year to non-profit organizations that provide services to low-income and homeless families. This brings the total amount of money that the Windermere Foundation has raised since 1989 to over $36 million.
Each Windermere office has its own Windermere Foundation fund account that they use to make donations to organizations in their local communities. Our office recently sent 24 low-income children to YMCA’s Camp Orkila and Camp Colman with funds that we raised. These kids will enjoy a life changing week of summer camp, meeting new friends and experiencing the outdoors. These experiences would not be possible without the support of our clients. For each transaction that Windermere closes, the Windermere agent involved donates a portion of their commission to the Windermere Foundation. Thank you for your support of our business; it helps make the Windermere Foundation possible!
What’s in Your Toolbox to Navigate the Changing Market?


The late spring market brought about some welcomed change to our local real estate markets. In May, we experienced the largest increase in inventory in a decade! North King County and South Snohomish County are two examples of what is happening in all the markets across the Puget Sound as we head into the second half of 2018. Below is a breakdown of the current environment; further is an explanation of what it all means.
North King County (Ship Canal to Snohomish County Line):
- 38% increase in new listings from April to May 2018
- 16% more new listings in May 2018 vs. May 2017
- Overall 5% more new listings over the last 12 months vs. the previous 12 months
- Average list-to-sale price ratios reduce to 104% from 105% in May 2018
- Median Price up 15% complete year over year, but down 1% vs. the previous month, landing at $815K.
South Snohomish County (Snohomish County Line to Everett):
- 27% increase in new listings from April to May 2018
- 10% more new listings in May 2018 vs. May 2017
- Overall 2% more new listings over the last 12 months vs. the previous 12 months
- Average list-to-sale price ratios reduce to 102% from 103% in May 2018
- Median price up 12% complete year over year, but equal with the previous month, landing at $500K.
This increase in inventory is awesome! It is providing more selection for buyers and is helping temper price growth, which was increasing at an unsustainable level. It is still a Seller’s market by all means, which is defined by having three or less months of available inventory. Both market areas are still just under one month of inventory based on pending sales, but not as low as the two-week mark they were experiencing in March.
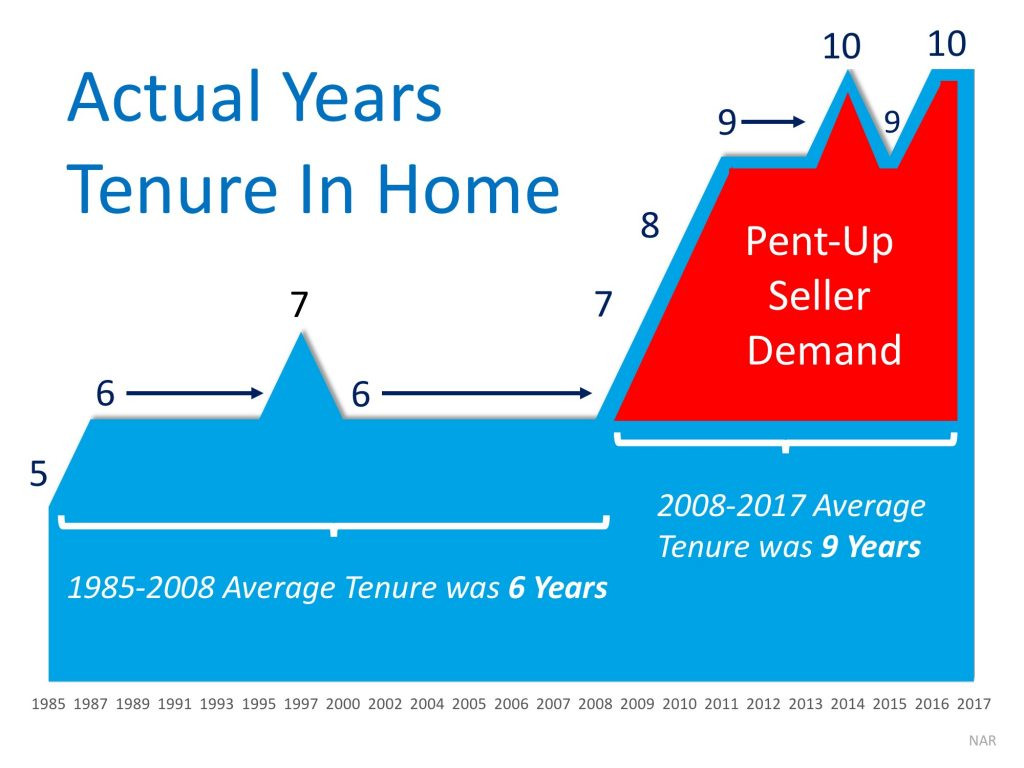
The increase in inventory is the result of pent up seller demand. From 1985-2008 the average amount of time a homeowner stayed in their home was 6 years. From 2008-2017 it grew to 9 years. With a resounding amount of equity under their belts, many homeowners are now deciding to make moves. Some are moving up to the next best thing and others are cashing out and leaving the area for a new beginning or retirement. This is providing buyers with the selection they have been waiting for after a very tenuous, inventory-starved start to 2018. The buyers that have stayed on the forefront of the market are now being rewarded with choices. These choices are best accompanied with keen discernment in order to craft the best negotiations – the broker they choose to align with is key.
The price analysis above indicates strong equity positions for sellers, but also a leveling off in price growth. Over the first quarter we saw prices increase month-over-month quite handily; now that more inventory is appearing and demand is being absorbed, price growth is not as extreme. This has highlighted the importance of having a strategic pricing and marketing plan for sellers wanting the highest price and shortest market time. The broker they choose to align with is key.
The importance of both buyers and sellers aligning with a knowledgeable, well-researched and responsive broker is paramount. One might think that it is “easy” to sell a house in this market, but the pricing research, home preparation, market exposure, varied marketing mediums, close management of all the communication, and how negotiations are handled can make or break a seller’s net return on the sale. With market times increasing, having a broker with a tight grasp on the changing environment will help create an efficient market time, resulting in the best price and terms for a successful closing. It is important that sellers do not overshoot this market, and it takes a broker with a keen gut sense rooted in in-depth research to help get them their desired results.
If you’re a buyer, it is overwhelmingly important that you are aligned with a broker that knows how to win in this market. The increase in selection has left some room for contemplation in some cases. Considering possible terms and price based on thorough market research as you head into negotiations are what set a highly capable selling broker apart and are required to prevail. With more selection coming to market, buyers have more to consider, and having a broker alongside them to help craft a strategy of negotiations will ensure they don’t overpay.
If you have any curiosities or questions regarding the value of your current home or purchase opportunities in today’s market, please contact us. It is our goal to help keep you informed and empower strong decisions.
A Tale of Two First-Time Home Buyers


Have you had dreams of owning a home or know someone that does? Jumping into the market as a first-time home buyer can be intimidating, especially within the wild ride of the Greater Seattle market; but there is hope! In an effort to illustrate the reality for first-time buyers in today’s market, our office got together and identified several sets of buyers who recently found success in today’s market and asked them to share their stories. We think this is timely because it is the time of year that we see a surge in inventory, which gives buyers more selection and opportunity. We have two stories to share below, but before we dive into those let’s defy some first-time home buyer myths.
First, many people think it is necessary to have a 20% down payment saved in order to make their first purchase. That is simply not true. While a 20% down payment can help make you more competitive and naturally lowers your monthly payment, it is not the only option. There are loan programs with down payments as low as 3%. Nationally, in March the average down payment for all loans was 10%. For first-timers it was 6% and repeat buyers it was 14%.
Second, expectations around credit scores can use some clarification as well. In March, the average credit score for all loans was 722. For Conventional loans it was 742 and for FHA it was 677. If your credit needs some work, contact me and I can put you in touch with one of my preferred lenders that can help with credit repair. There is hope, as these numbers are just the average. You’d be surprised that you don’t have to have perfect credit to get the process started.
Lastly, the cost to be a renter is high, and the return on your investment is nothing. Recently, Rent.com did a survey of landlords and 88% said they planned to raise their rents in the next 12 months. In the same survey, 53% said they’d rather place a new tenant with a higher rent versus renegotiate and renew with a current tenant. This sounds expensive and unstable. Owning leads to building wealth and putting down permanent roots.
Now that we’ve gained some clarity on what it takes to qualify in today’s market, let’s jump into these two honest, yet heartwarming local first-time home buyer stories.
Three Teenagers, One Bathroom, No More
 A happy family of five just moved in to this house in mid-May. Two hard working parents, Brandy and Juan, with three teenagers were renting a 3-bedroom, 1-bath rambler in Edmonds and needed more space. It was time to make a move, and they had saved up a 3% down payment for a new home. Their budget was $400,000.
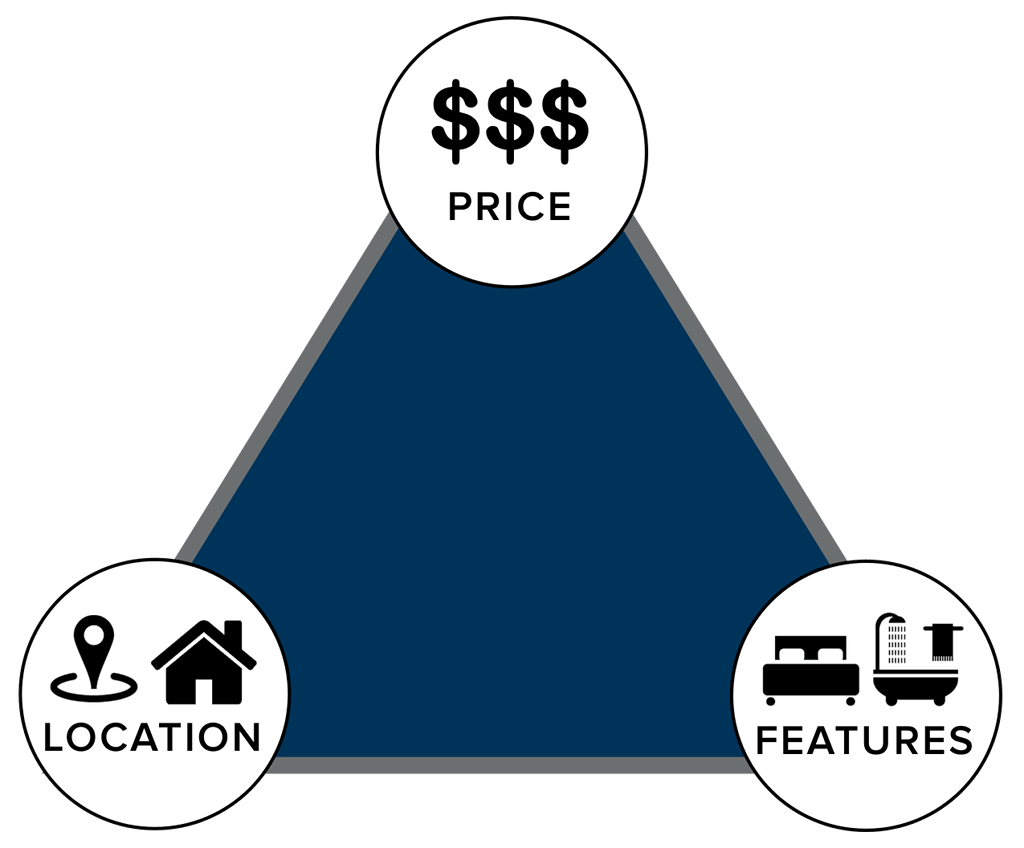 The first step in the home buying process was sitting down with their agent for the initial buyer consultation. This is where they discussed market conditions, desired features such as bedrooms, bathrooms and garage, and their budget. This lead them to explore which locations had the inventory that met their needs in order to stay within their budget. They had to marry these three key points – we like to call this the Triangle of Buyer Clarity. They then identified a few workable locations that had inventory which supported their desired features and their budget and went for it. This upfront research and partnership with their agent lead to Brandy and Juan finding success rather quickly, saving them money in an appreciating market, and a whole lot of strife.
They did this and ultimately bought a great house in Marysville which fit their budget, afforded them the features they desired, and still provided a manageable commute into Lynnwood. Their mortgage payment is higher than their rental rate, but is relative to the size of their new home and their investment. Not to mention, they are now on the equity-building train and don’t have to worry about a landlord displacing them. Their monthly mortgage payment is fixed with an awesome low interest rate, and they are super happy to have more than one bathroom for their teenagers.
From North Seattle to West Seattle
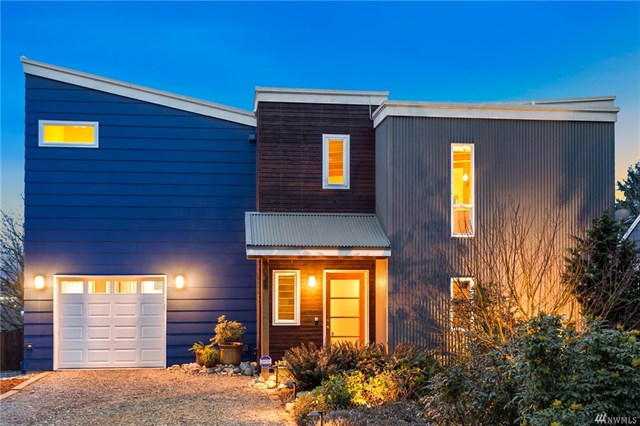 First, how cool is this house? Super cool! That’s just how Paul and Ange feel about their newly purchased home in the Highland Park neighborhood of West Seattle. They just closed in early April and have already attended two neighborhood BBQ’s, received gifts from their new neighbors, discovered new parks and restaurants and, wait for it…shortened their commute.
Paul described his new neighborhood, Highland Park, as “magical.” Previously, Paul and Ange were renting in Wedgwood for six years and loved it there. So much that they could not imagine living anywhere else. When they started their home search in late 2017, they kept to strict search criteria of North Seattle because that is what they knew and it was comfortable. After making two offers and not prevailing because they were getting beat out on price, their agent suggested West Seattle as a more affordable option. The ‘price’ corner of the Triangle of Buyer Clarity was making itself known as a challenge in North Seattle, so it was time to reconvene. They sat down with their agent and evaluated the market conditions in West Seattle compared to North Seattle and applied them to their feature list and budget, and voilà: West Seattle was calling their names. You see, they wanted a more turn-key home, and the homes they were encountering in their price range in North Seattle needed a lot of work.
They went out on a limb and traveled over the bridge to start looking at homes. They quickly saw the difference – the homes they were interested in were not, as Paul said, “scary”! The anticipated repairs they would have to make to the homes they were able to afford in North Seattle were daunting and unexciting. They felt much more at ease with the features that the West Seattle homes provided within their price range. They just needed to get comfortable with the idea of moving to a different community.
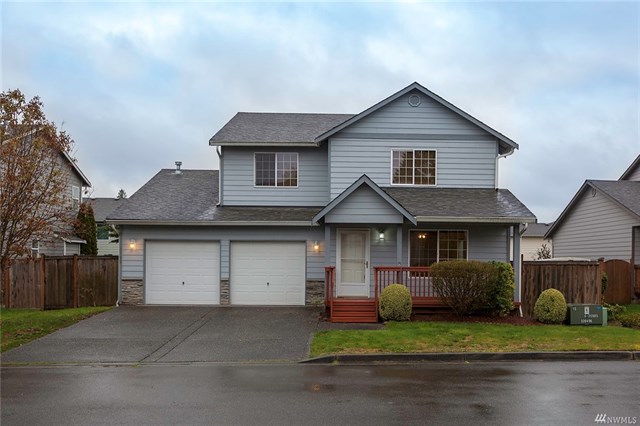
When they found the house featured above, the leap of faith to West Seattle started to take shape. They prepped a strong offer, did their due diligence, and believe it or not, secured the home in a multiple-offer situation at $805,000 – which was not the highest price offered! They listened to their agent and wrote an offer with very strong terms as well as a very well-researched price. Their agent kept in close contact with the listing agent and the Sellers chose their offer due to all of these factors.
Since moving in almost two months ago, they find themselves in a state of excitement and discovery every day. The community has been welcoming and conversations with neighbors and the random stranger at the grocery store come easily. Paul has observed a strong sense of curiosity within his new community as people are new to the area and are encouraged to build relationships and make discoveries.
In the end, Paul and Ange remained within their price range, bought a home with all the features they wanted, but made what seemed to be at the time, a compromise on location. That compromise ended up being, as they put it, magical! They have never looked back to Wegdwood with regret, only excitement over what their new neighborhood might bring.
![]() The point of these two stories is to debunk the sentiment we hear from time to time, that first-time home buyers cannot find success in our market. With a well-laid-out plan strategically constructed by the agent and client, we are seeing many happy stories for first-timers. The end result is putting these new homeowners on the path to building wealth, growing thriving communities, and making their house their home.
The point of these two stories is to debunk the sentiment we hear from time to time, that first-time home buyers cannot find success in our market. With a well-laid-out plan strategically constructed by the agent and client, we are seeing many happy stories for first-timers. The end result is putting these new homeowners on the path to building wealth, growing thriving communities, and making their house their home.
If you or someone you know has dreamed about buying their first home, please reach out. It is our goal to help identify the opportunities that are available, the strategies that find success, and to educate along the way.
