
 Facebook
 X
X
 Pinterest
 Copy Link
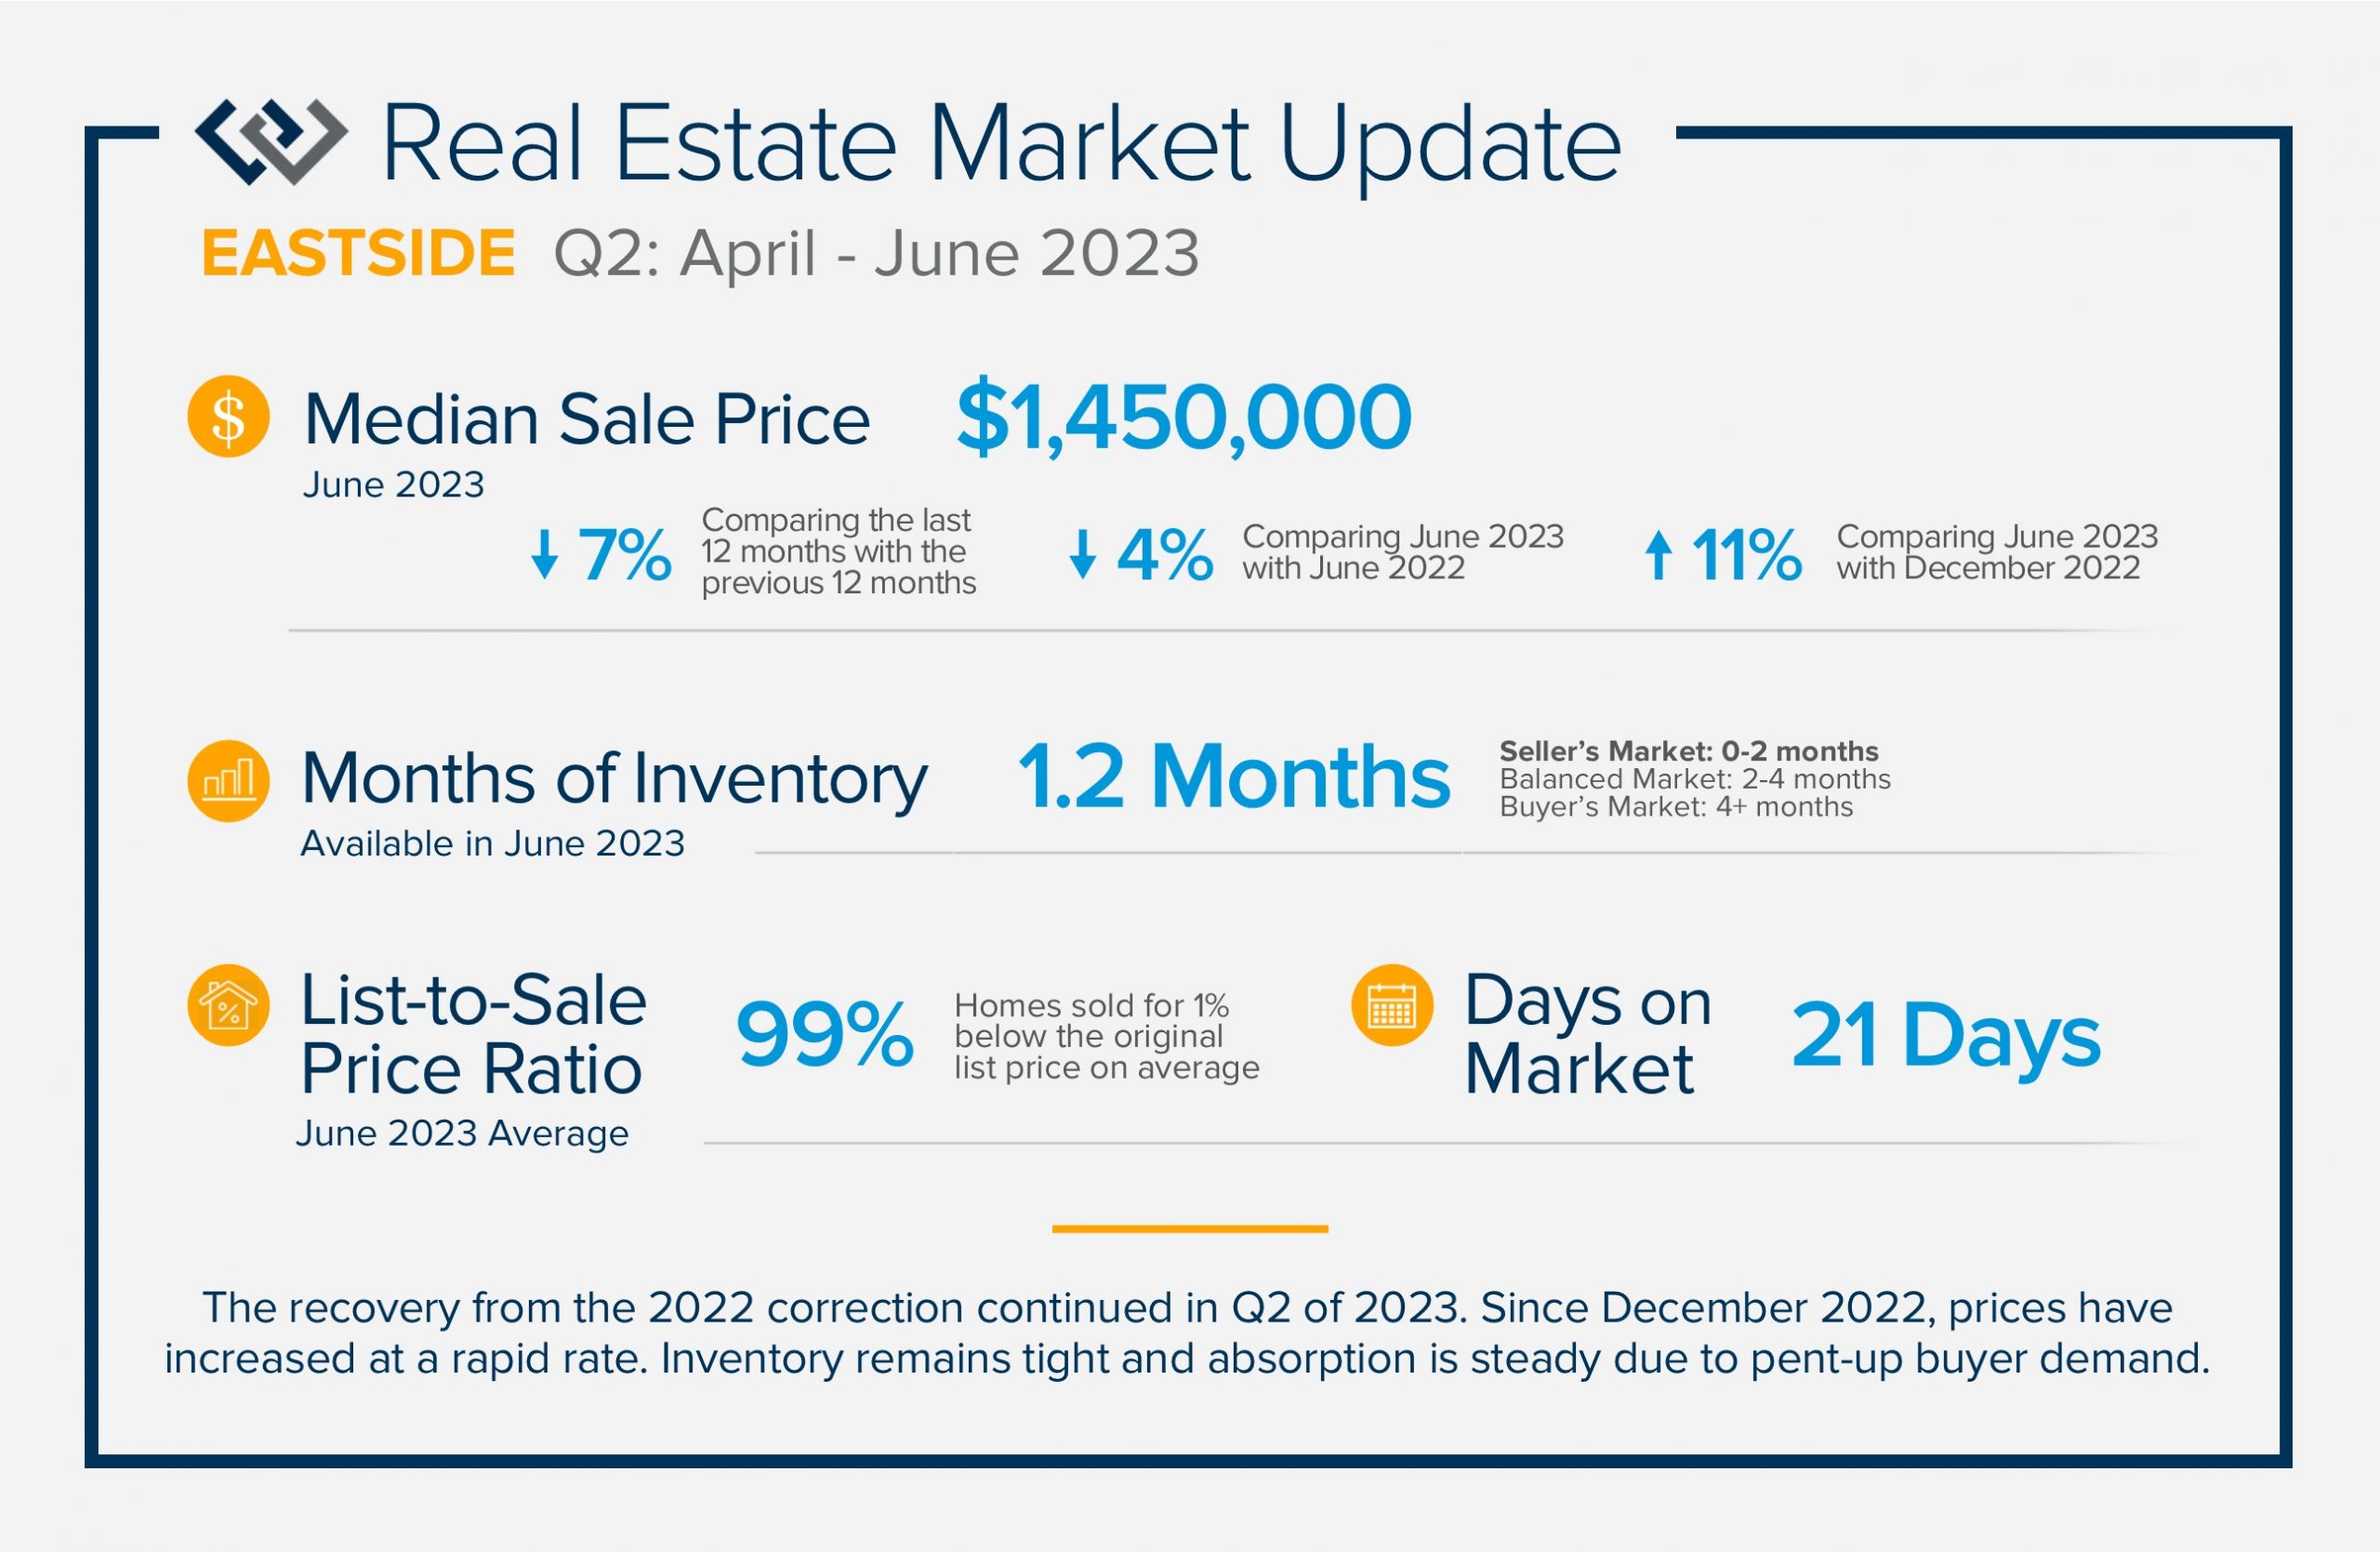
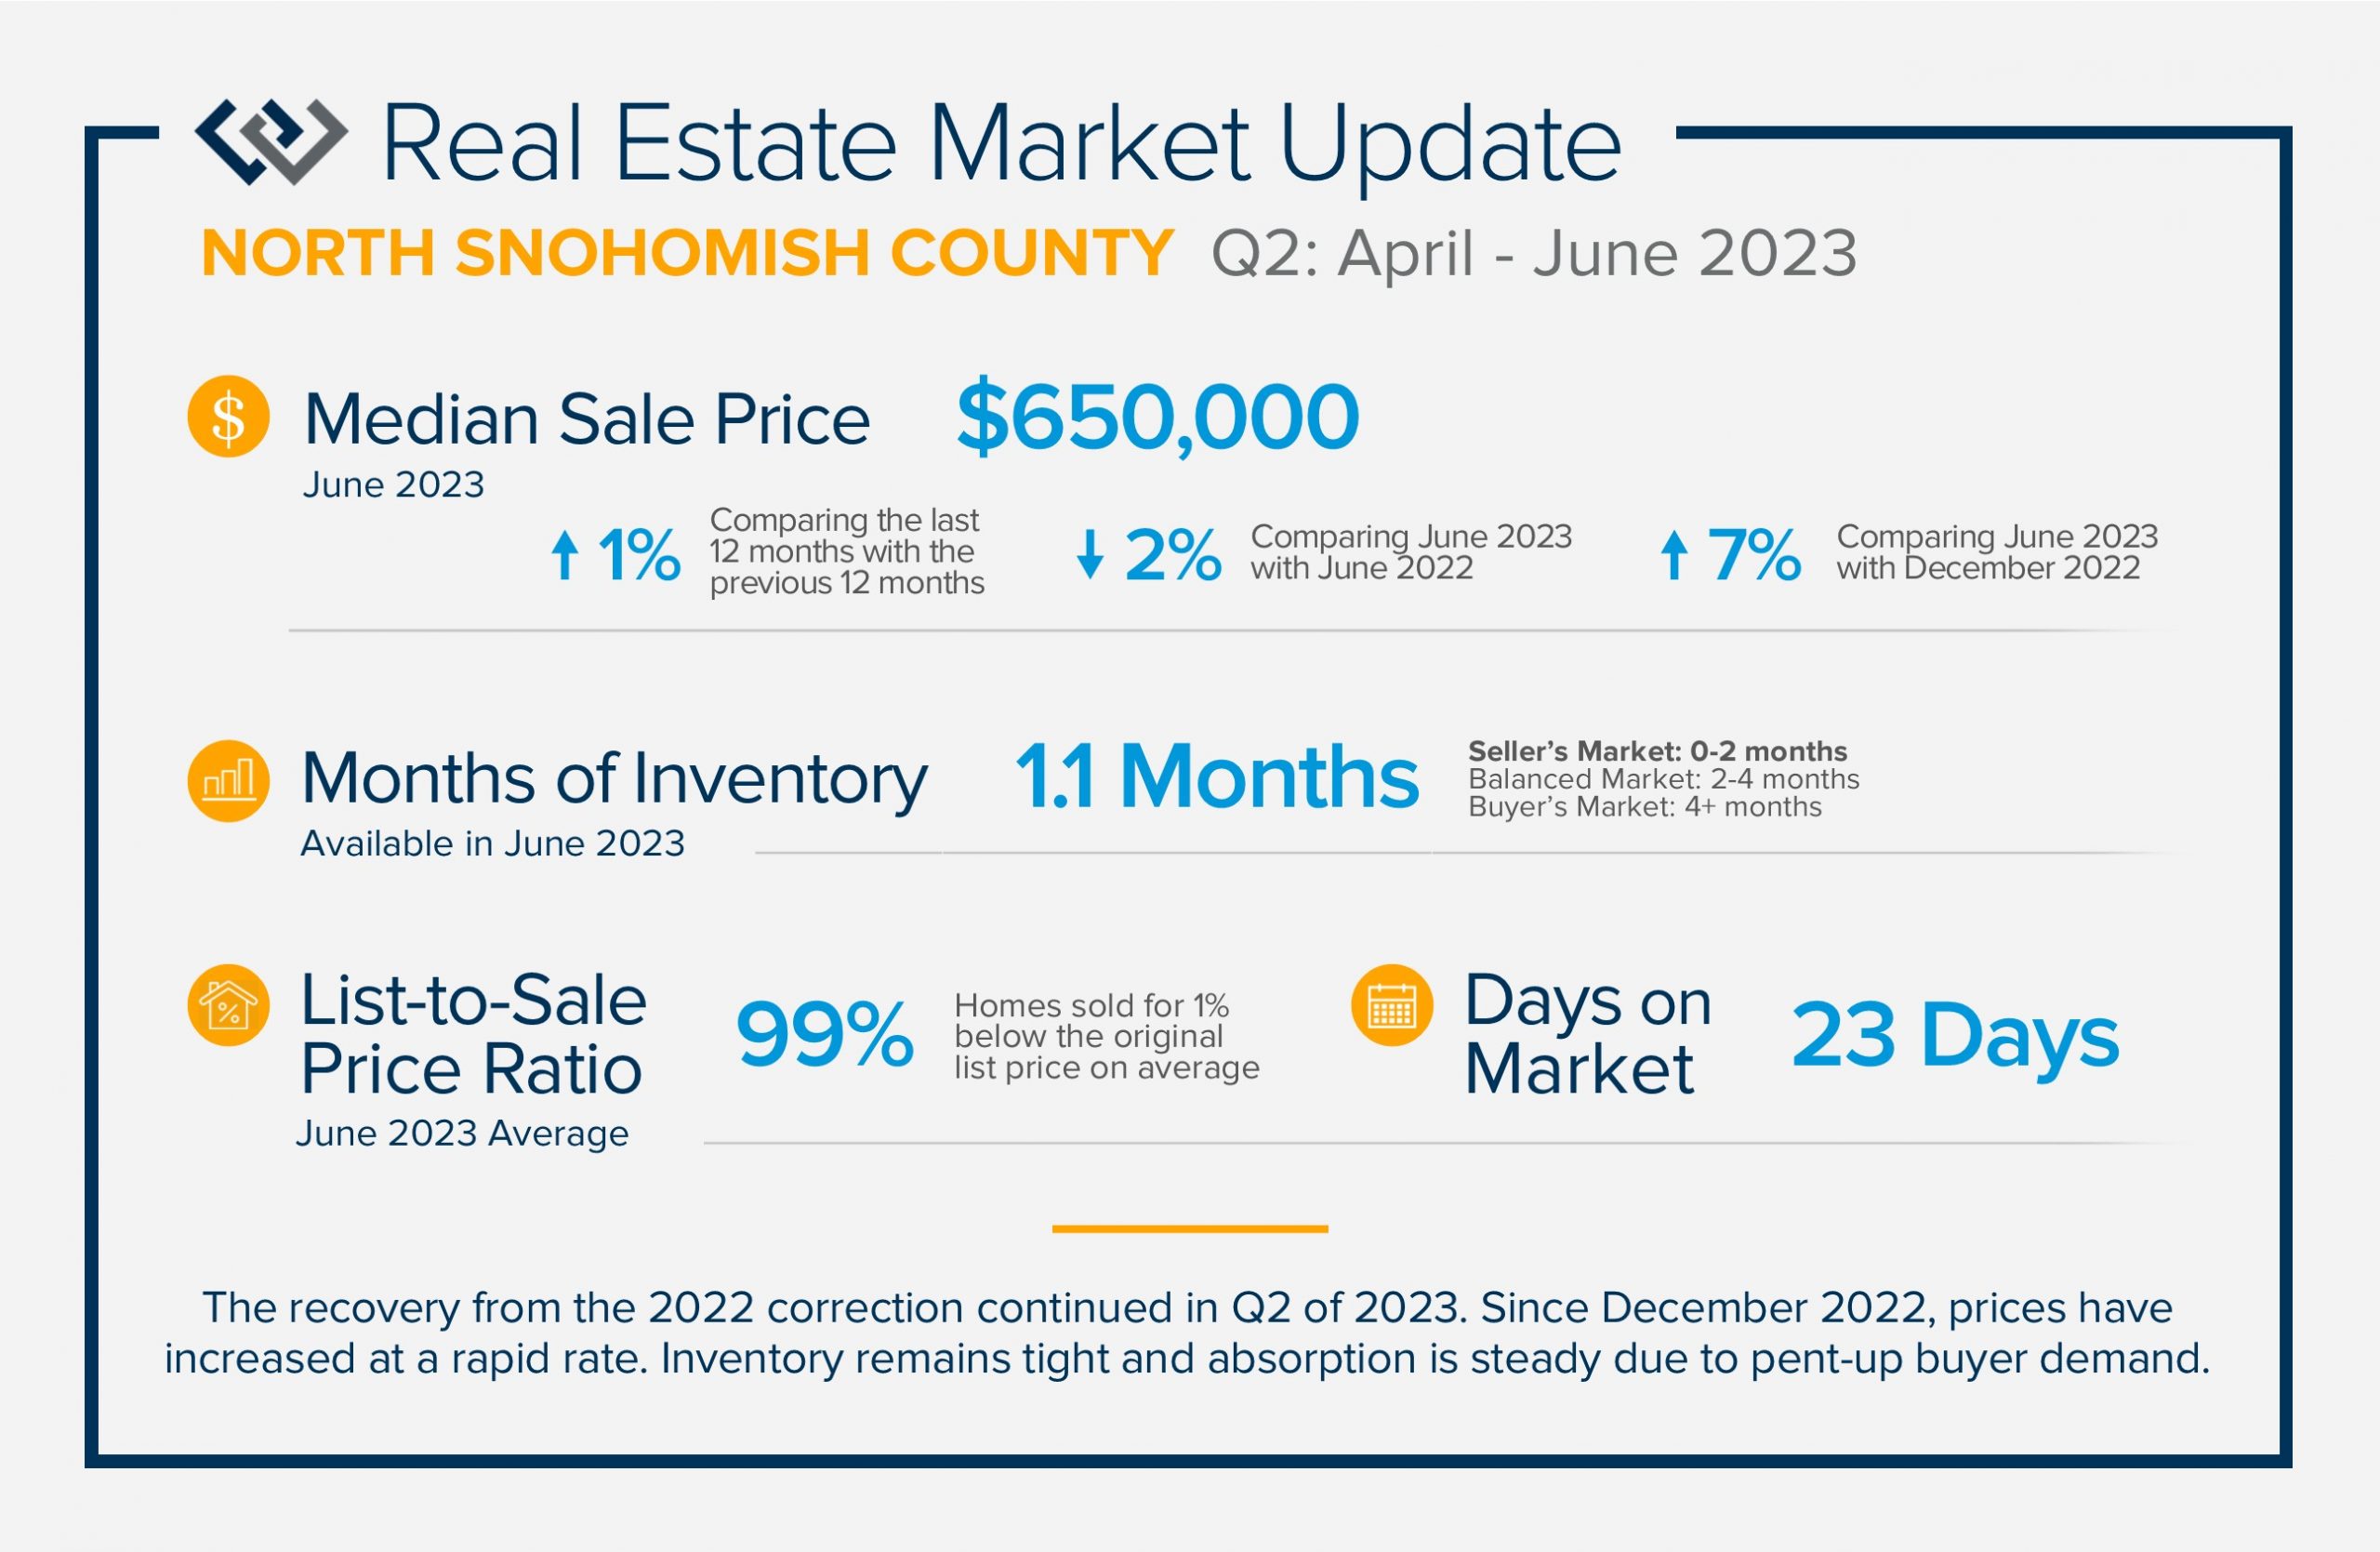
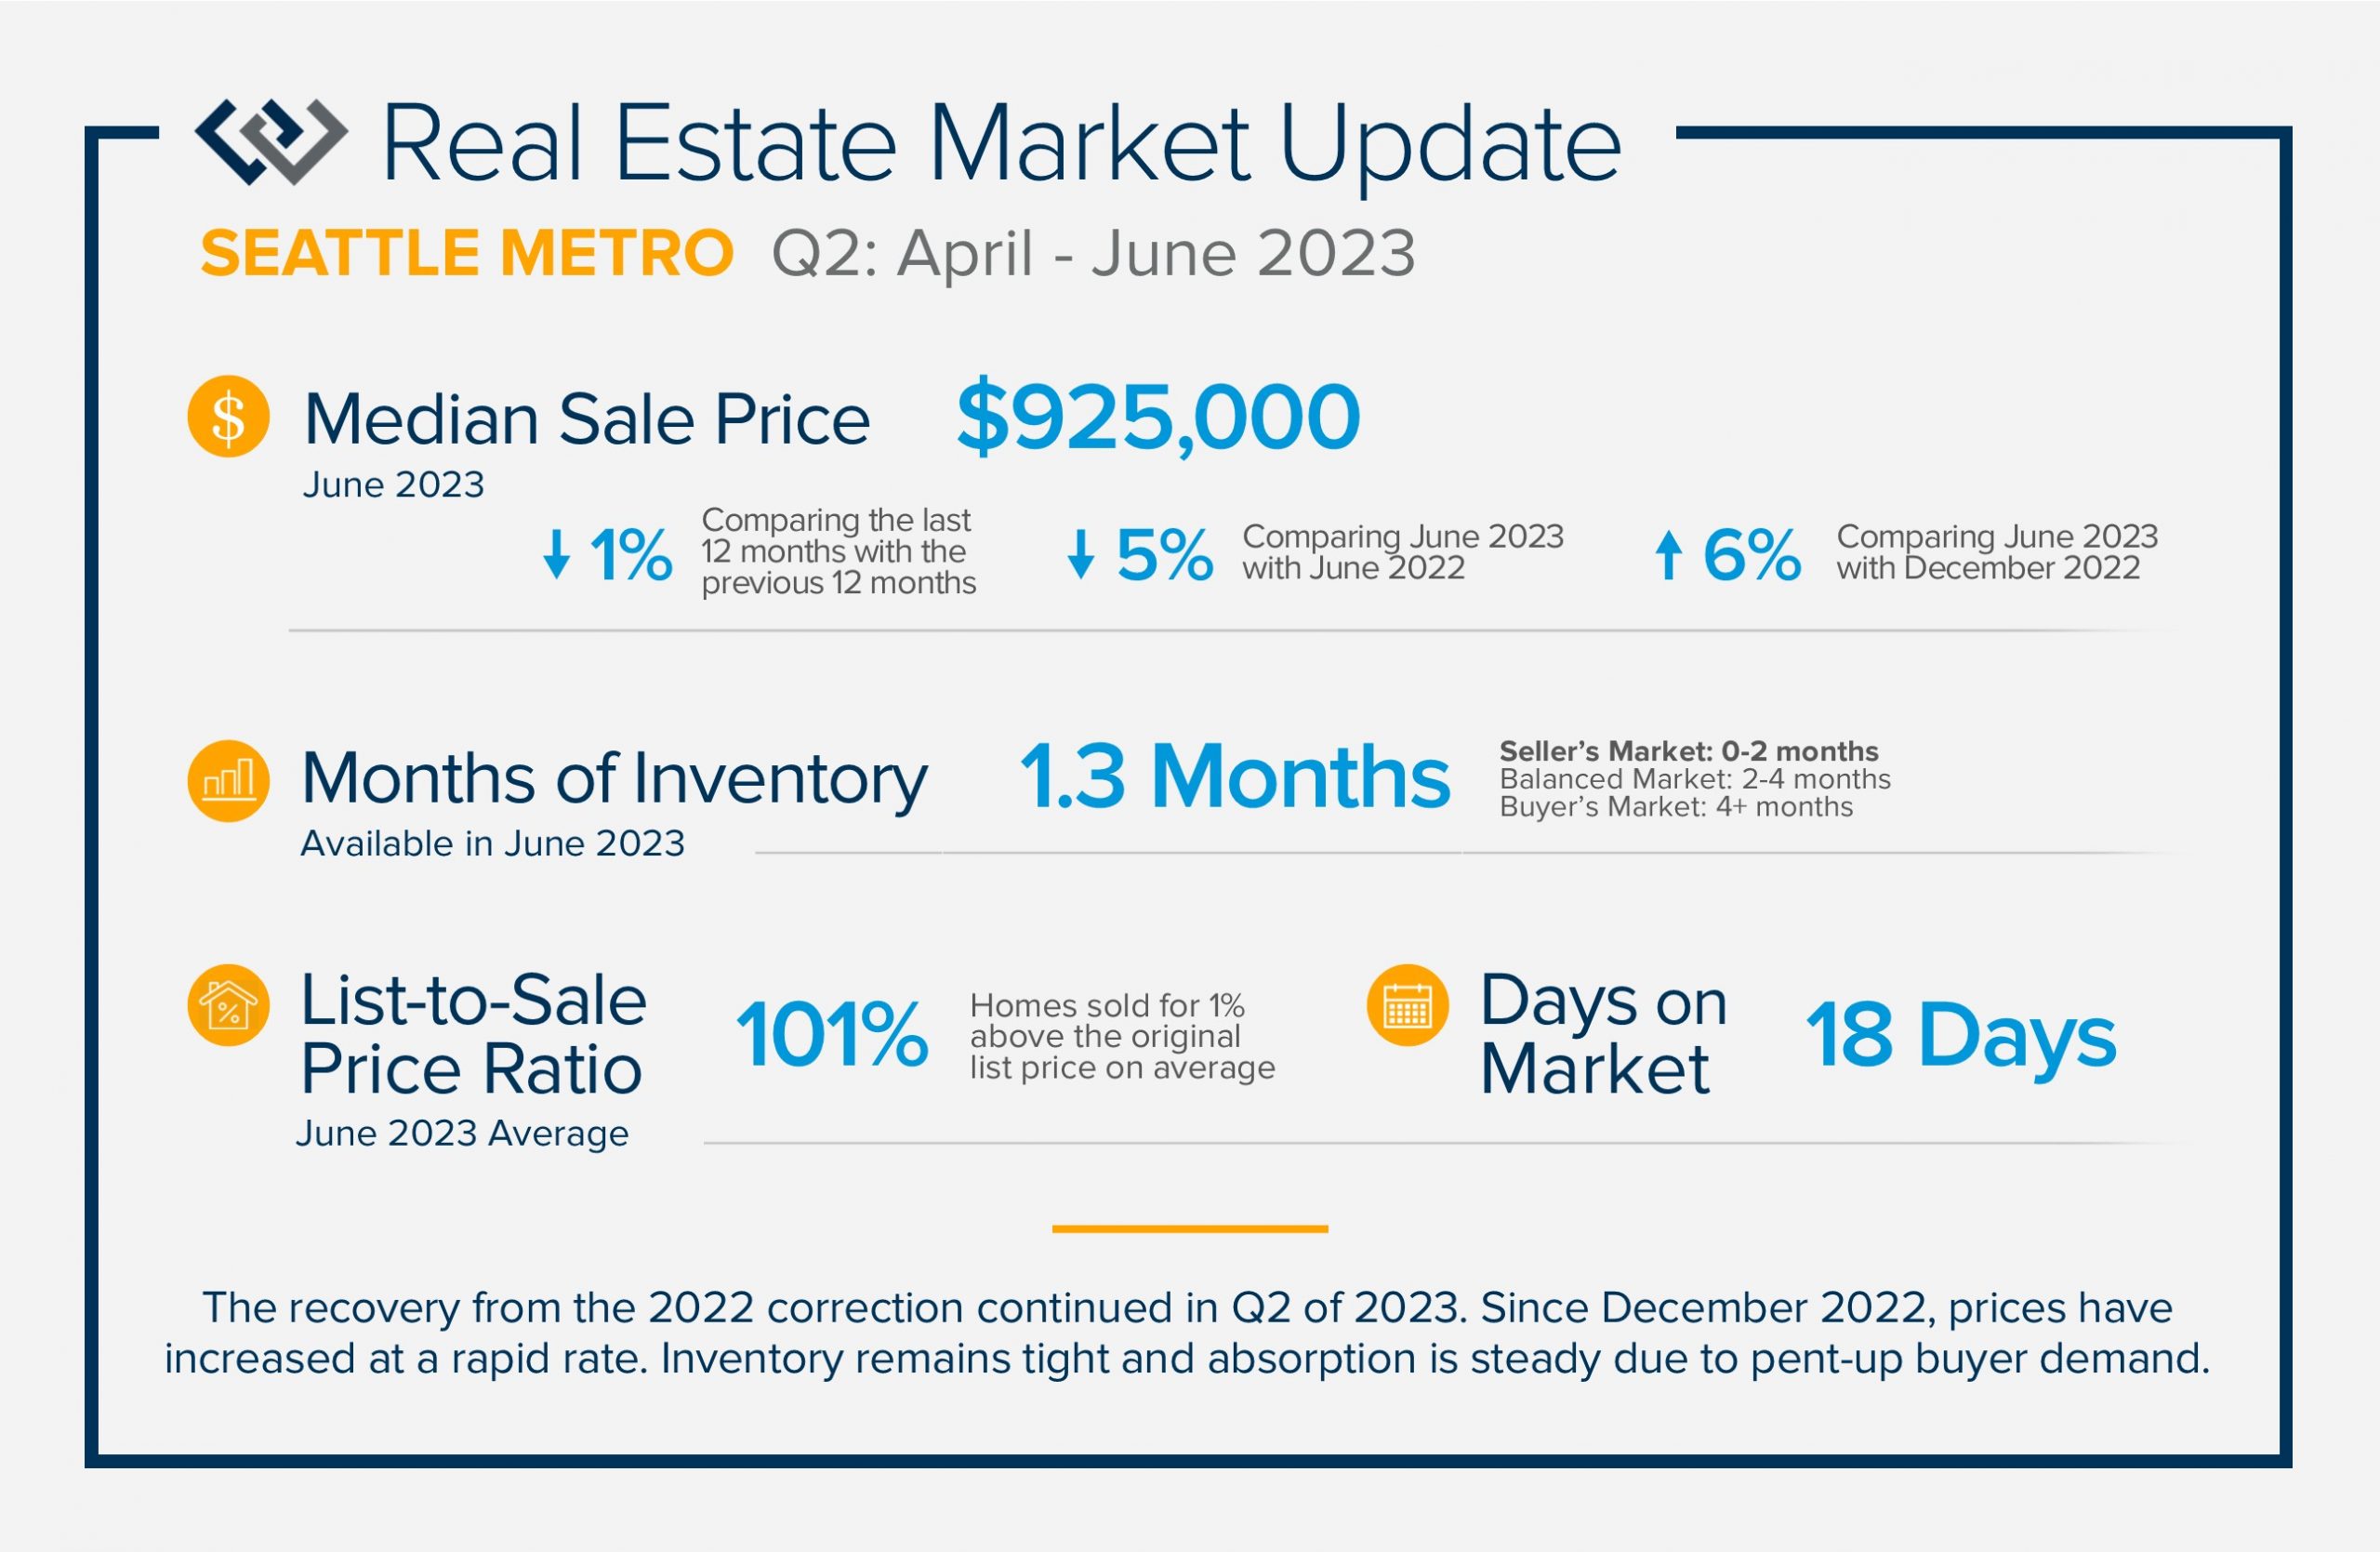
QUARTERLY REPORTS Q2 2023


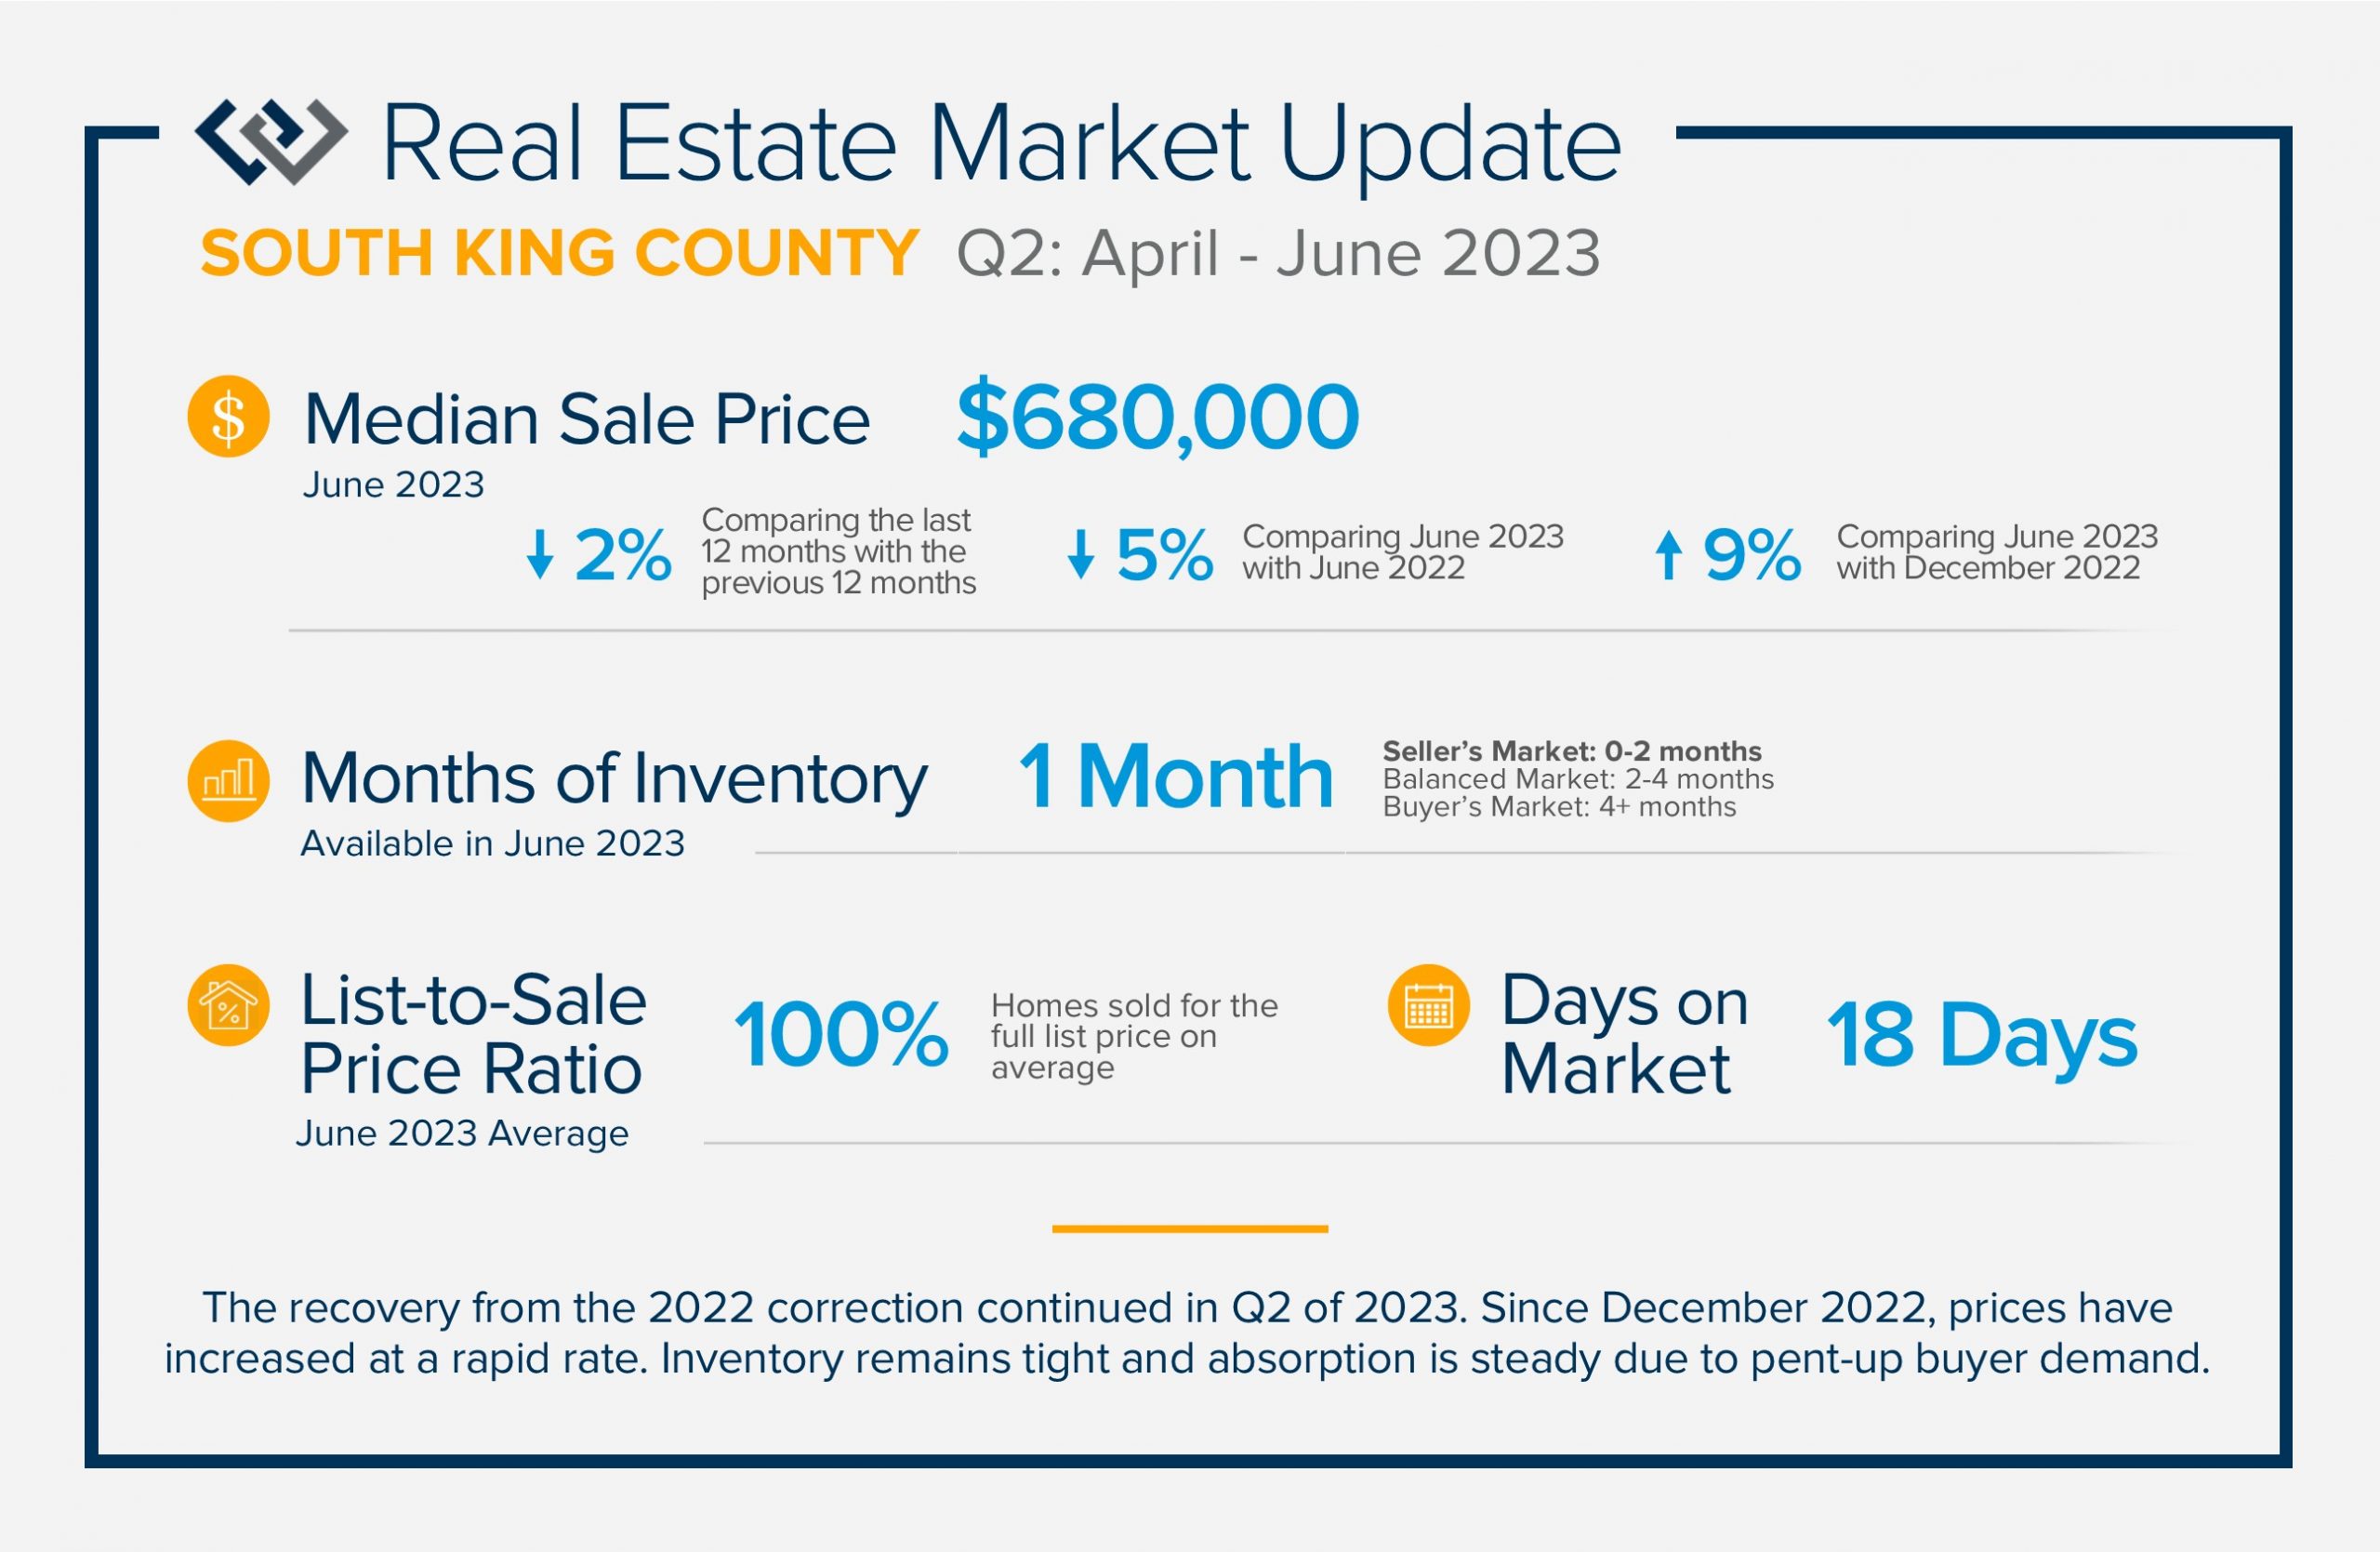
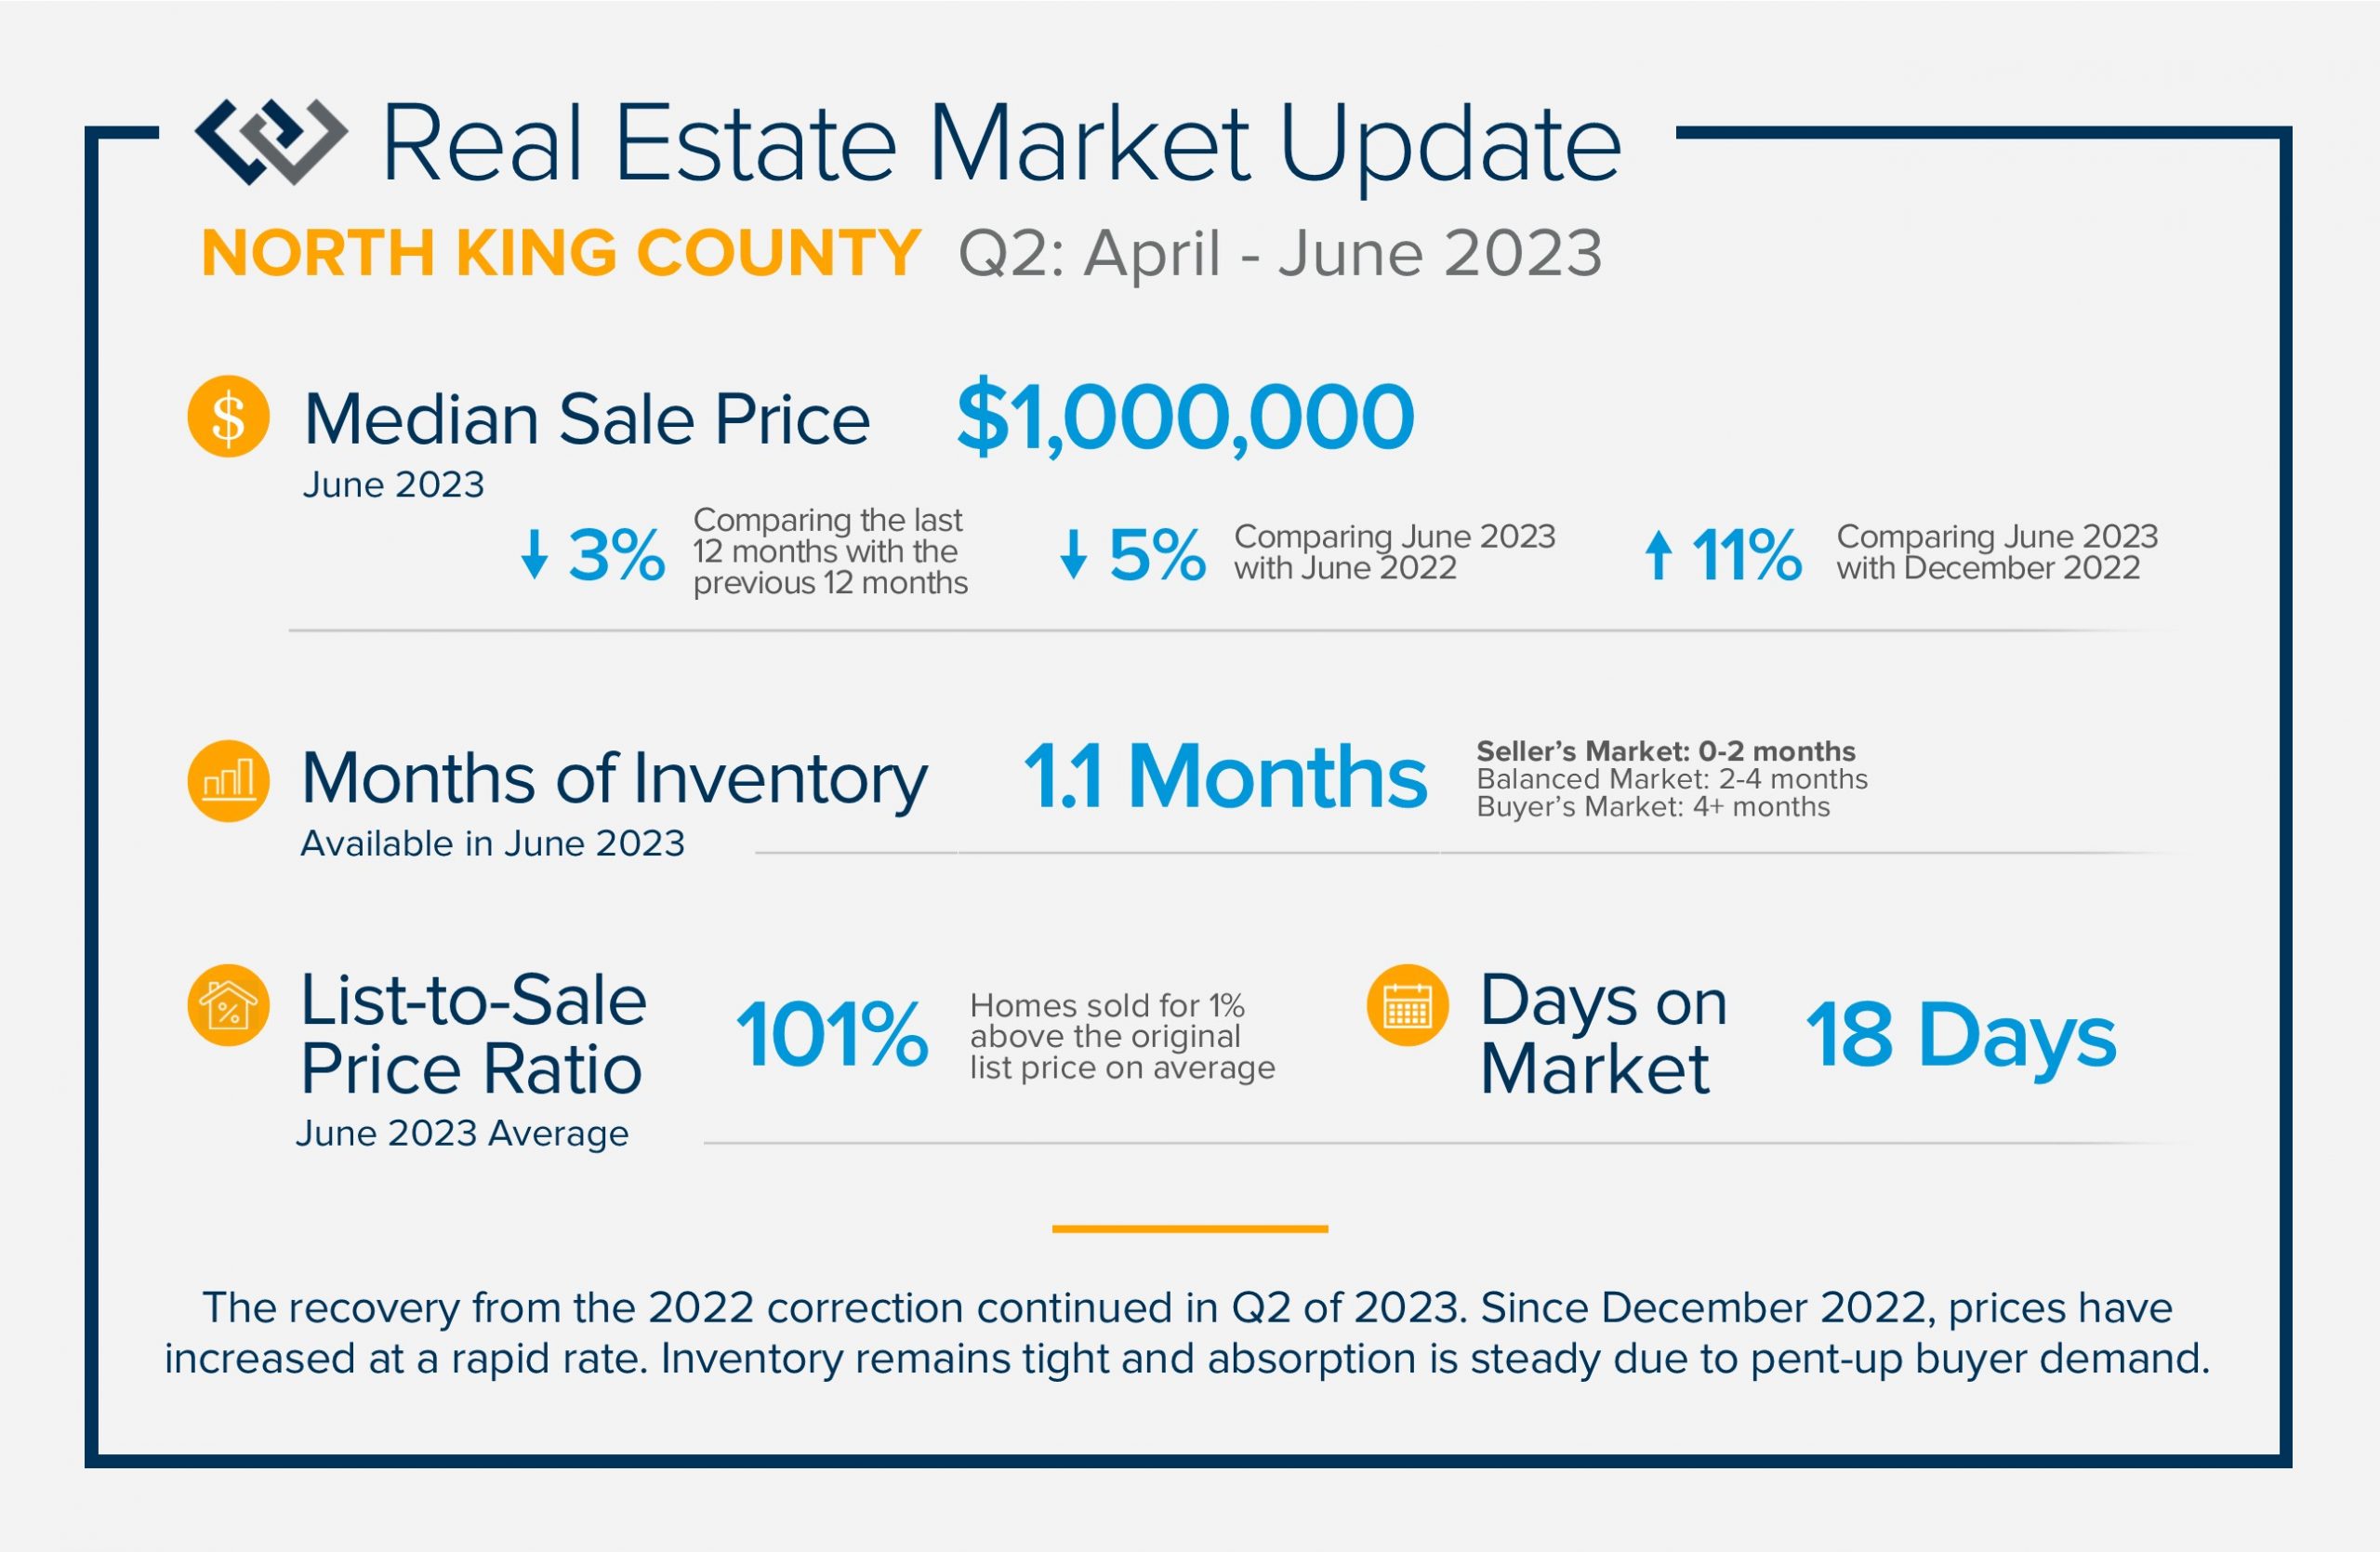 The recovery from the 2022 correction continued in Q2 of 2023. Since December 2022, prices have increased at a rapid rate. Inventory remains tight and absorption is steady due to pent-up buyer demand. Shorter days on market and healthy list-to-sale price ratios illustrate when a seller meets the market with appropriate pricing and is in good condition, a swift and successful sale is in store. Despite higher interest rates the market continues to churn. Rates are anticipated to come down, and when they do competition will increase.
If you are curious about how the trends relate to your goals, please reach out. It is my goal to keep my clients well-informed to empower strong decisions.
QUARTERLY REPORTS Q1 2023

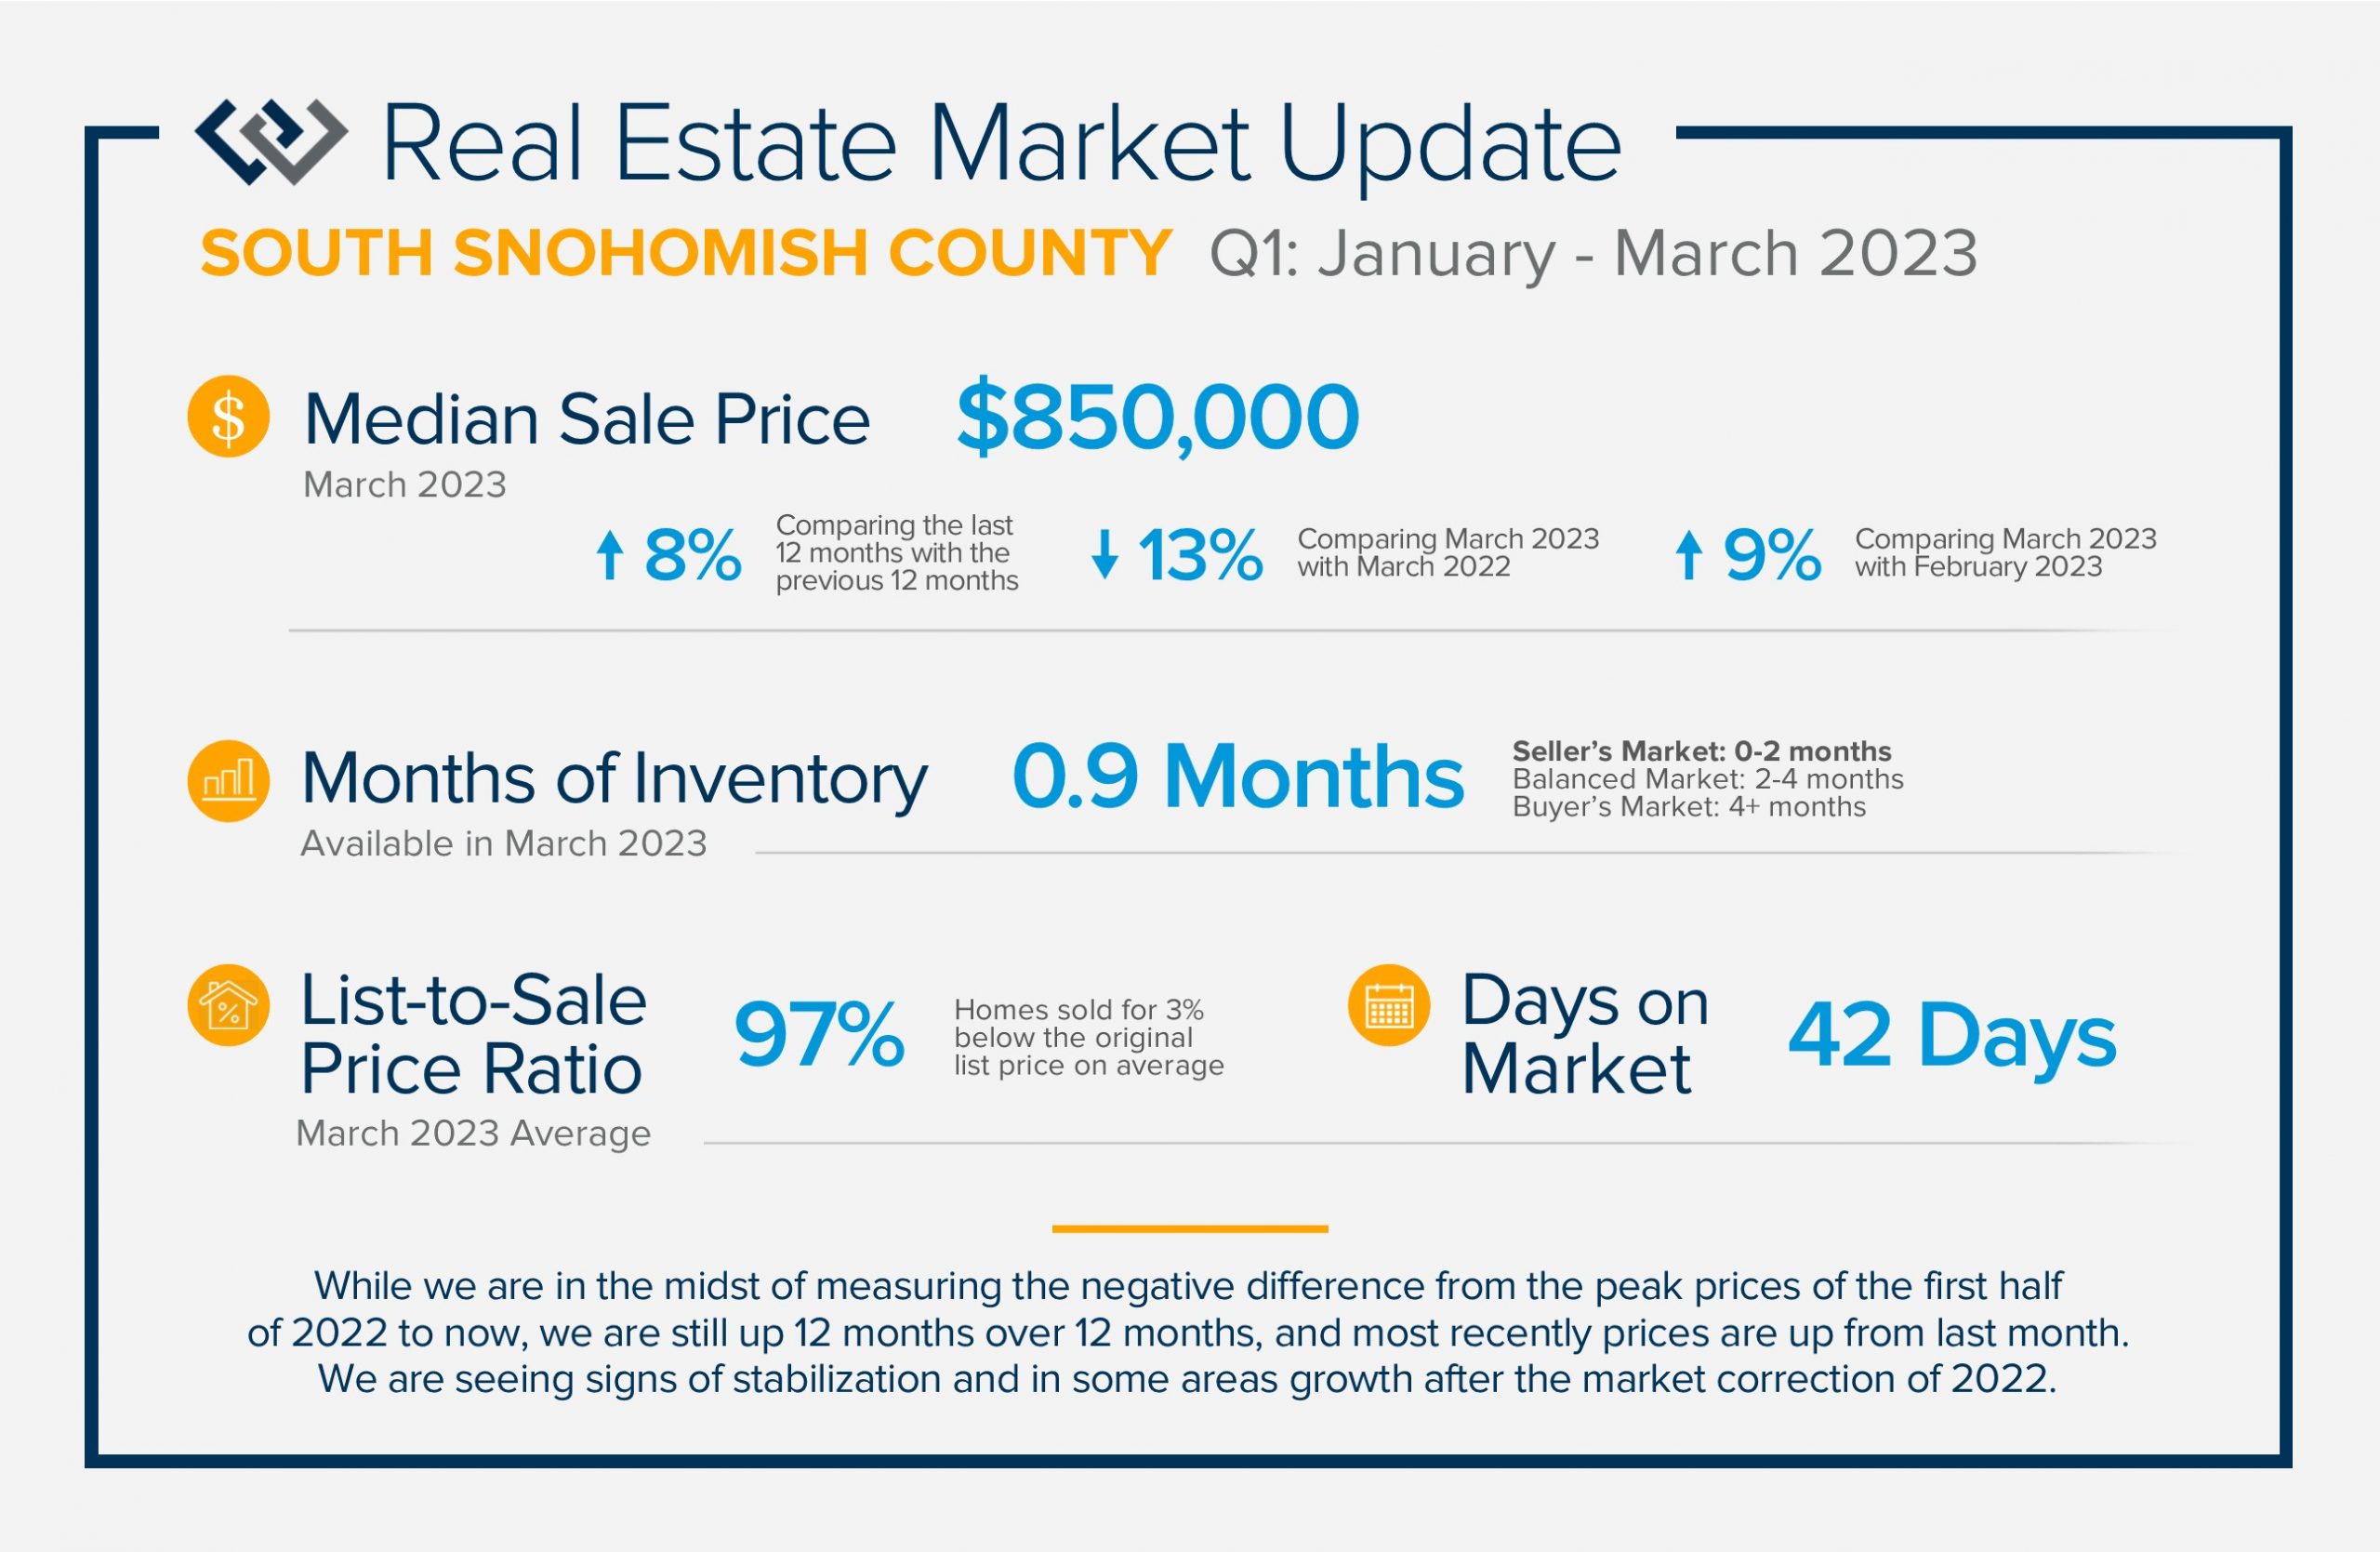
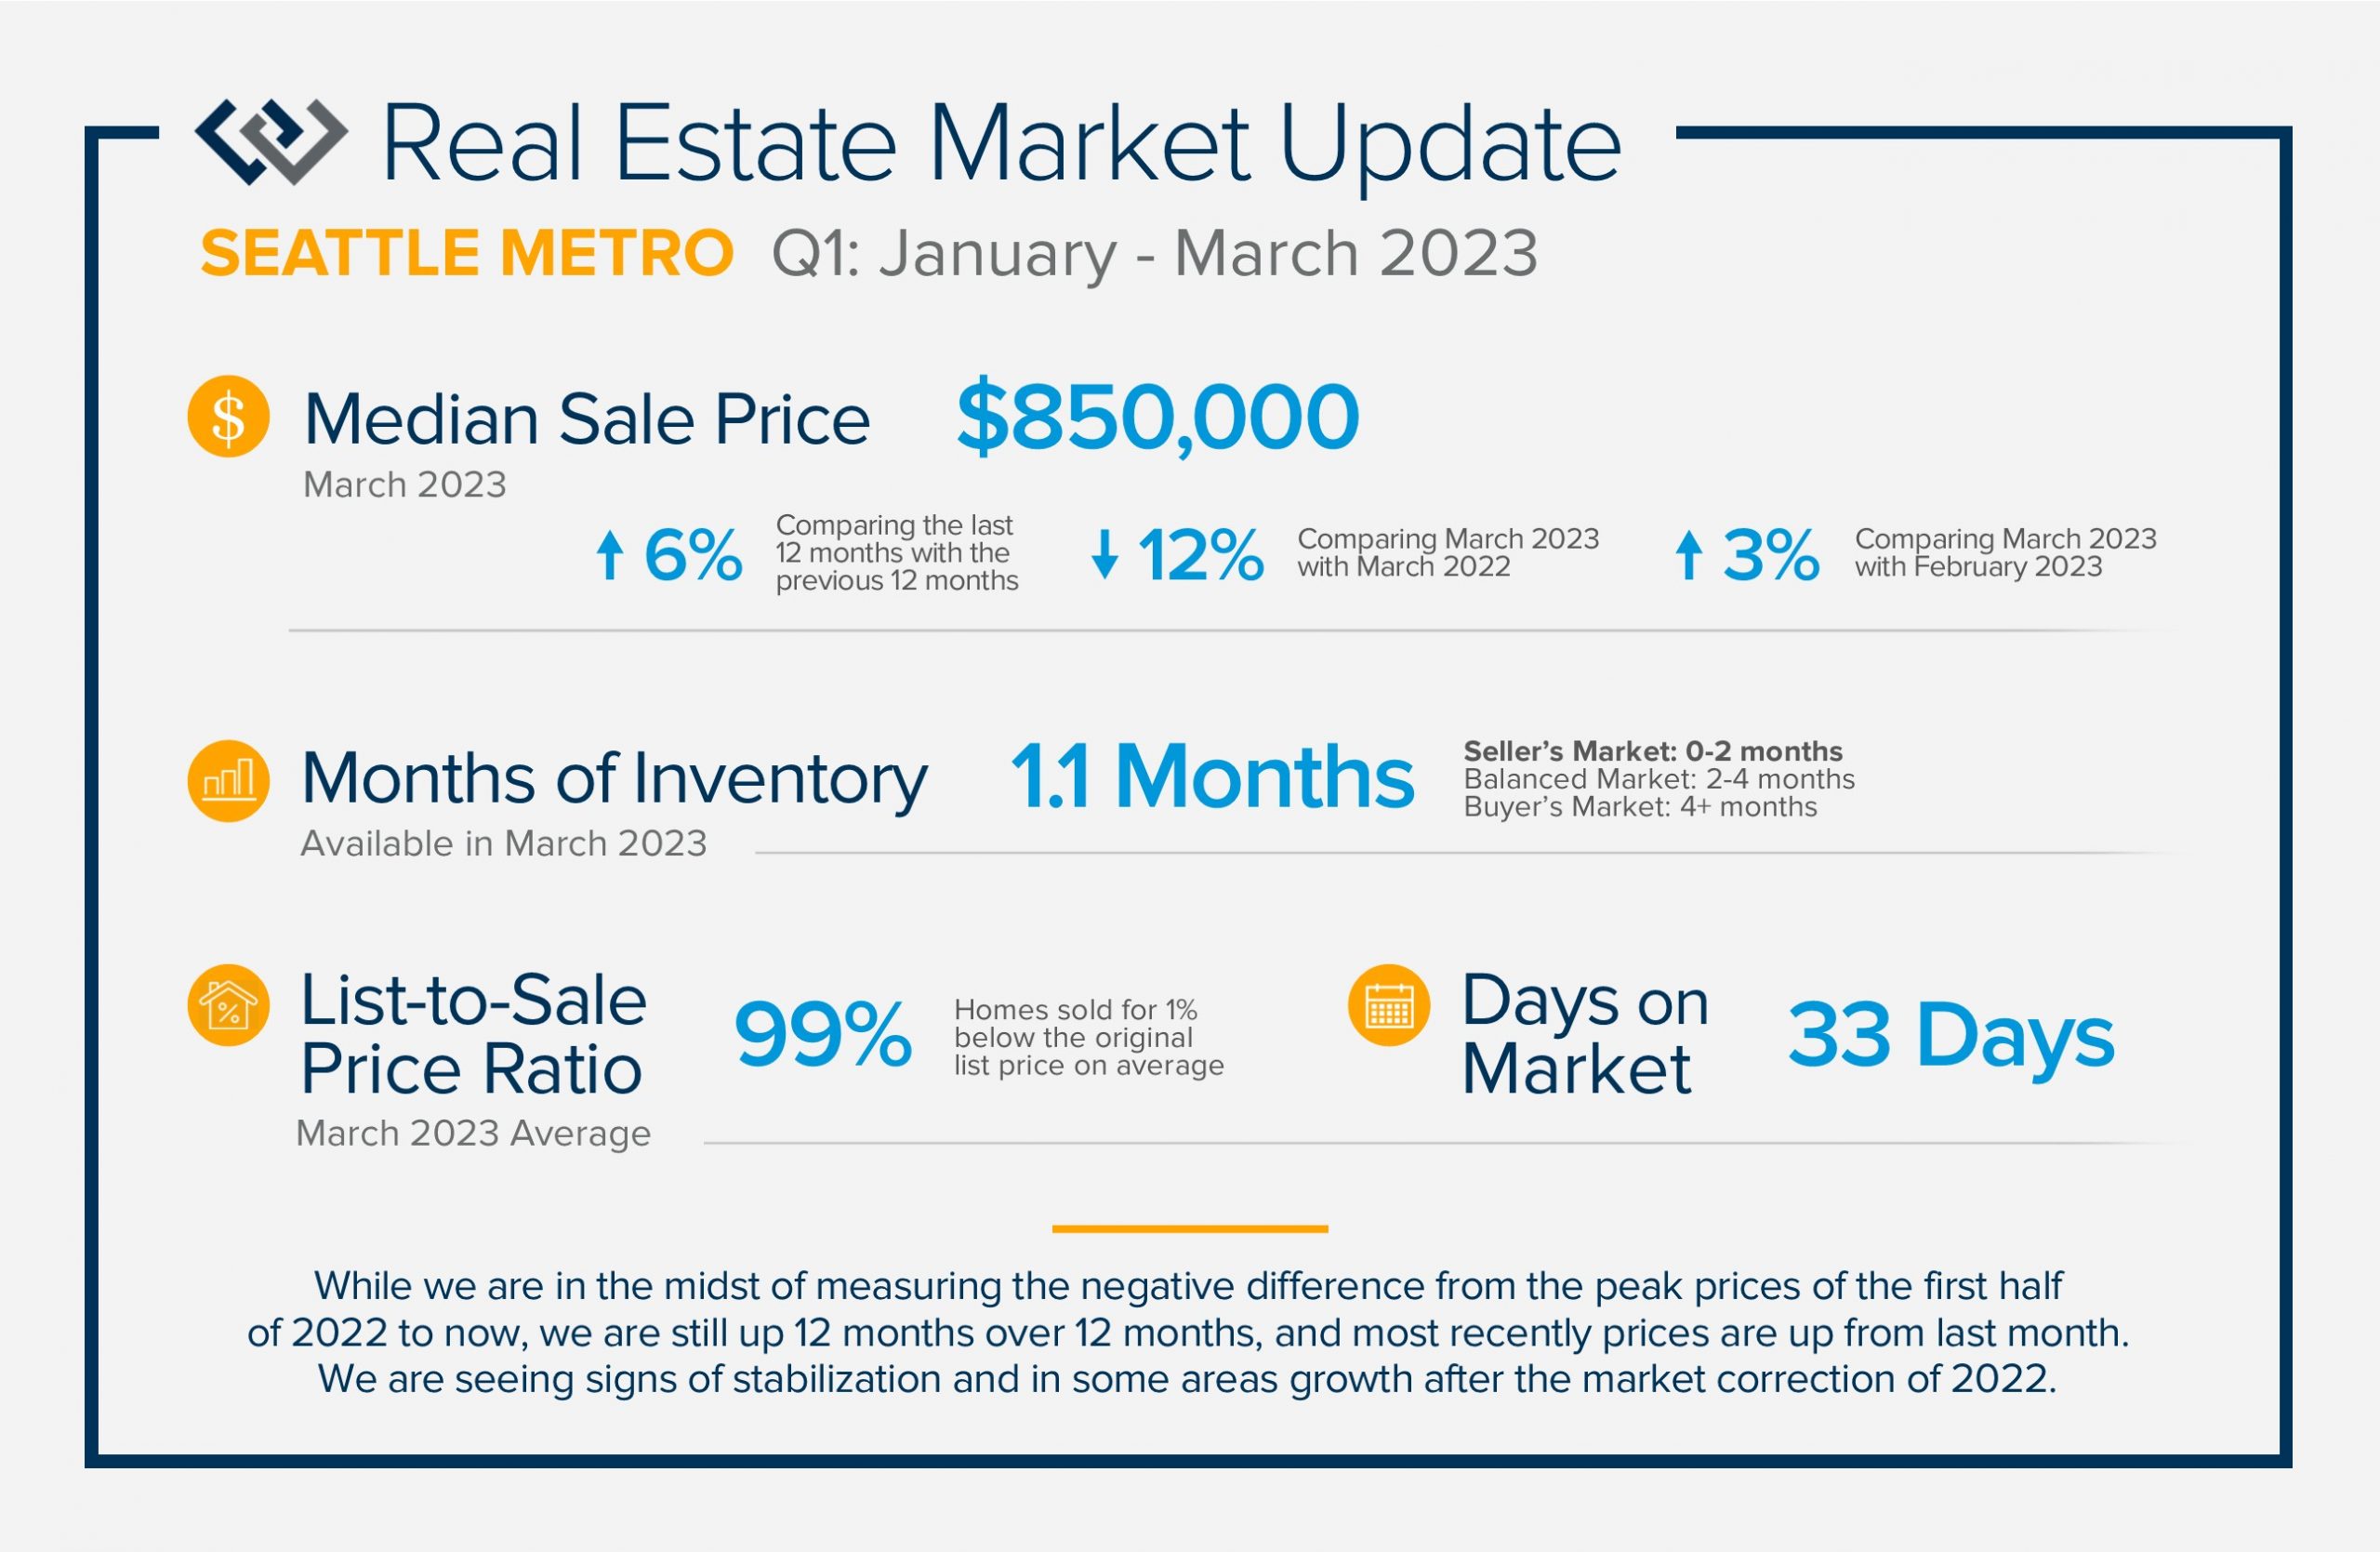
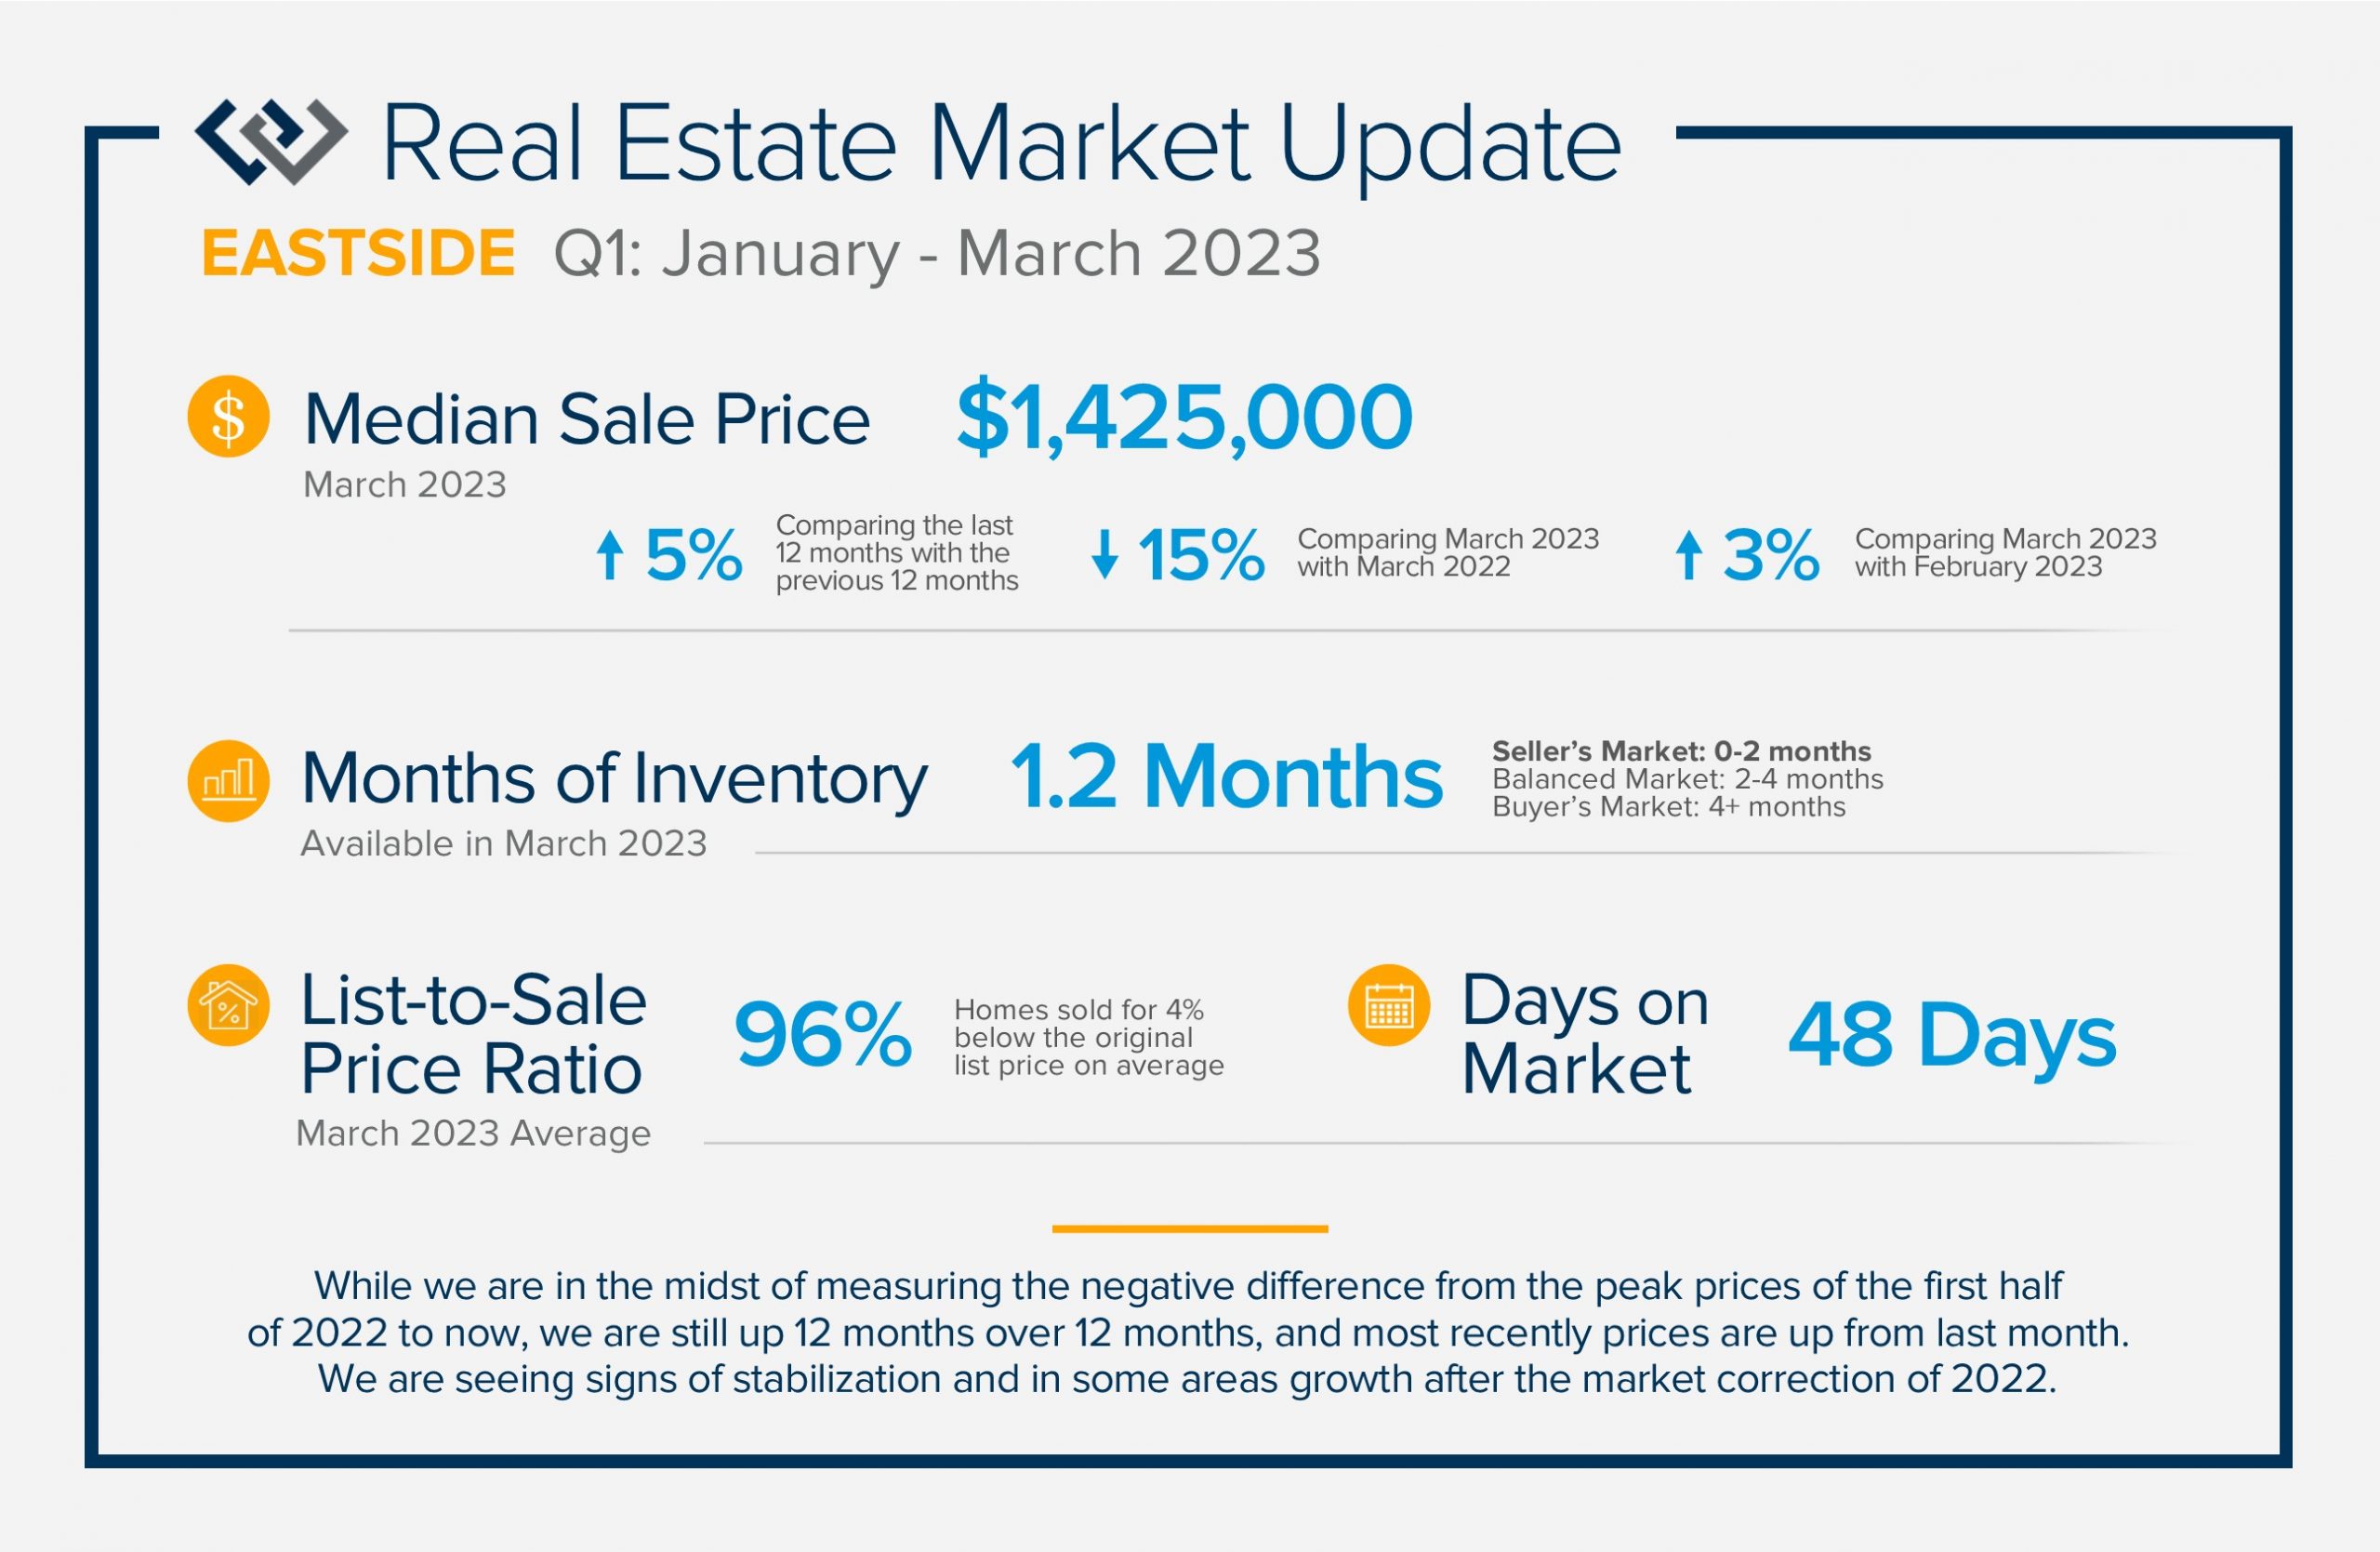
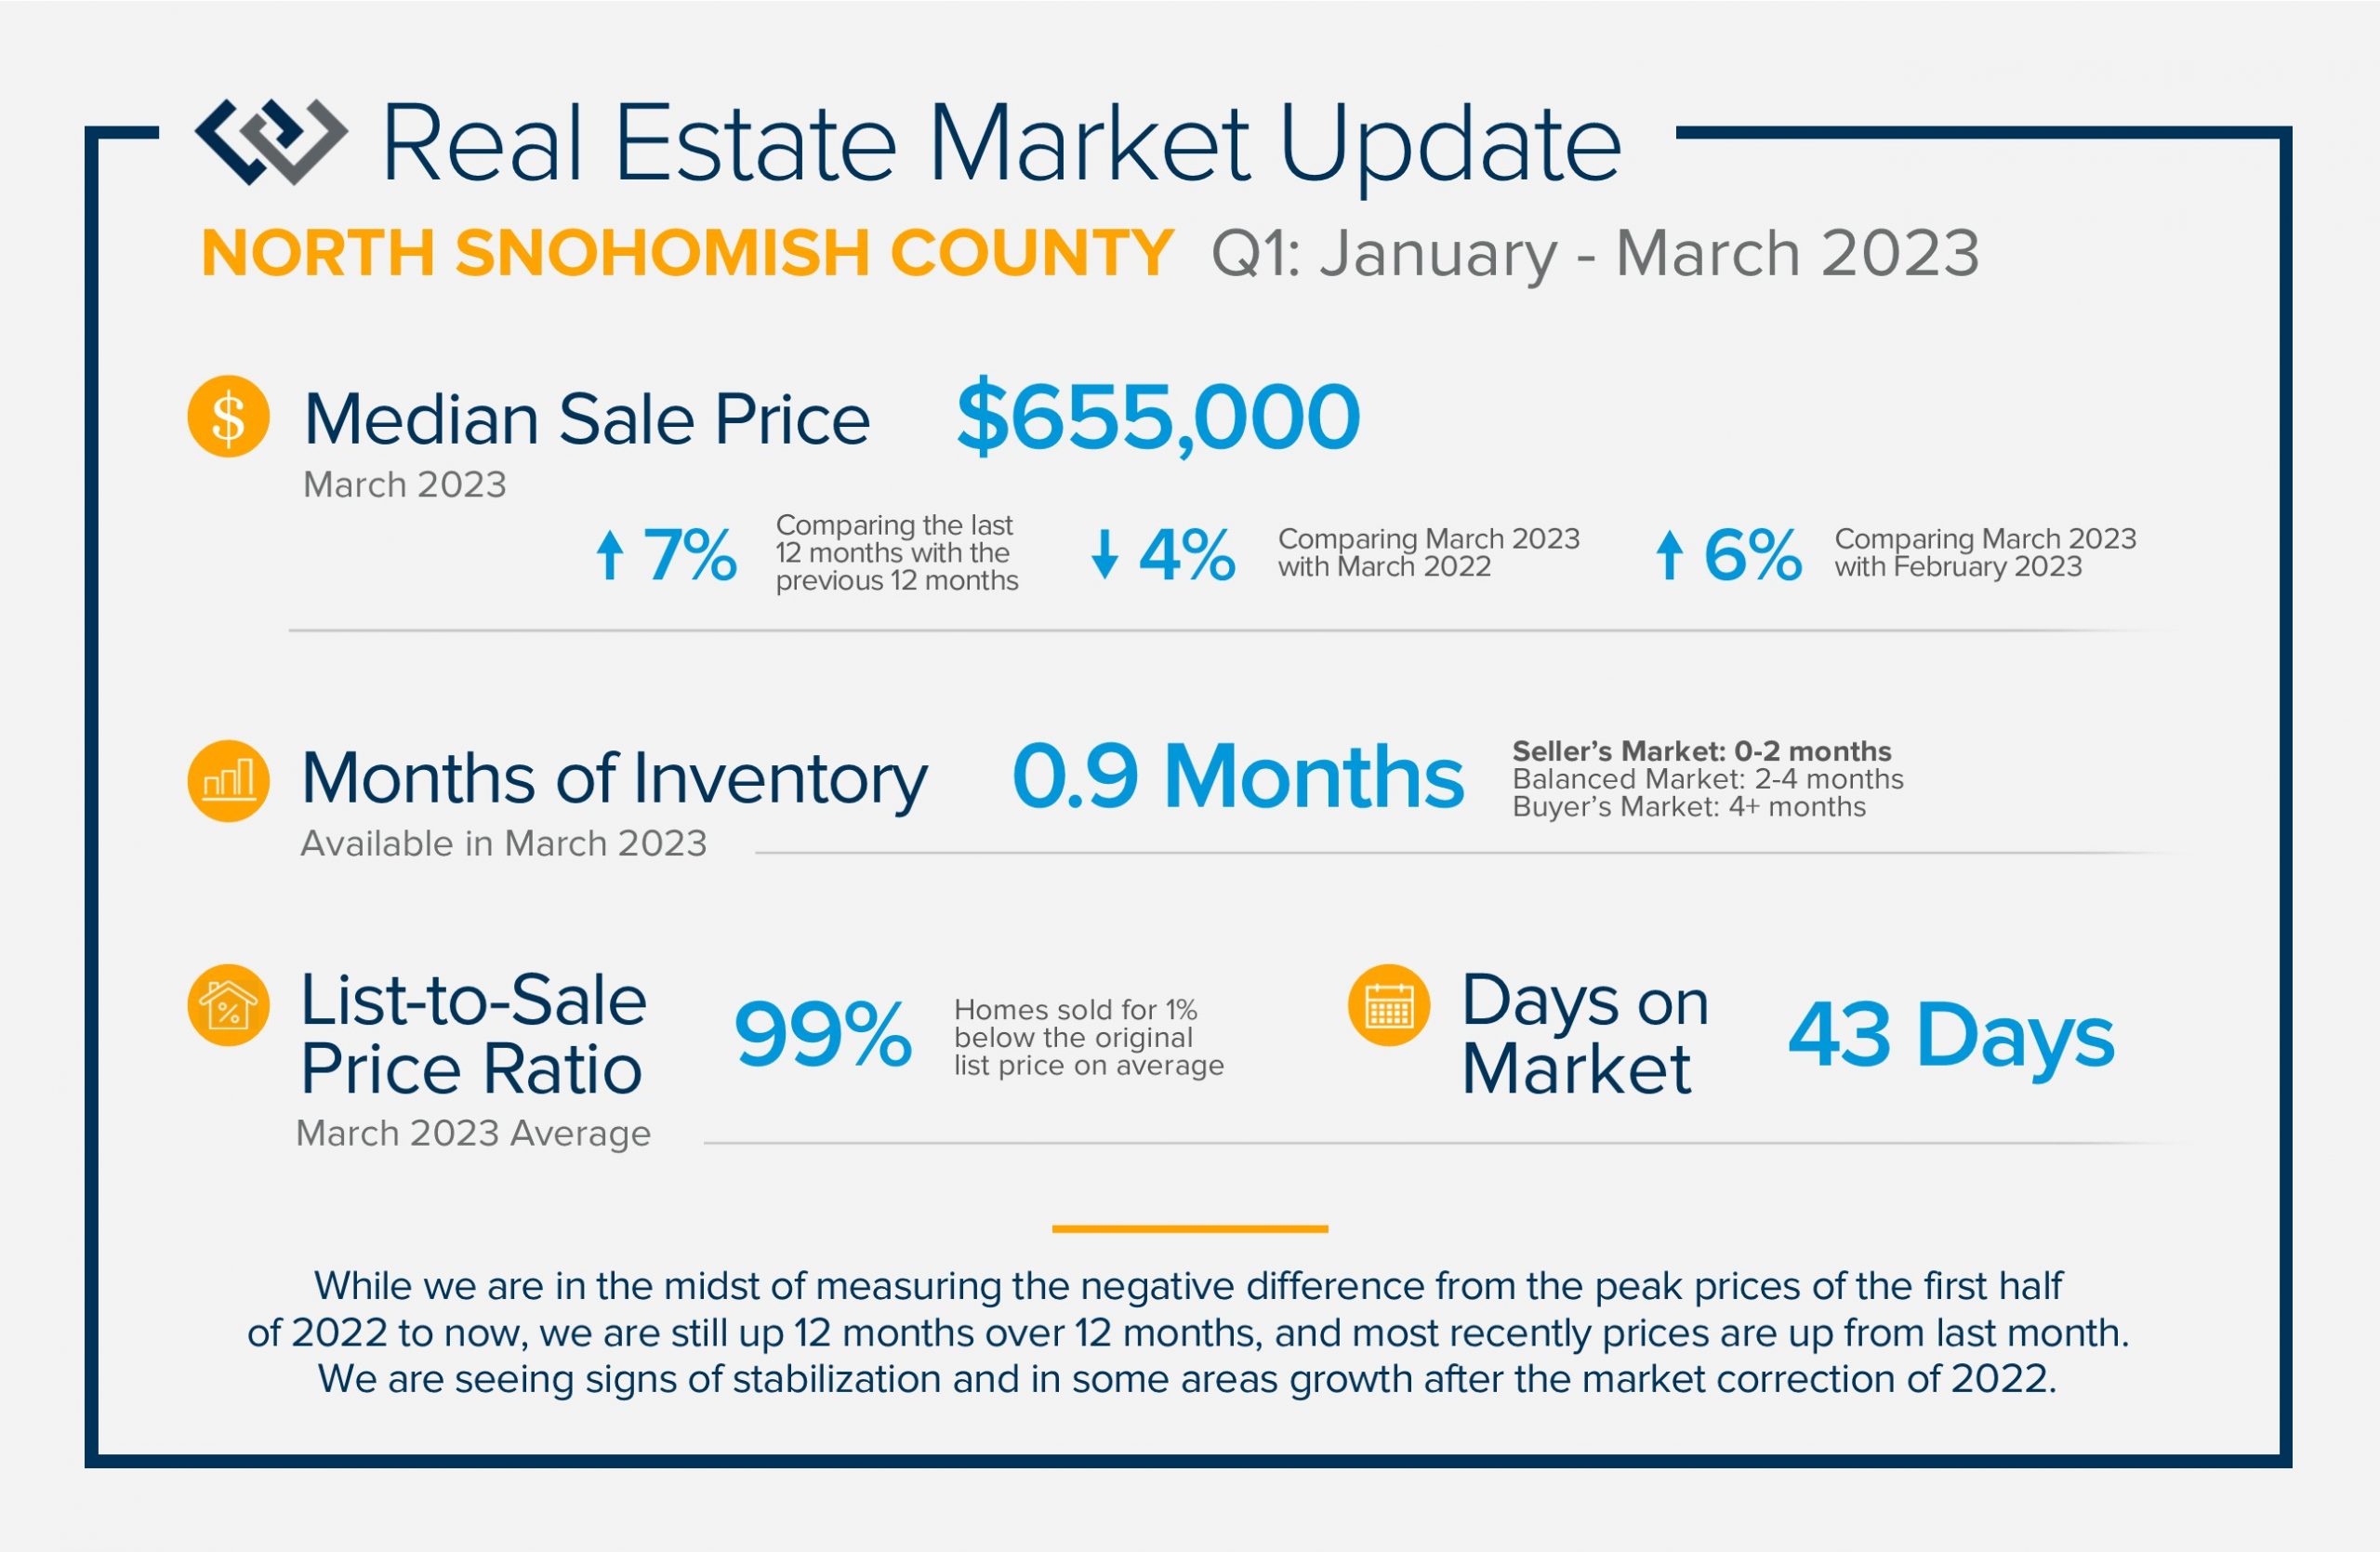
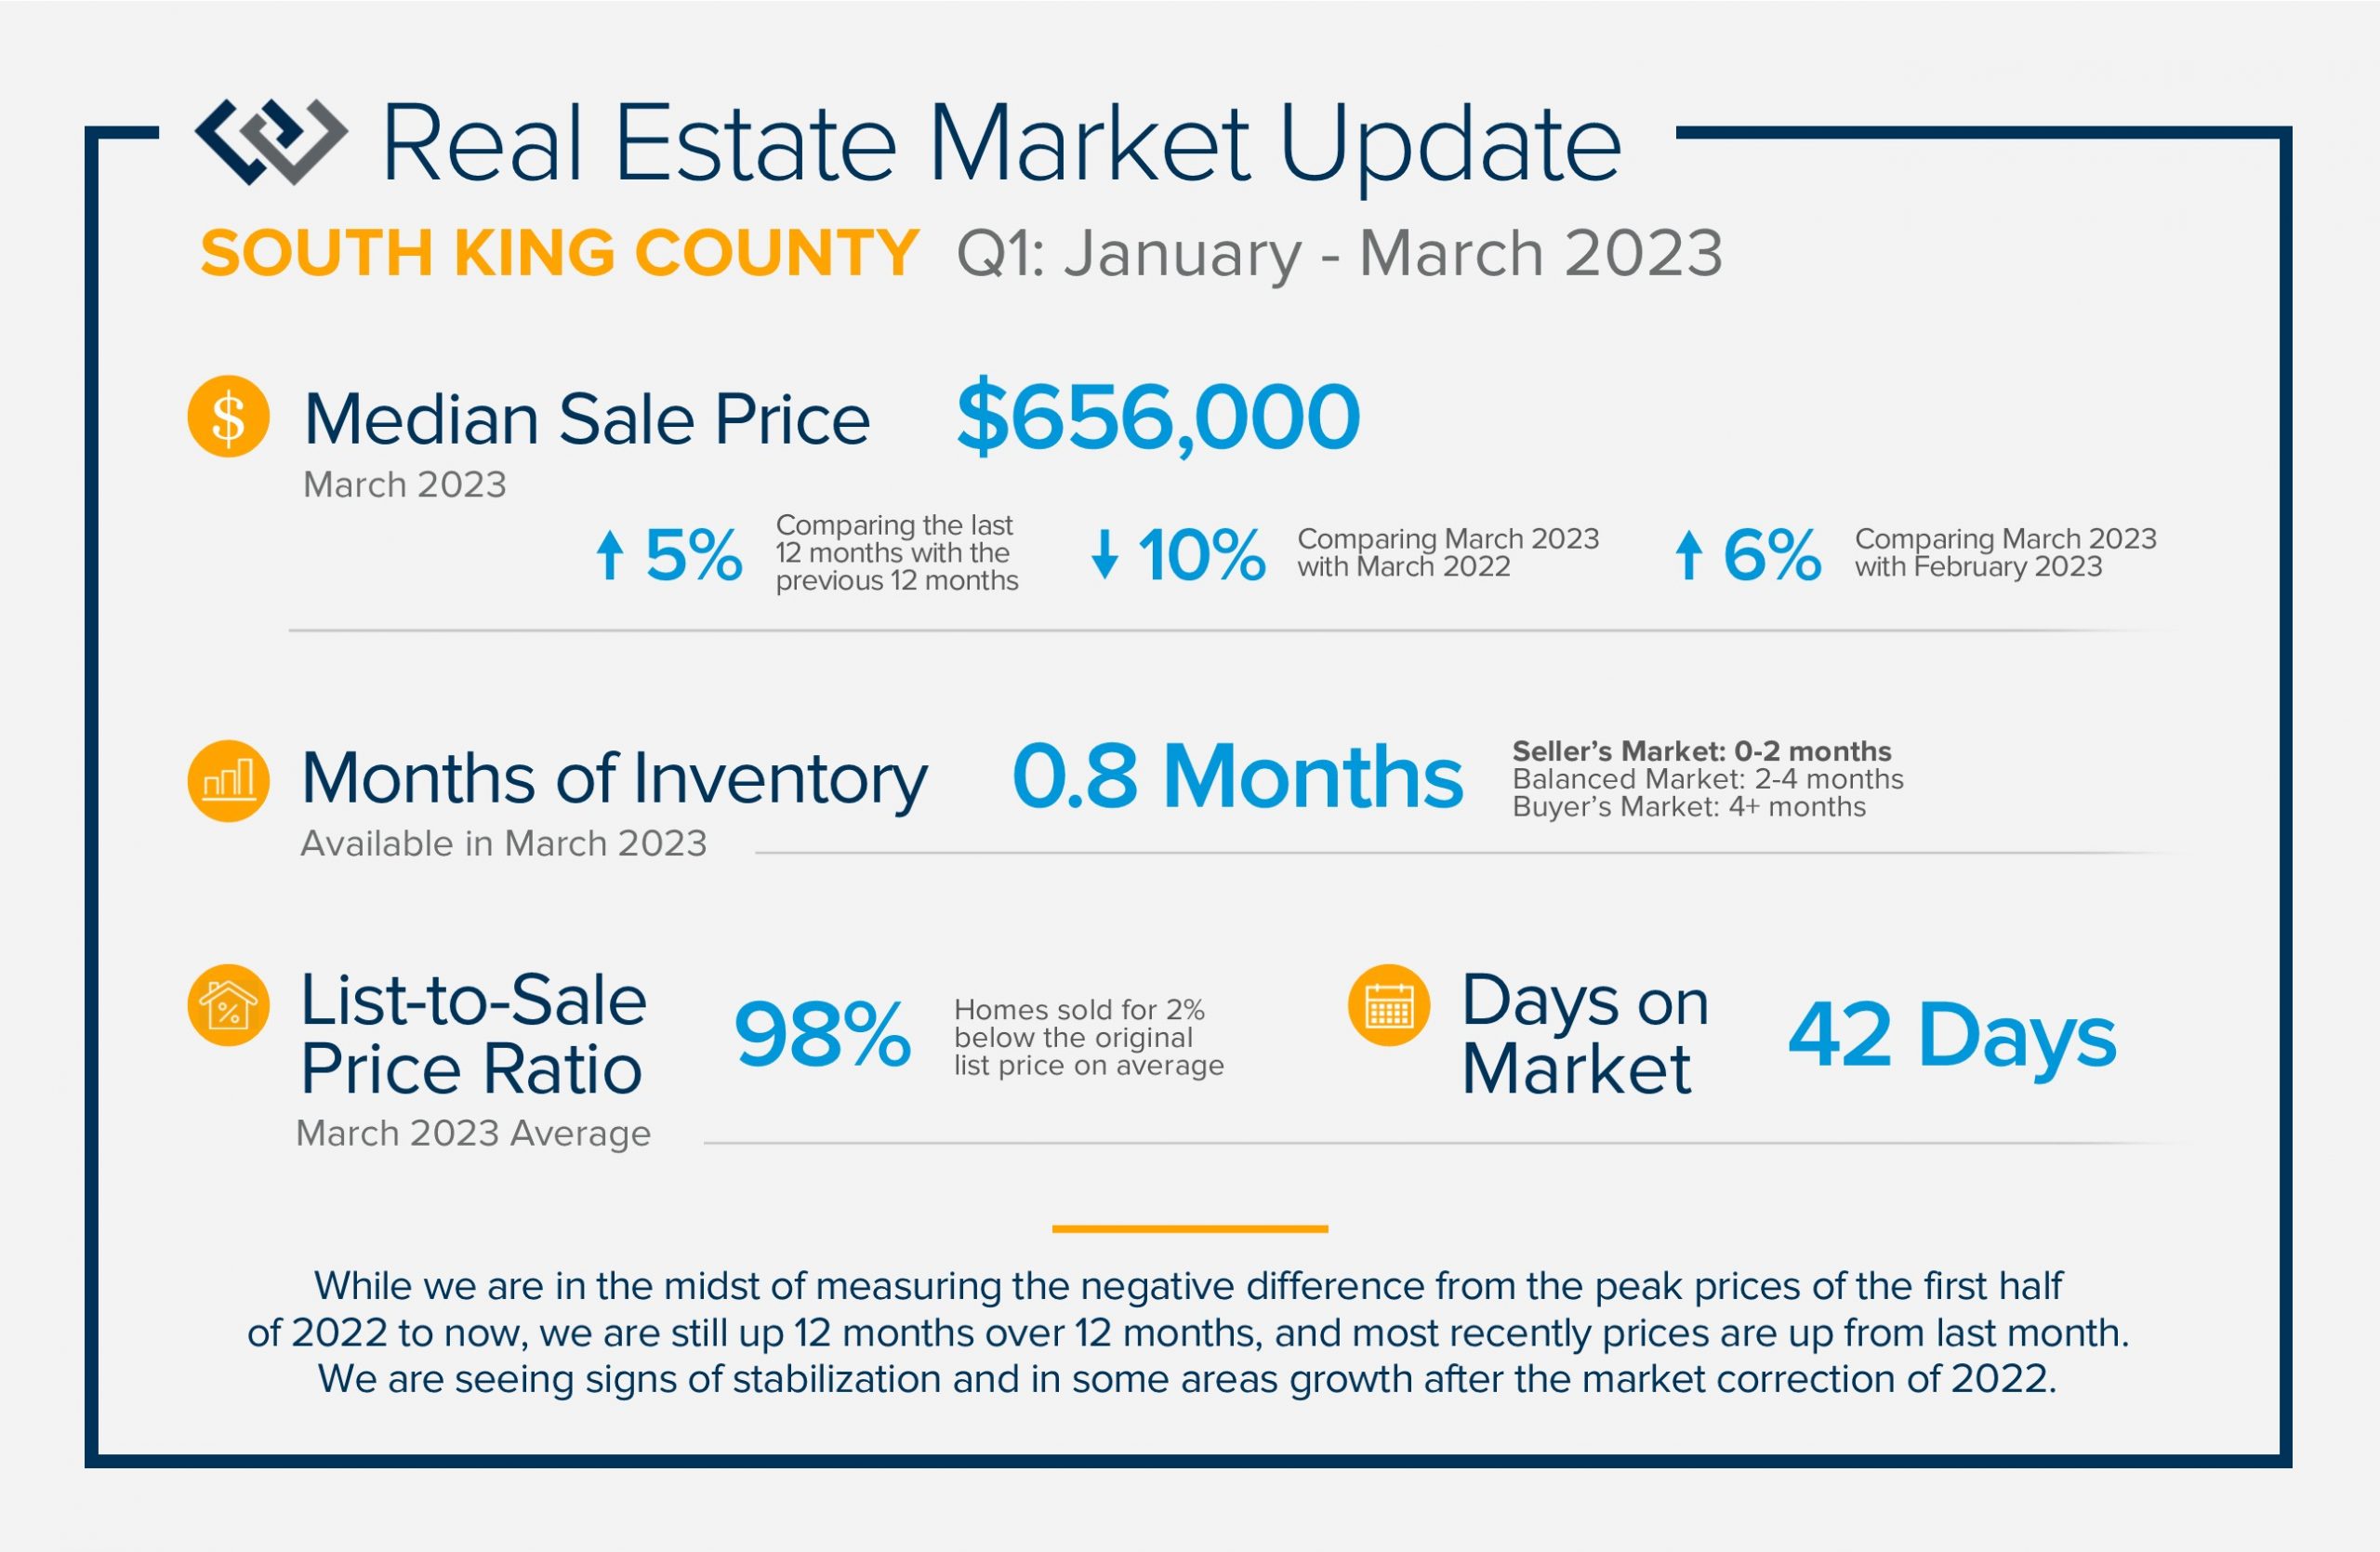
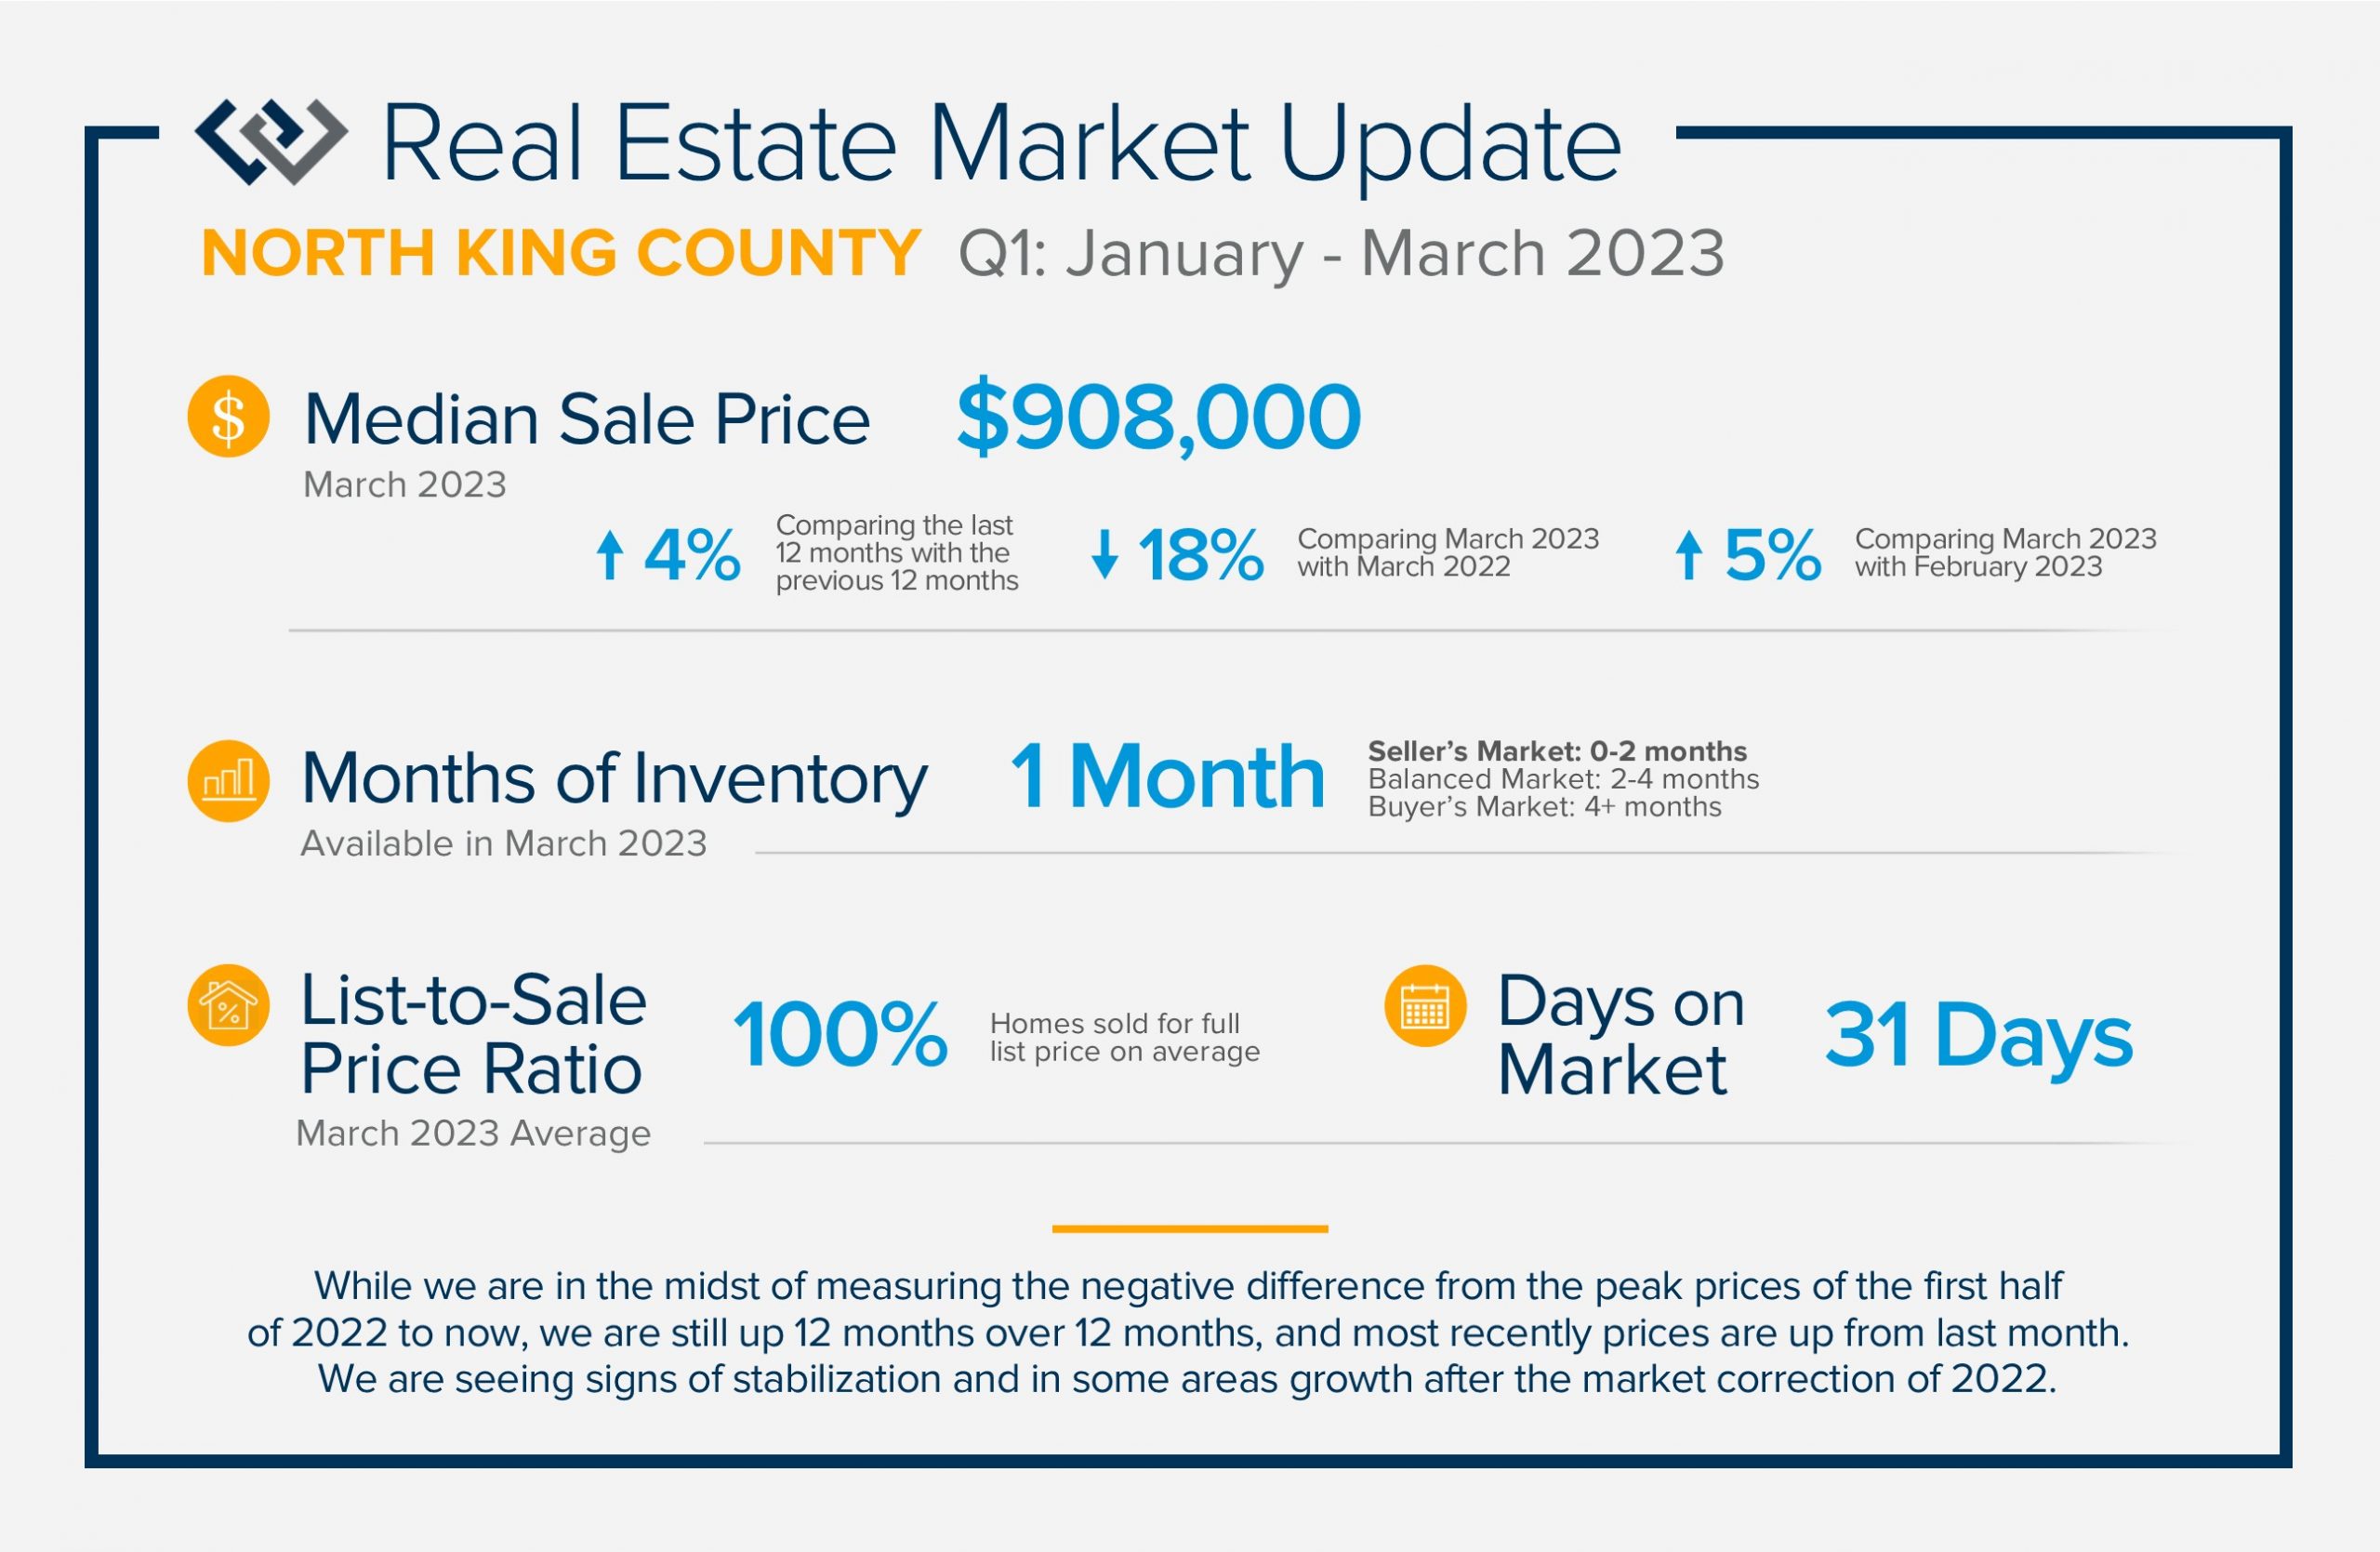 We are seeing signs of price stabilization and some growth after the market correction of 2022! Illustrated on the front is the up-down-up trajectory that home prices have experienced over the last year. While we are in the midst of measuring the negative difference from the peak prices of the first half of 2022 to now, we are still up 12 months over 12 months, and most recently prices are up from last month.
The correction in prices was a result of a 3-point increase in interest rates over the second half of 2022. Data shows the market has recalibrated in 2023 which has increased buyer demand as consumers have become more comfortable with the “new normal”. This has caused prices to stabilize and start to grow month-over-month since January. Days on market are shrinking and sale prices are averaging closer to the list prices, and in some cases are escalating over the list price. It has been an eventful past year highlighting the importance of real-time, accurate information to help empower strong decisions. Moves are motivated by life changes, lifestyle goals, and strategic financial planning. If you or someone you know is curious about how the market relates to these needs, please reach out.
QUARTERLY REPORTS Q4 2022

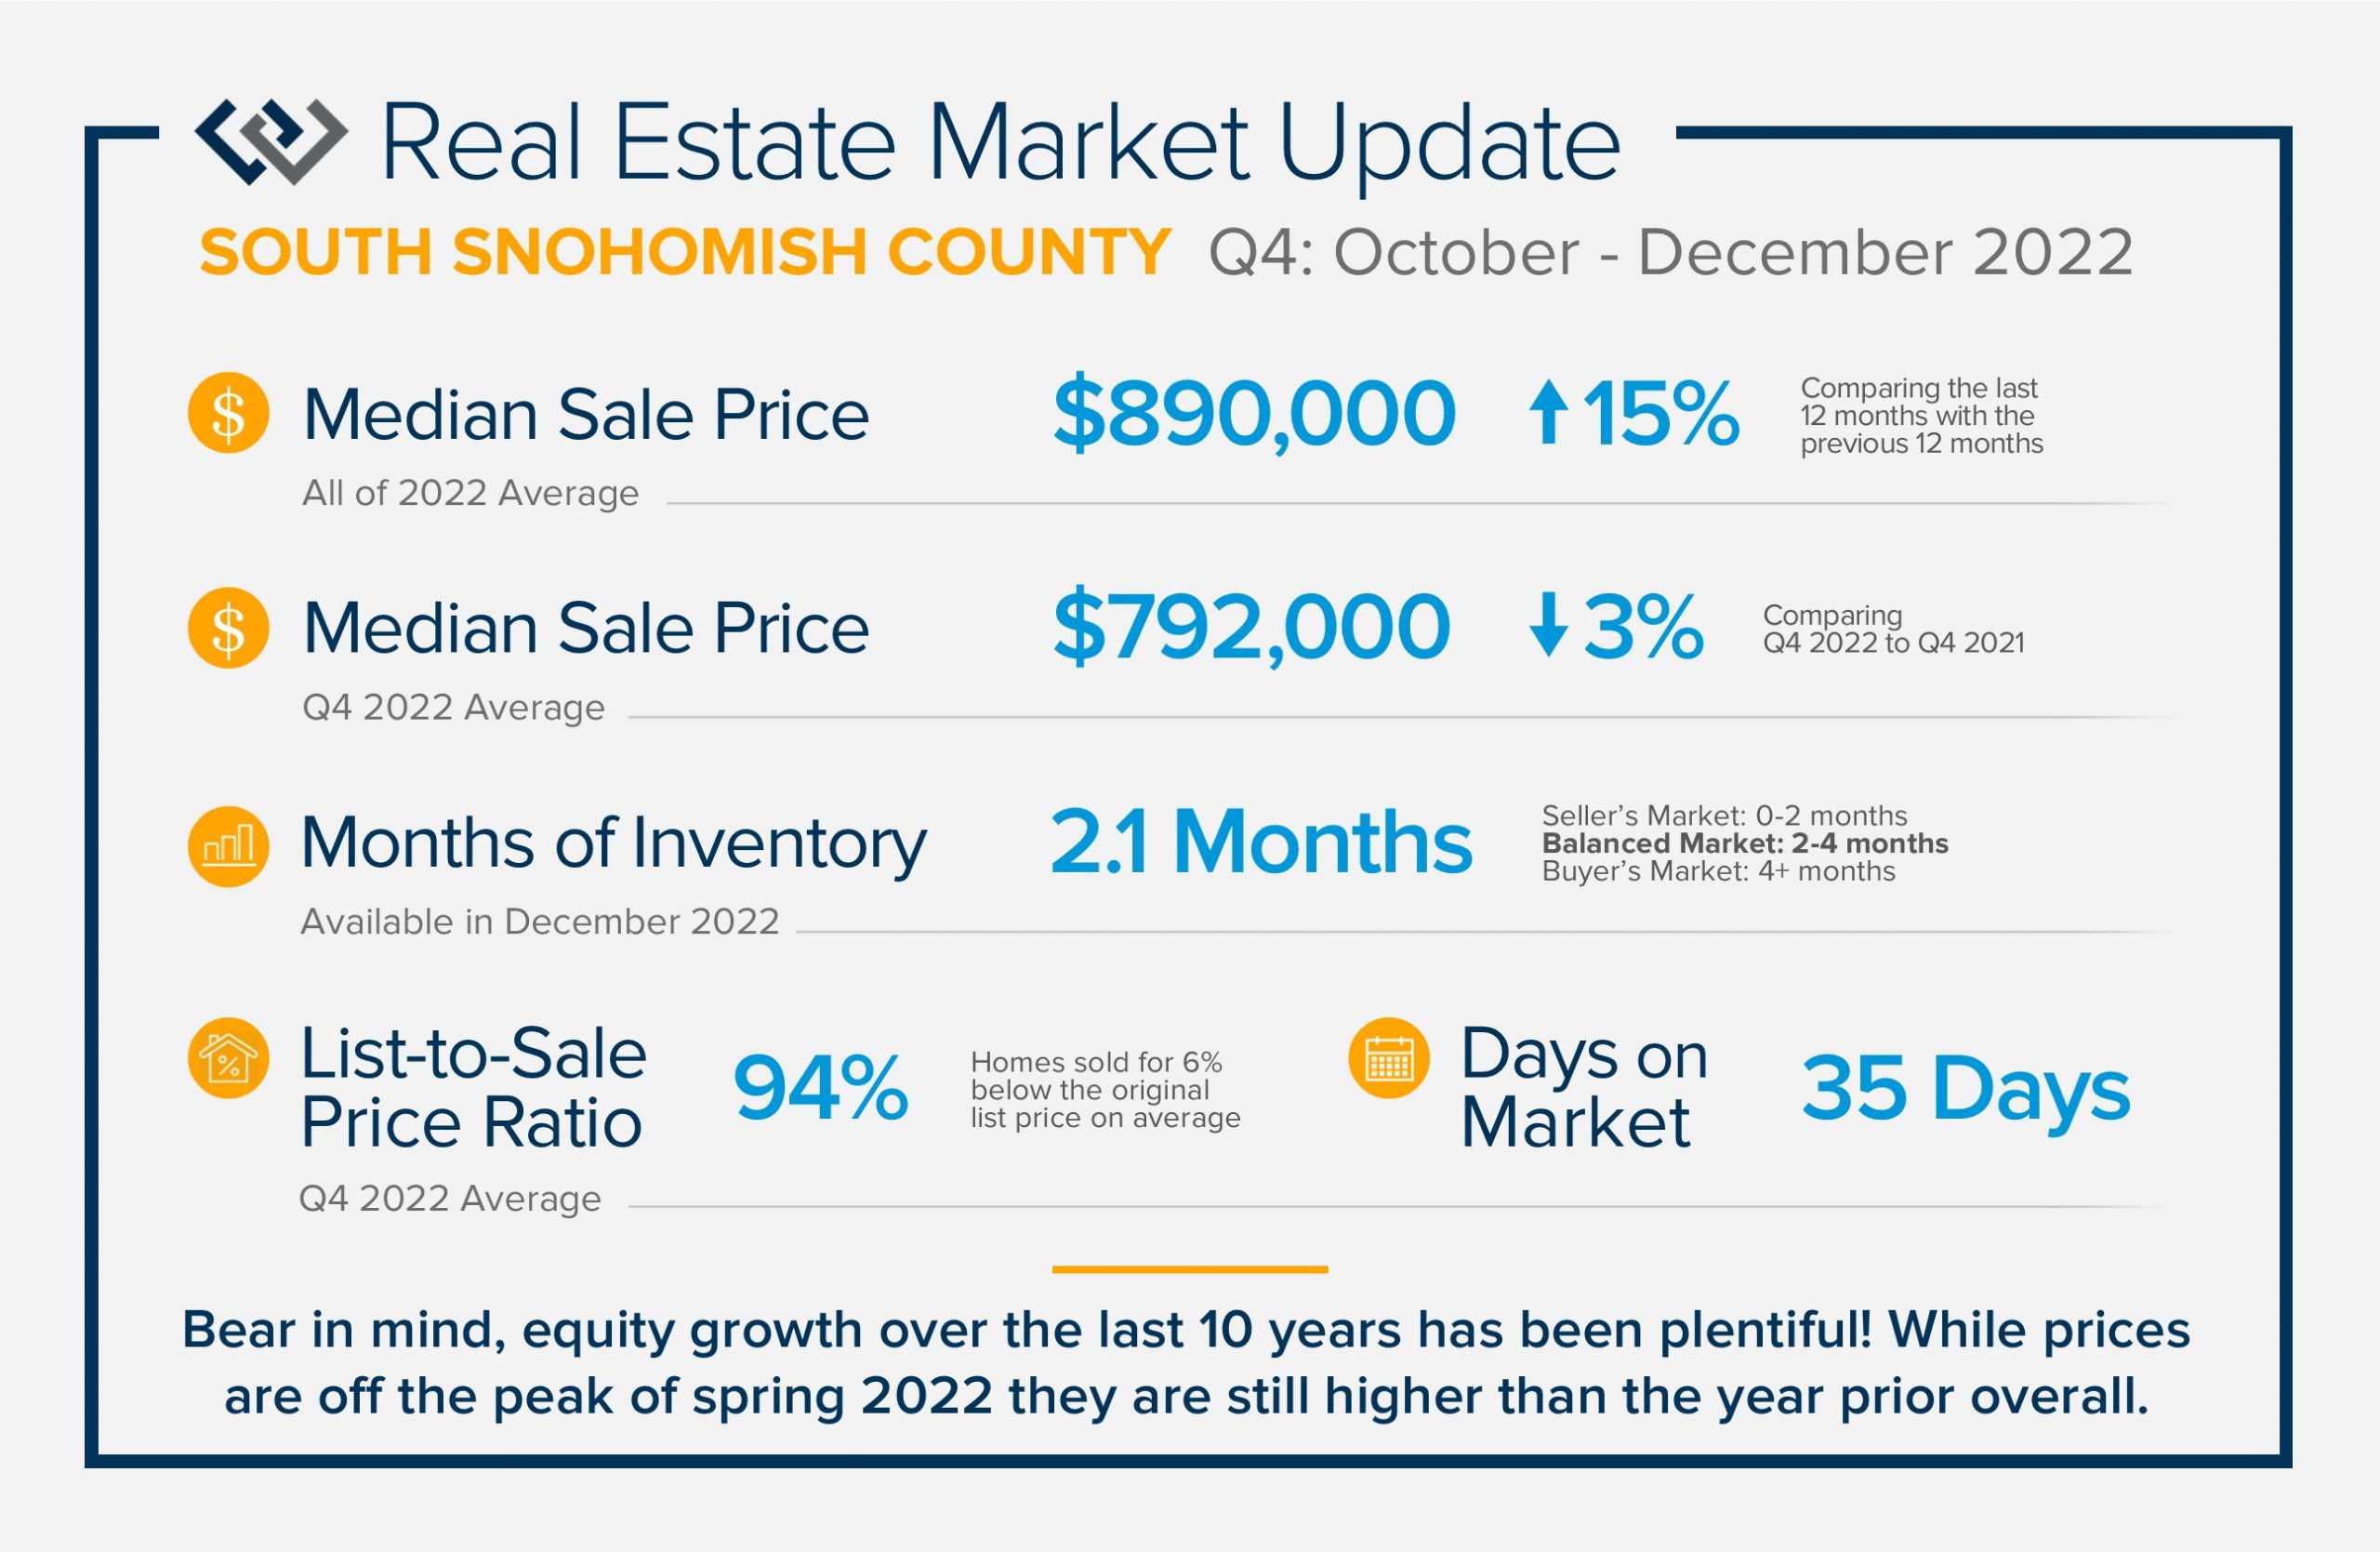
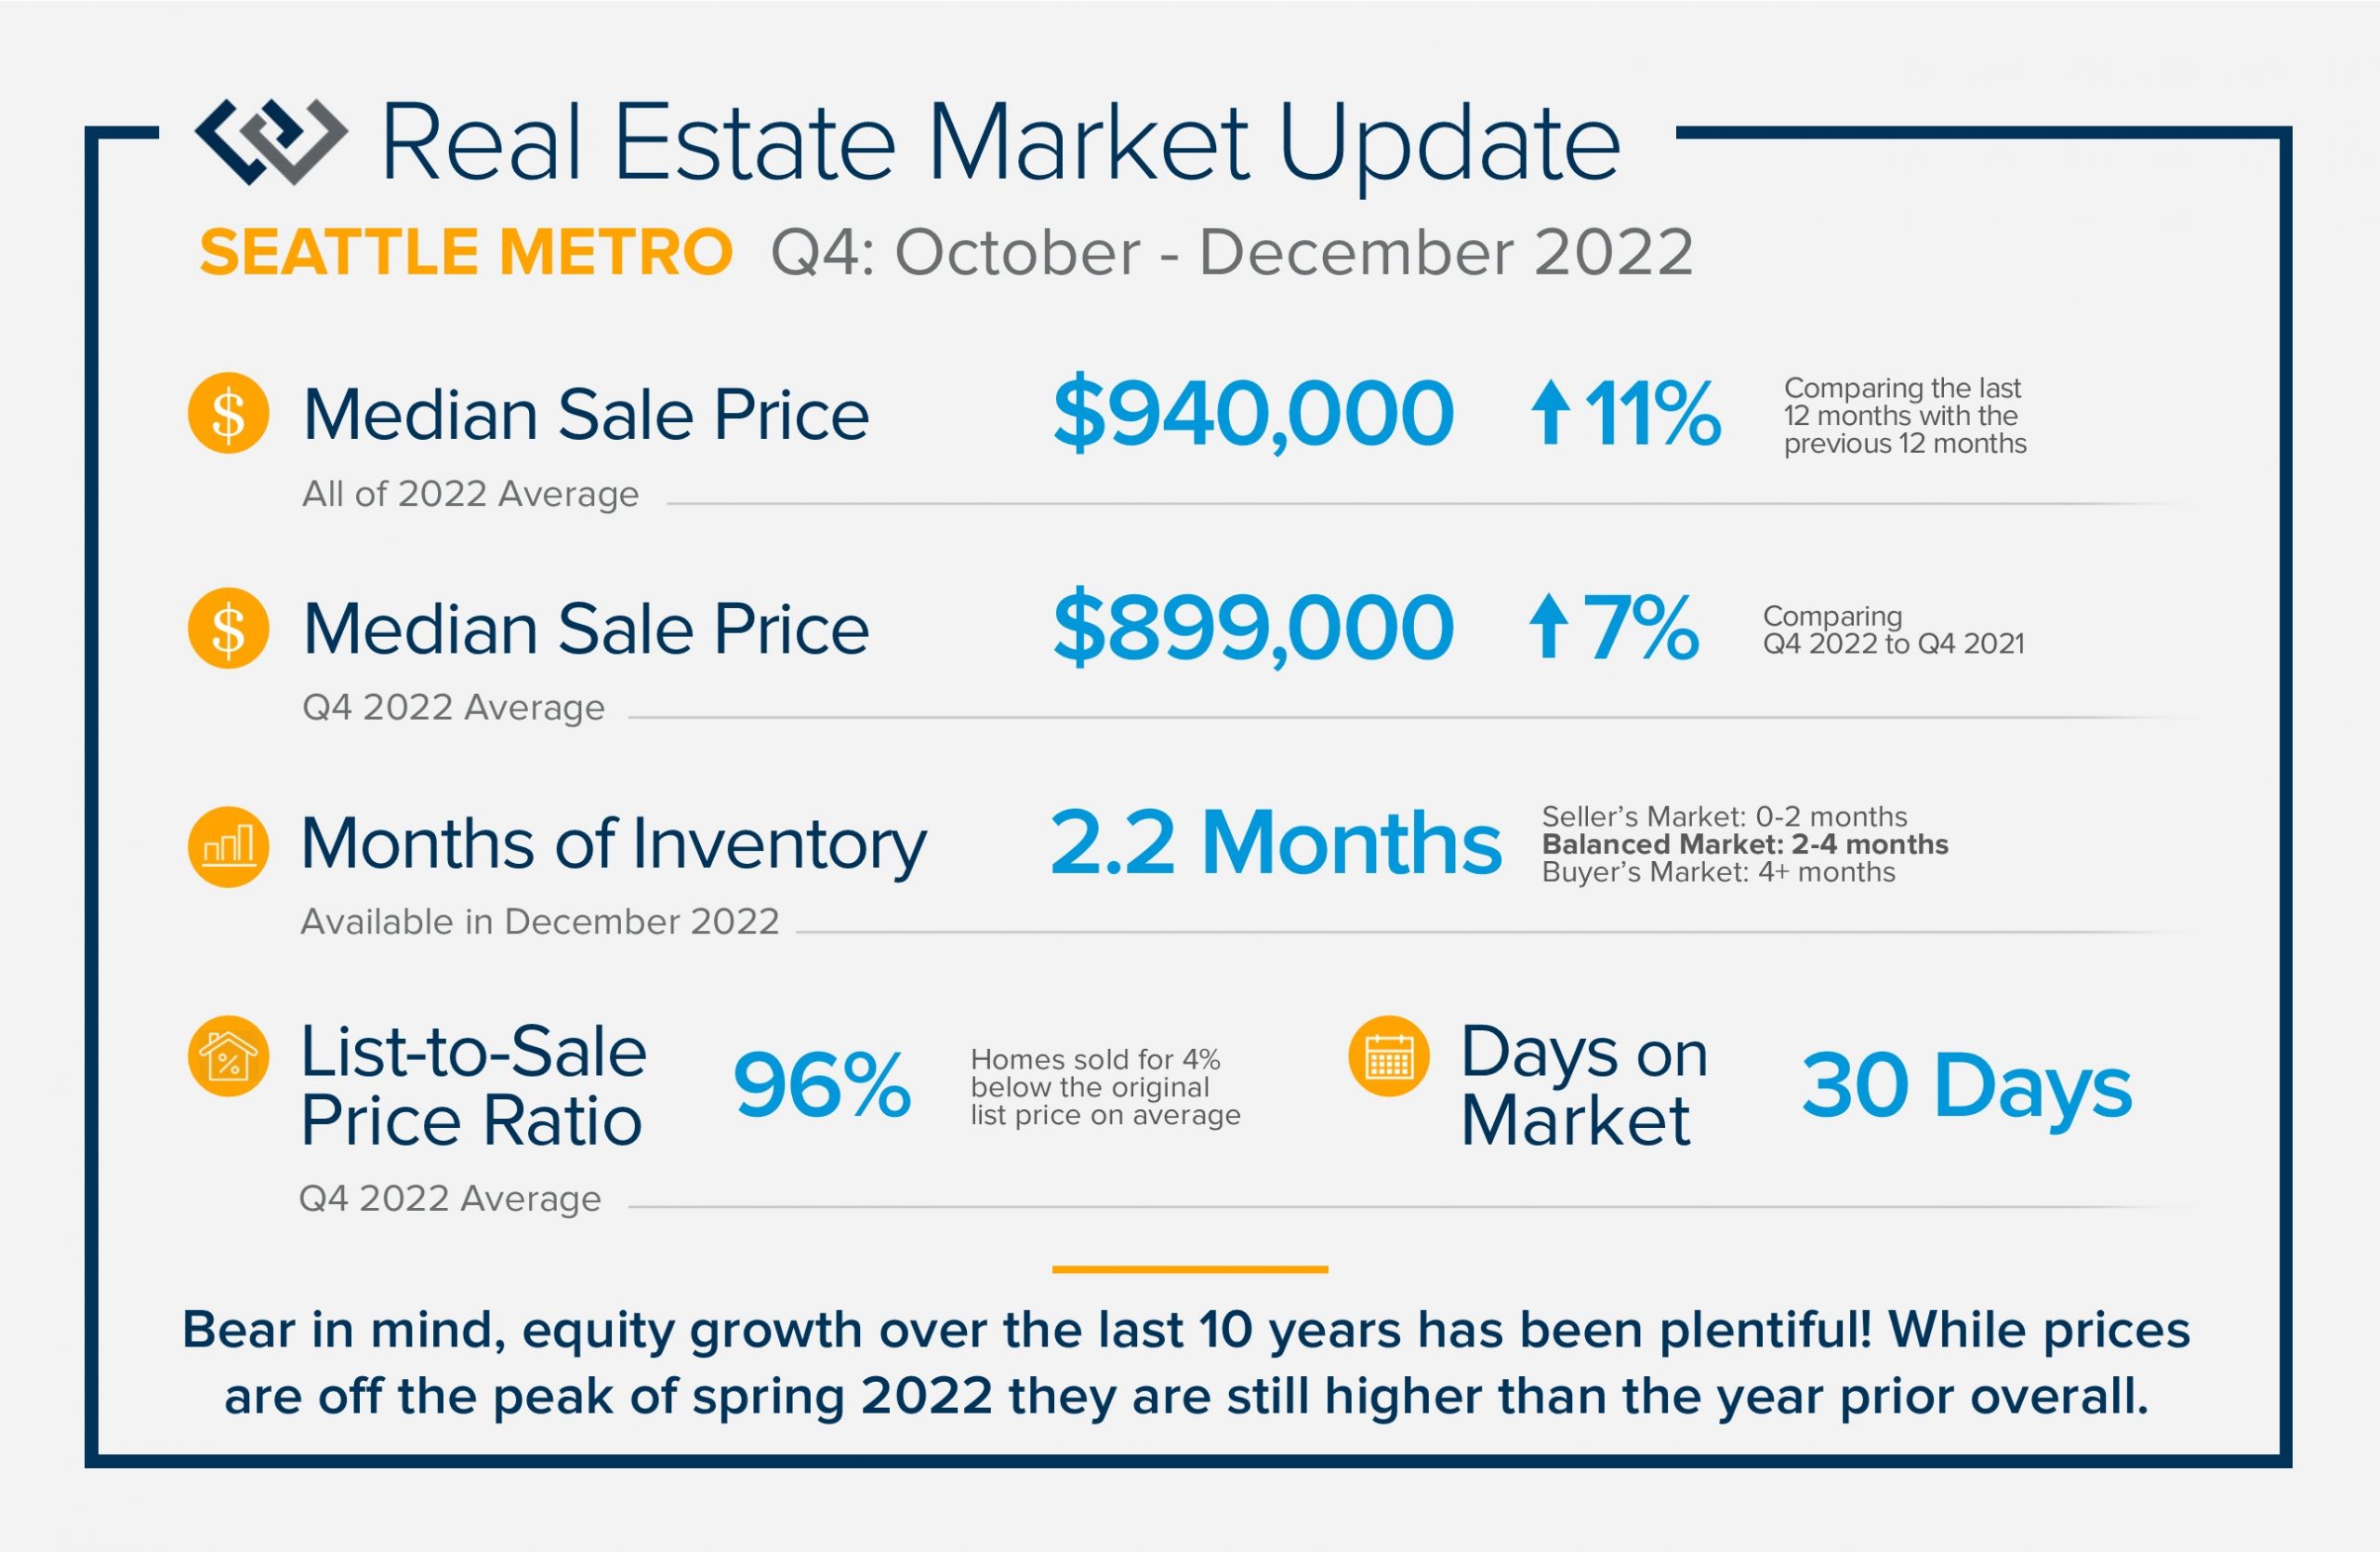
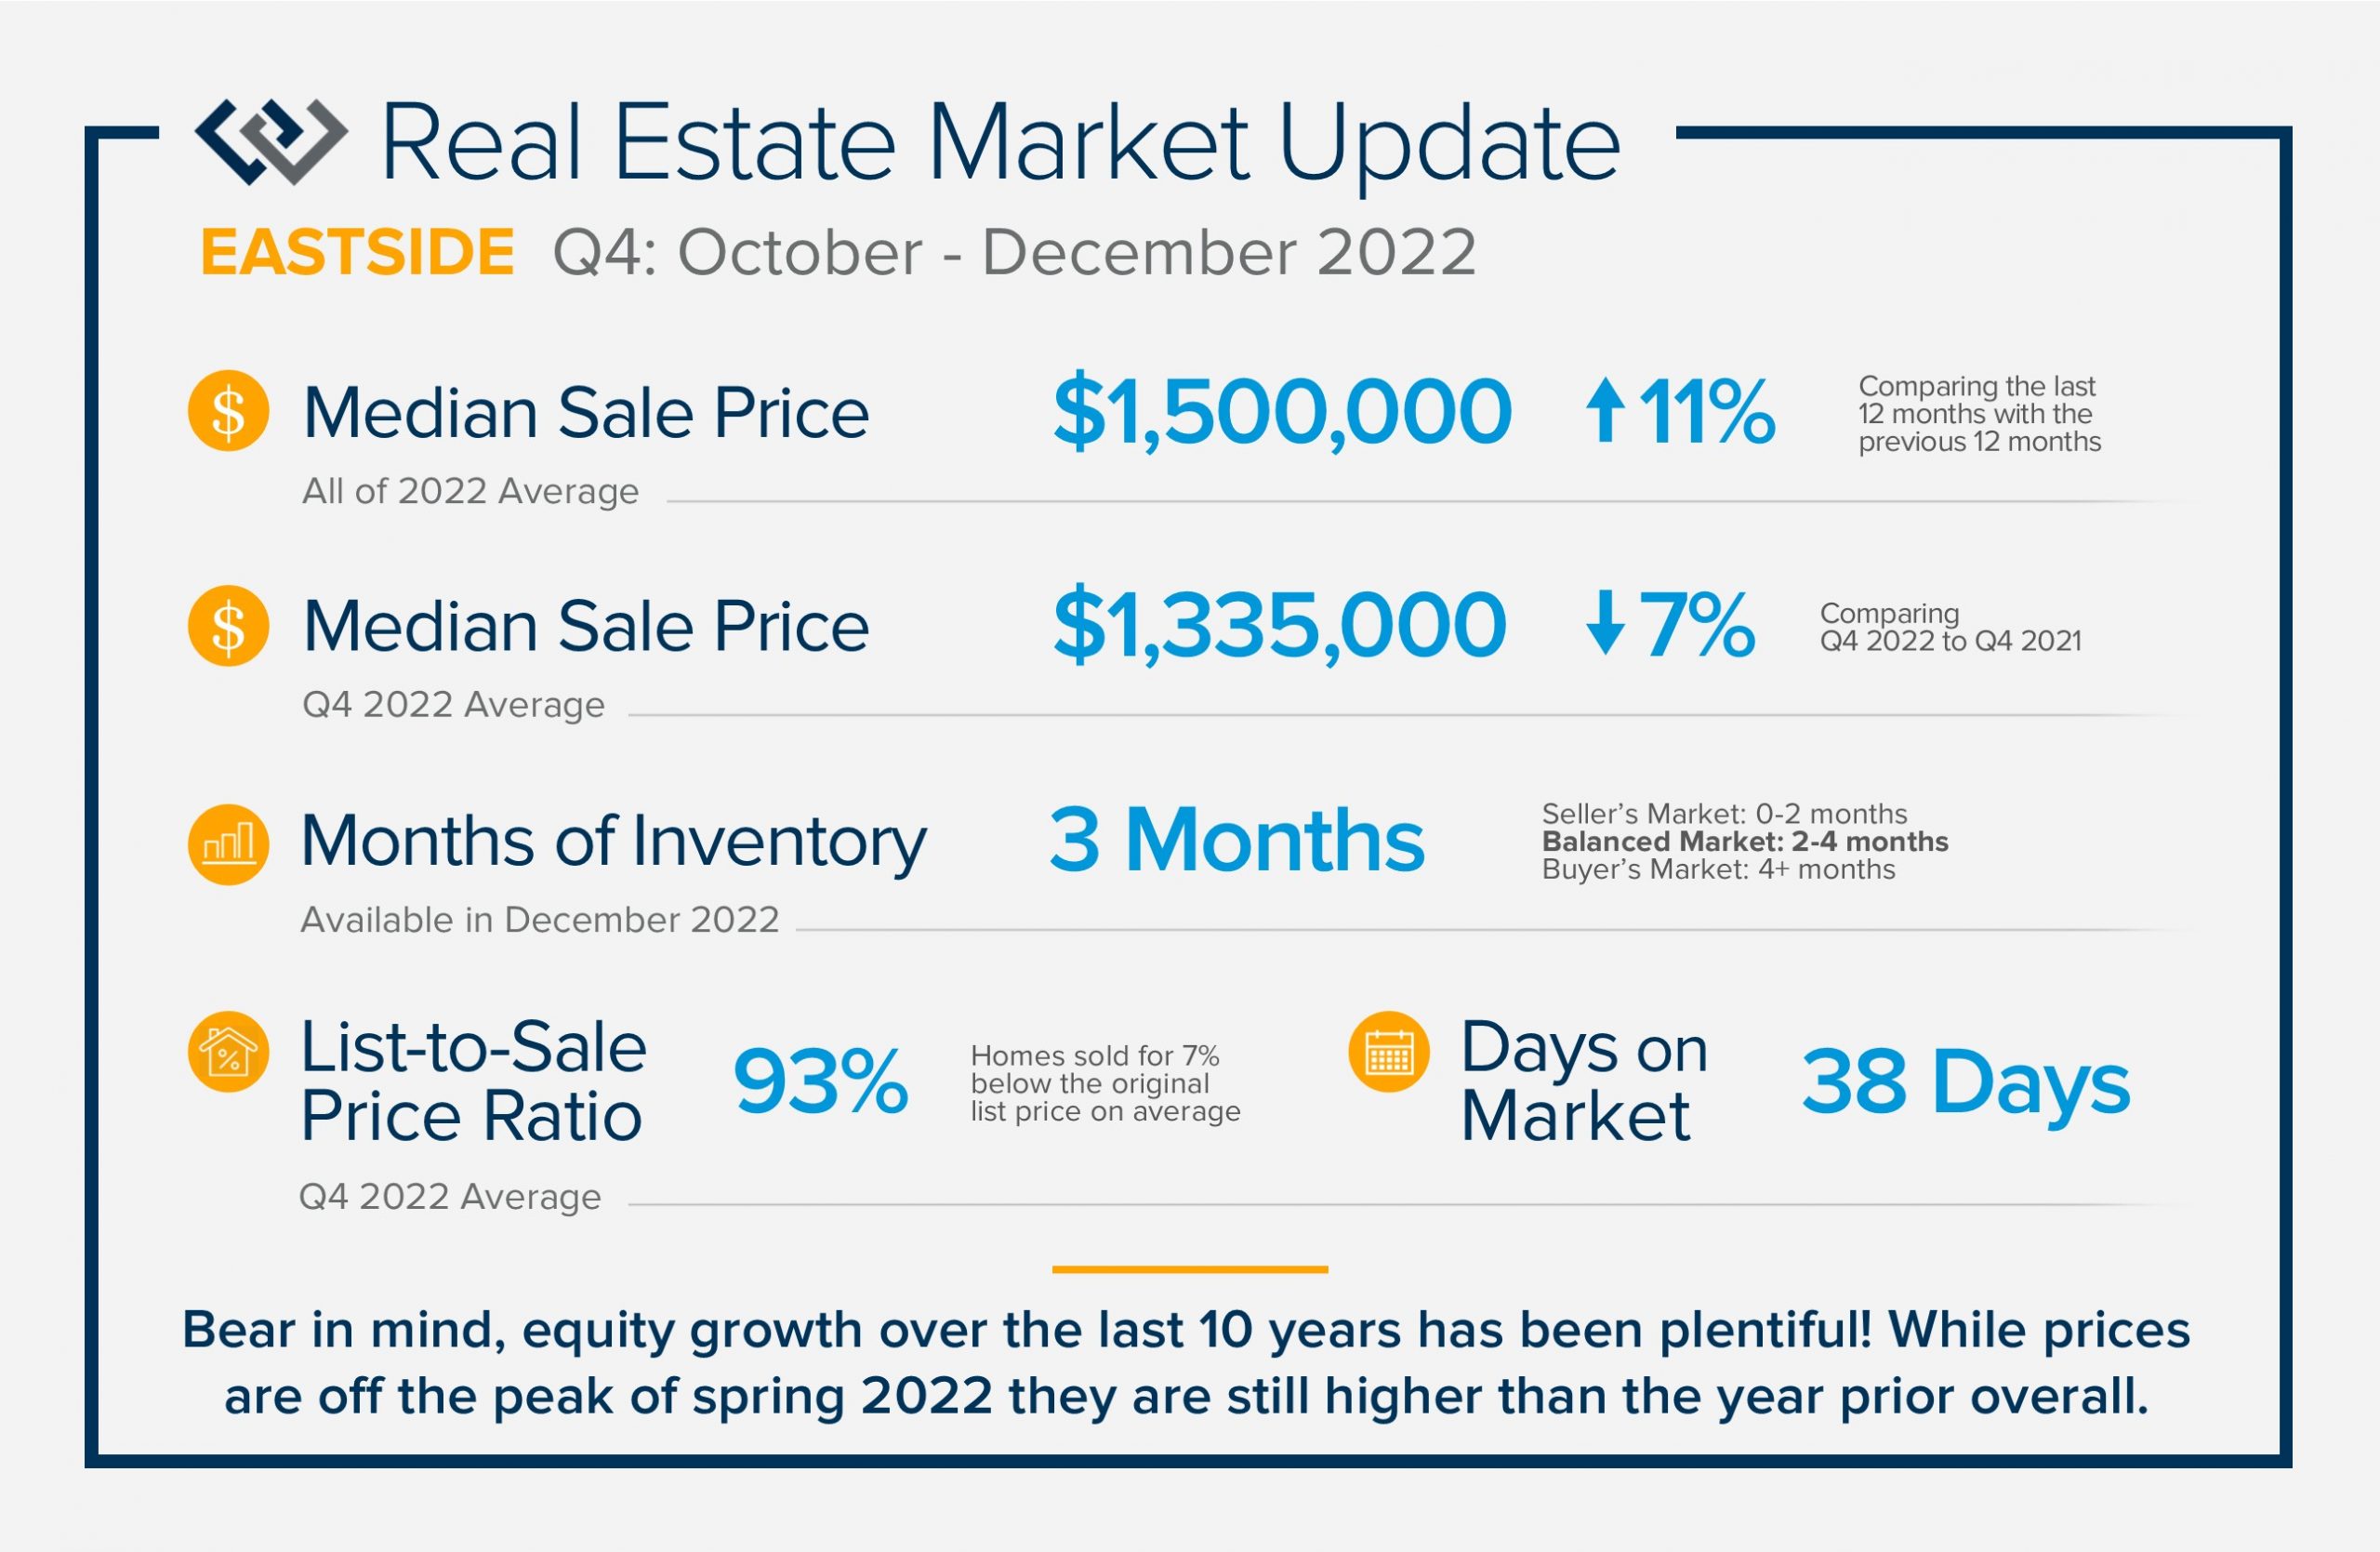
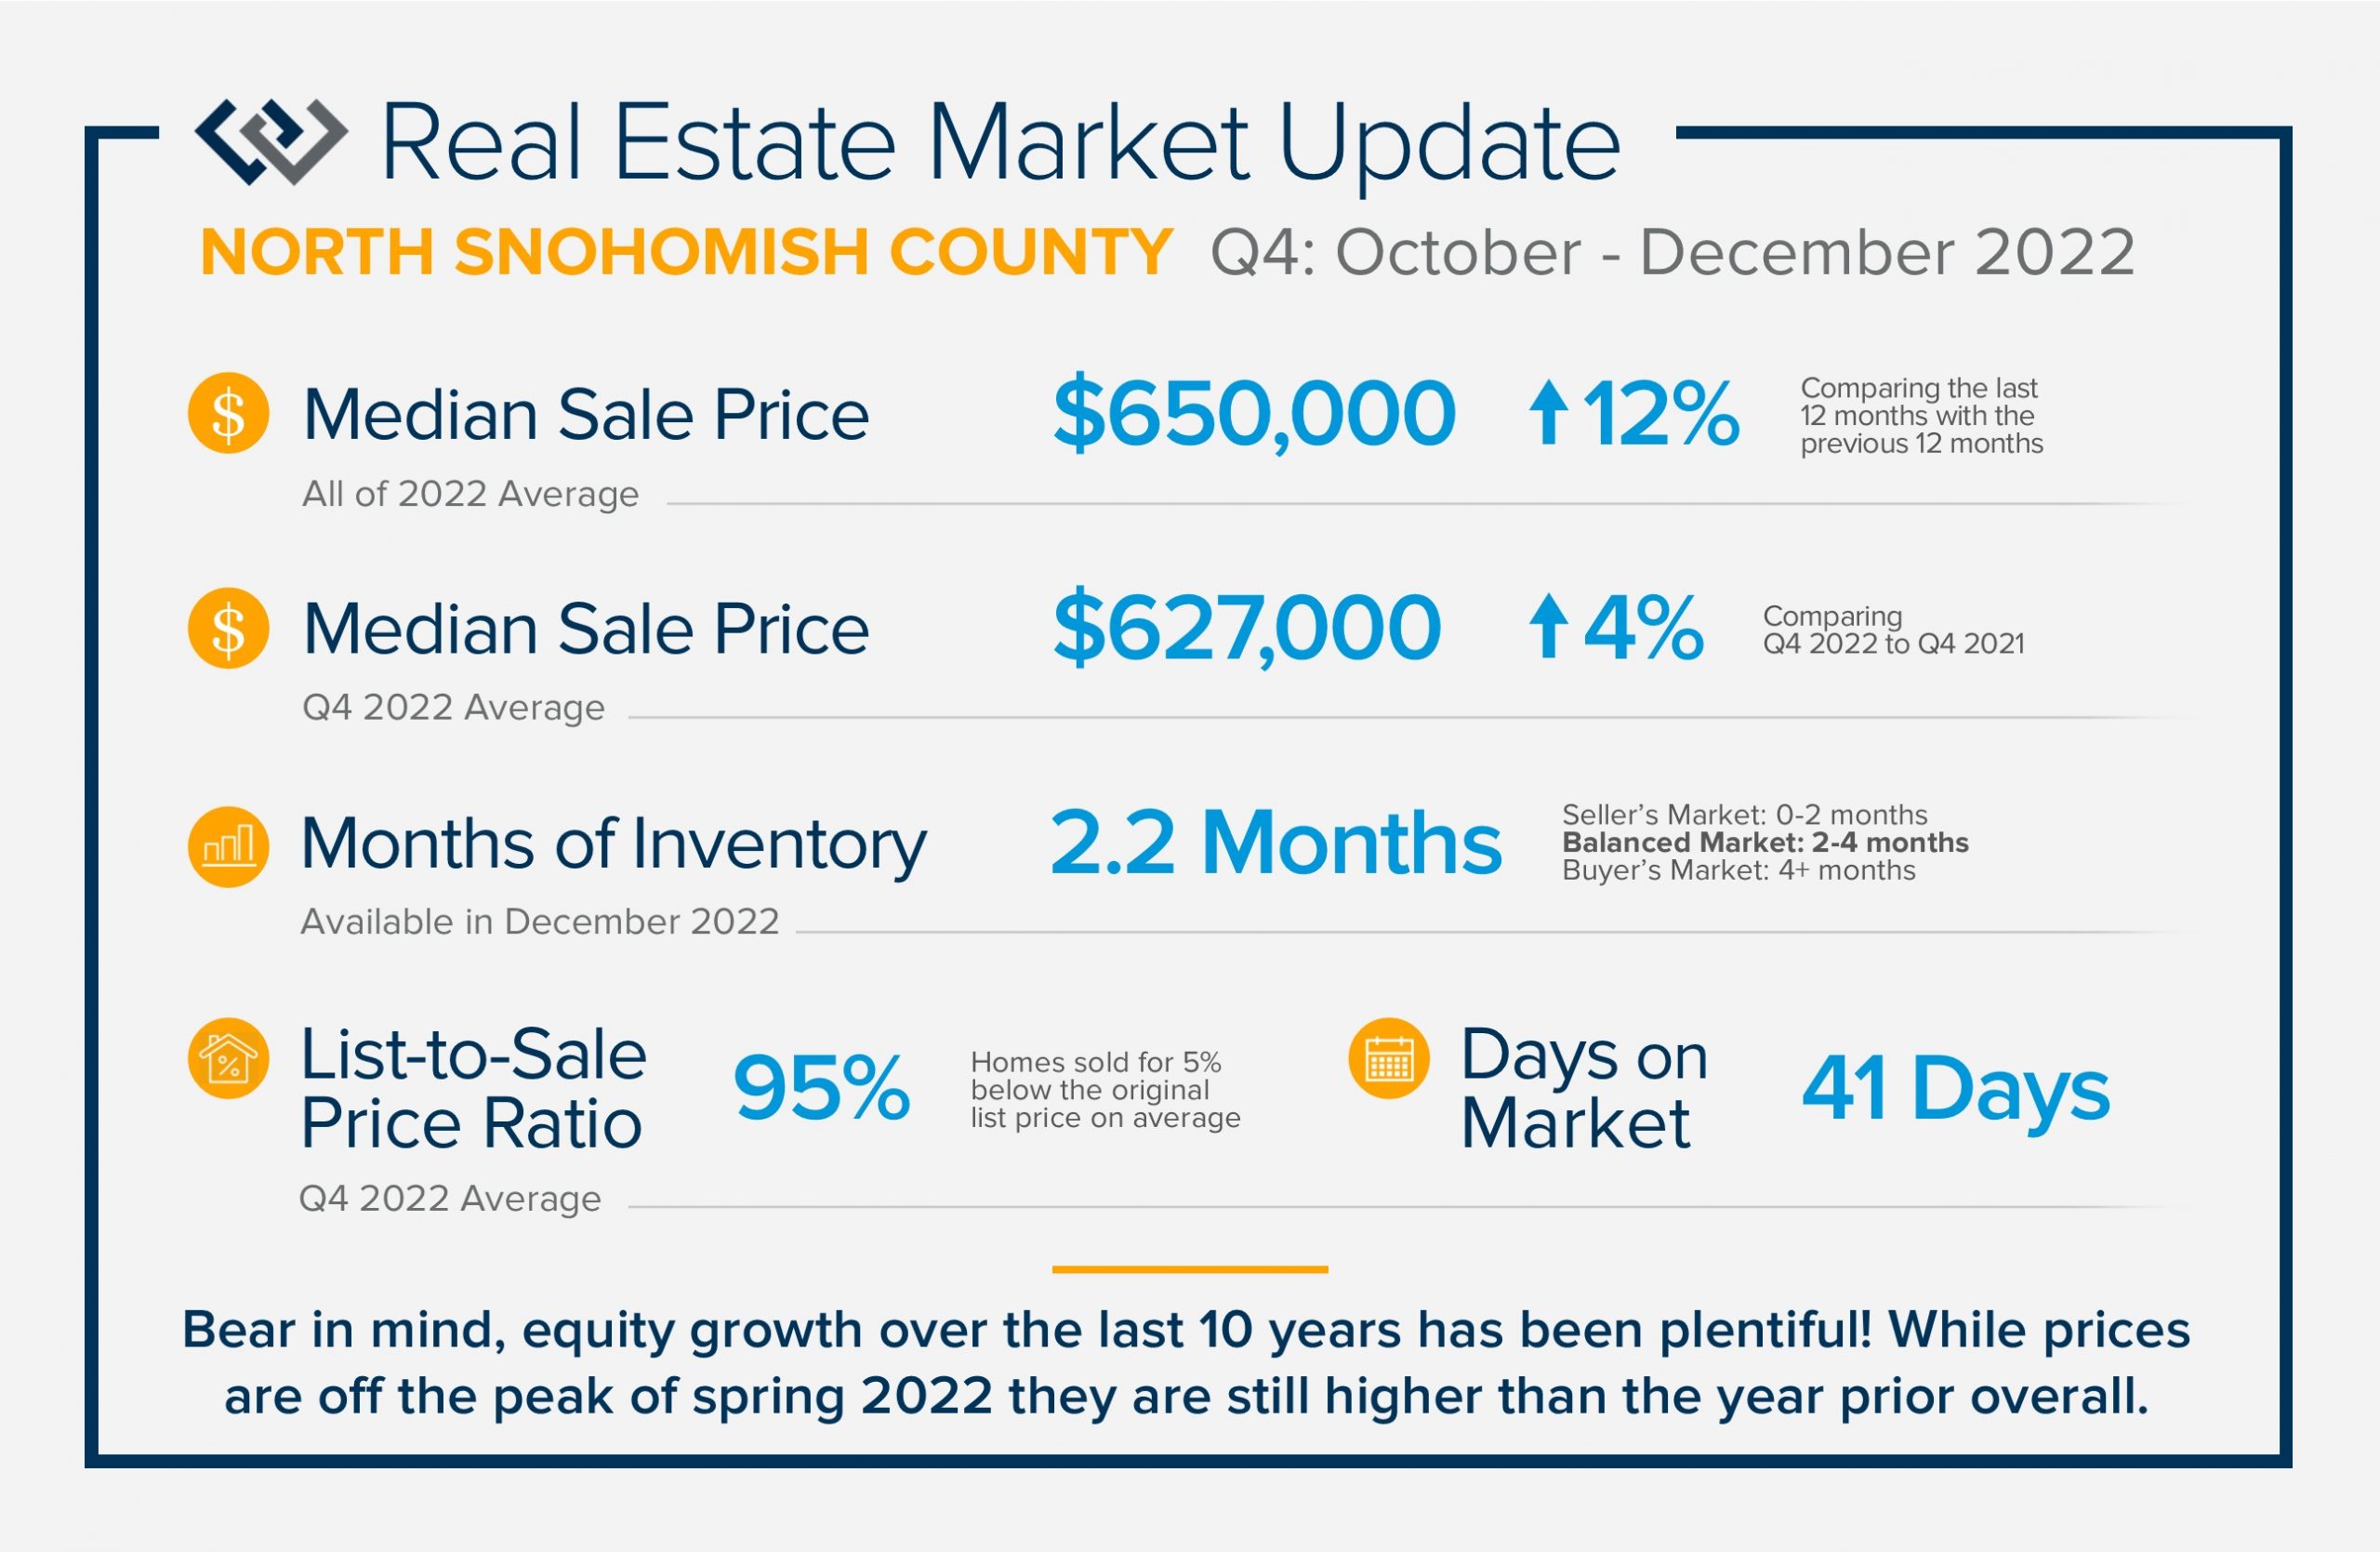
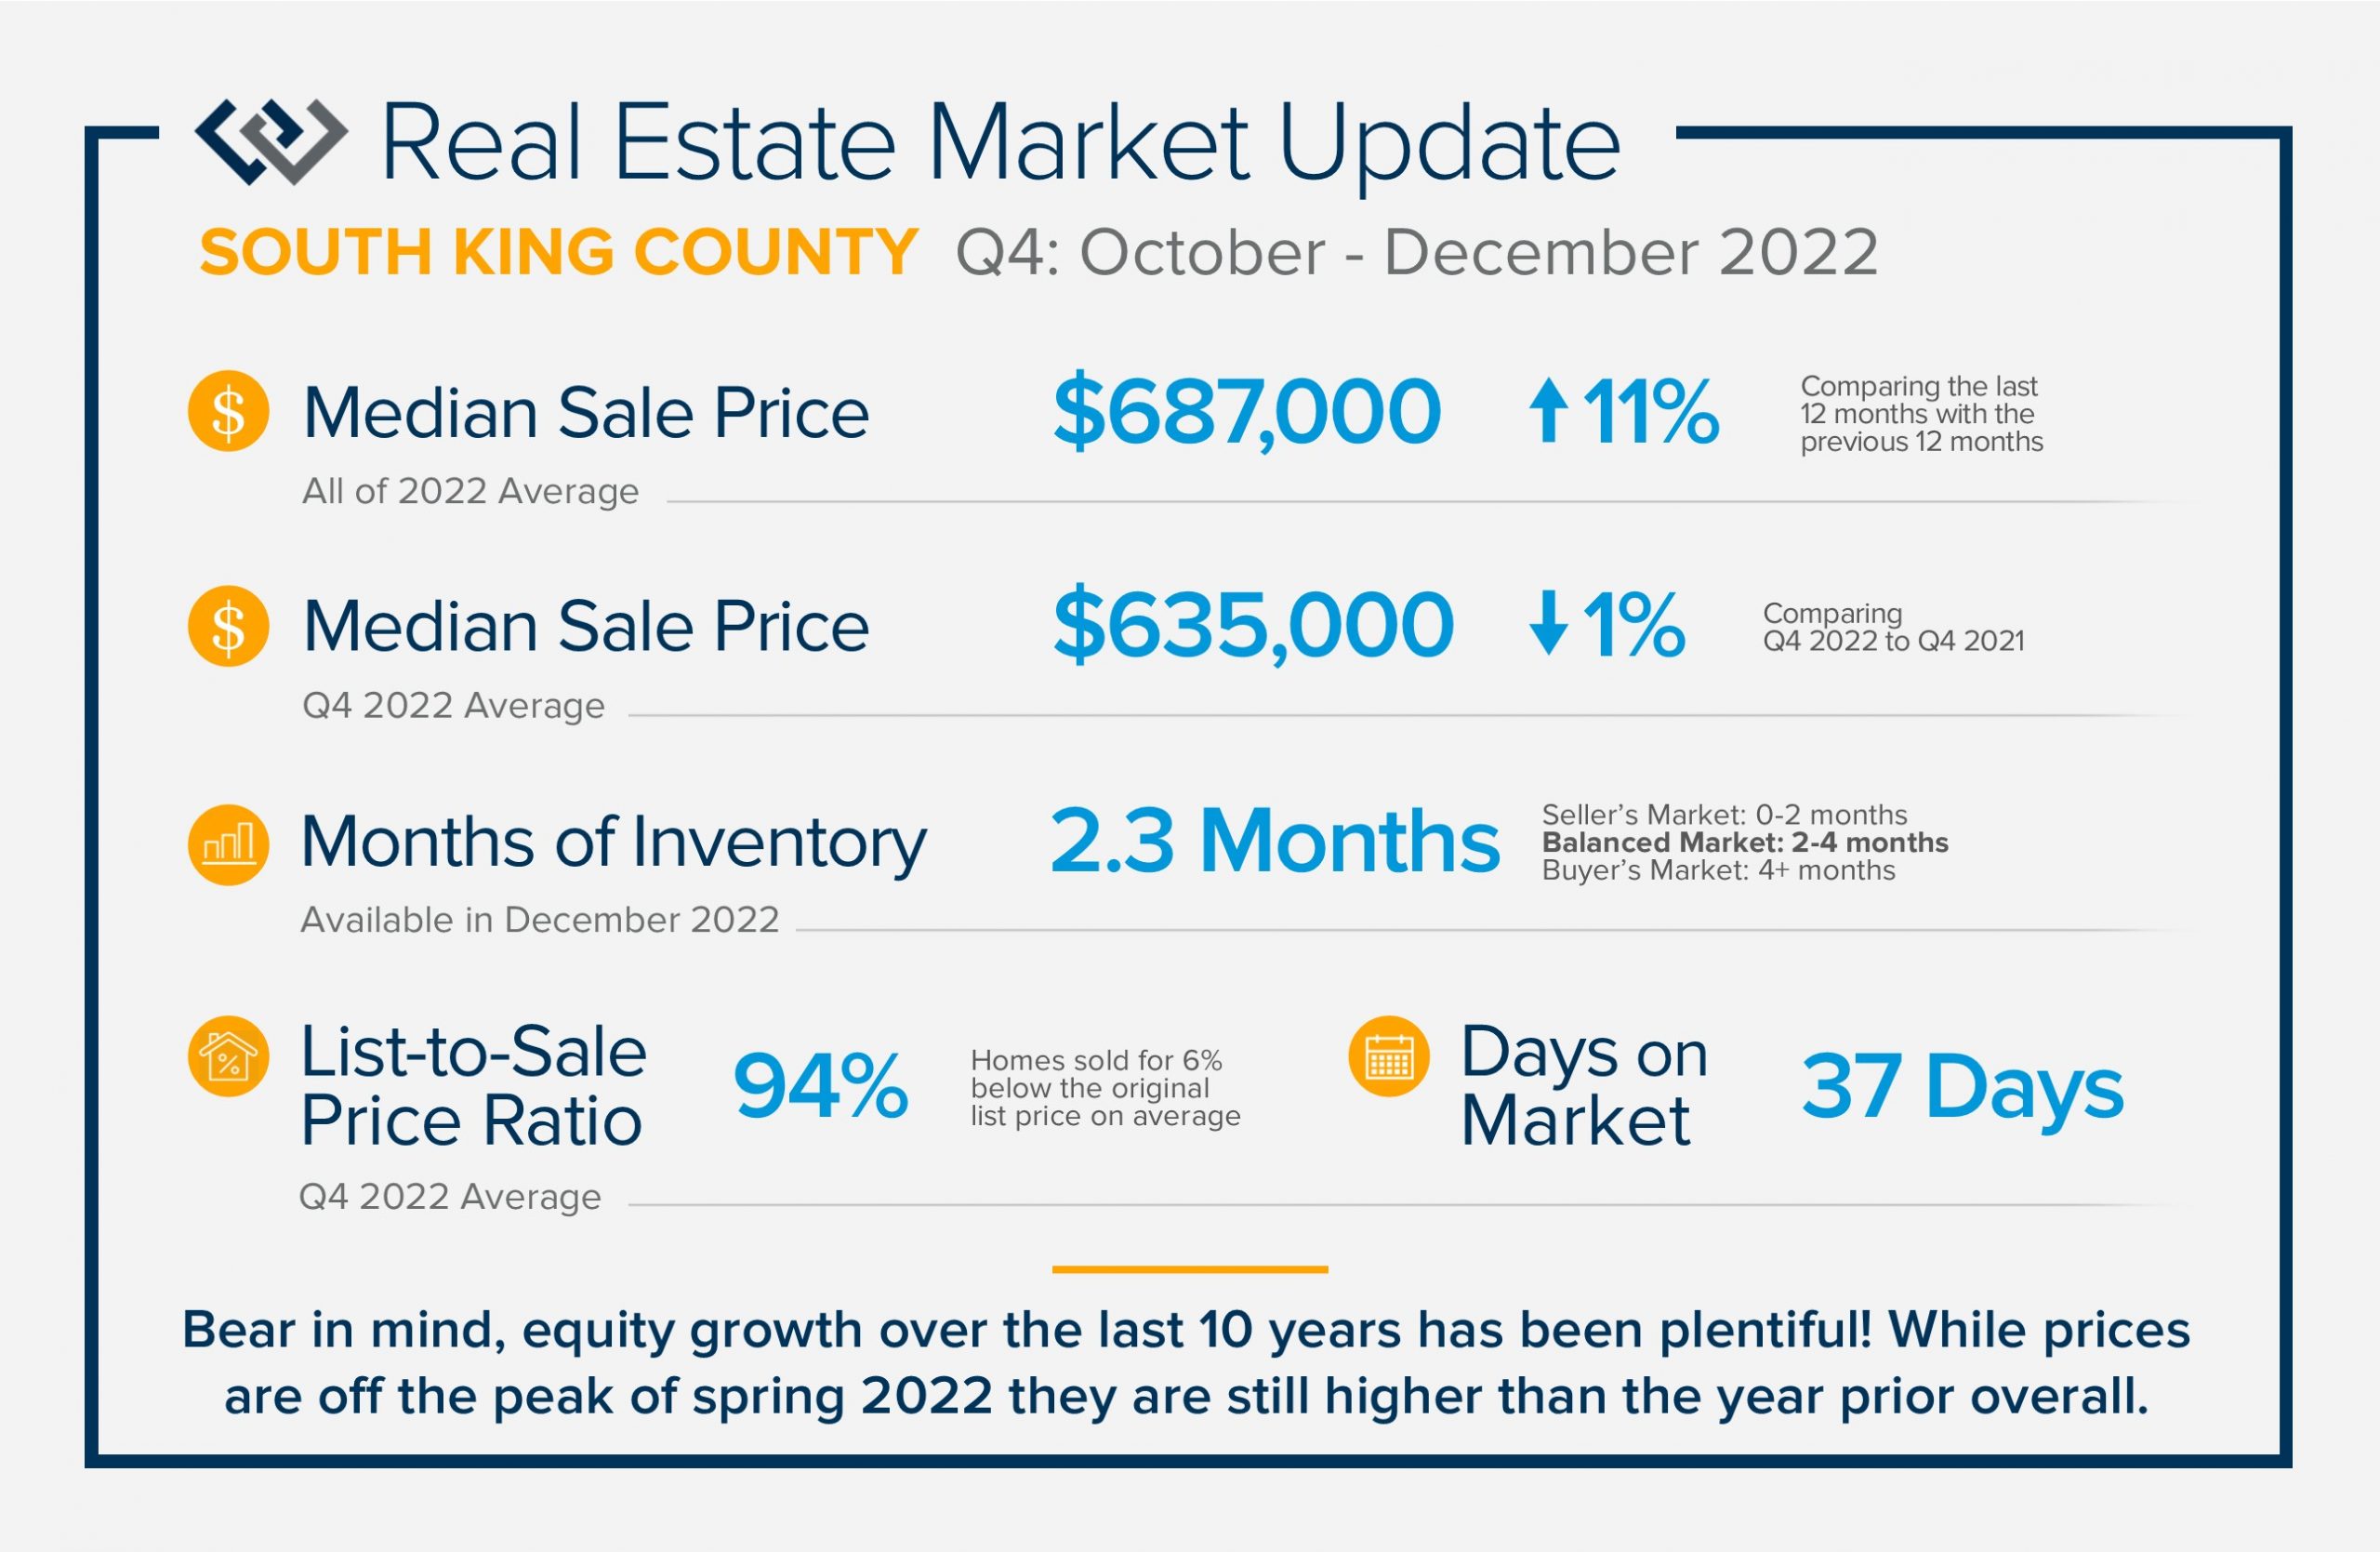
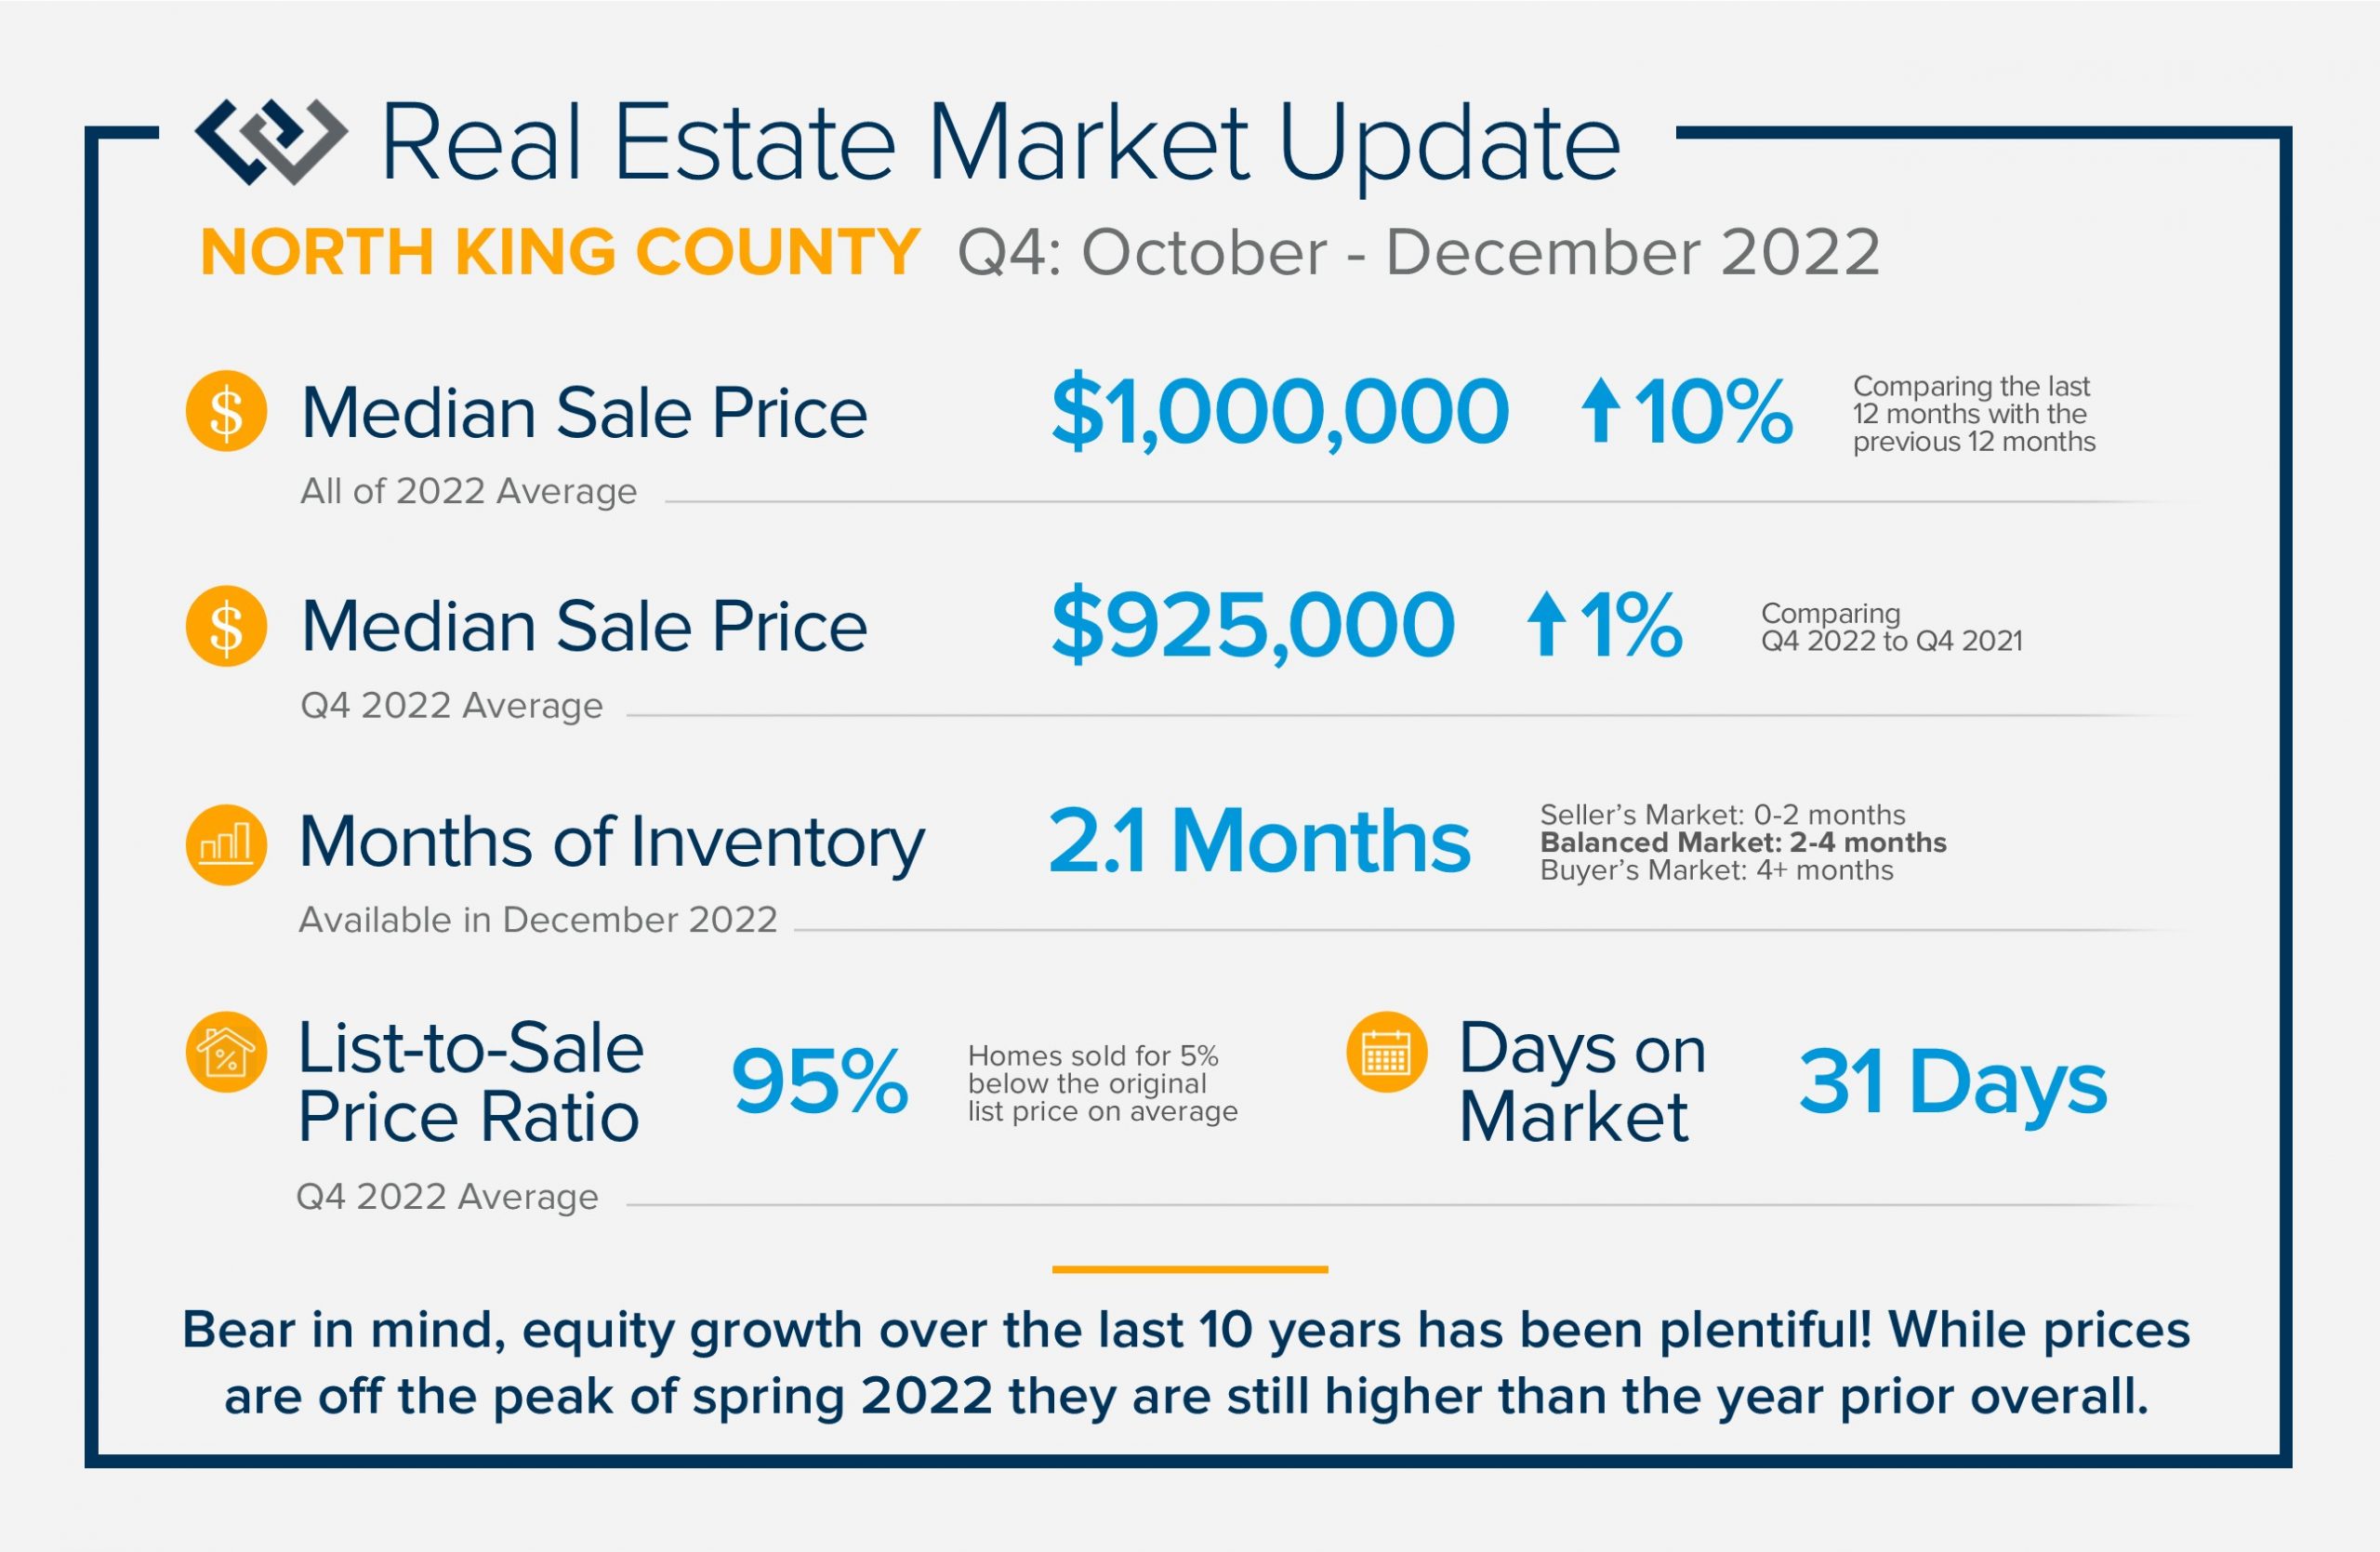 2022 was a transitional year for the real estate market that started off incredibly seller-centric and ended in balance. We started 2022 with interest rates hovering in the low 3%, peaked at 7% in late fall, and ended the year hovering in the mid 6%. This significant jump created a correction in home prices as the cost to finance a home affected affordability. Bear in mind, equity growth over the last 10 years has been plentiful! While prices are off the peak of spring 2022, they are still higher than the year prior overall. 2022 became a more traditional market with interest rates in line with historical averages, more available inventory, and the return of contract contingencies and concessions for buyers. This balance has increased days on market, highlighted the importance of accurate pricing, and made the best-prepared homes shine.
Experts anticipate rates to continue to improve throughout 2023 and buyer demand to grow. Buyers that are looking to enter the market should engage now. Price growth may be flat as we adjust to these norms and then should start to maintain historical annual appreciation rates closer to 2-5% year-over-year after years of double-digit annual growth. If you are curious about how the market affects your housing goals, please reach out. It is my goal to help keep my clients informed and empower strong decisions.
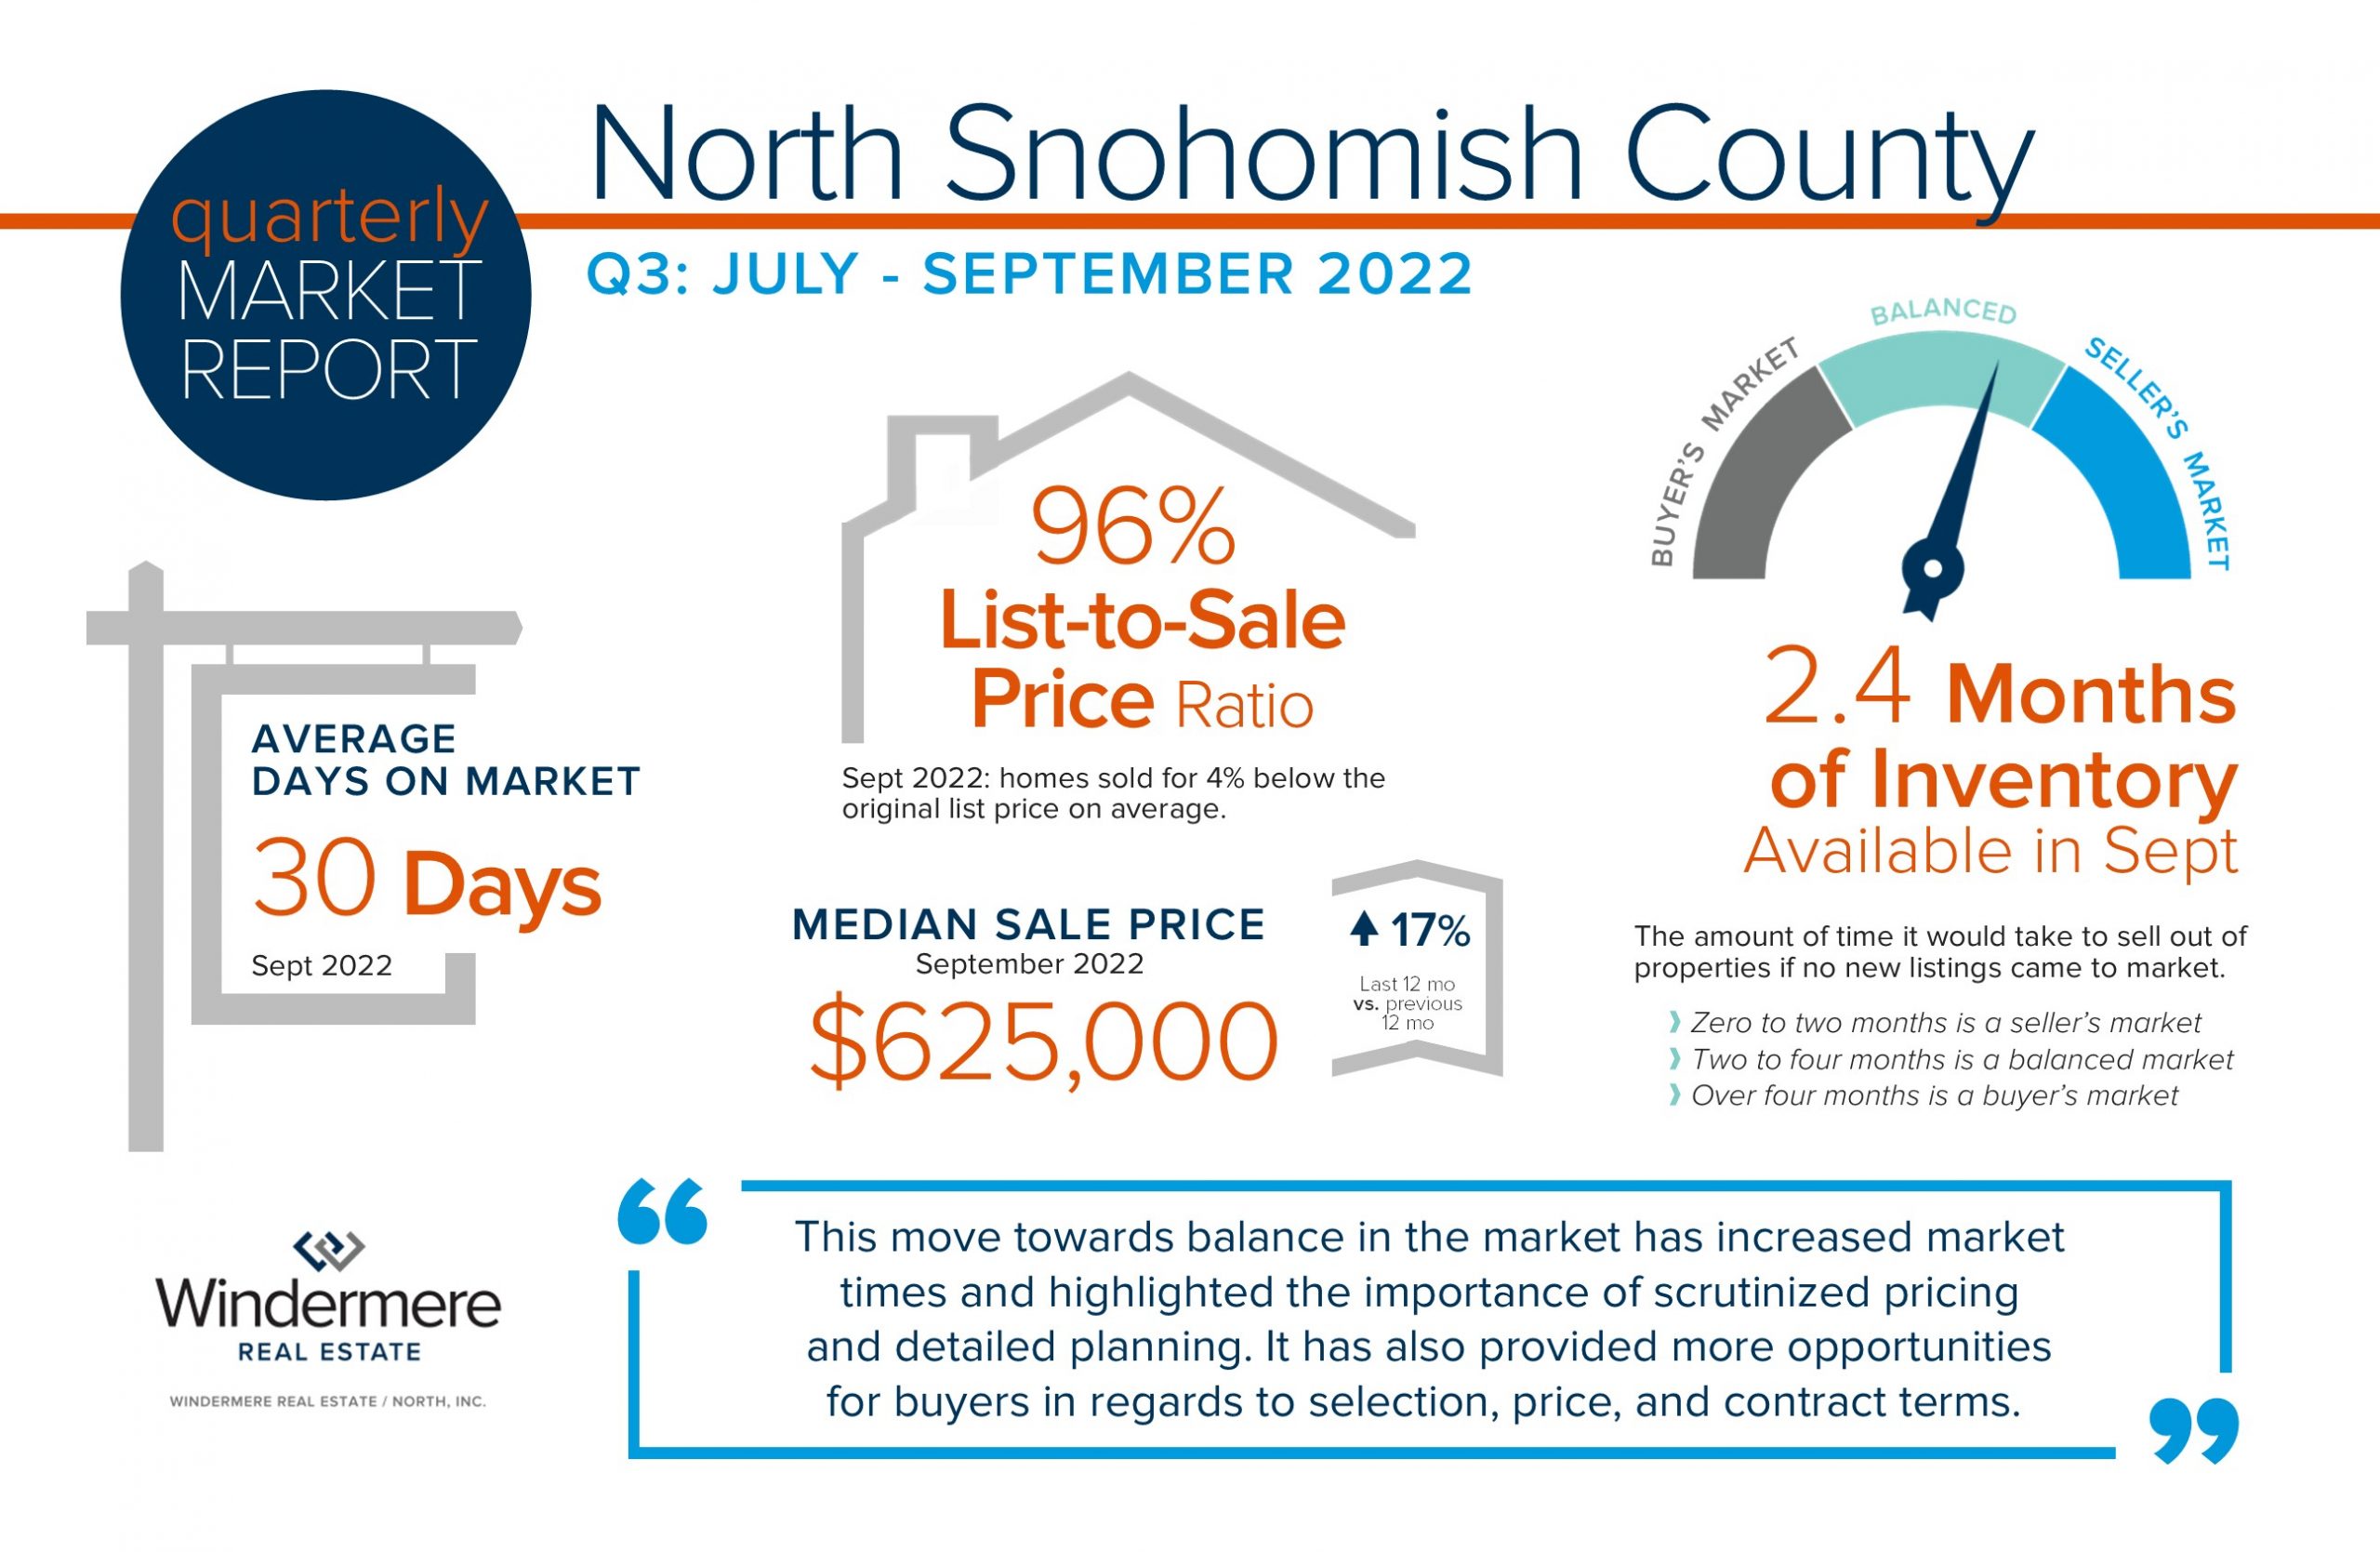
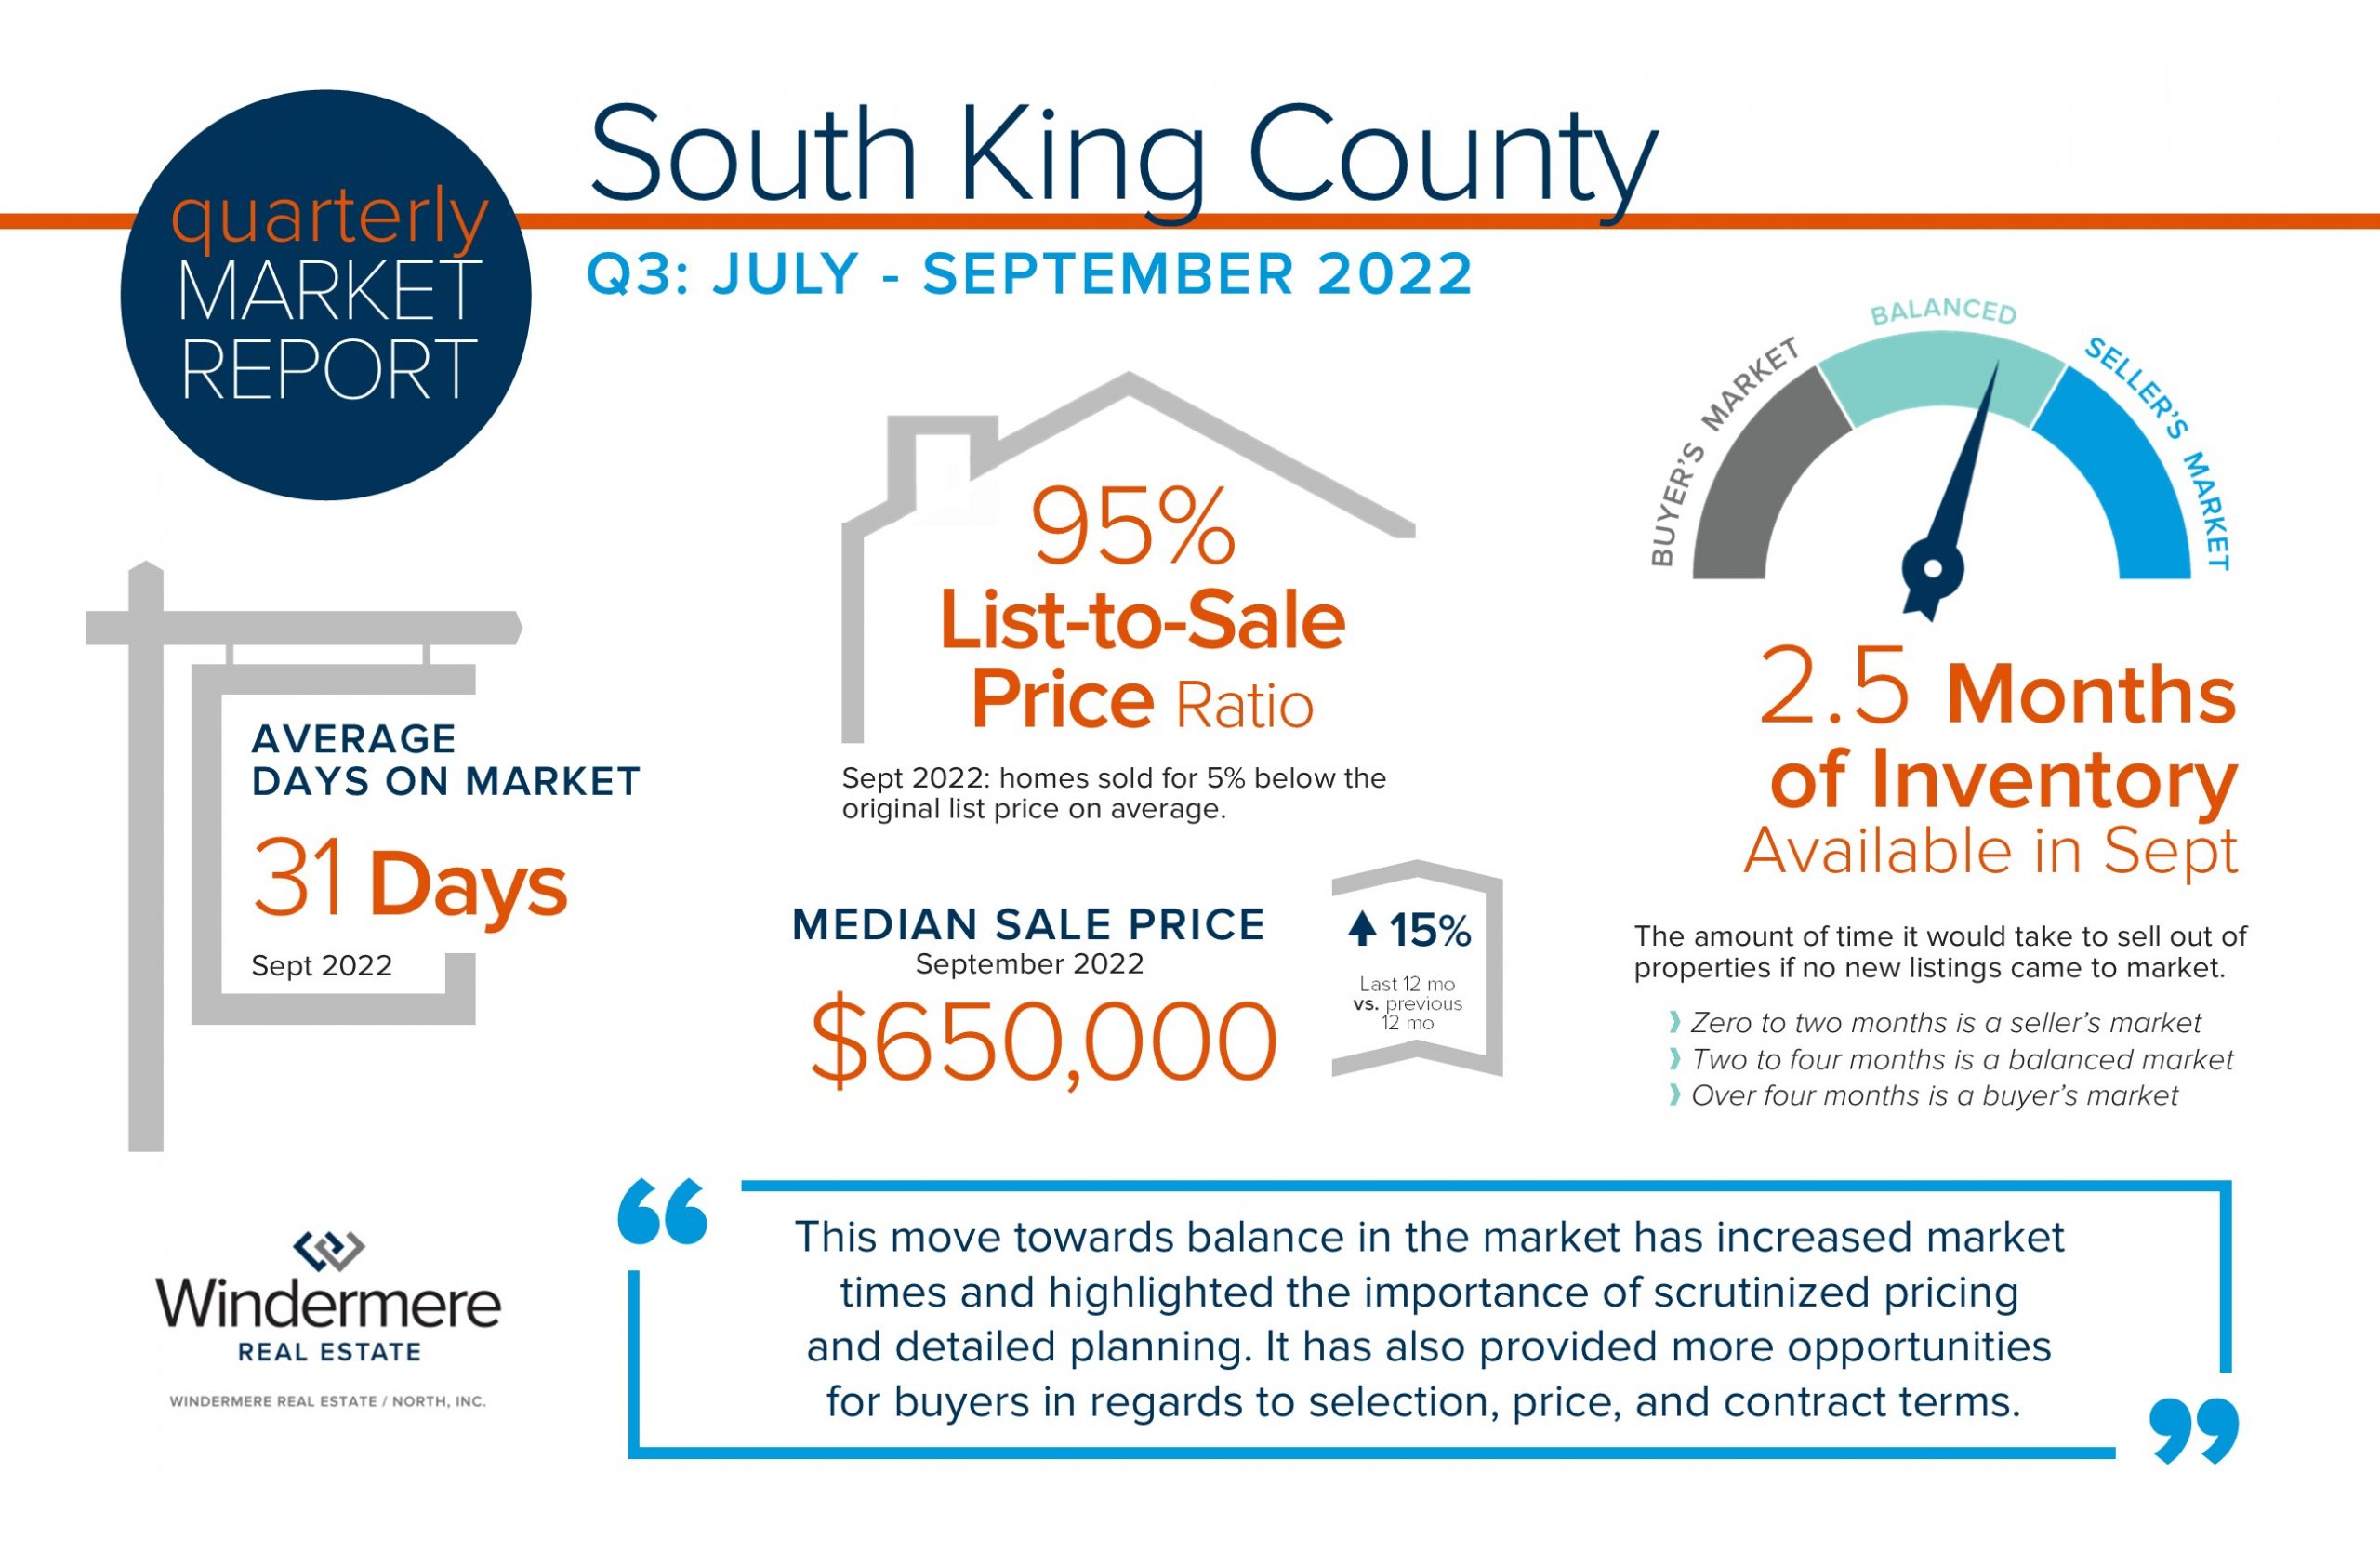
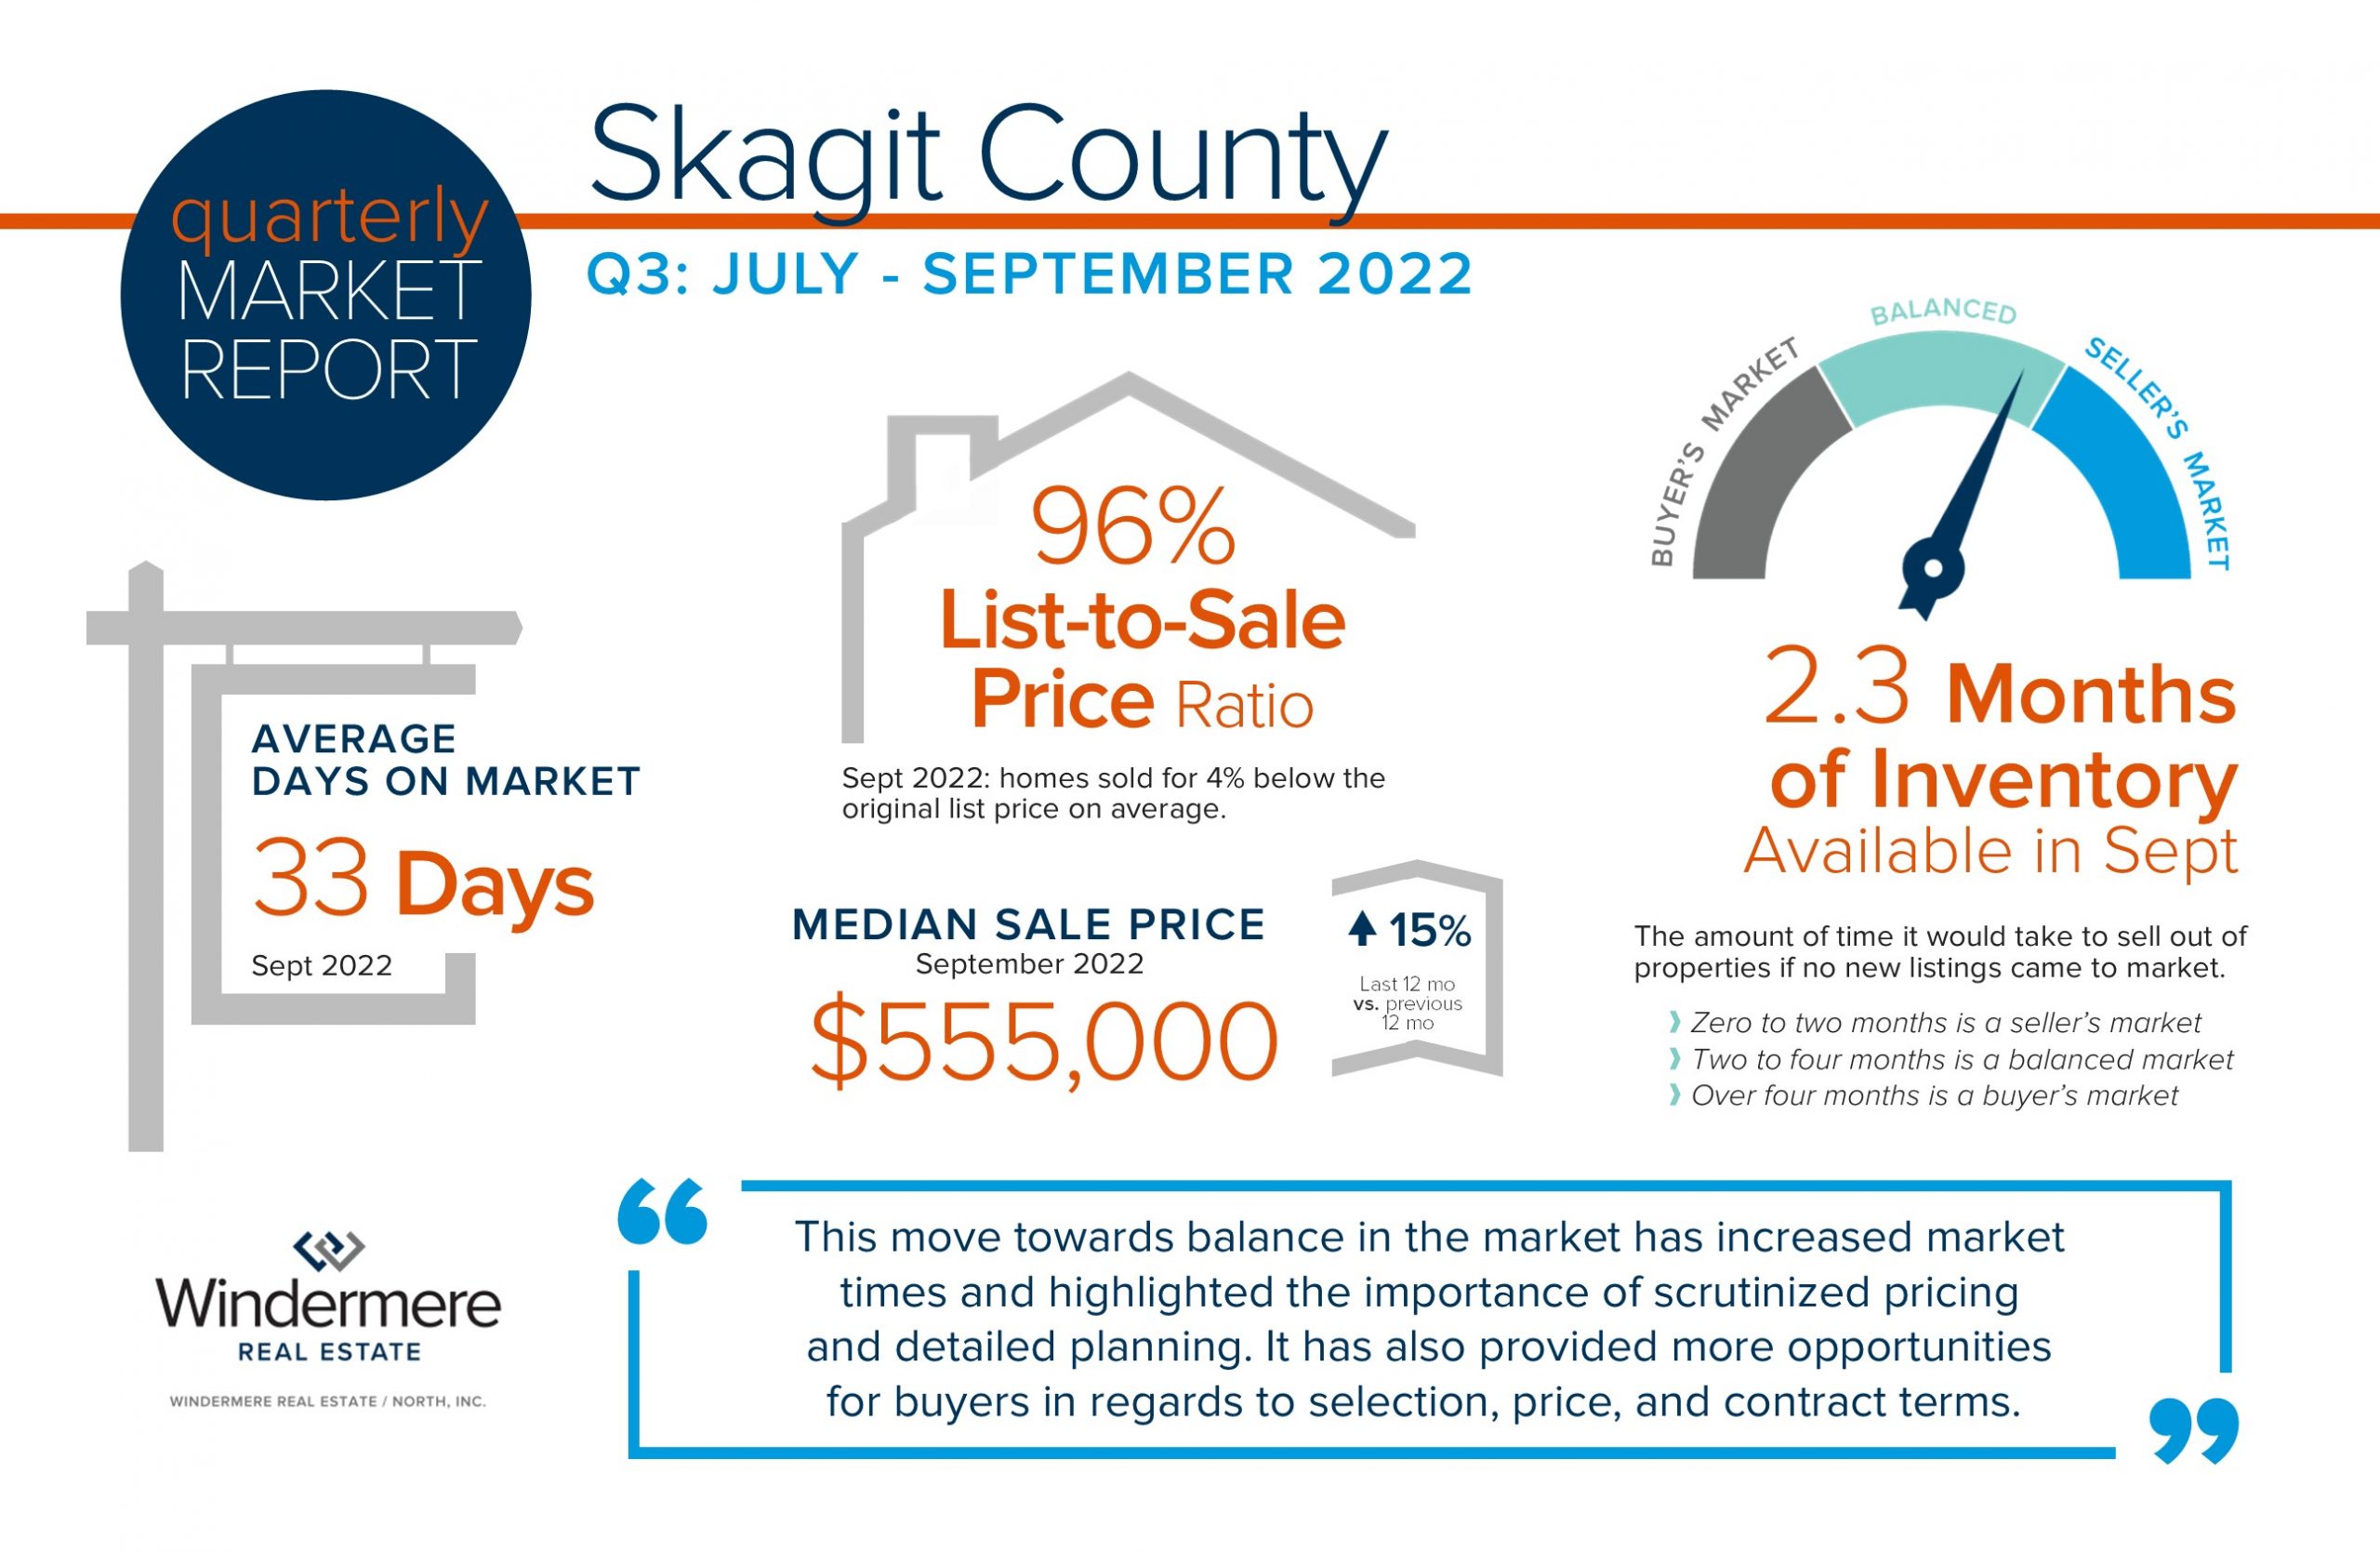
QUARTERLY REPORTS Q3 2022


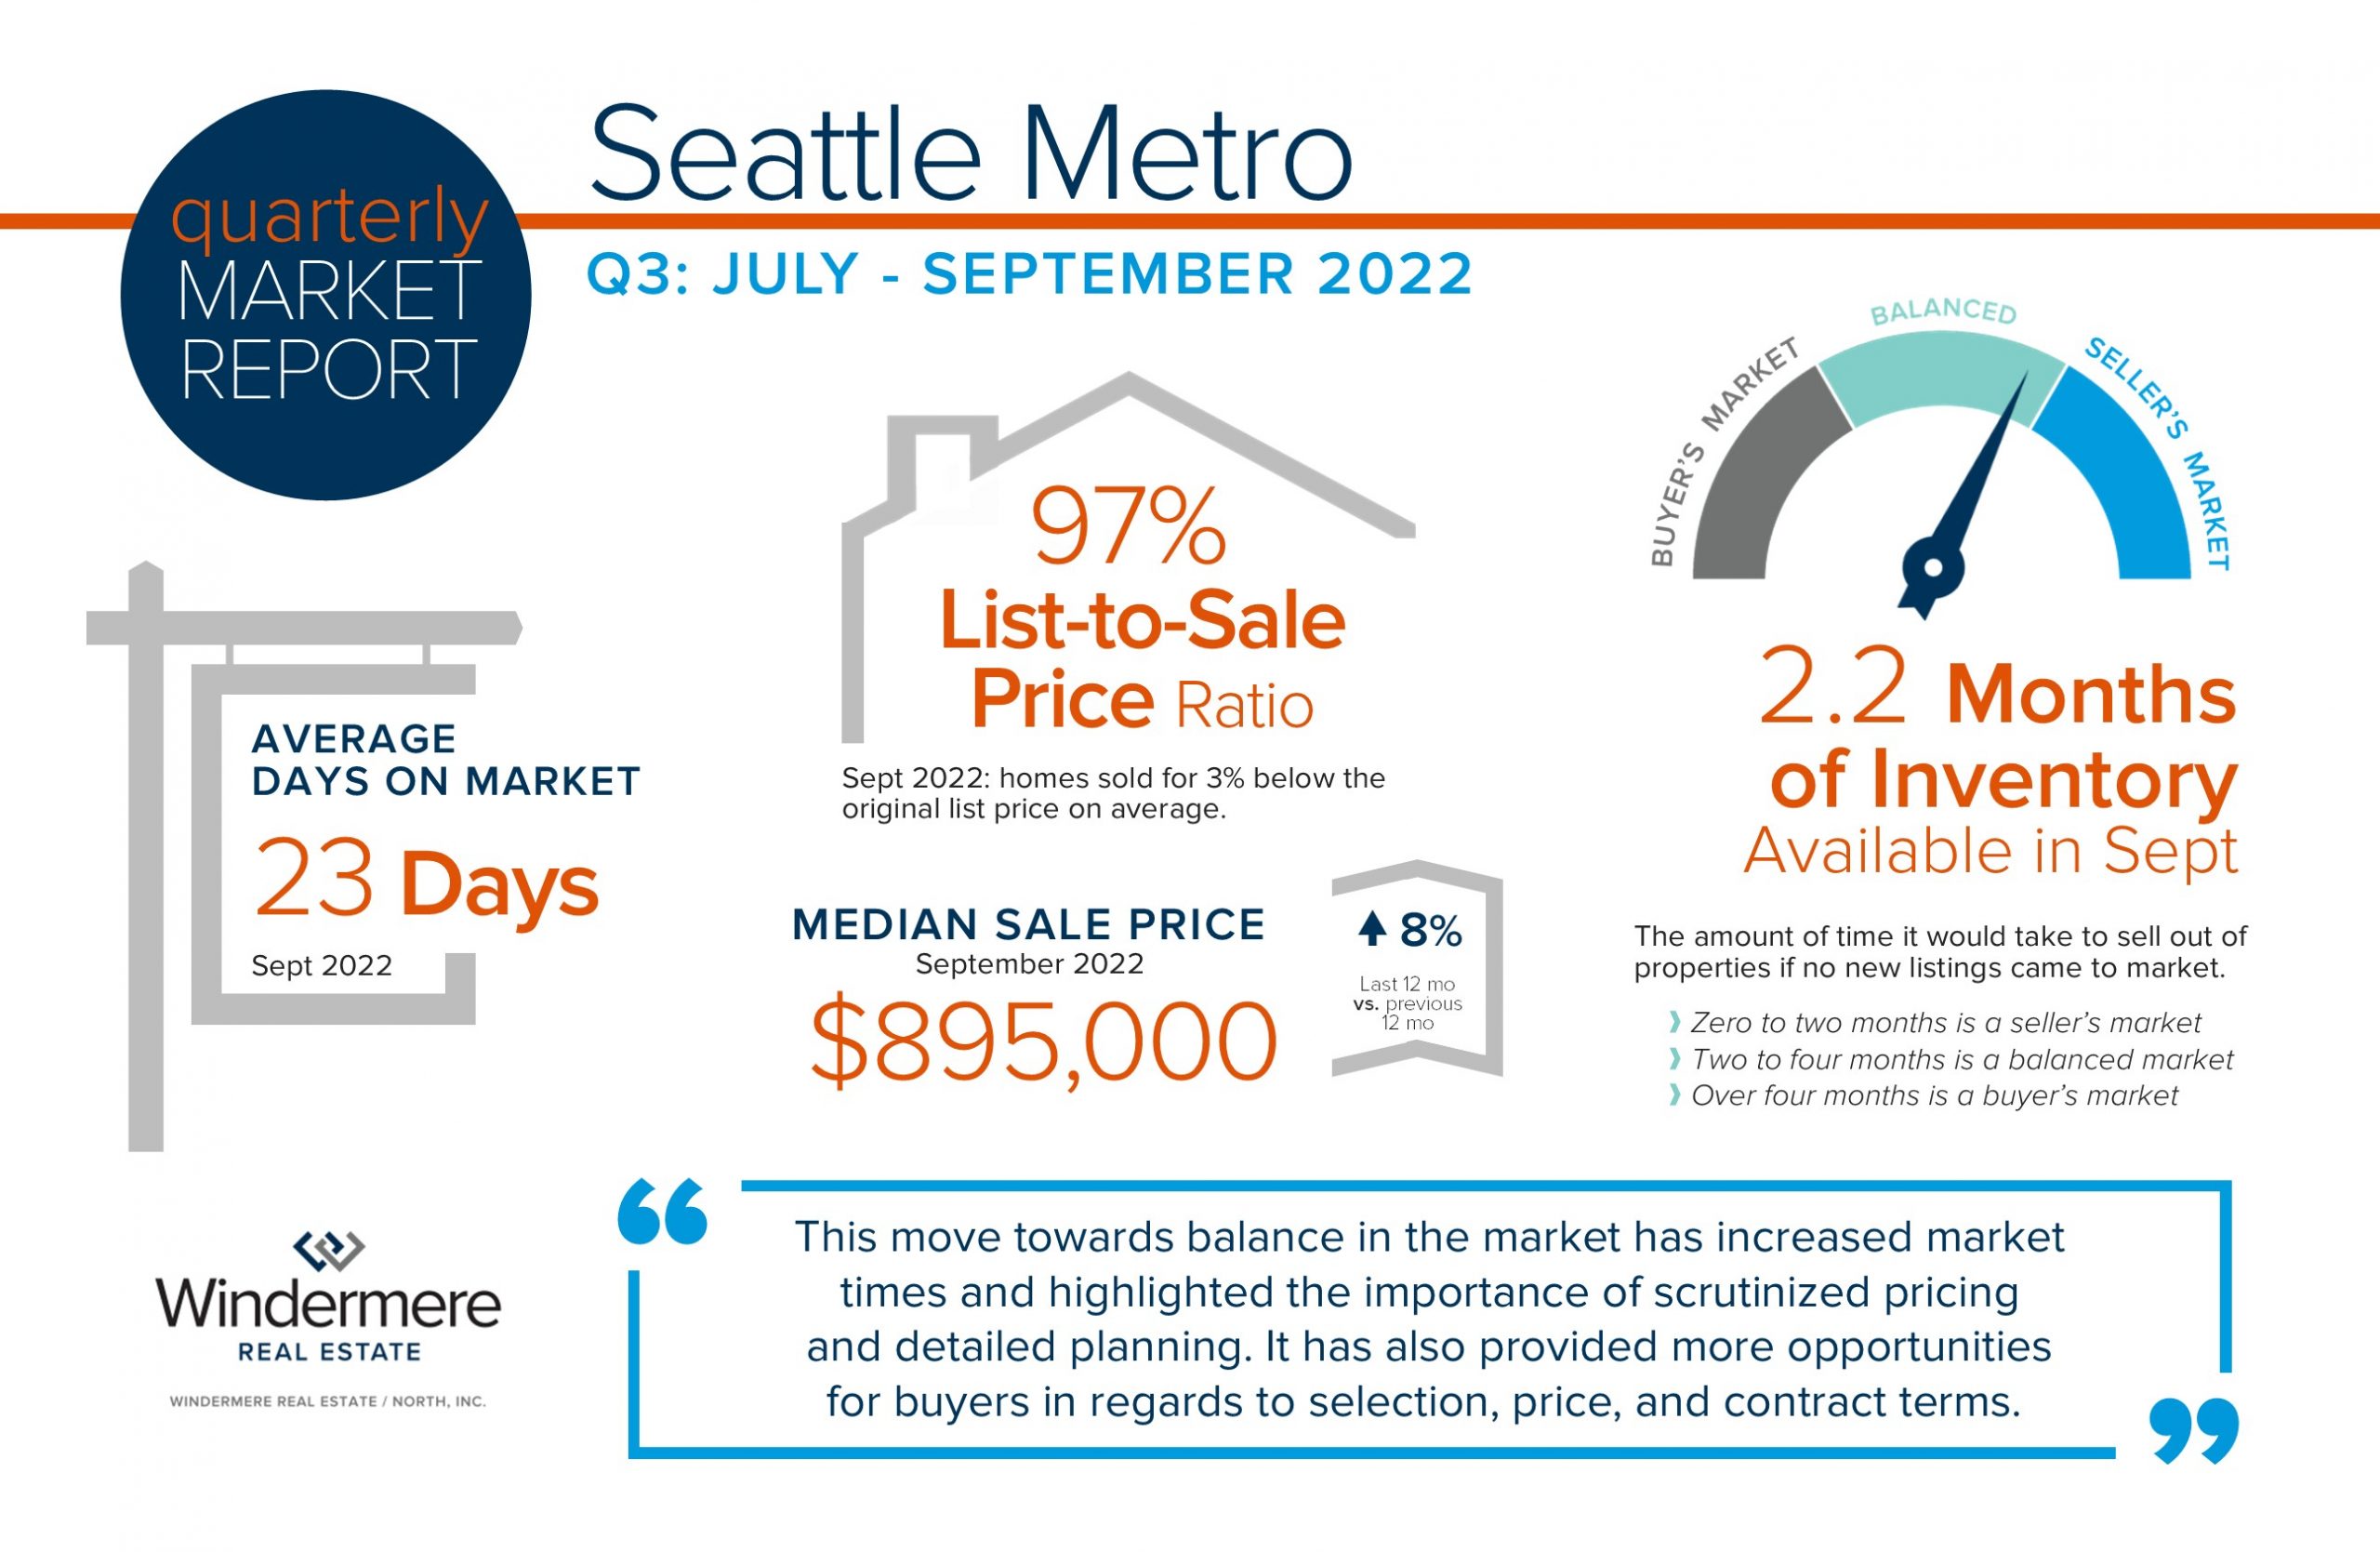
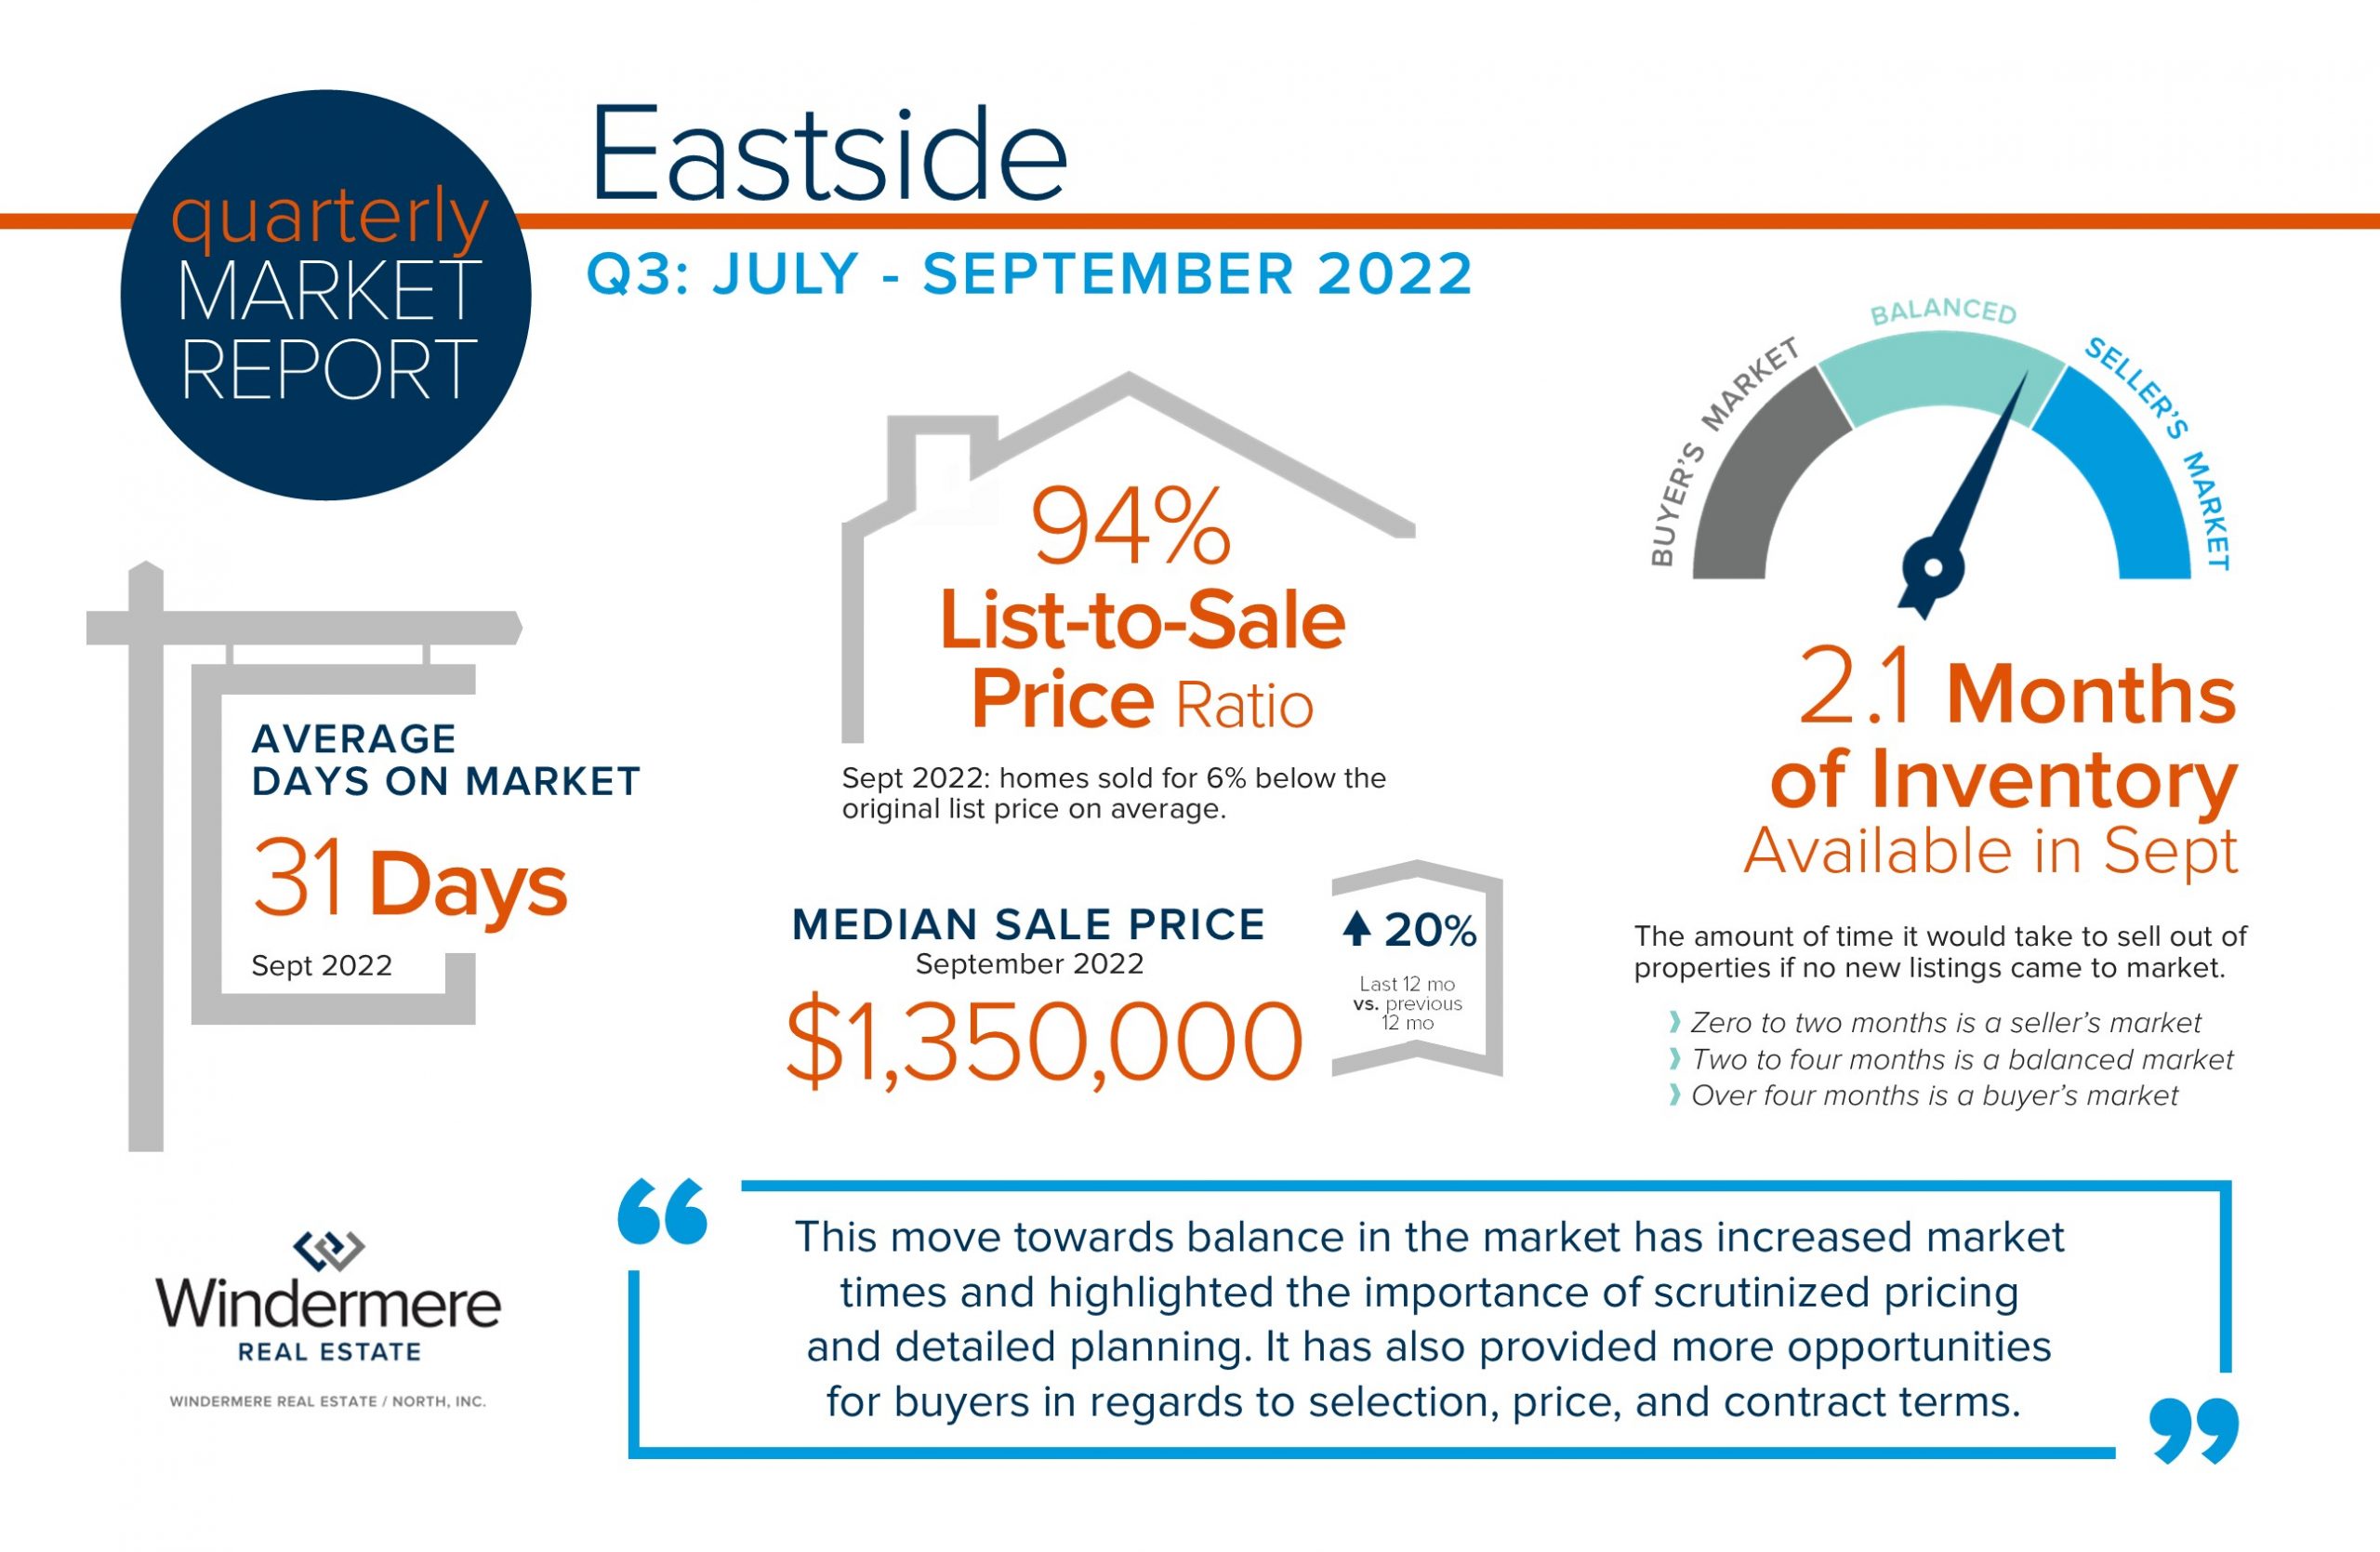
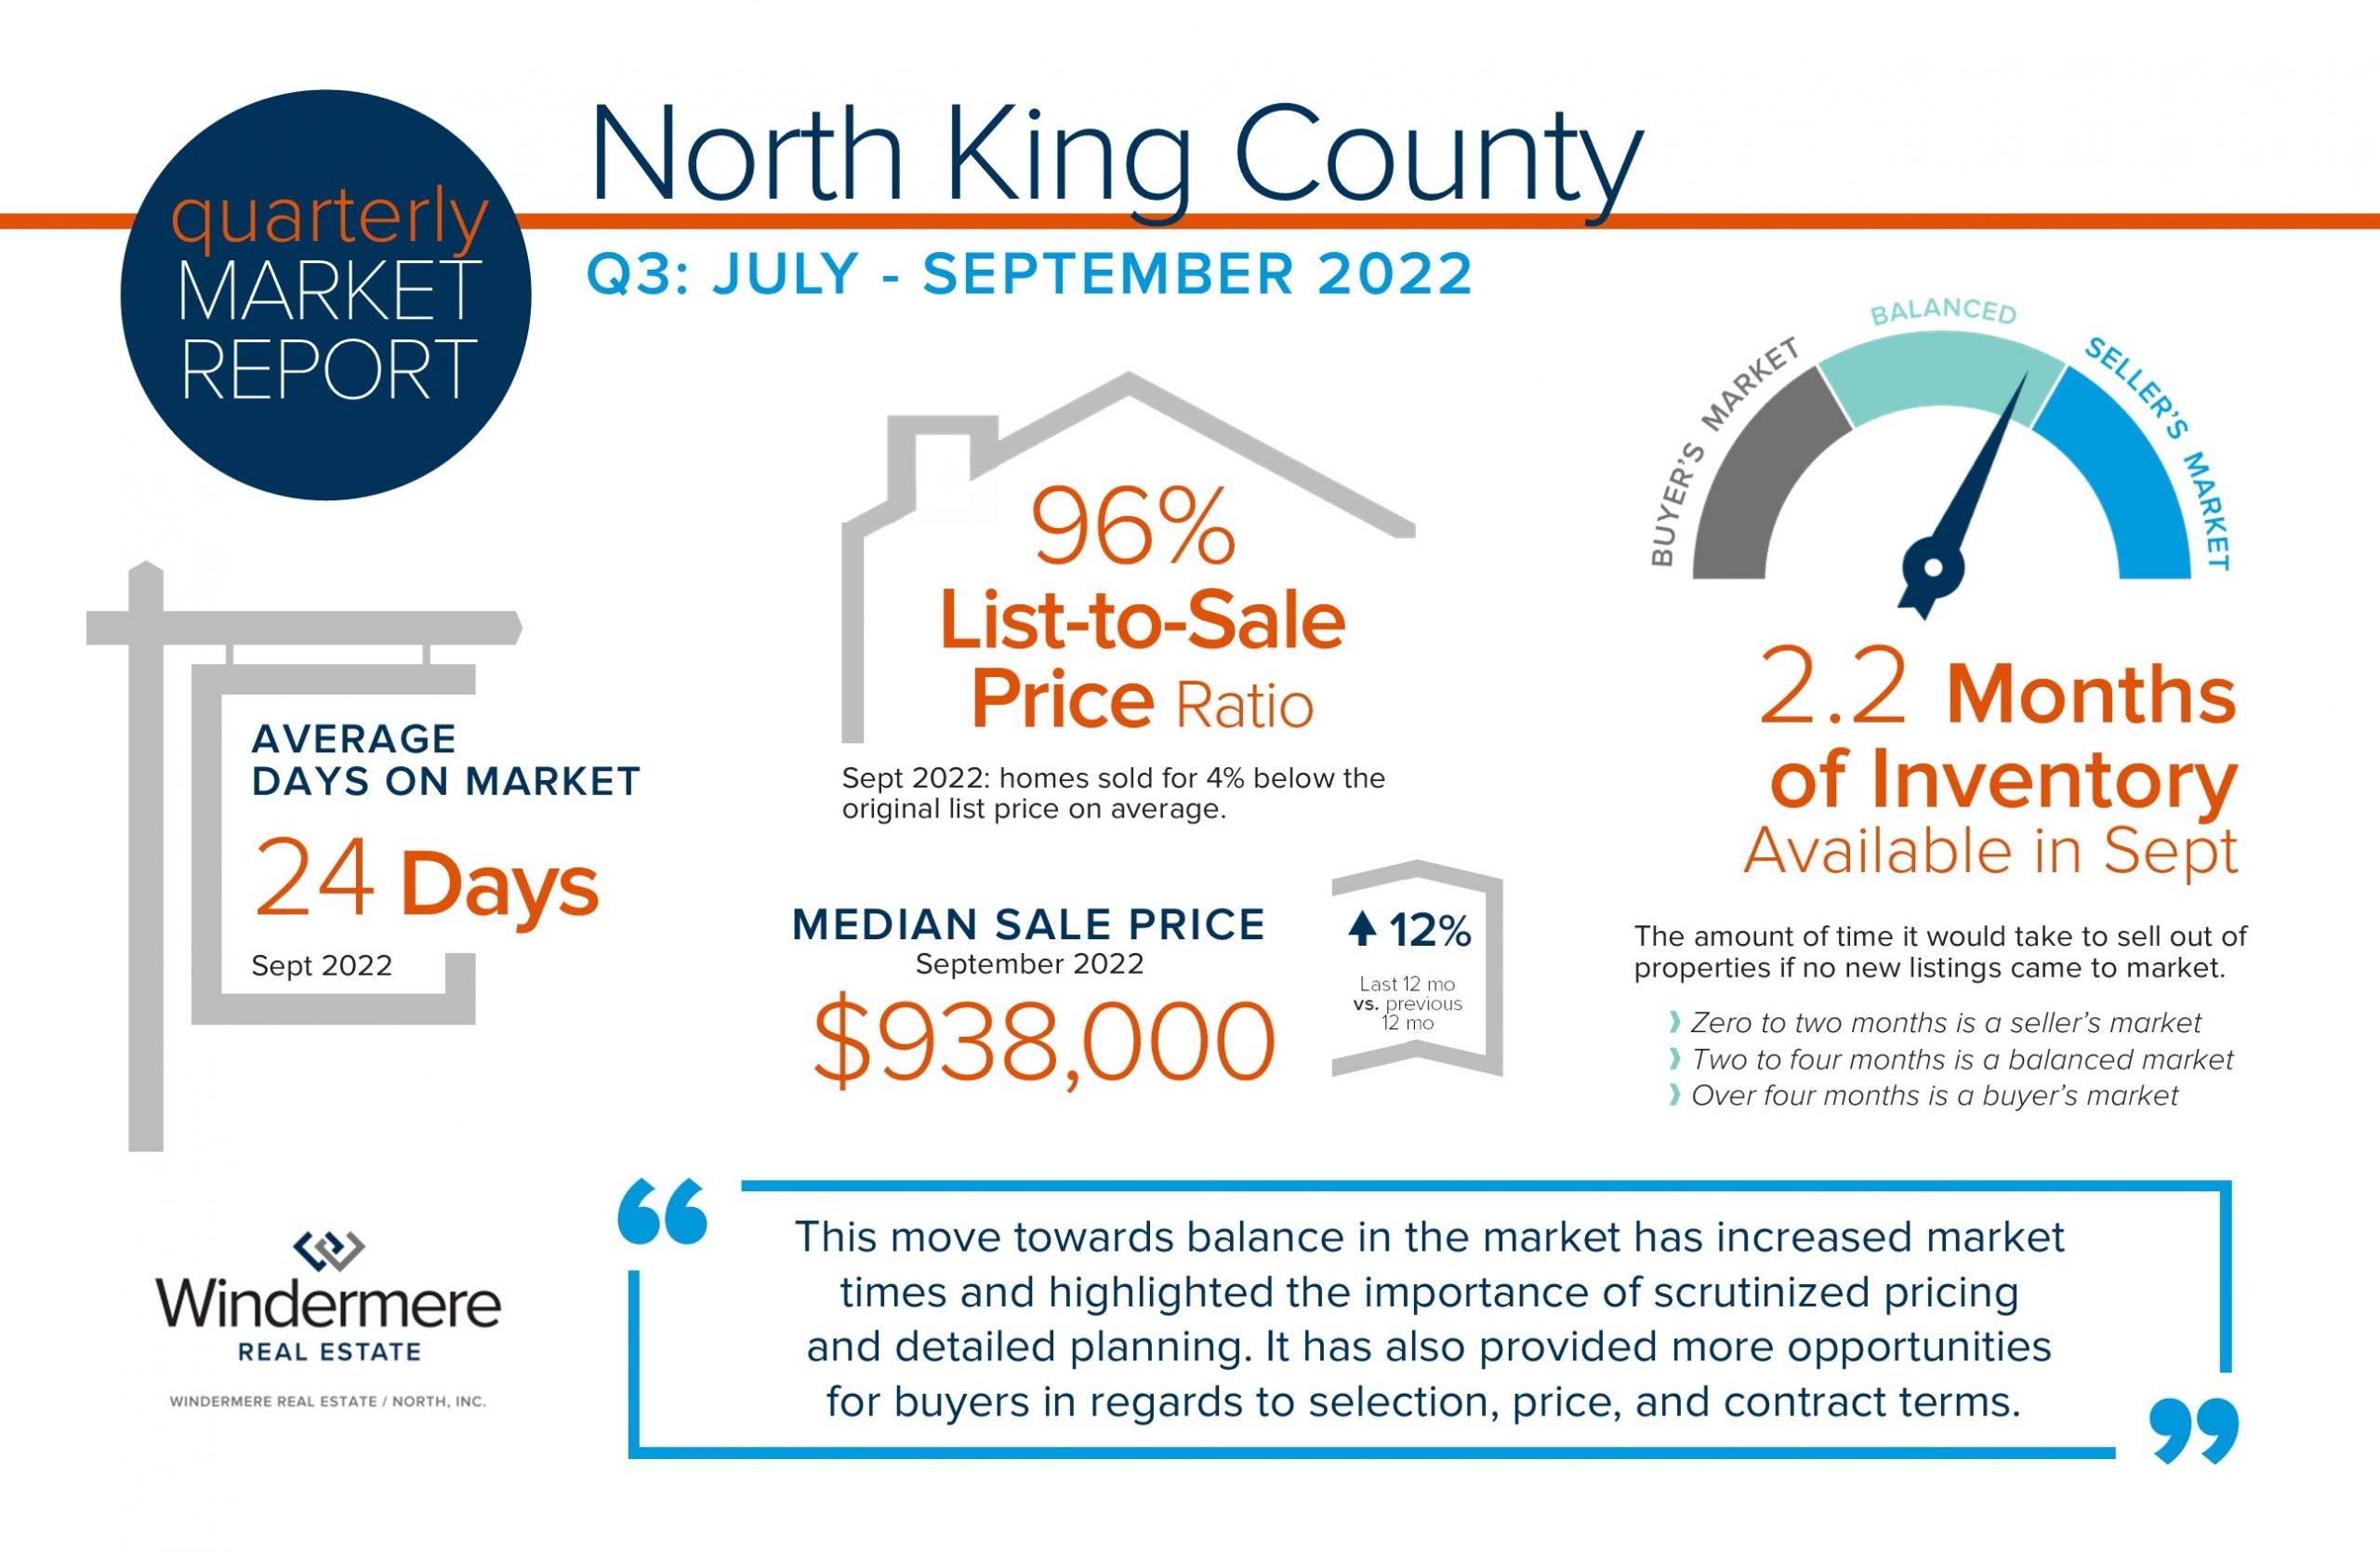 The real estate market is adjusting to new environmental factors as we round out 2022. Interest rates have been on an upward trend since the spring and have increased by 2 points since the first of the year. This has put downward pressure on the peak prices we saw in the spring as we return to more normalized, historical rates. We must keep in perspective the strong year-over-year price gains as these environmental factors settle out. Additionally, we are sitting on top of 10 years of price growth resulting in over 50% of homeowners in WA state with at least 50% home equity.
This move towards balance in the market has increased market times and highlighted the importance of scrutinized pricing and detailed planning. It has also provided more opportunities for buyers in regards to selection, price, and contract terms. This market requires keen analytical skills, strategic negotiations, creativity, and a higher level of customer care.
I welcome the balance and normalization and look forward to helping my clients make moves to match their needs in life! Please reach out if you are curious about how the market relates to your goals or know someone that needs my help.

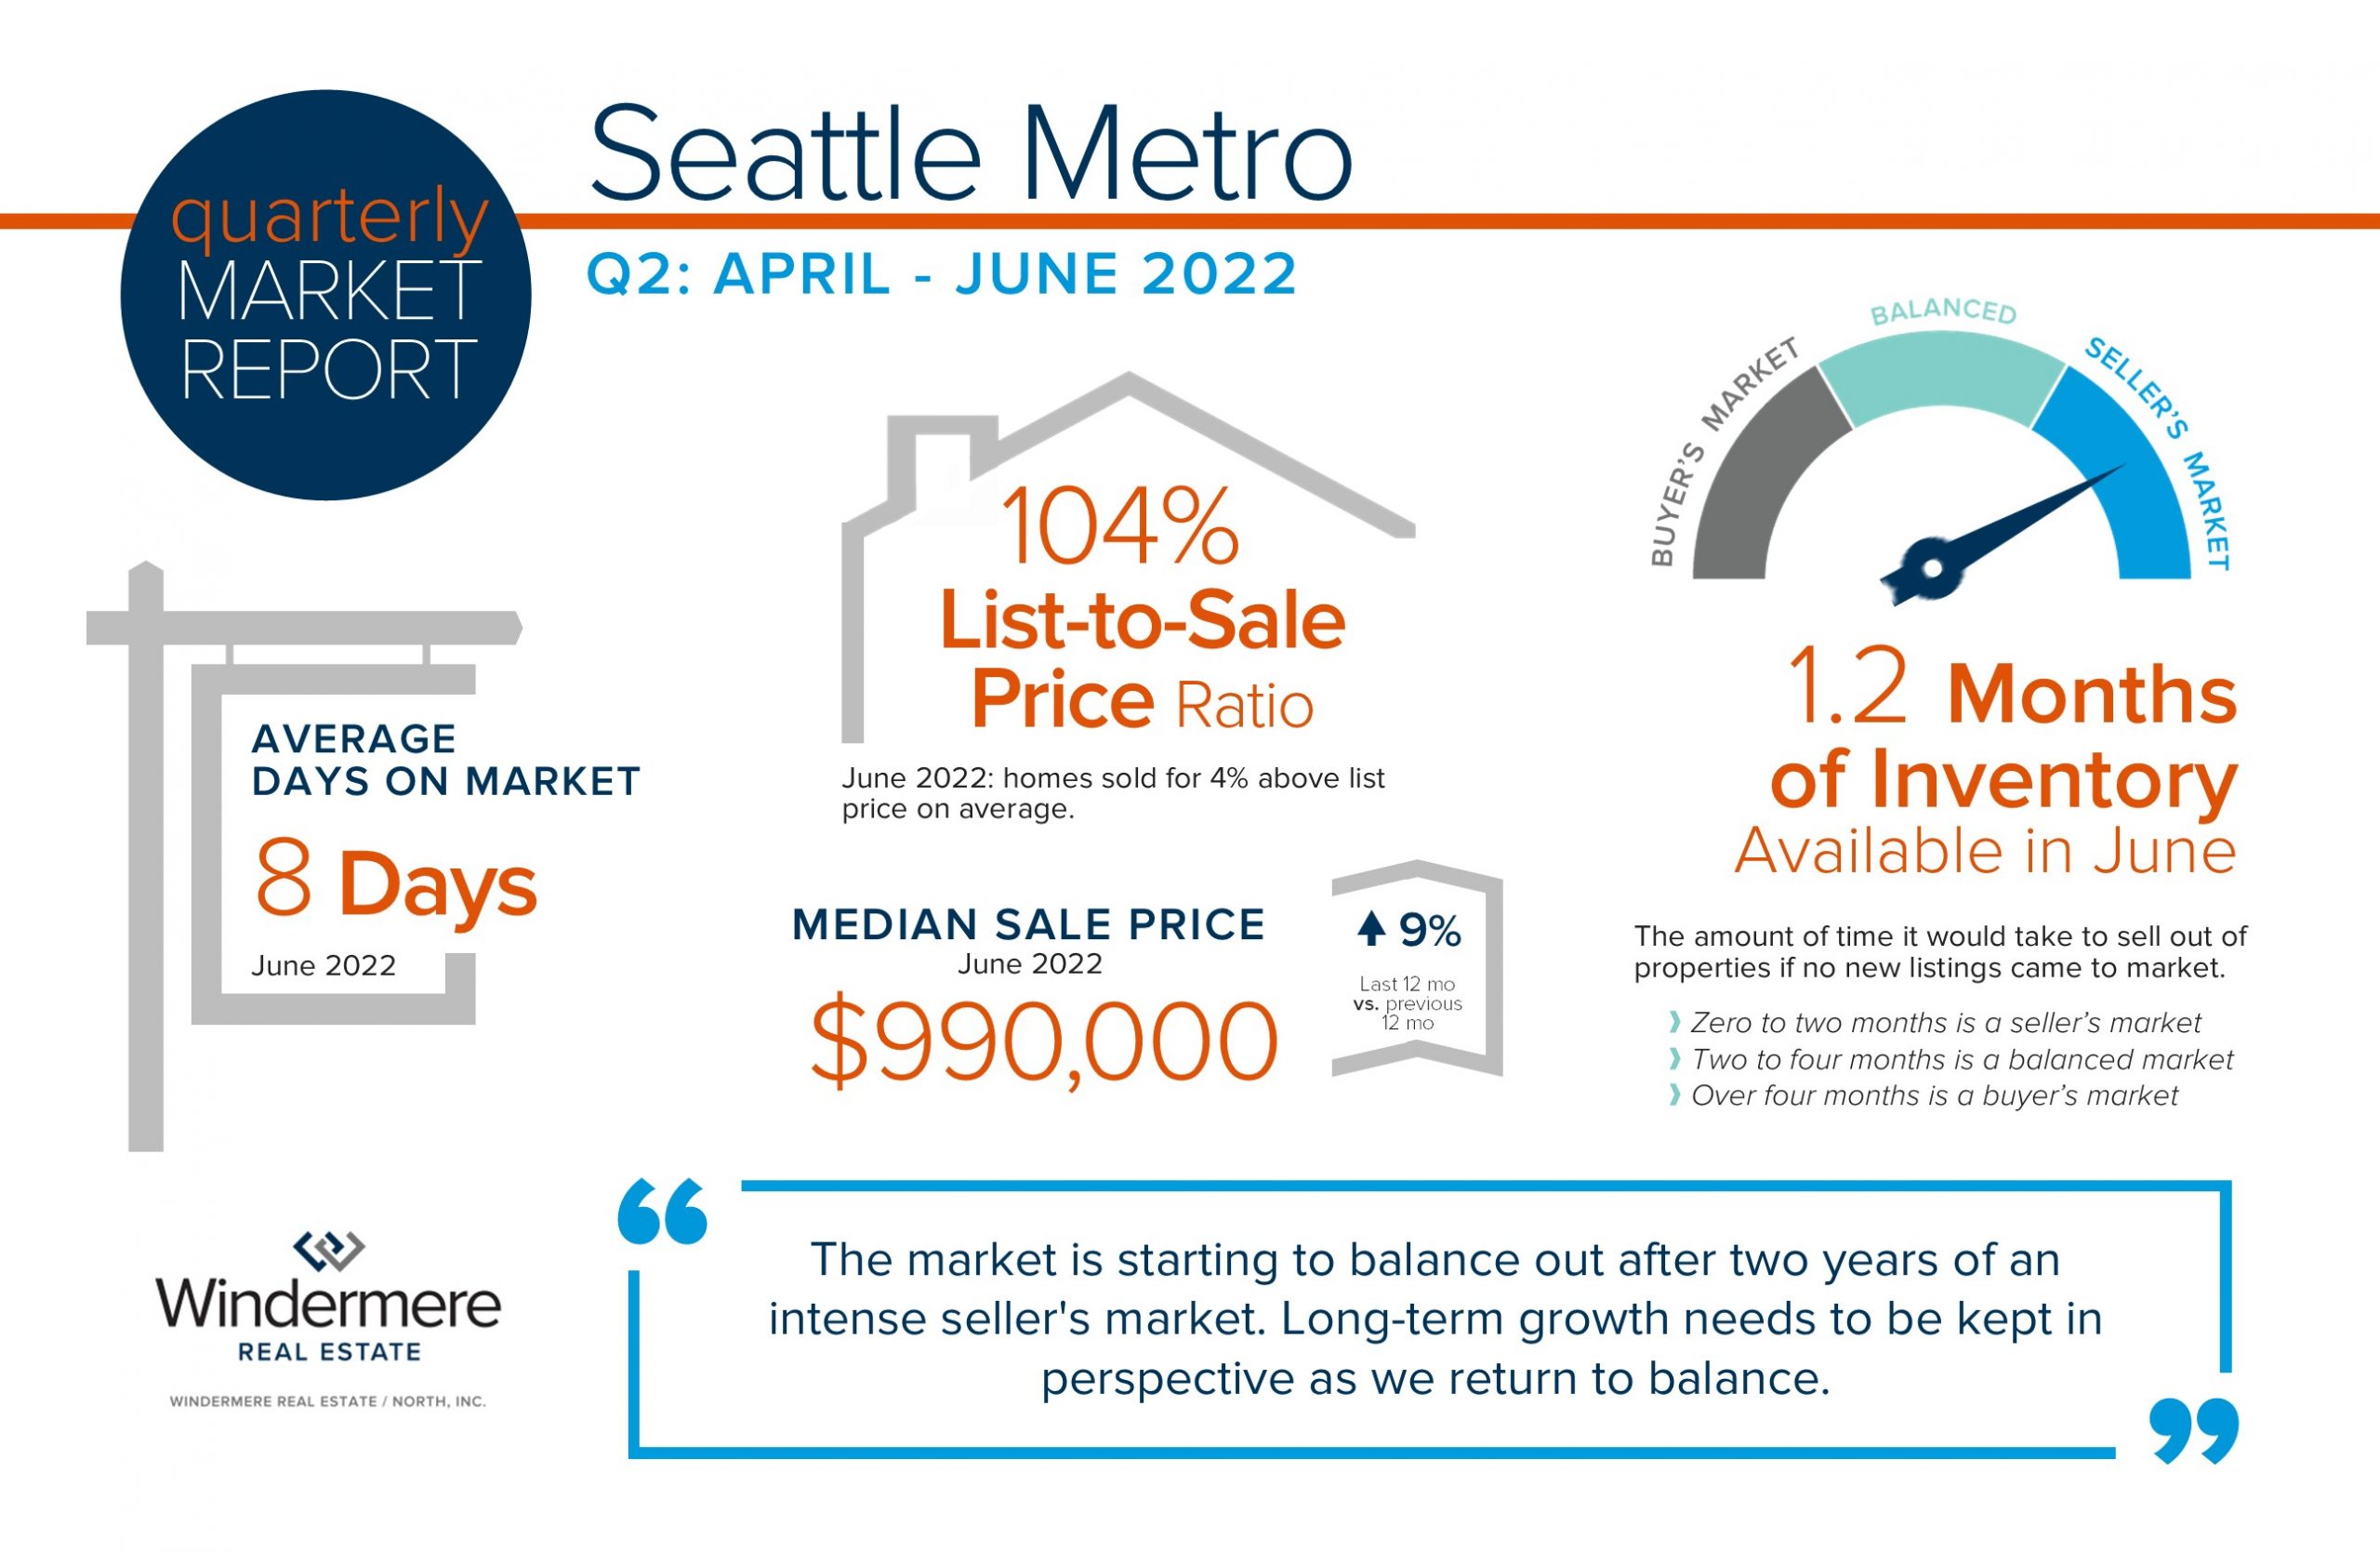
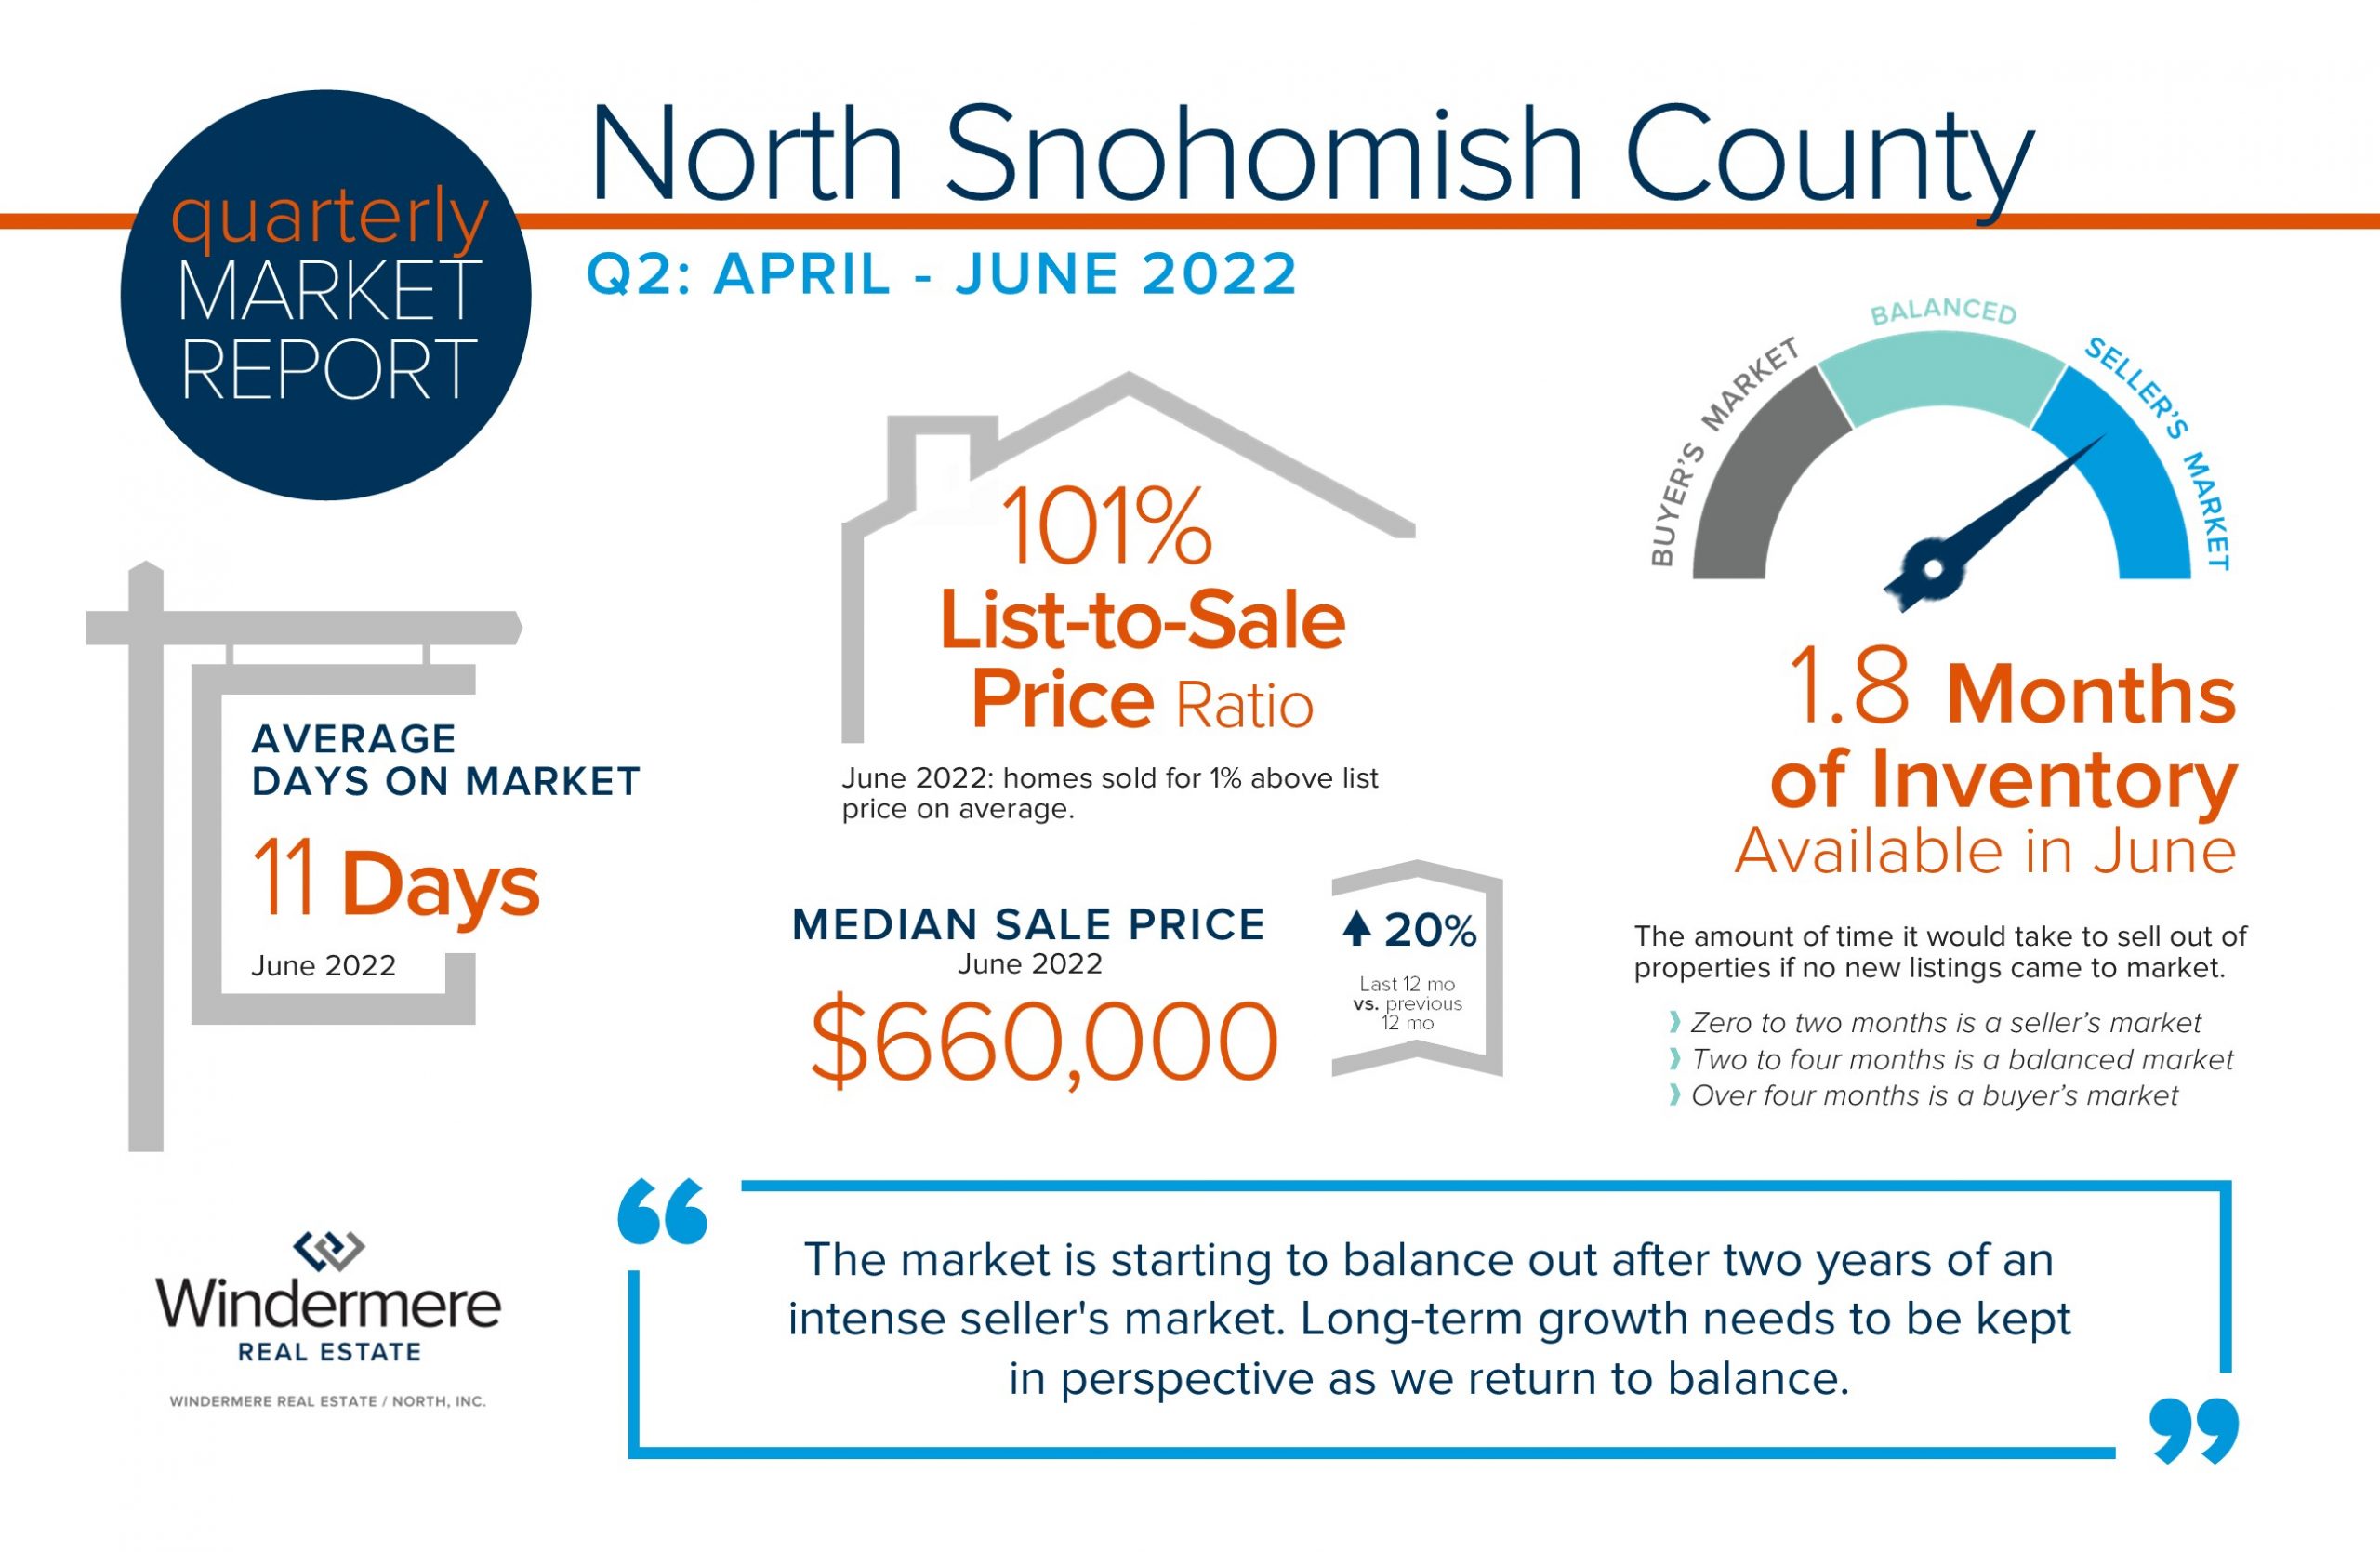
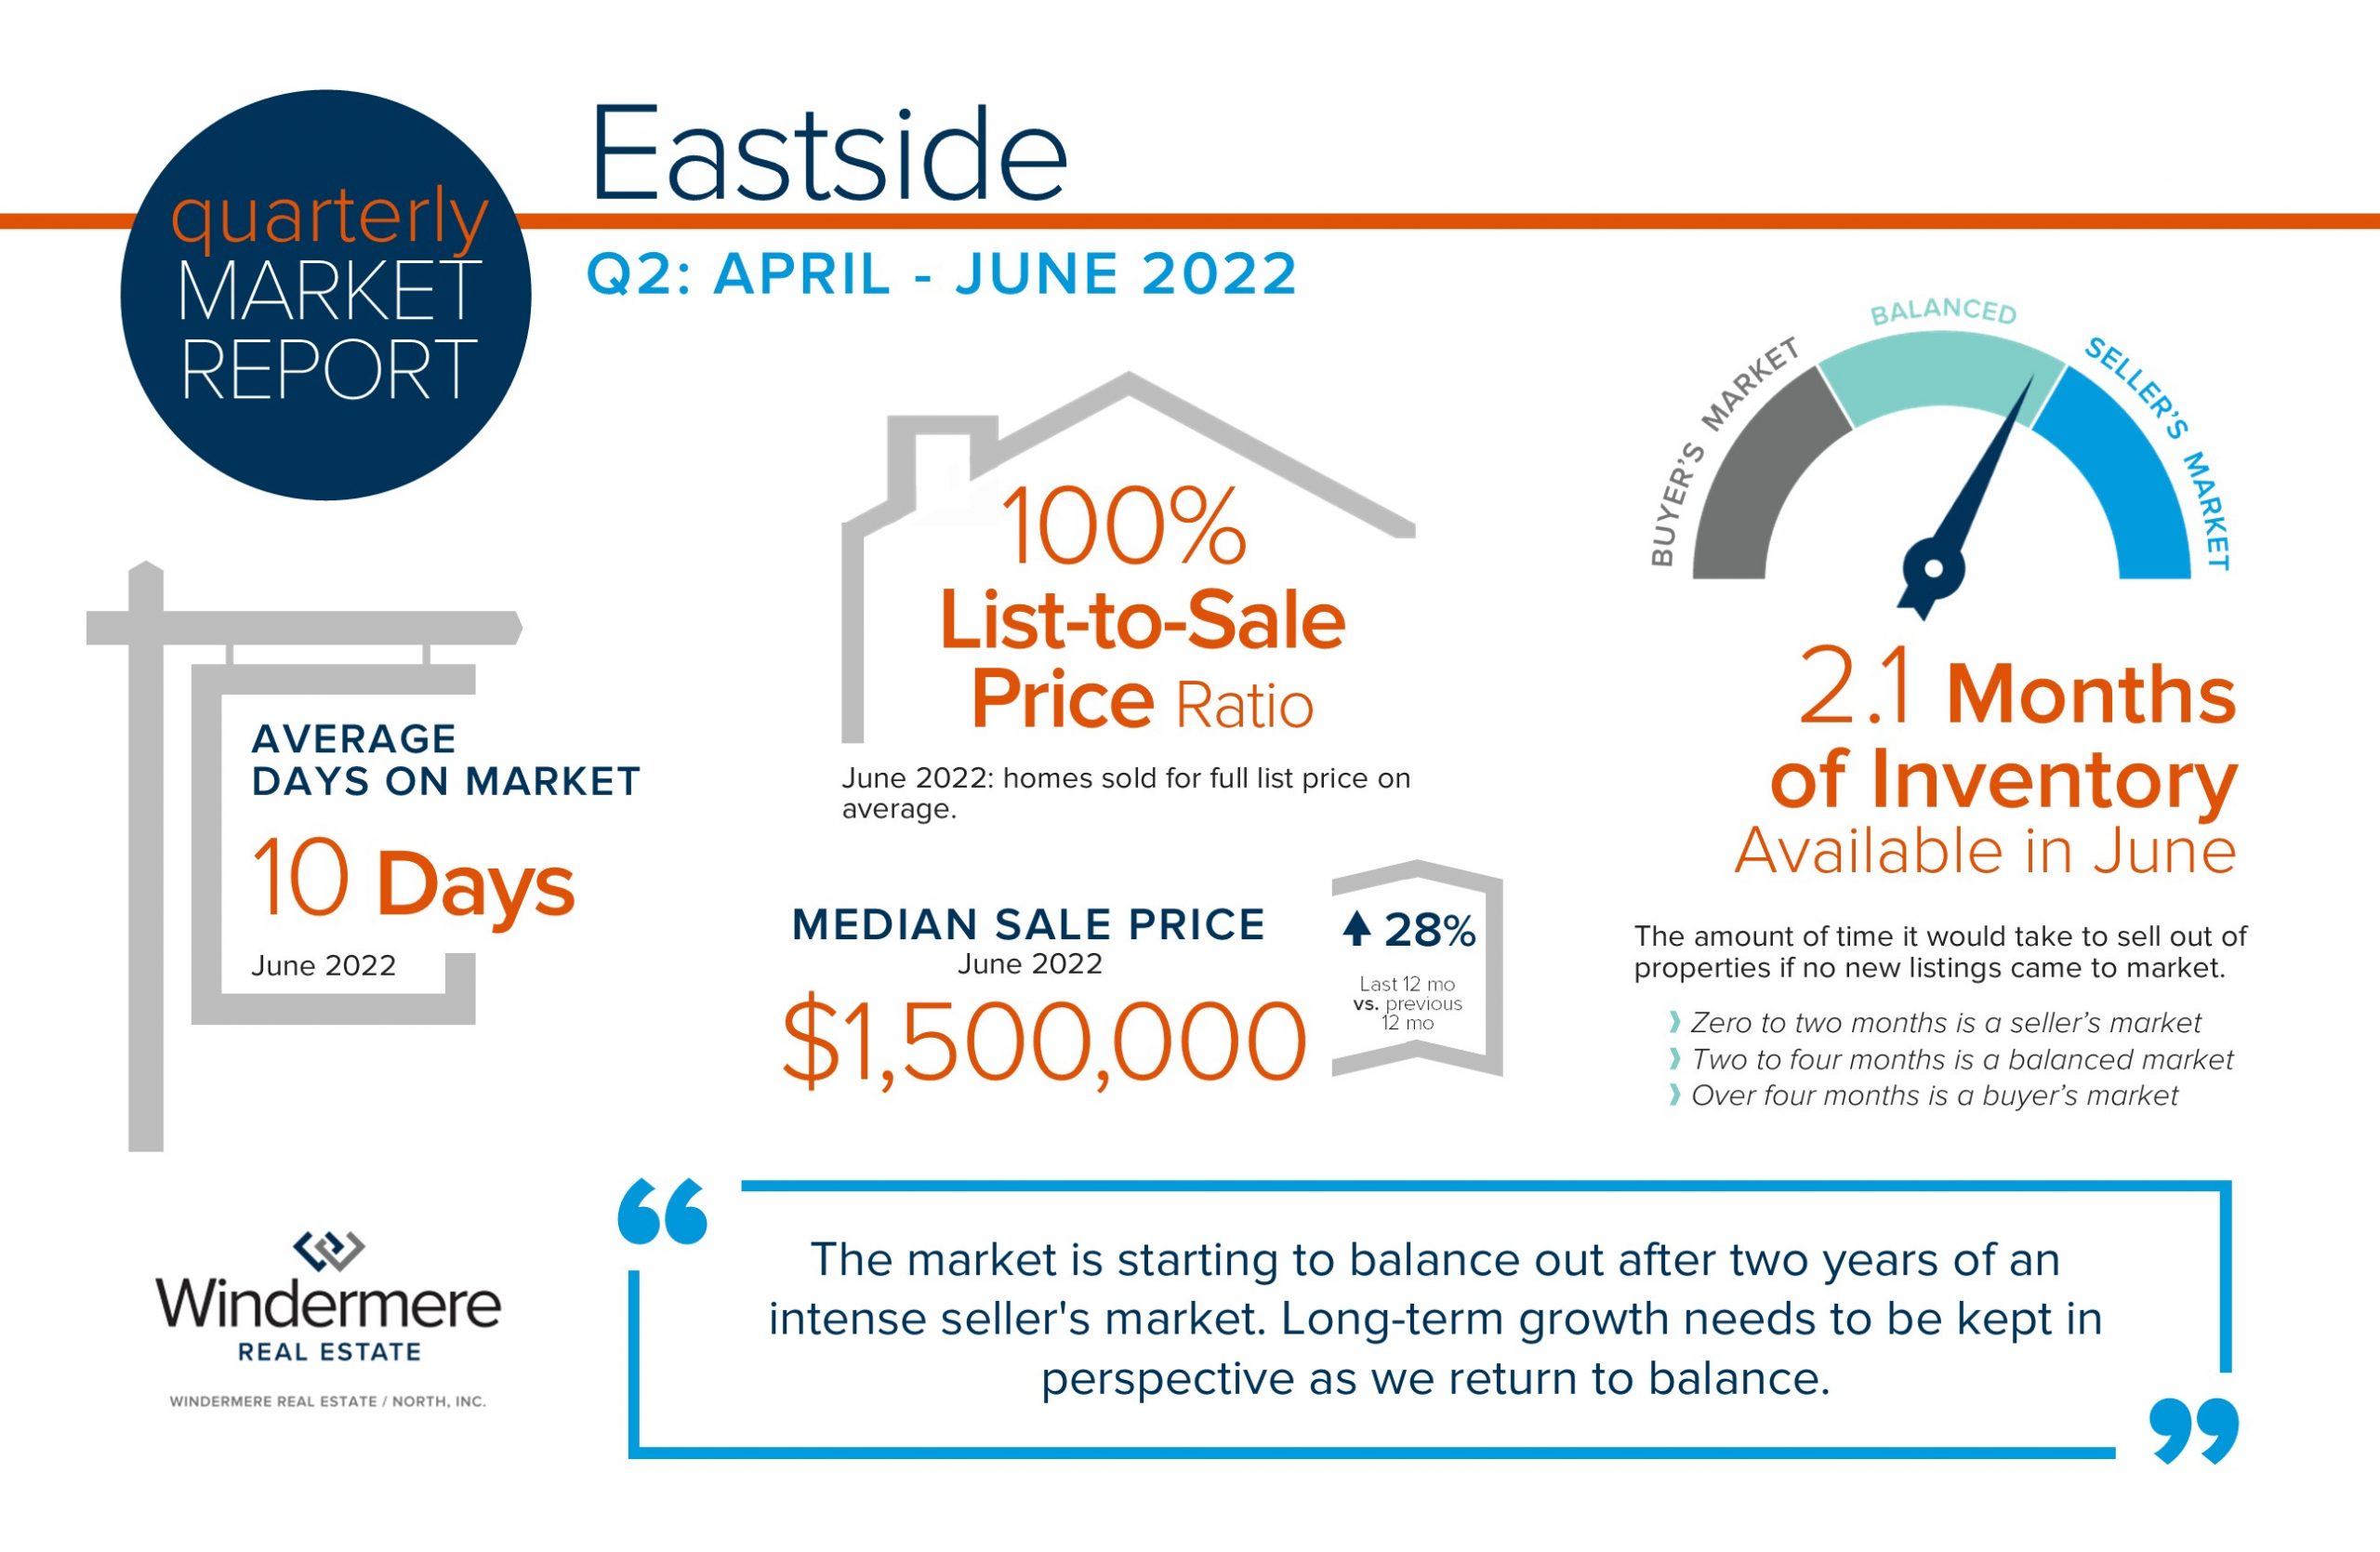
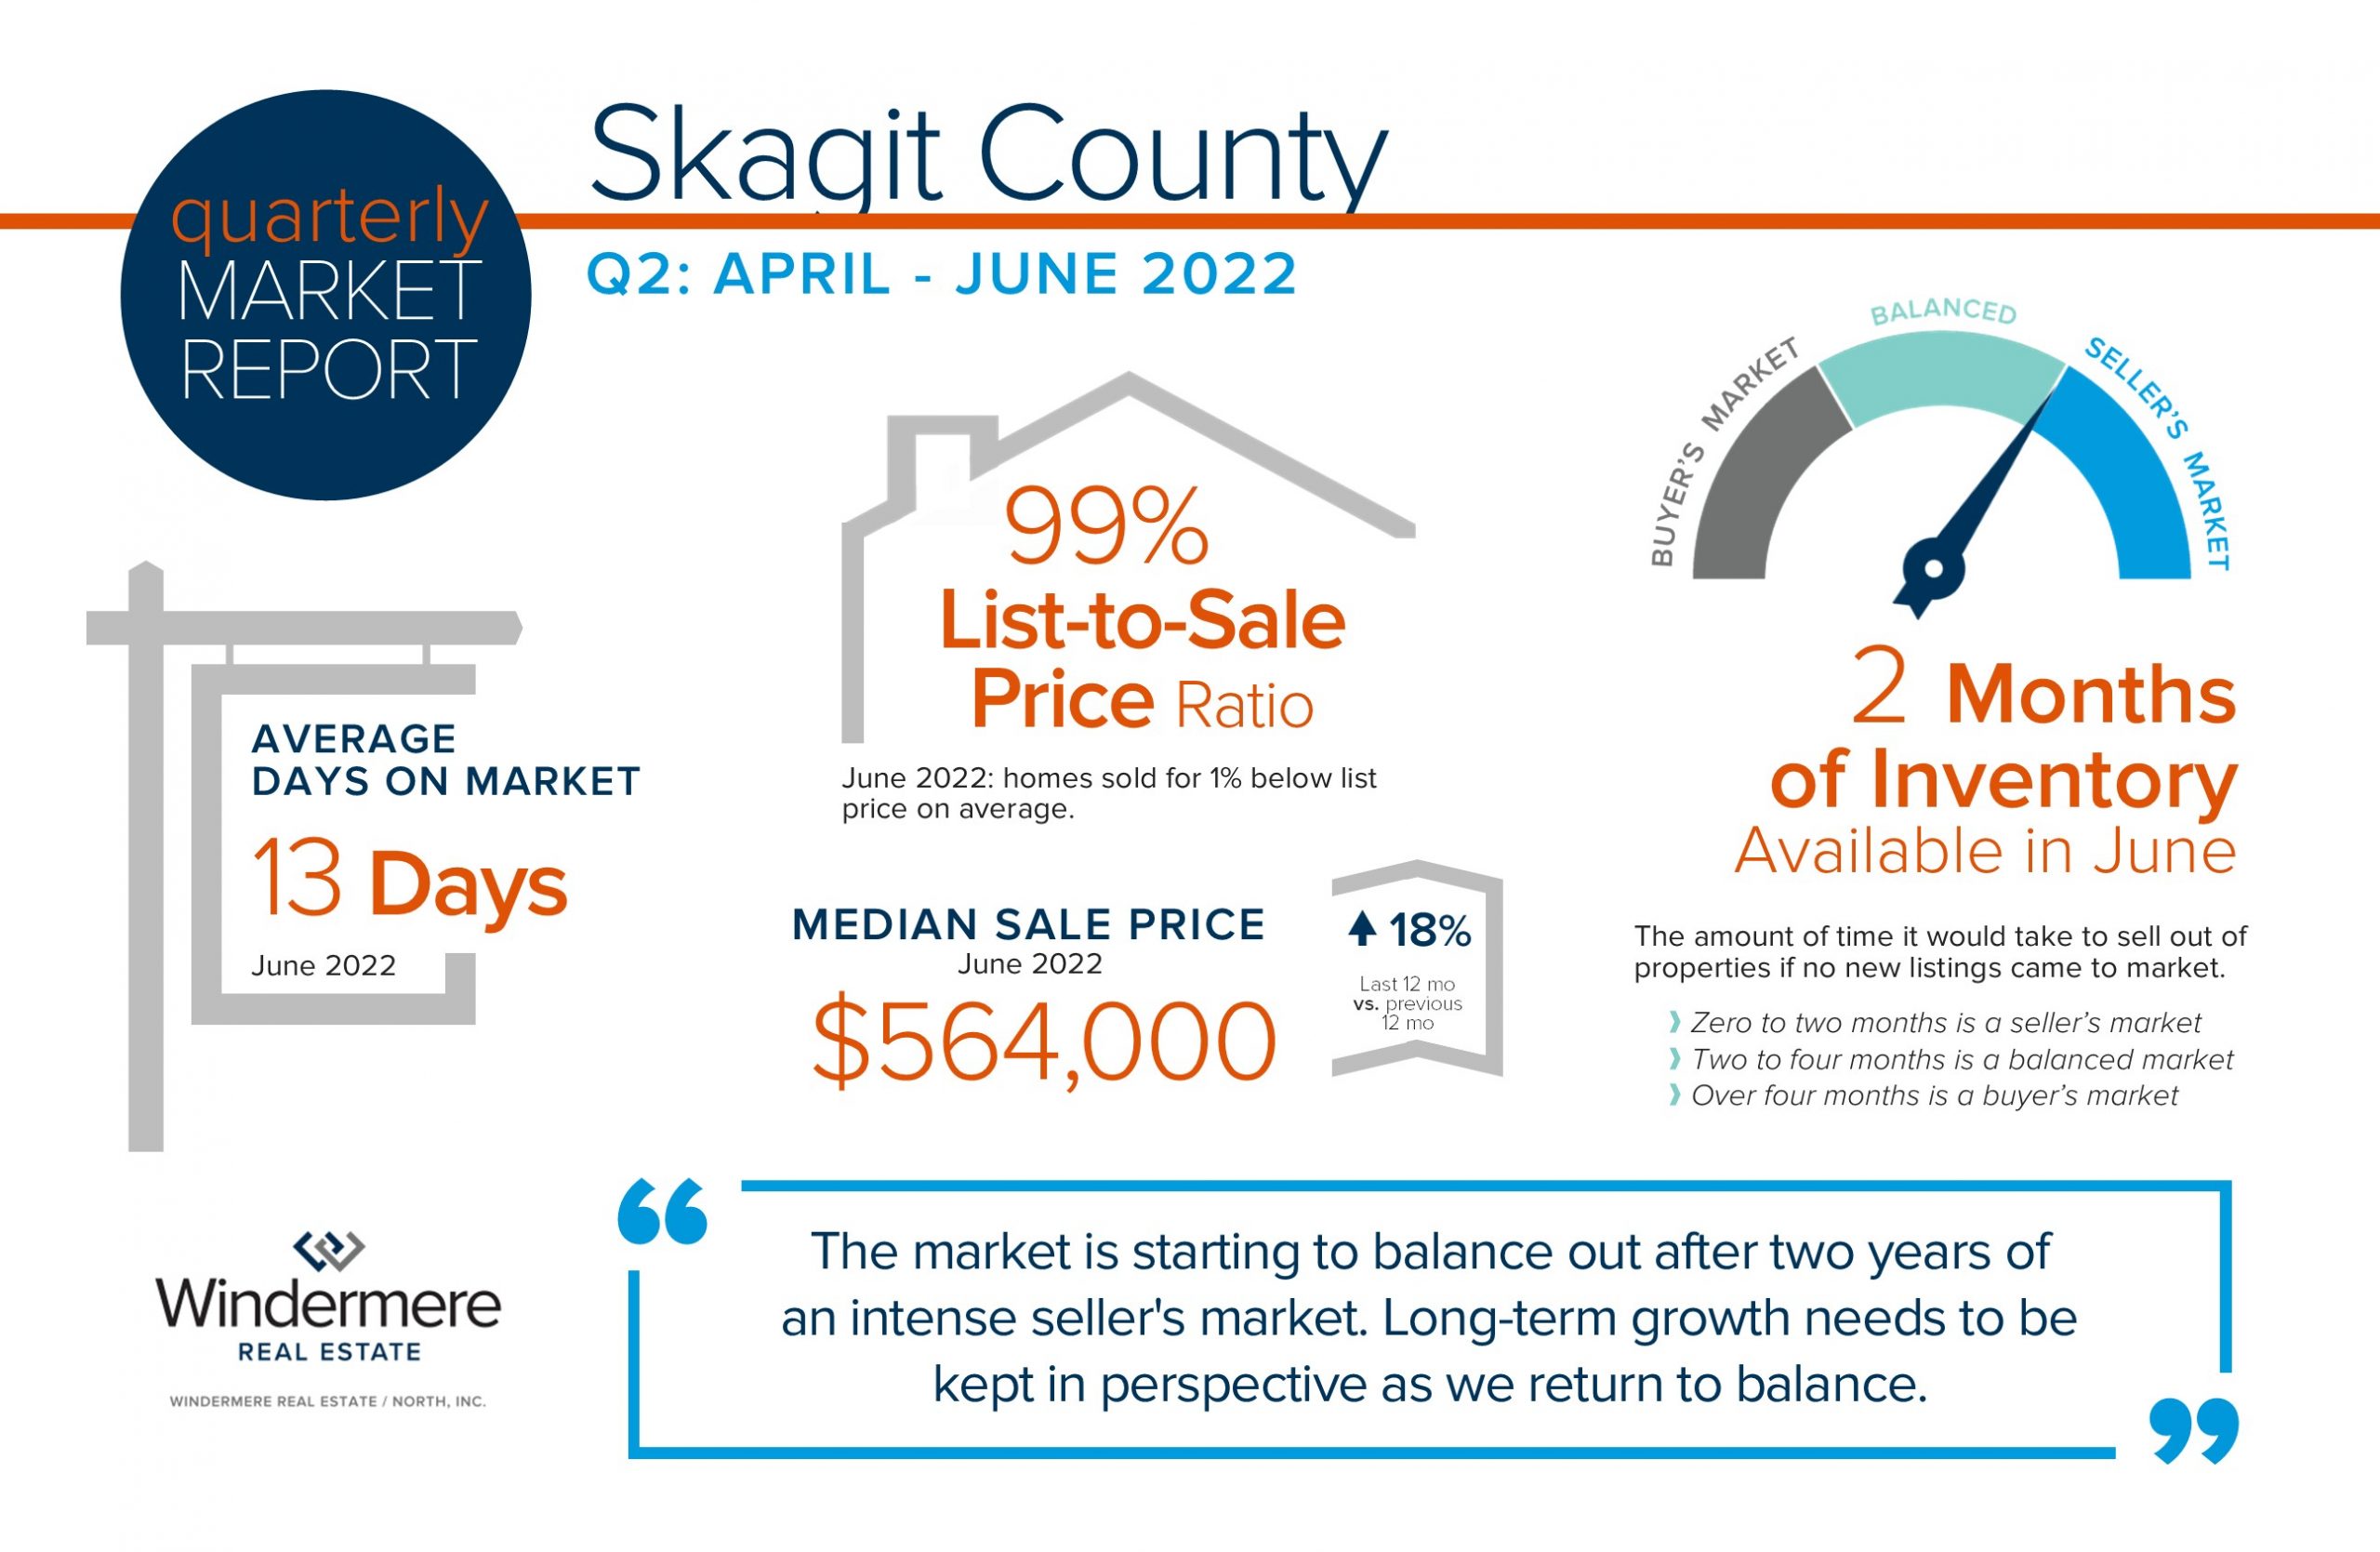
Quarterly Market Reports for Q2 2022

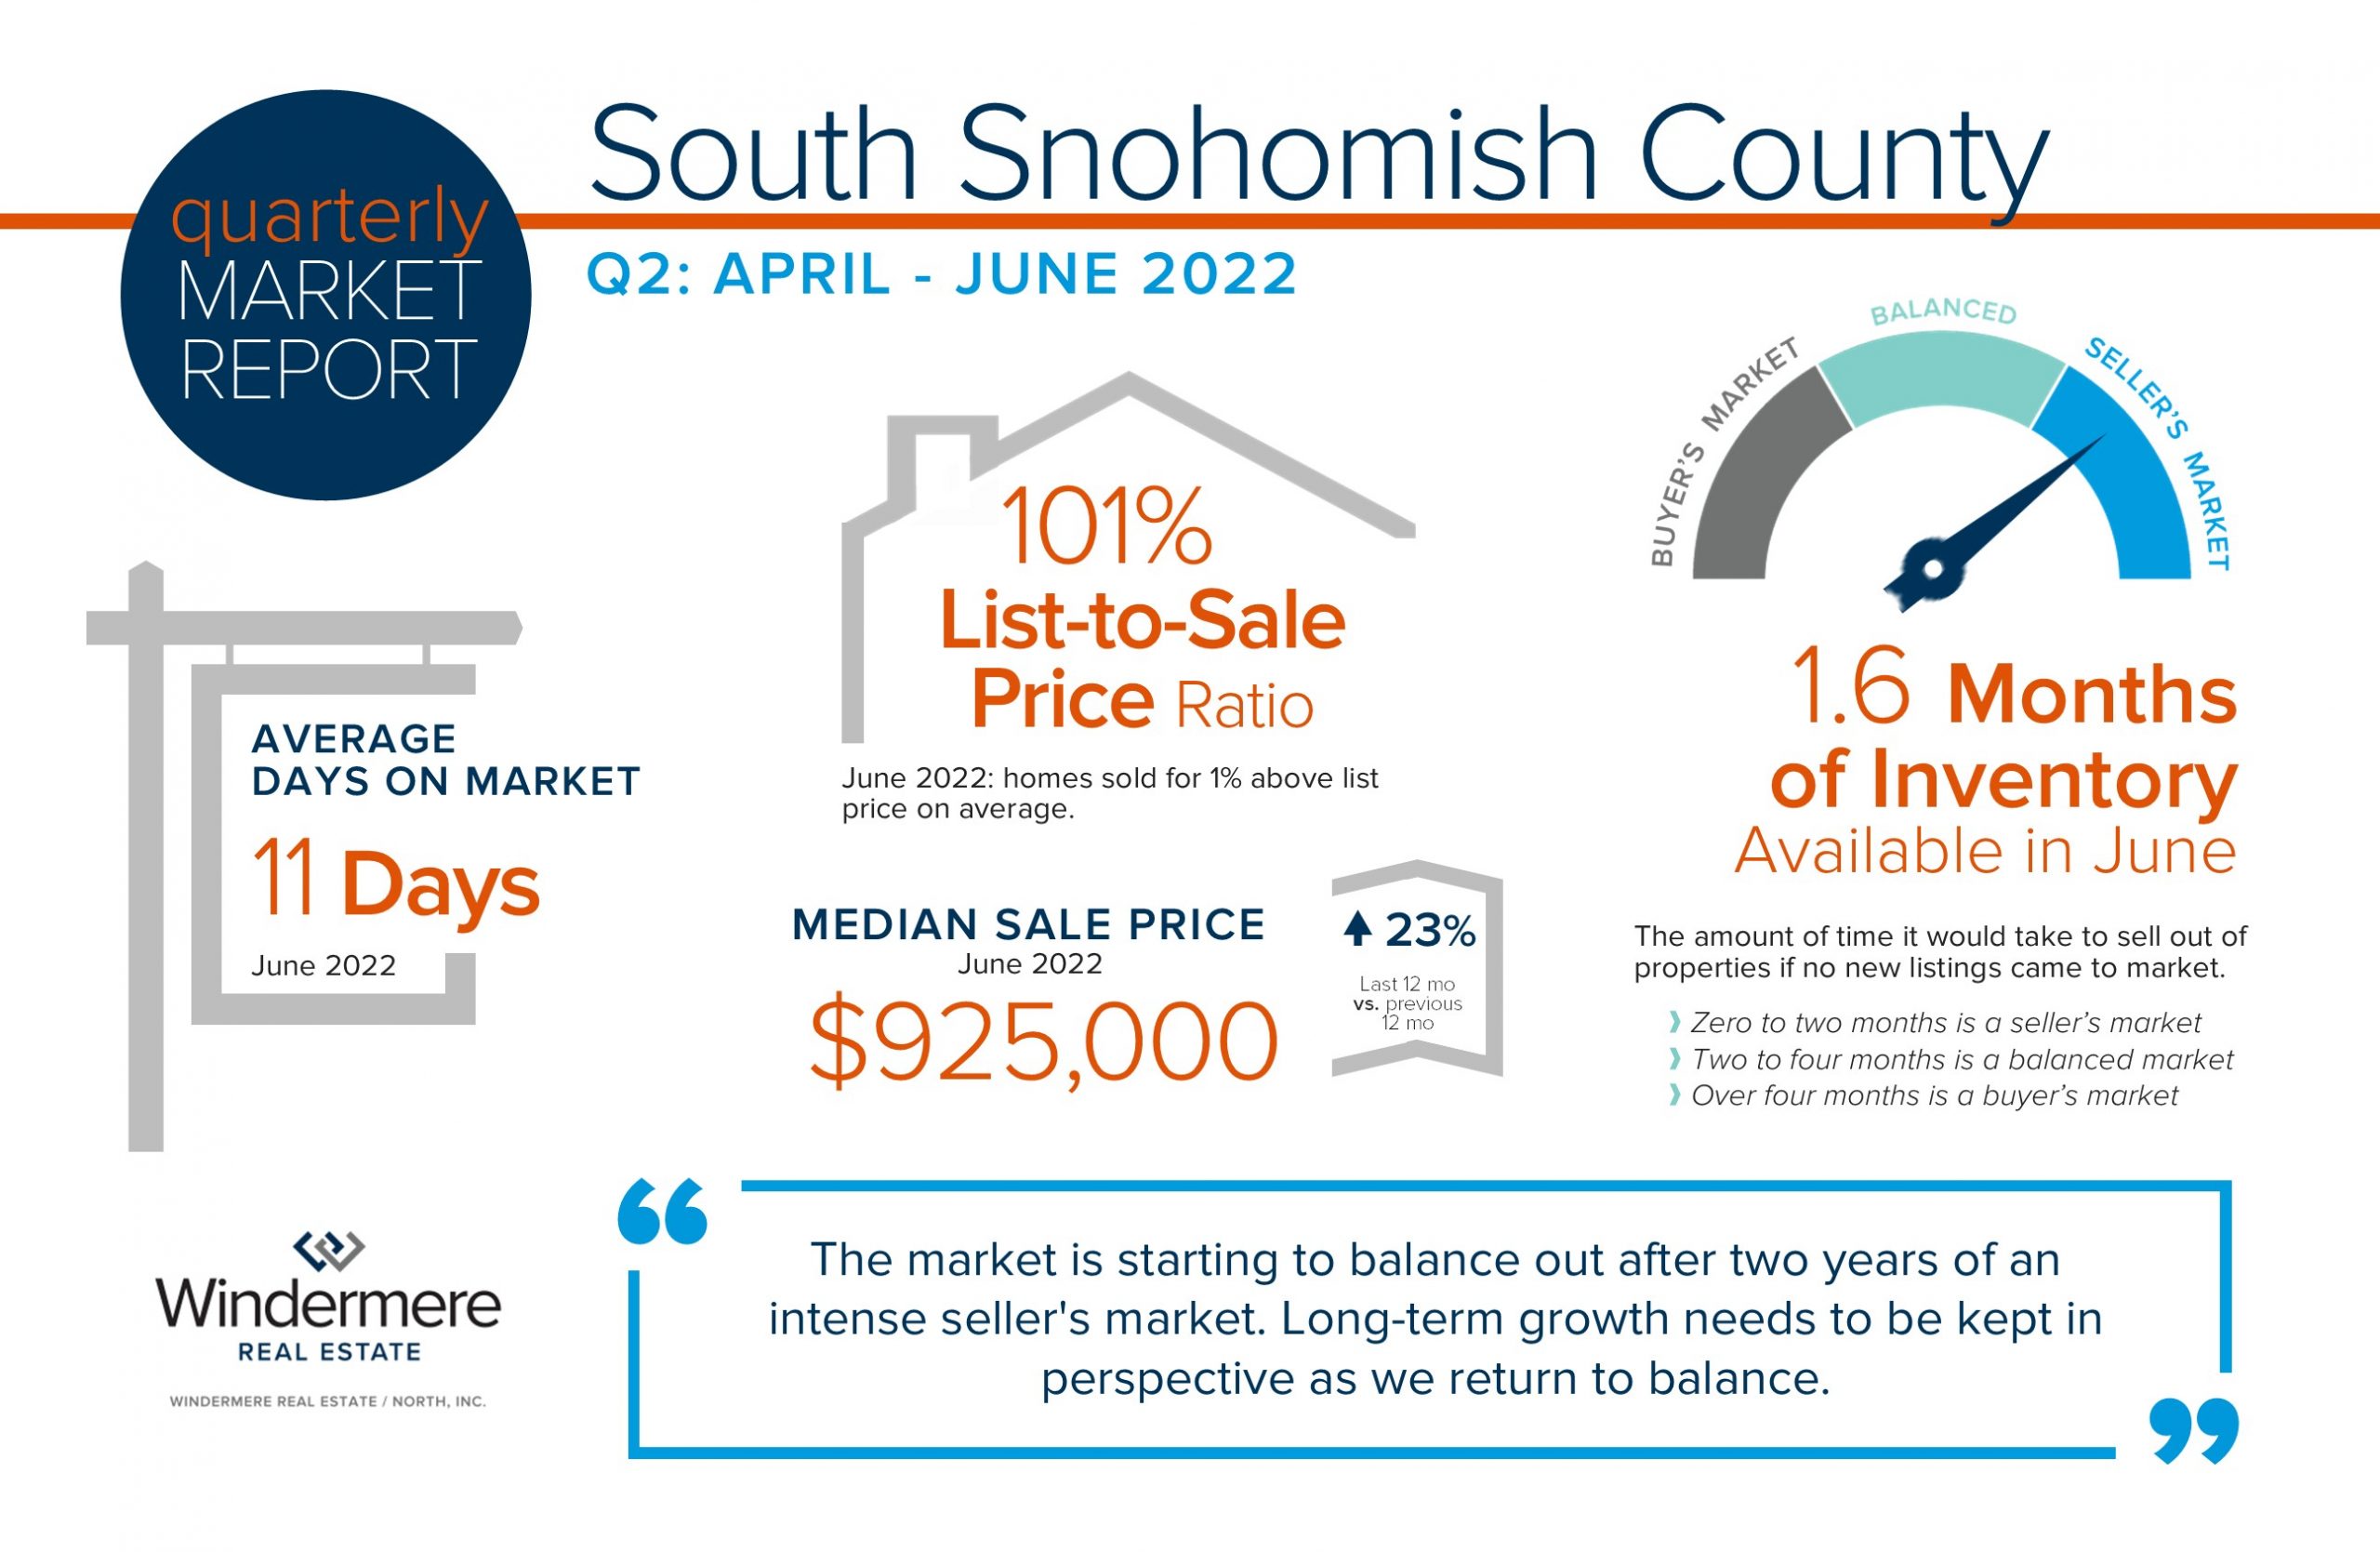
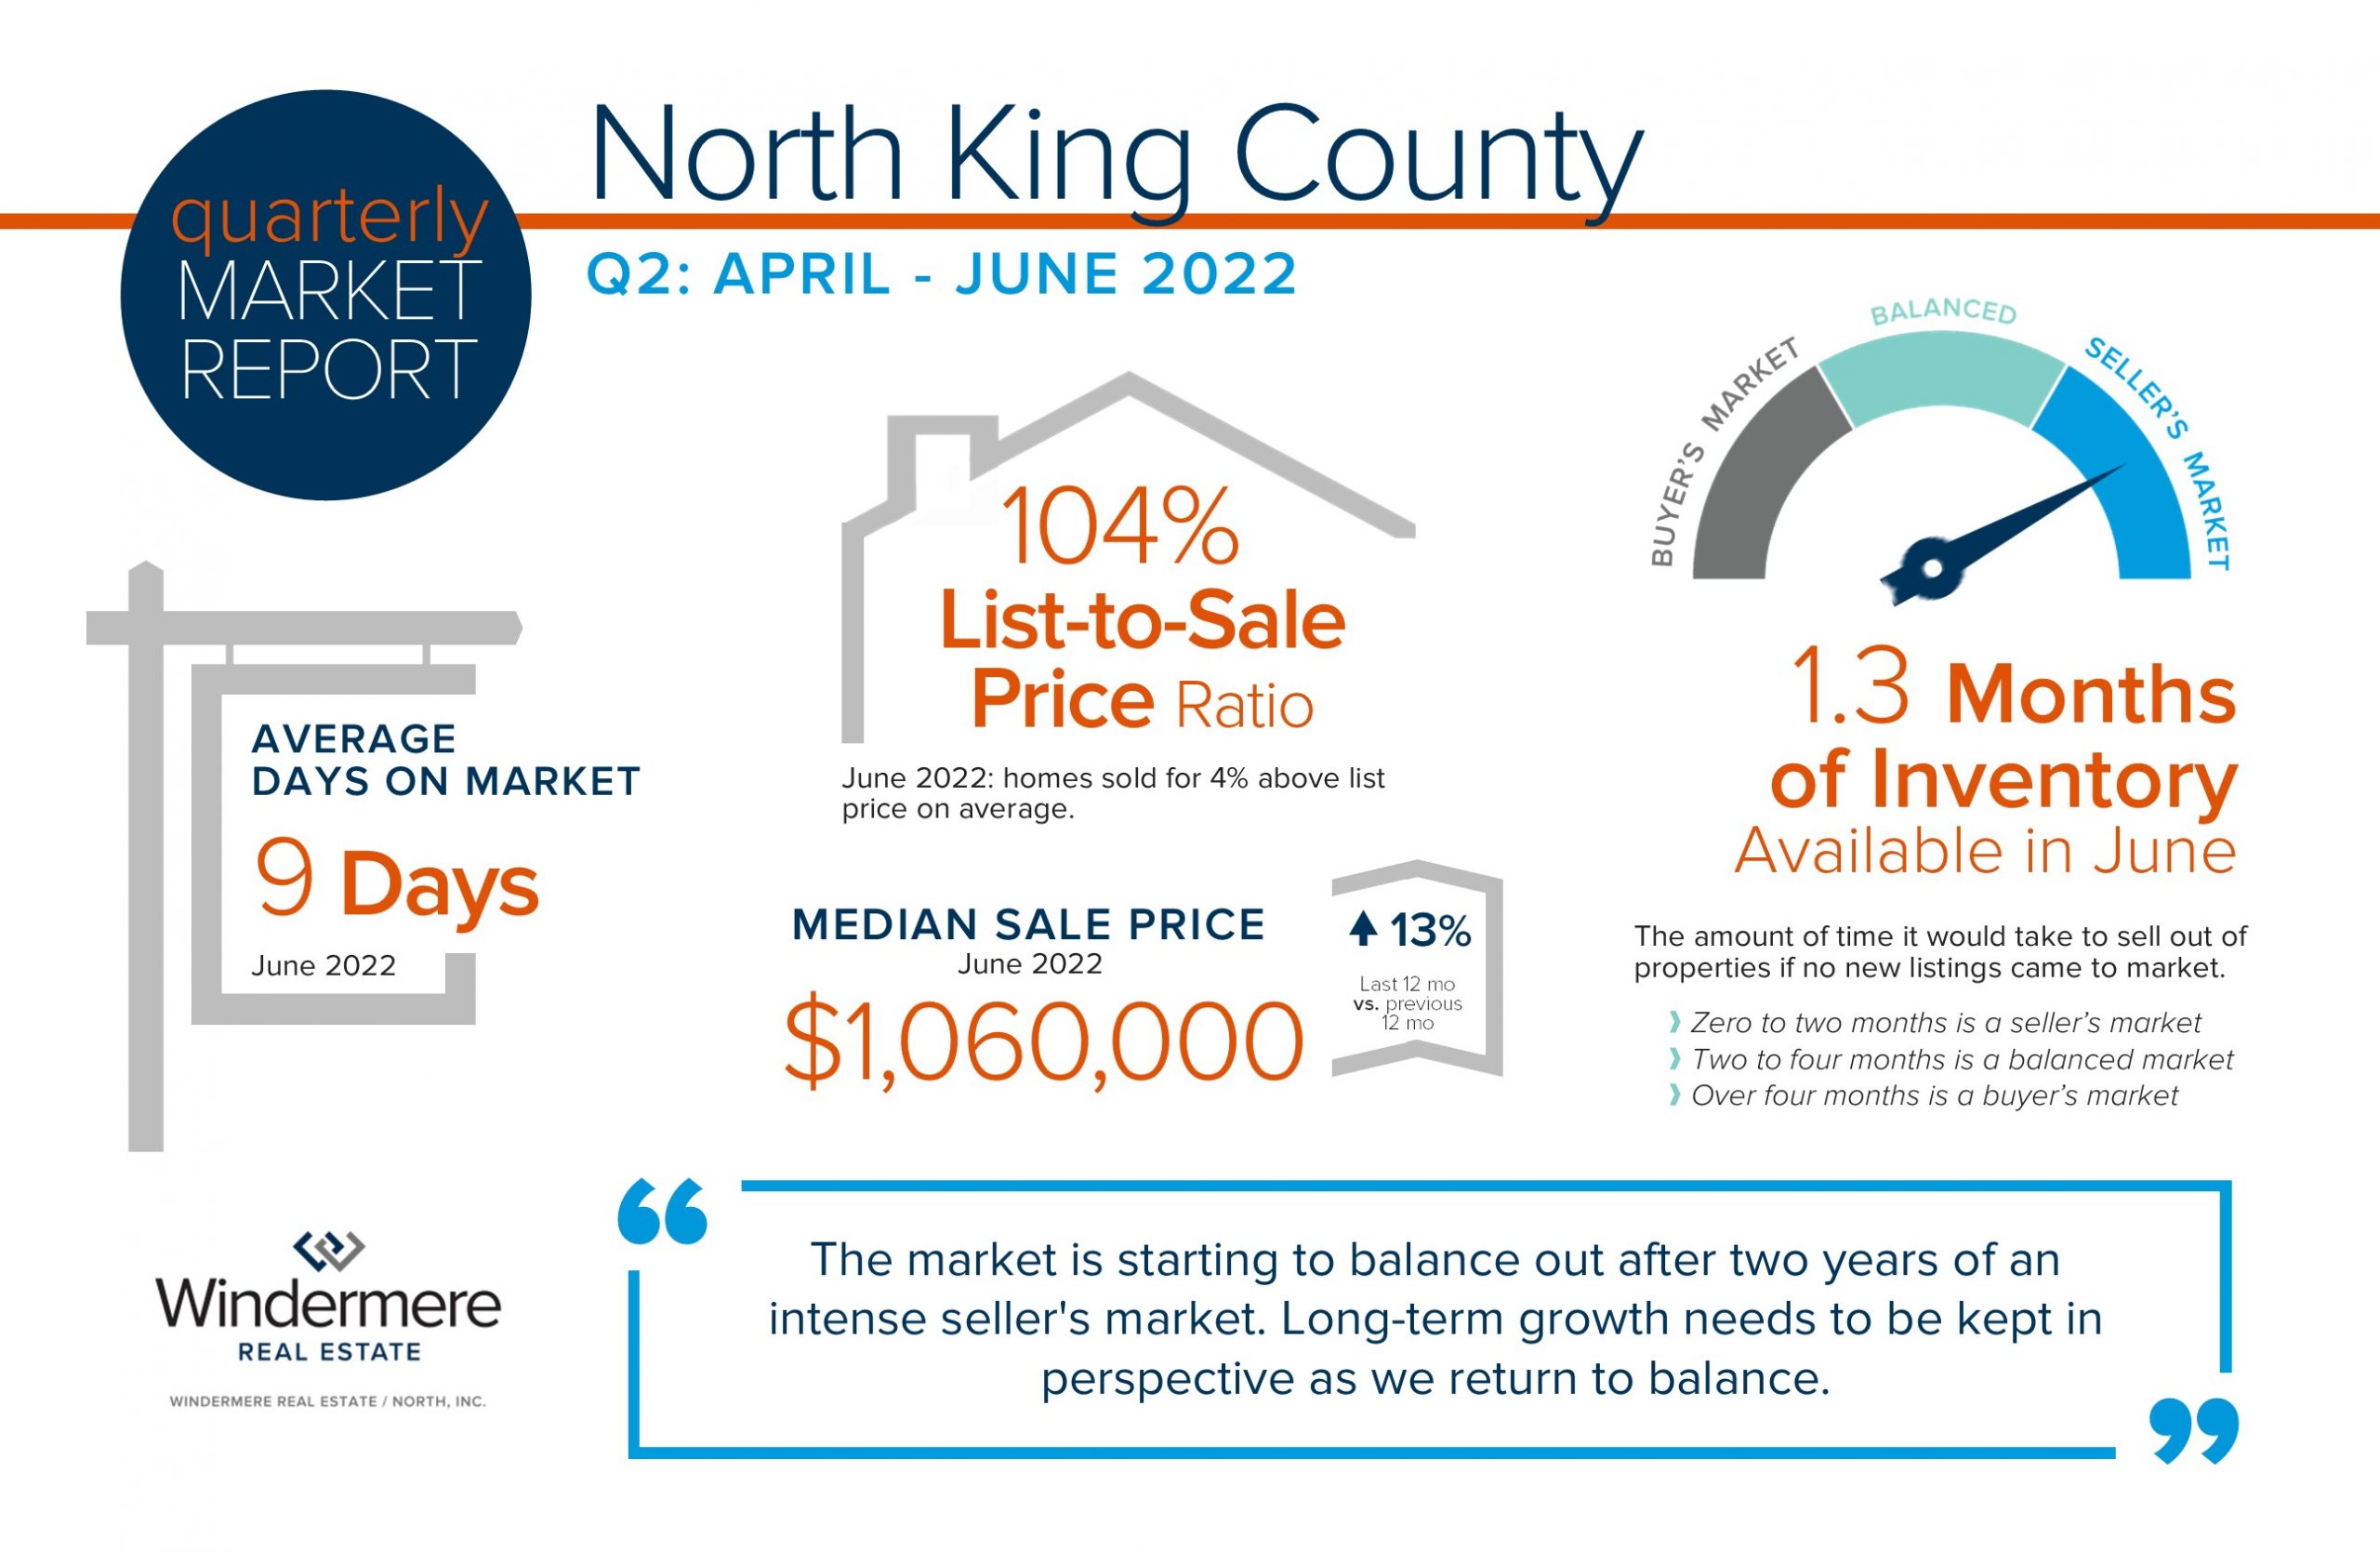
As we head into the second half of 2022, we are experiencing a shift in the real estate market. The market is starting to balance out after two years of an intense seller’s market. Q1 this year had the lowest amount of inventory we have ever seen, which put upward pressure on prices. With the addition of more homes coming to market in Q2 and a 2-point increase in interest rates since the beginning of the year, price appreciation is starting to decelerate. We are coming off the peak prices of Q1 due to these environmental adjustments but are still sitting on top of hefty year-over-year price gains.
Buyers have more selection to choose from, which has reduced the number of multiple offers and tempered price escalations. This has resulted in days on market becoming longer as buyers weigh their options. Sellers are still making huge returns as year-over-year price growth has been above average for the last decade. Long-term growth needs to be kept in perspective as we return to balance. If you are curious about how your real estate goals match up with the market, please reach out. It is my goal to help keep my clients informed and empower strong decisions.


Consulting your trusted advisor vs following the media


Spring is in the air! The bulbs are starting to poke out of the ground and we recently hit 70 degrees in the Greater Seattle area. This is the time of year, due to weather and the end of the school year approaching, that the local real estate market starts to take off with activity. Not only is the sun thawing out gardens and backyard patios, helping to ready homes for market, but interest rates are continuing to fall, providing a heyday for buyers and sellers.
Spring is the time of year we see more homes come to market providing more selection for buyers. This is what we call our peak season. This spring, however, is especially meaningful due to the recent decrease in interest rates. Seasonality naturally brings more activity, but 2019 has started out with a downward trajectory in regards to interest rates, which has been a welcome shift after watching rates increase by almost an entire point over the course of 2018.
According to Ycharts.com, as of March 14th the US 30-year mortgage rate is at 4.31%, compared to 4.41% the week prior and 4.46% last year. This is quite a bit lower than the long term average of 8.07%. Additionally, rates are now over half a point lower than they were just four months ago, which gives buyers 5% more buying power. Meaning they can increase their price range by 5% and keep the same mortgage payment.
We are beginning to see a ton of activity at open houses, market times are starting to shrink, and multiple offers are popping up again. Demand is on the rise, with first-time home buyers out in full-force along with move-up and down-size buyers all going after the same inventory. Price appreciation will start to happen again month-over-month as the tulips start to open and veggie gardens start sprouting.
This assessment is not only factual and researched, it is anecdotal. You see, statistics are only reported monthly from the NWMLS, so the stories from the streets tell the real story of where we have been, what’s happening now, and where we are headed in the real estate market. My daily engagement with the market, either helping buyers or sellers, researching values, showing properties, negotiating contracts, and working on inspections and appraisals helps me to be informed of the trends before they are even reported.
Around the third of each month, the NWMLS distributes a press release to the media reporting the previous month’s statistics. The media grabs the numbers that are most exciting to them to craft a story around. They create headlines to entice readership, which in turn sells advertising. The problem is that these news stories often only tell part of the story.
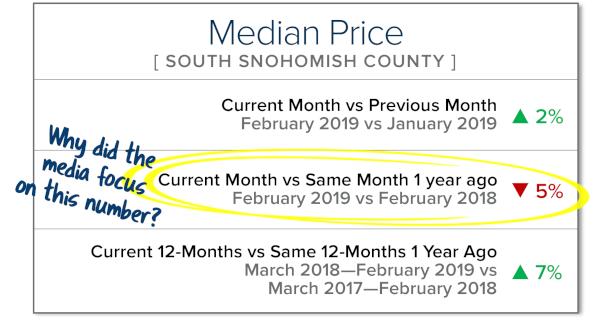
A classic example of cherry picked statistics used to create a headline came earlier this month. The Seattle Times reported in a sub-headline that Snohomish County home prices were falling at their fastest rate in seven years. This is simply not the whole truth. This is a common tactic of the media often only using month-over-month numbers (comparing the current month to the same month a year ago) versus a complete year-over-year analysis. Real estate is a long-term investment, and month-over-month numbers tend to provide more of a snapshot rather than a longer-term analysis of data and what influenced it.
We need to look at the data from all angles. Where were we a year ago, what has happened over the course of the last year in comparison to the previous year, and what happened this month compared to last month? Real-time experiences matter too, as the market changes weekly and even daily. Interactions throughout the month help me understand what opportunities the current environment will provide before the ink even dries on the media release. All of this helps us understand where we have come from and where we are headed. Couple that with front-line, daily experiences, and your trusted advisor can help you determine how all of this relates to your bottom line much more effectively than an article in the newspaper.
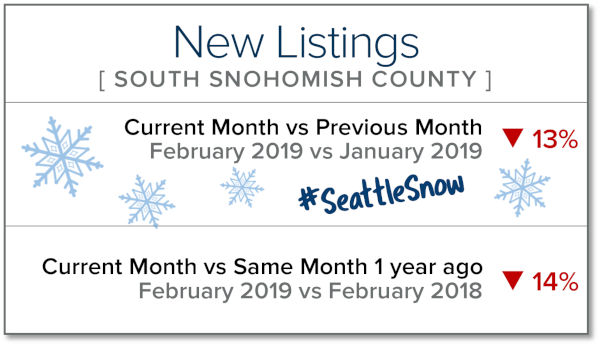
Another important factor to consider is that the bulk of the statistics reported in that monthly NWMLS press release are based on closed sales. While closed sales are very important, we must also closely track pending sales activity (homes currently under contract). Closed sales show where we have been and pending sales indicate where we are headed. February was a misleading month because of Snowmageddon. It halted new inventory reaching the market and kept buyers at home. The second half of February once the roads were cleared, had buyers lined up. Many of those buyers are anxiously waiting for that seasonal surge in inventory as we head into spring. This is indicated by conversations being had at open houses and one-on-one encounters with clients. Buyers want to take advantage of these surprisingly low interest rates now and sellers are enjoying the audience they are providing.
Unfortunately, the media is the initial source of information, and sometimes the only source a consumer considers when making such big decisions. I can’t tell you how often I encounter people that are grossly misled by alarming headlines and bite-sized bits of media when it comes to their largest asset, or the consideration of entering into home ownership.
Supply and demand illustrates where we are at in the market, and factors such as interest rates, the local and global economy, and simple things like weather and consumer mindset drive the market. Consumer mindset is influenced by the media. Take it a step further and make sure you are aligned with a professional who is committed to tracking all of this and can help explain how it all relates to you. Everyone has their own goals and their own concerns; it is the analysis of a well-researched trusted advisor that can help you navigate these meaningful financial decisions. It is our goal to provide our clients with the most up-to-date information to help empower strong decisions. If you are curious how this all relates to you, please reach out. We would be happy to connect you with agent who can discuss and help educate.
Quarterly Reports: Q4 South King County
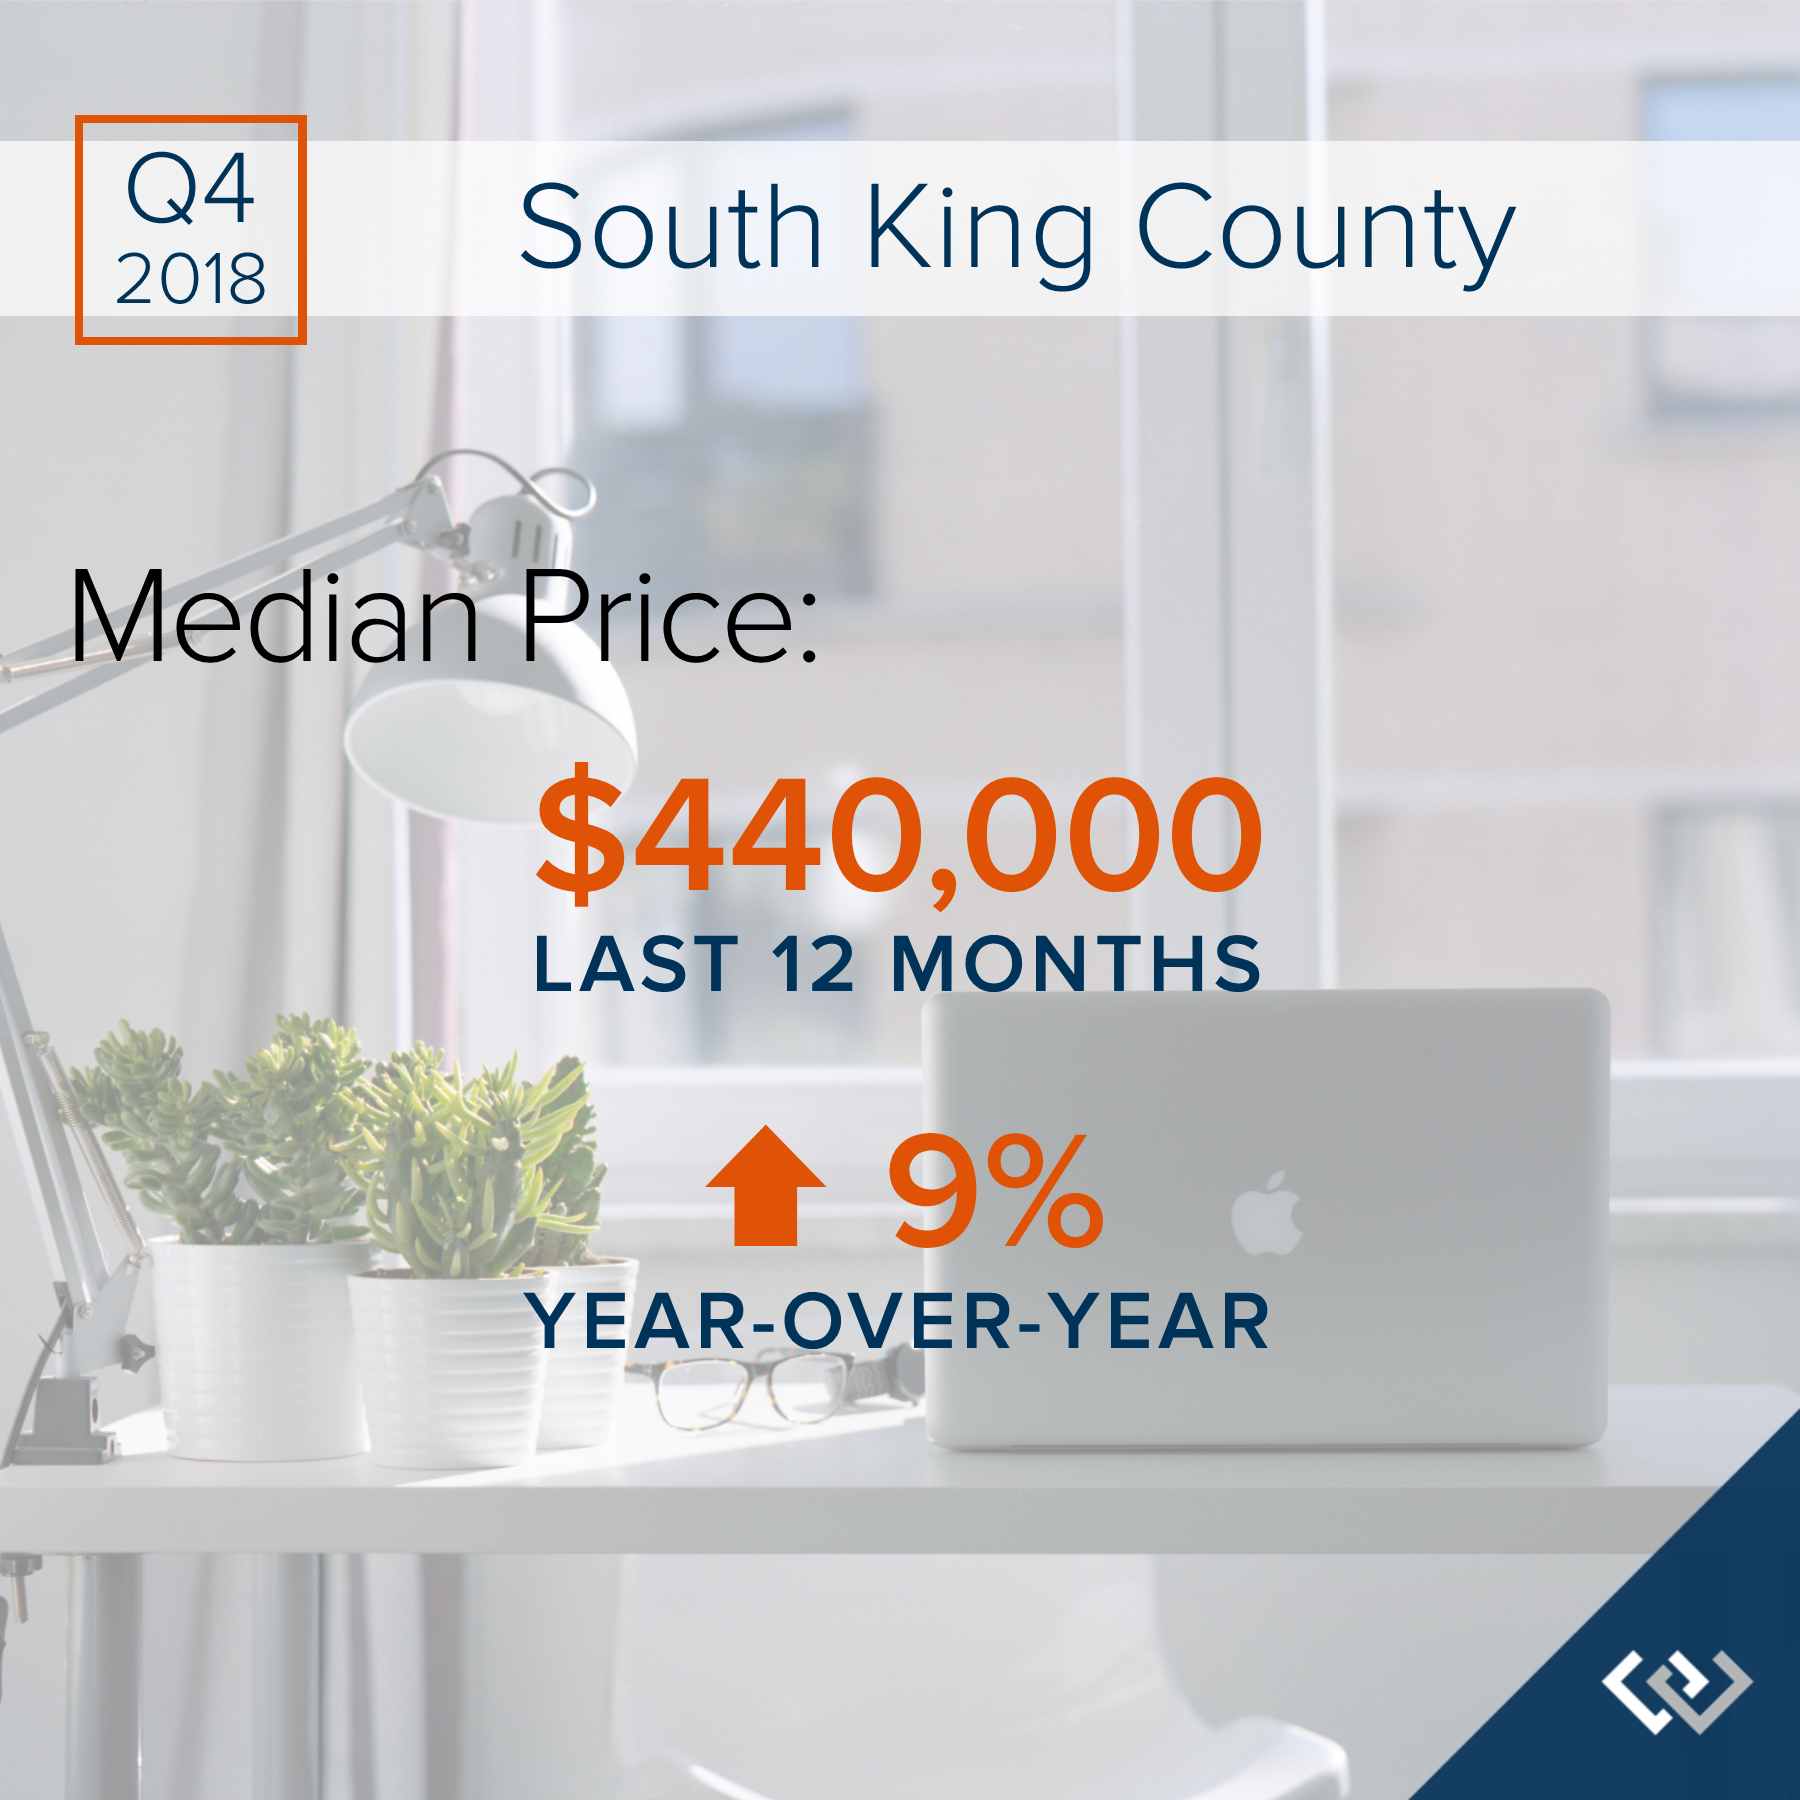
Q4: October 1 – December 31, 2018
SOUTH KING COUNTY: 2018 was a year of change and growth. The market shifted from an extreme seller’s market, but still had strong gains. Year-over-year, median price is up 9% and since 2012 has increased 89%! Over the last 19 years, the average year-over-year price increase has been 6%. This puts into perspective the growth we have experienced, resulting in well-established equity levels. In 2018, inventory averaged 1.7 months, 30% more than 2017. This caused the month-over-month price gains to slow, and we experienced a price correction over the second half of the year. We expect to see more average levels of price appreciation in 2019 as the market continues to balance out.
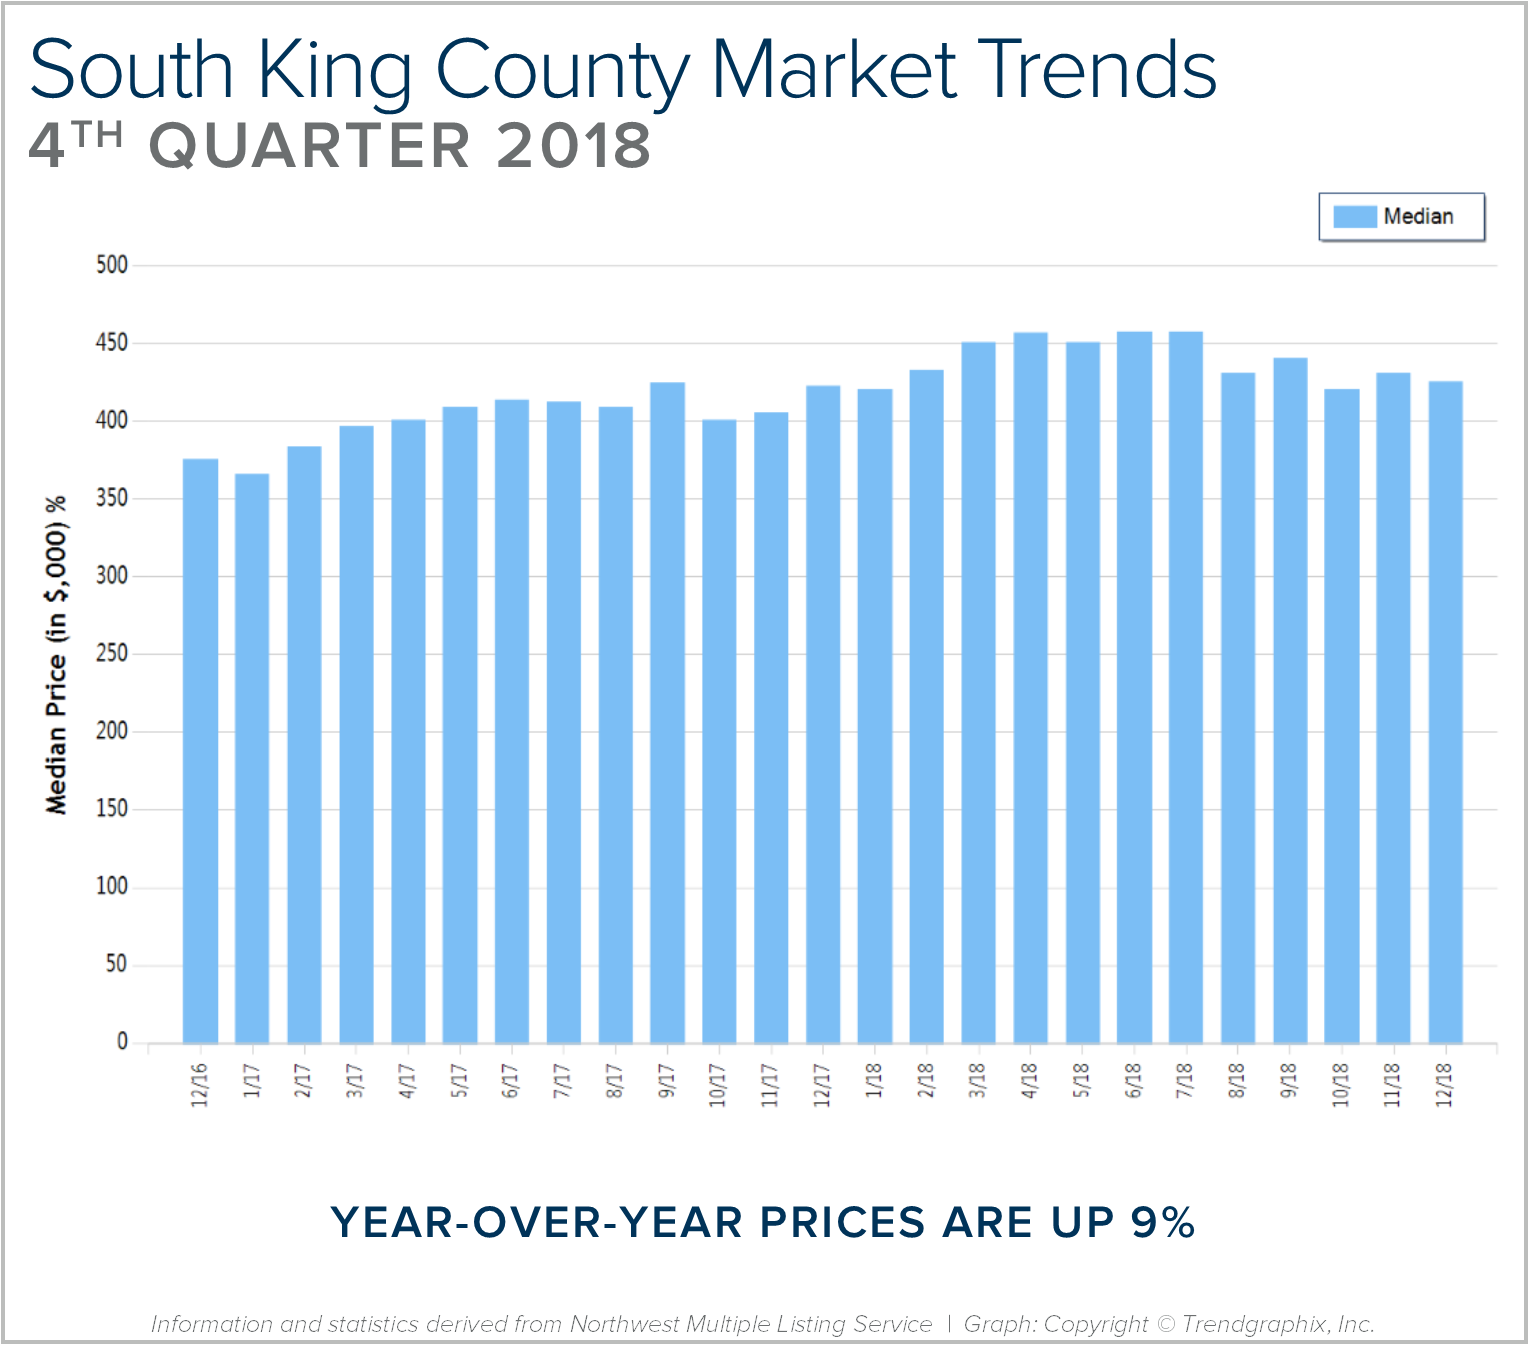
After six years of expansion resulting in an extreme seller’s market, in 2018 we encountered a market shift in the late spring. Inventory increased, interest rates took a jump, and demand took a step back to re-evaluate the new playing field. This resulted in a tempering of month-over-month price appreciation, and has established some long-awaited balance. This balance has brought opportunities for both buyers and sellers. Buyers have more selection and are negotiating terms like inspection items and concessions. Sellers are sitting on 6+ years of equity growth, and are now able to sell their home and make a move without fearing where they will land next. Interest rates are still well below the 30-year average, currently hovering just under 5%. We are seeing demand start to re-engage now that the new normal has settled in.
This is only a snapshot of the trends in south King County; please contact us if you would like further explanation of how the latest trends relate to you.
Quarterly Reports: Q4 Eastside
Q4: October 1 – December 31, 2018
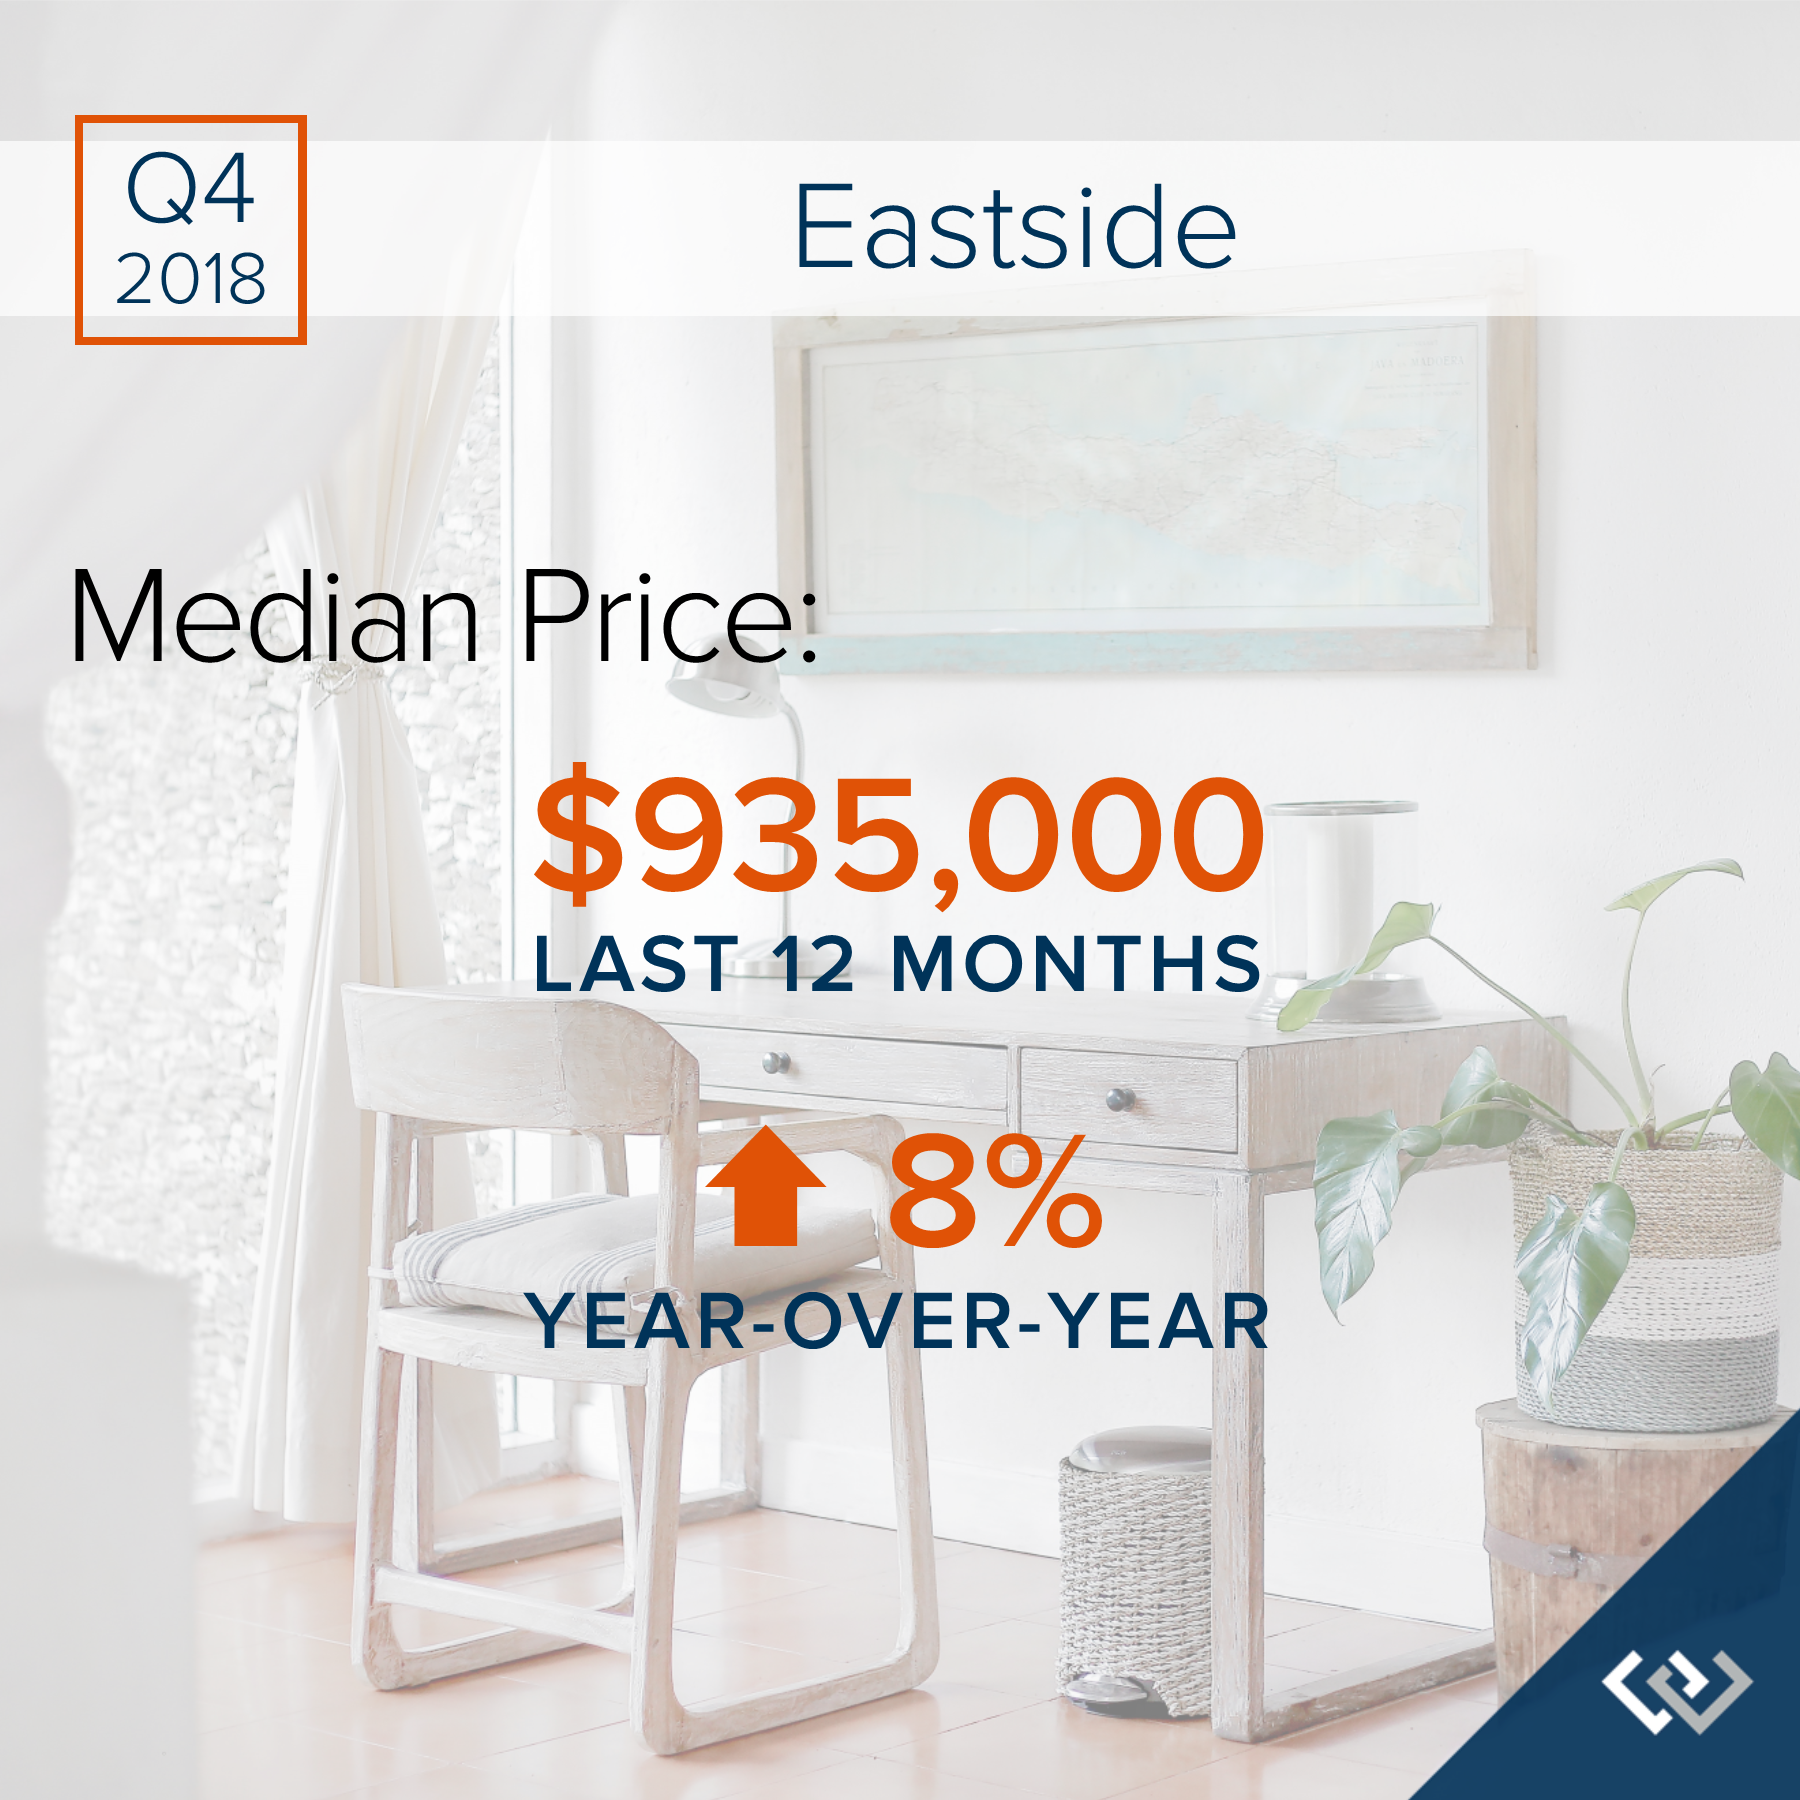
EASTSIDE: 2018 was a year of change and growth. The market shifted from an extreme seller’s market, but still had strong gains. Year-over-year, median price is up 8% and since 2012 has increased 87%! Over the last 19 years, the average year-over-year price increase has been 6%. This puts into perspective the growth we have experienced, resulting in well-established equity levels. In 2018, inventory averaged 2 months, double that of 2017. This caused the month-over-month price gains to slow, and we experienced a price correction over the second half of the year. We expect to see more average levels of price appreciation in 2019 as the market continues to balance out.
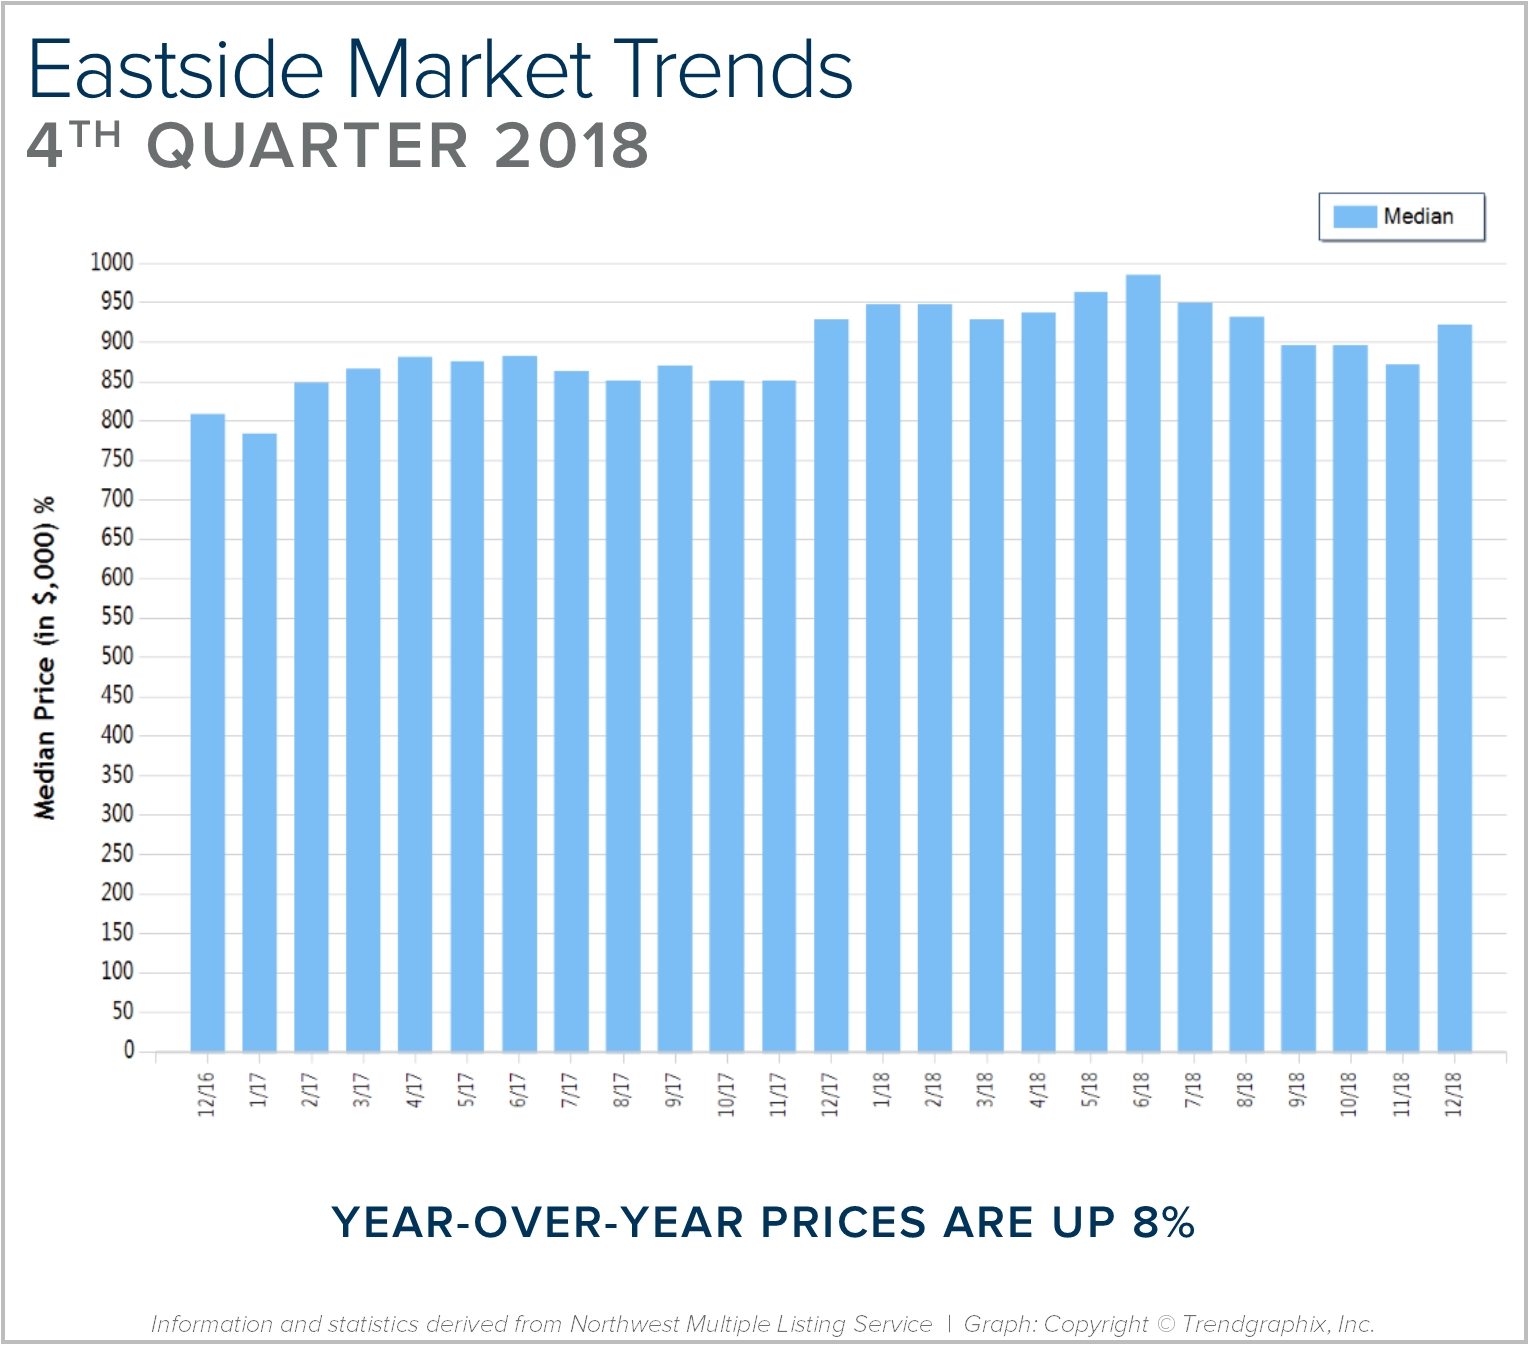
After six years of expansion resulting in an extreme seller’s market, in 2018 we encountered a market shift in the late spring. Inventory increased, interest rates took a jump, and demand took a step back to re-evaluate the new playing field. This resulted in a tempering of month-over-month price appreciation, and has established some long-awaited balance. This balance has brought opportunities for both buyers and sellers. Buyers have more selection and are negotiating terms like inspection items and concessions. Sellers are sitting on 6+ years of equity growth, and are now able to sell their home and make a move without fearing where they will land next. Interest rates are still well below the 30-year average, currently hovering just under 5%. We are seeing demand start to re-engage now that the new normal has settled in.
This is only a snapshot of the trends on the Eastside; please contact us if you would like further explanation of how the latest trends relate to you.
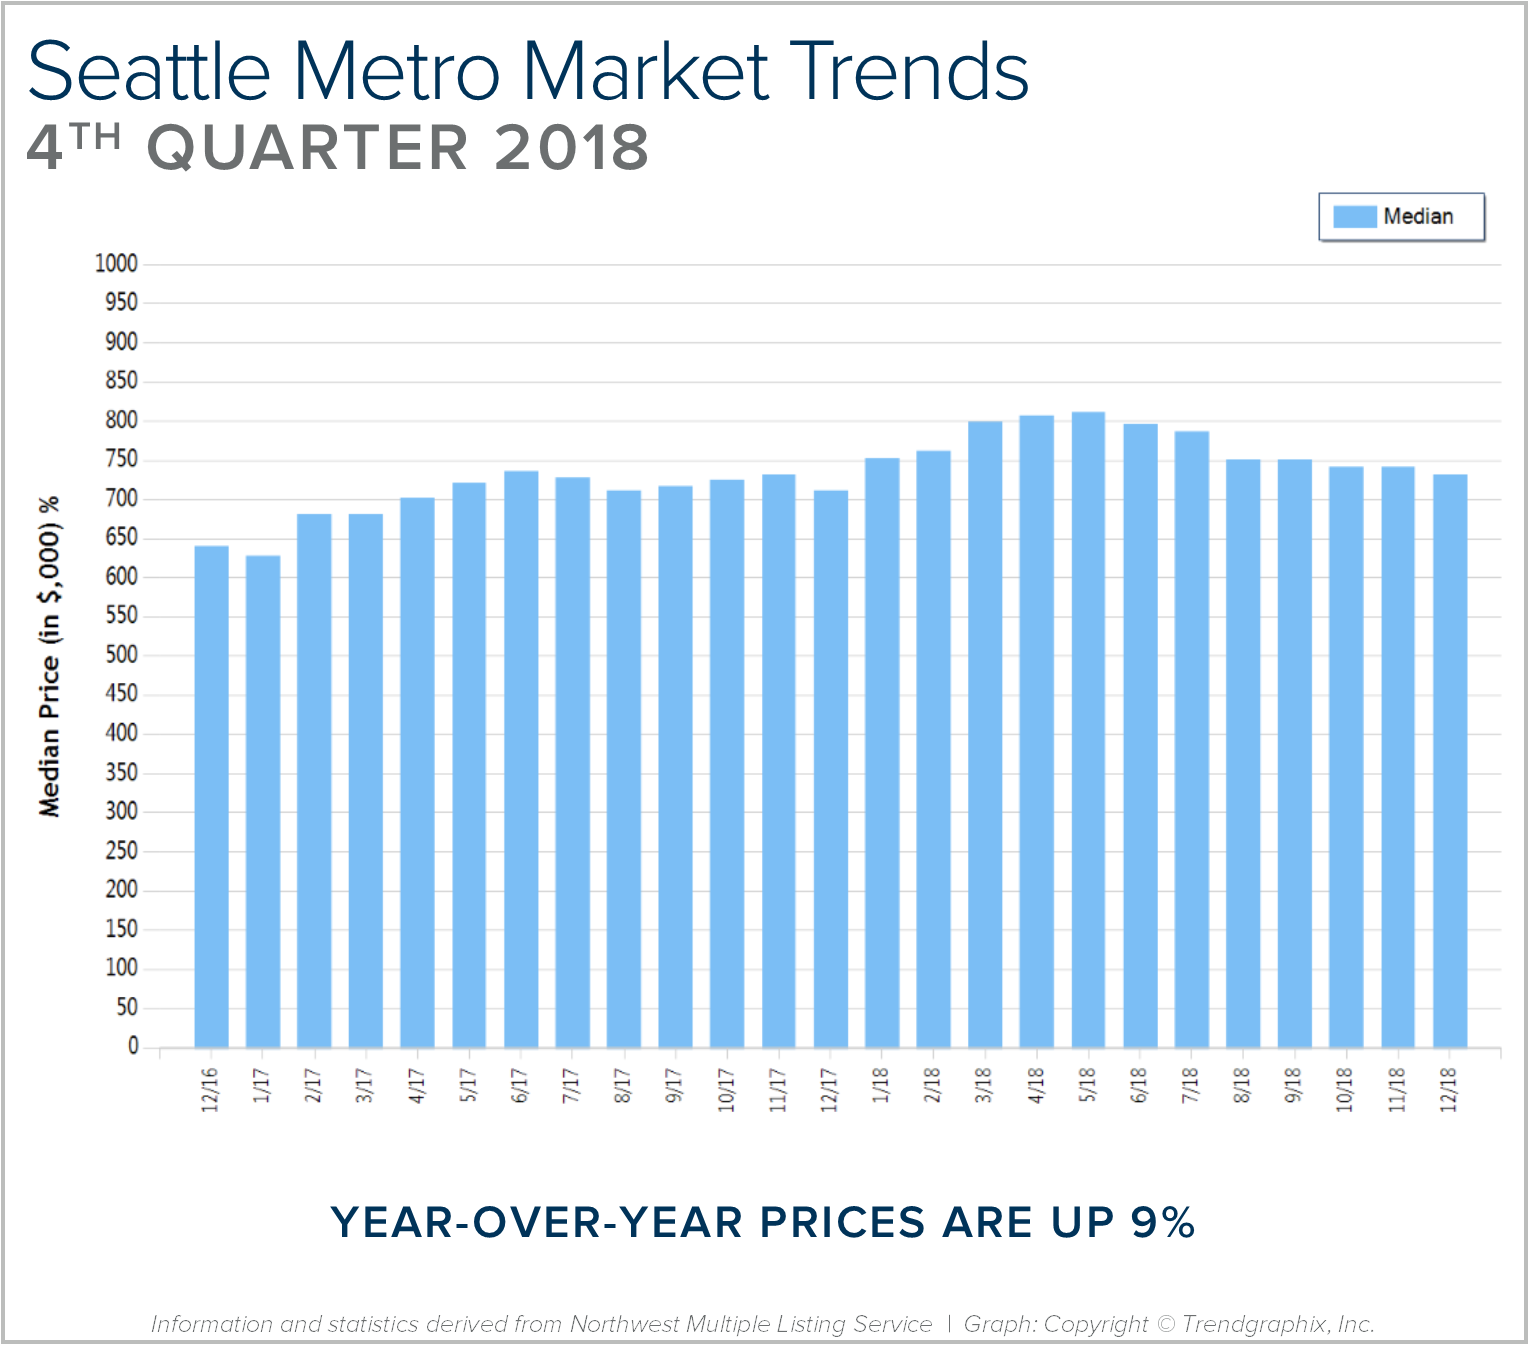
Quarterly Reports: Q4 Seattle Metro
Q4: October 1 – December 31, 2018
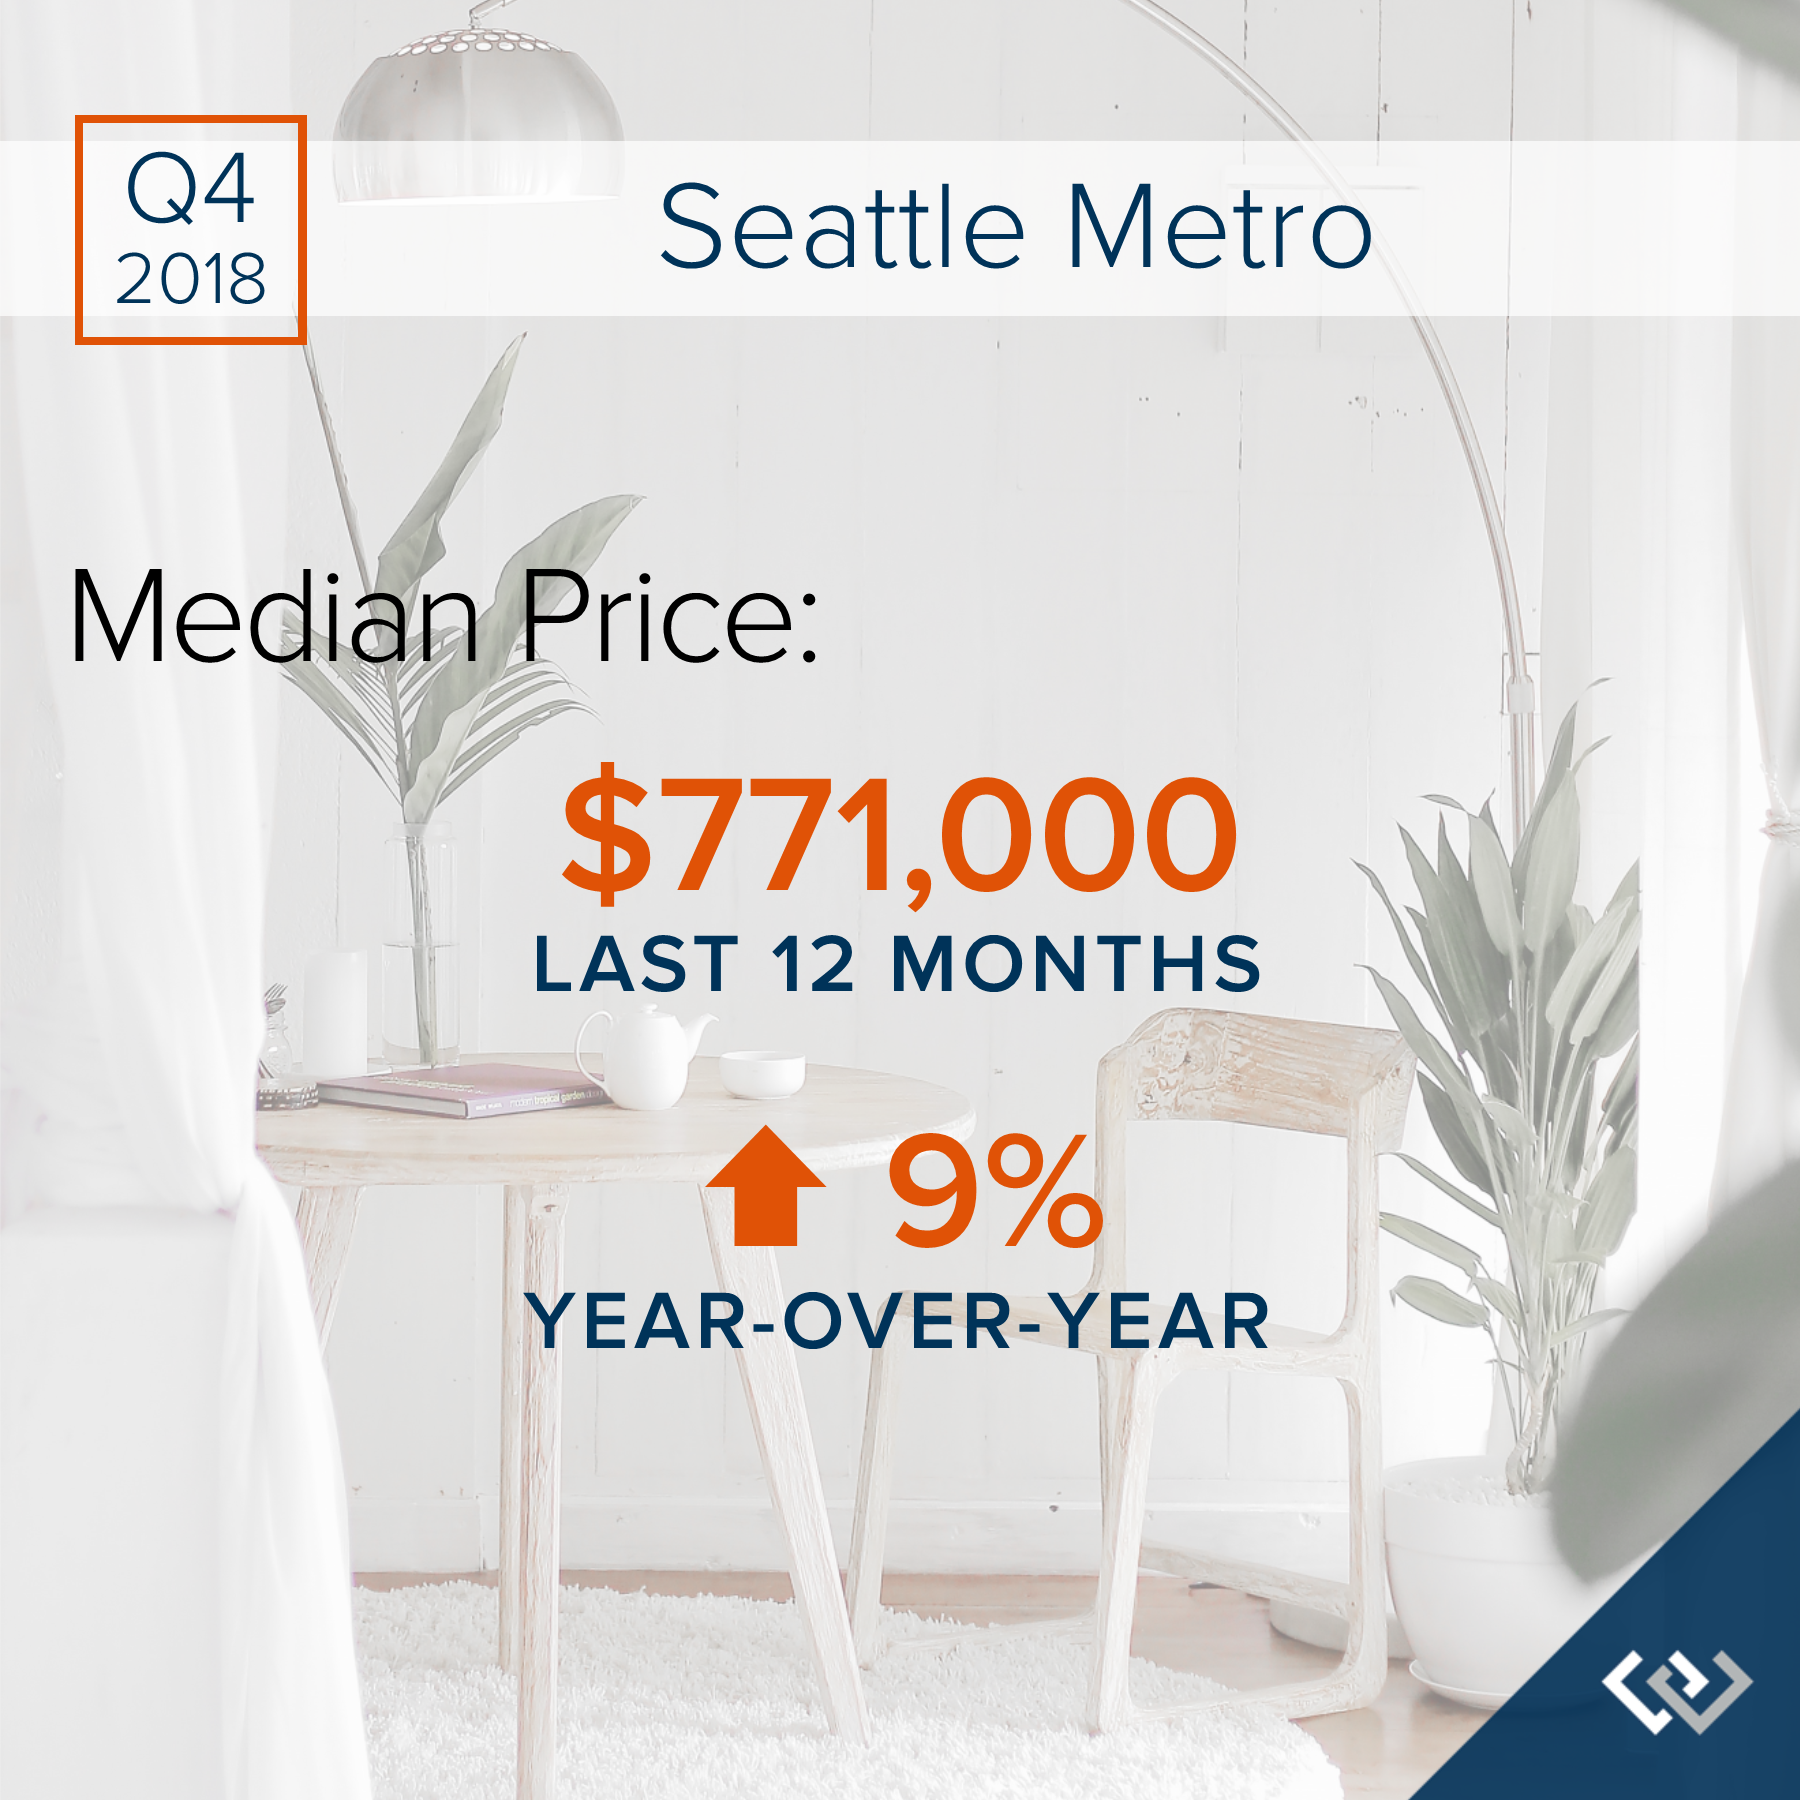
SEATTLE METRO: 2018 was a year of change and growth. The market shifted from an extreme seller’s market, but still had strong gains. Year-over-year, median price is up 9% and since 2012 has increased 93%! Over the last 19 years, the average year-over-year price increase has been 6%. This puts into perspective the growth we have experienced, resulting in well-established equity levels. In 2018, inventory averaged 1.5 months, double that of 2017. This caused the month-over-month price gains to slow, and we experienced a price correction over the second half of the year. We expect to see more average levels of price appreciation in 2019 as the market continues to balance out.
After six years of expansion resulting in an extreme seller’s market, in 2018 we encountered a market shift in the late spring. Inventory increased, interest rates took a jump, and demand took a step back to re-evaluate the new playing field. This resulted in a tempering of month-over-month price appreciation, and has established some long-awaited balance. This balance has brought opportunities for both buyers and sellers. Buyers have more selection and are negotiating terms like inspection items and concessions. Sellers are sitting on 6+ years of equity growth, and are now able to sell their home and make a move without fearing where they will land next. Interest rates are still well below the 30-year average, currently hovering just under 5%. We are seeing demand start to re-engage now that the new normal has settled in.
This is only a snapshot of the trends the Seattle Metro area; please contact us if you would like further explanation of how the latest trends relate to you.
Quarterly Reports: Q4 North King County
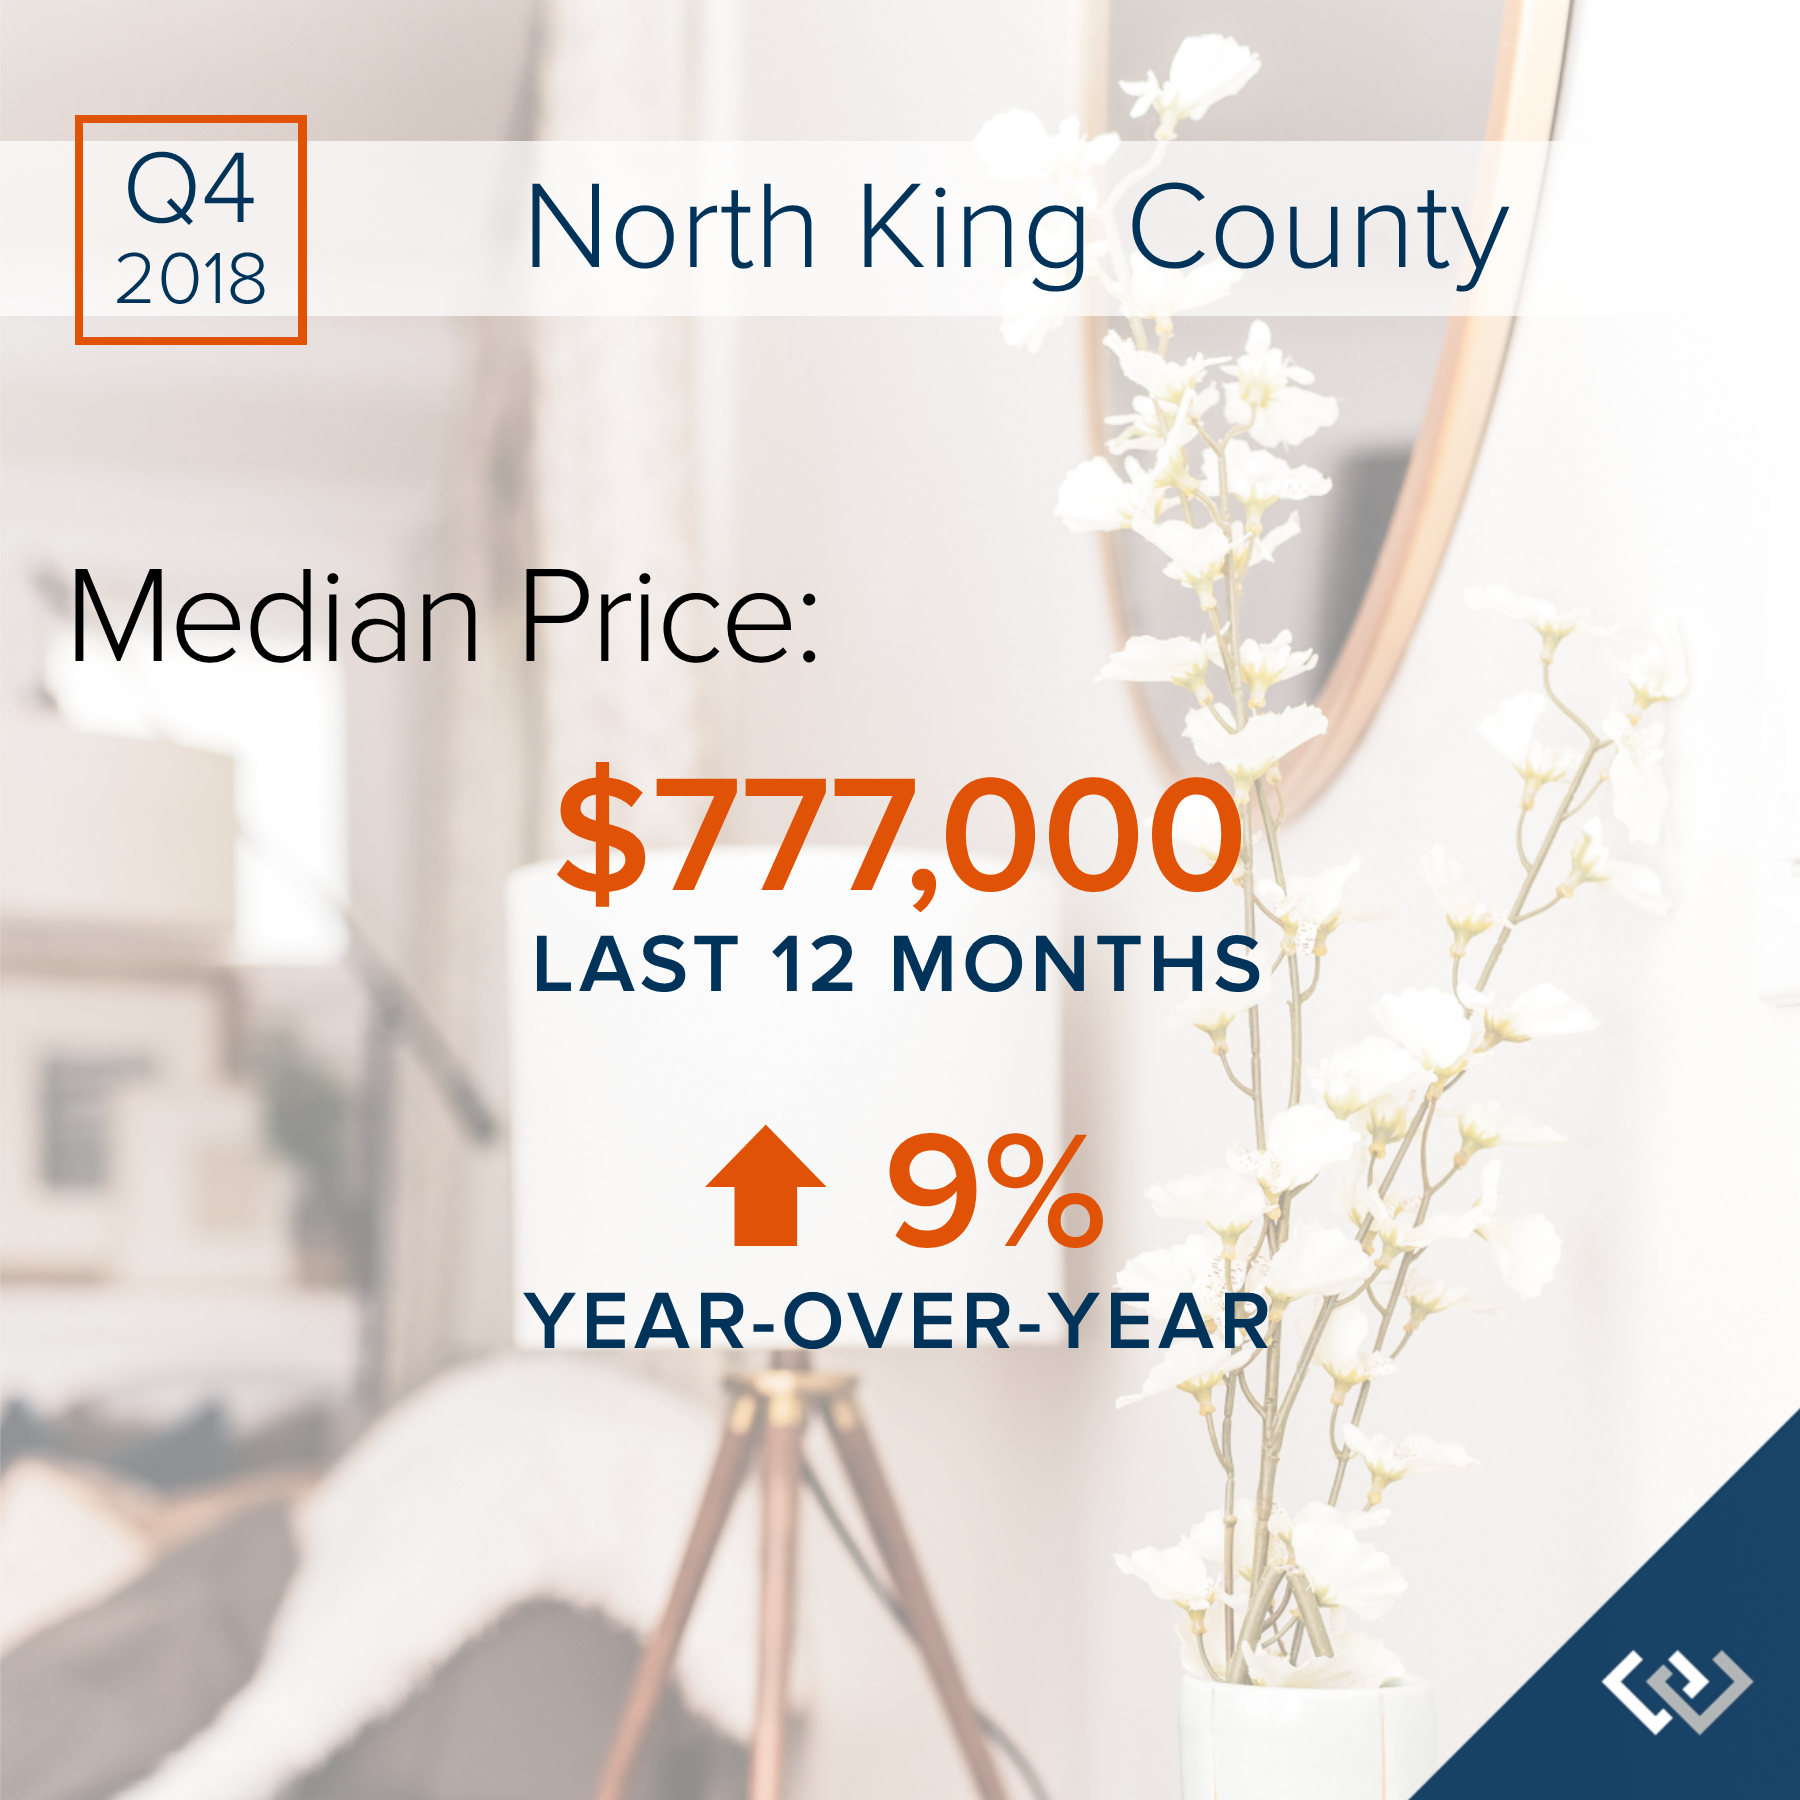
Q4: October 1 – December 31, 2018
NORTH KING COUNTY: 2018 was a year of change and growth. The market shifted from an extreme seller’s market, but still had strong gains. Year-over-year, median price is up 9% and since 2012 has increased 92%! Over the last 19 years, the average year-over-year price increase has been 6%. This puts into perspective the growth we have experienced, resulting in well-established equity levels. In 2018, inventory averaged 1.5 months, double that of 2017. This caused the month-over-month price gains to slow, and we experienced a price correction over the second half of the year. We expect to see more average levels of price appreciation in 2019 as the market continues to balance out.

After six years of expansion resulting in an extreme seller’s market, in 2018 we encountered a market shift in the late spring. Inventory increased, interest rates took a jump, and demand took a step back to re-evaluate the new playing field. This resulted in a tempering of month-over-month price appreciation, and has established some long-awaited balance. This balance has brought opportunities for both buyers and sellers. Buyers have more selection and are negotiating terms like inspection items and concessions. Sellers are sitting on 6+ years of equity growth, and are now able to sell their home and make a move without fearing where they will land next. Interest rates are still well below the 30-year average, currently hovering just under 5%. We are seeing demand start to re-engage now that the new normal has settled in.
This is only a snapshot of the trends in north King County; please contact us if you would like further explanation of how the latest trends relate to you.
