
 Facebook
 X
X
 Pinterest
 Copy Link
Contingent Offers Making a Comeback?

With a healthy increase in inventory since May, the need for buyers to have all their down payment funds immediately available, and a willingness to make offers with no contingencies, has passed in most cases. It has been quite a relief, and is providing opportunities for many folks that have wanted to cash in on their well-developed equity levels, and either move up to a bigger home or down size (right size) to a home that better fits their current lifestyle.

For the first time in years we are starting to see an increase in contingent offers that are turning into pending transactions. A contingent sale is one where a buyer makes an offer to purchase their next home contingent on the sale of their current home. In some cases, the buyer’s current home may be already on the market, or in other cases they still need to launch their home to the market. Many buyers in this situation wait to find a home/seller that is willing to accept their contingent offer, and then they immediately launch their home onto the market.
The goal is a sale within 30-45 days, which will then provide the buyer with their down payment funds, and then close both properties within days of each other, making a smooth transition from one house to the next. We have not seen inventory levels the way they are now since late 2014, so the opportunity for successfully executing a contingent offer has not been an option for 4 years! It is a great time to seize this opportunity. With that said, let’s look at some statistics which highlight some of the gains there are to be had.
First and foremost, let’s look at year-over-year price appreciation. Over the last 12 months, we have seen an 11% increase in prices in both King and Snohomish Counties. Last year, the year-over-year price appreciation was 14% for both counties. This illustrates that price appreciation is slowing, or softening, if you will, due to the increase in inventory levels. This is a welcome trend as we move away from unsustainable appreciation levels, which is helping to stabilize affordability. Bear in mind that a historically-normal appreciation rate is 3-5%, so we are still a ways away from reaching that baseline.
The current market environment for both counties is still a seller’s market, sitting at 2.6 months of inventory based on pending sales for King, and 2.3 for Snohomish. A balanced market is representative of 3-6 months on inventory; we are currently just under that, but well above the extreme 0.5-0.8 months that we experienced over the last year or so. This has created more selection, which has minimized multiple offers and given buyers the opportunity to write offers with more comfortable terms, such as a home sale contingency.
Lastly, let’s talk interest rates! Currently, they are hovering around 5%. Yes, this is up from the 4.5% we saw earlier this year, but still well below the 30-year historical average of 6.7%. Money is still relatively cheap to borrow, and this should be taken advantage of as experts predict interest rates to rise as we head into 2019 and beyond. Your interest rate is typically fixed for the life of your loan, so rate plays into the long-term savings you can have on your asset if locked in at today’s levels.
If you have thought about making a move to a home that is a better fit for your current lifestyle, but have been stalled because you weren’t sure how to do it, now is the time to consider your options. Please reach out if you’d like a review of the current market conditions and how they relate to your goals. It is our goal to help keep our clients informed and empower strong decisions.
Quarterly Reports: Q3 South Snohomish
Q3: July 1 – September 30, 2018
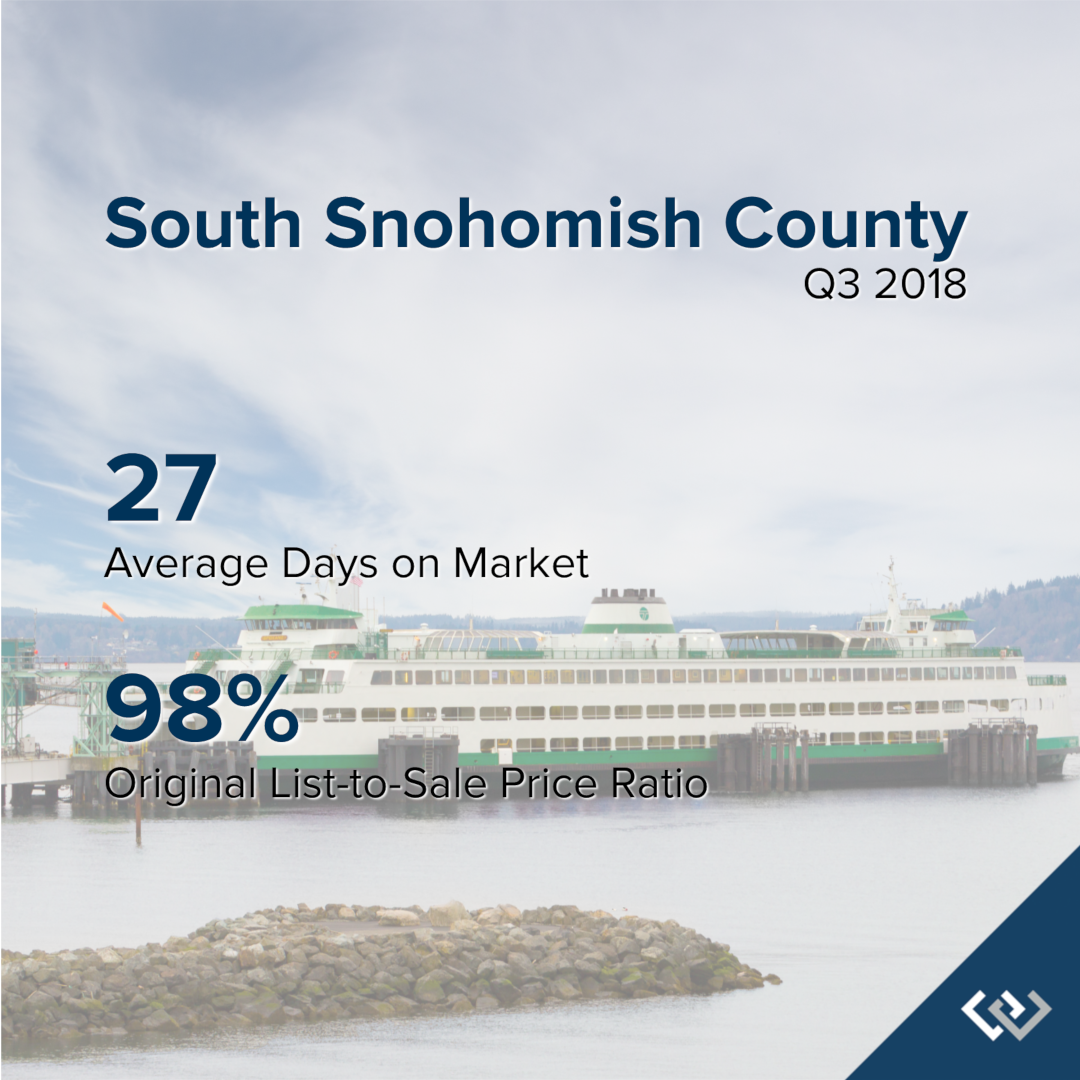
SOUTH SNOHOMISH COUNTY: In September, the average days on market landed at 27 days and the original list-to-sale price ratio 98%. Since May, inventory growth has been noticeable, and has given buyers more options. This has led to more negotiations and fewer bidding wars, which is tempering month-over-month price growth to a more sustainable level.
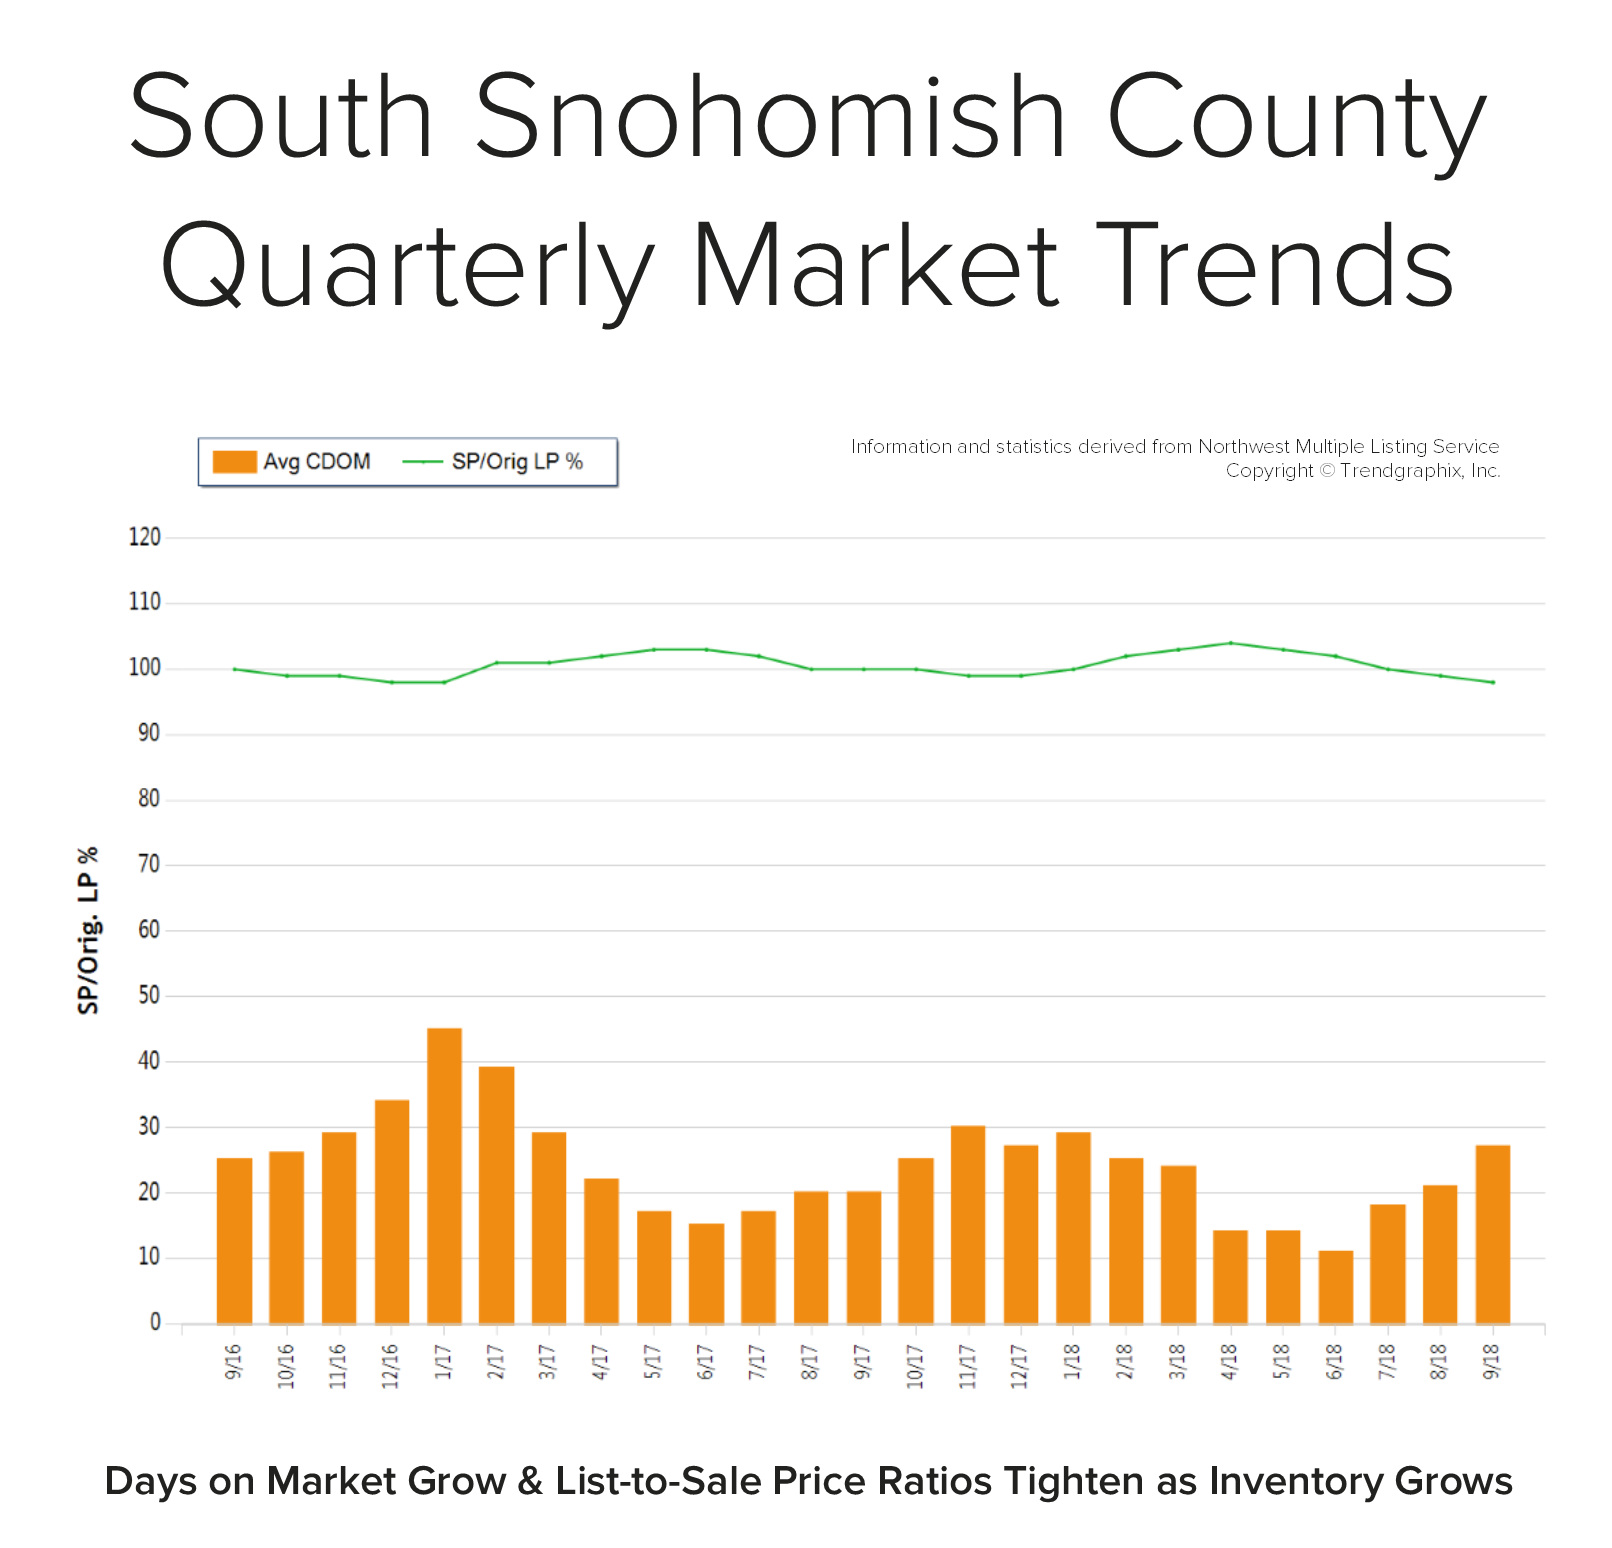 Back in April, the average days on market was 14 days and the original list-to-sale price ratio 104%; but months of inventory based on pending sales was 0.8 months, compared to 2.5 months currently. Year-over-year, prices are up 11%, still well above the historical norm of 3%-5% year-over-year gains—but note that the majority of this growth happened during the spring, due to constricted inventory levels.
Supply has increased, creating more options for buyers and helping to buffer affordability issues. Many sellers are deciding to make moves and cash in on the equity gained over the last six years. An average original list-to-sale price ratio of 98% is a positive return, yet illustrates a softening in the market after some very extreme times. With 11% price growth over the last 12-months in a seller’s favor, the increase in selection has led to more nimble moves from one house to another. Where sellers need to be careful is anticipating the month-over-month price growth we saw prior to the shift in inventory. Prospective buyers would be smart to take advantage of today’s historically low interest rates and the added inventory selection.
This is only a snapshot of the trends in south Snohomish County; please contact us if you would like further explanation of how the latest trends relate to you.
Quarterly Reports: Q3 North King
Q3: July 1 – September 30, 2018
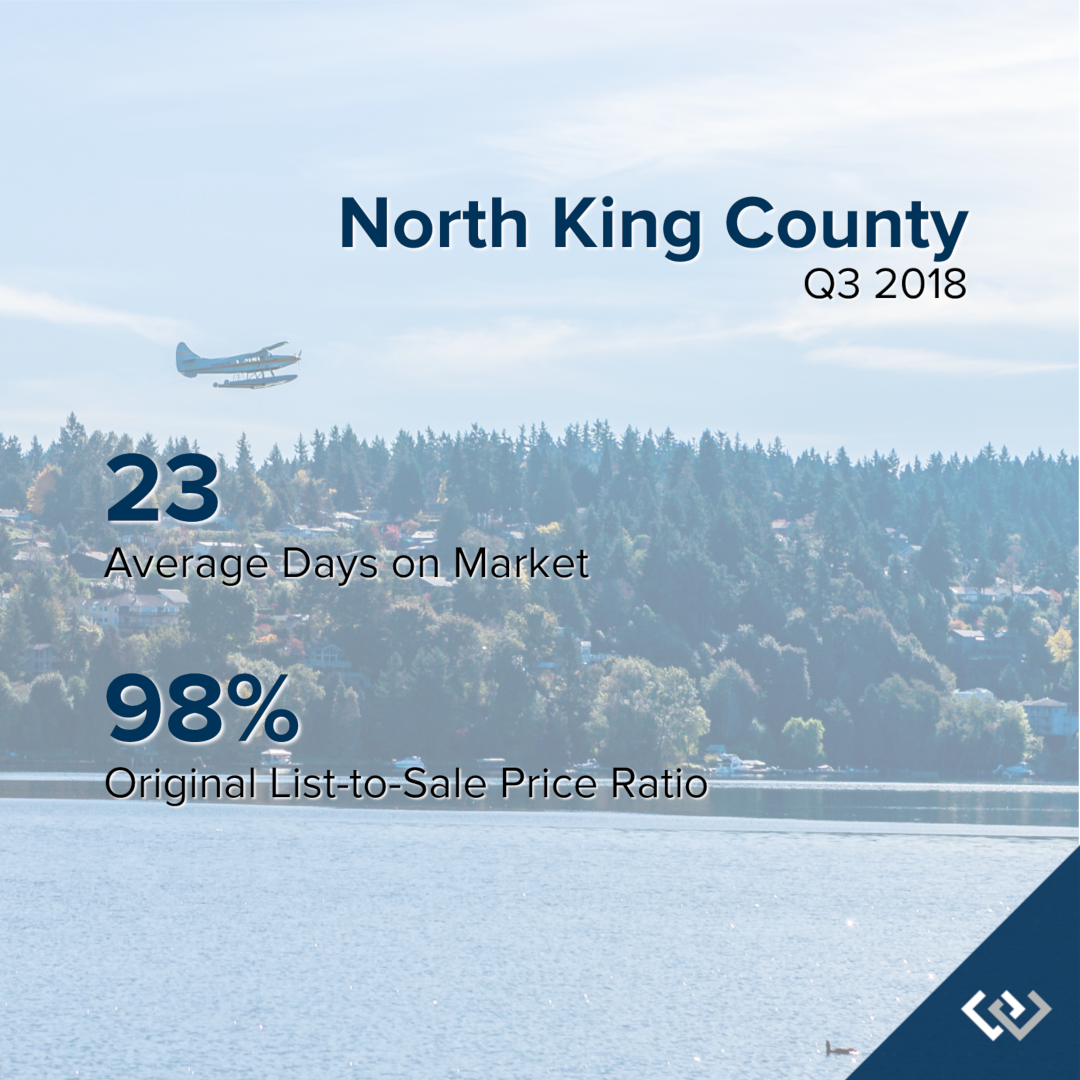
NORTH KING COUNTY: In September, the average days on market landed at 23 days and the original list-to-sale price ratio 98%. Since May, inventory growth has been noticeable, and has given buyers more options. This has led to more negotiations and fewer bidding wars, which is tempering month-over-month price growth to a more sustainable level.
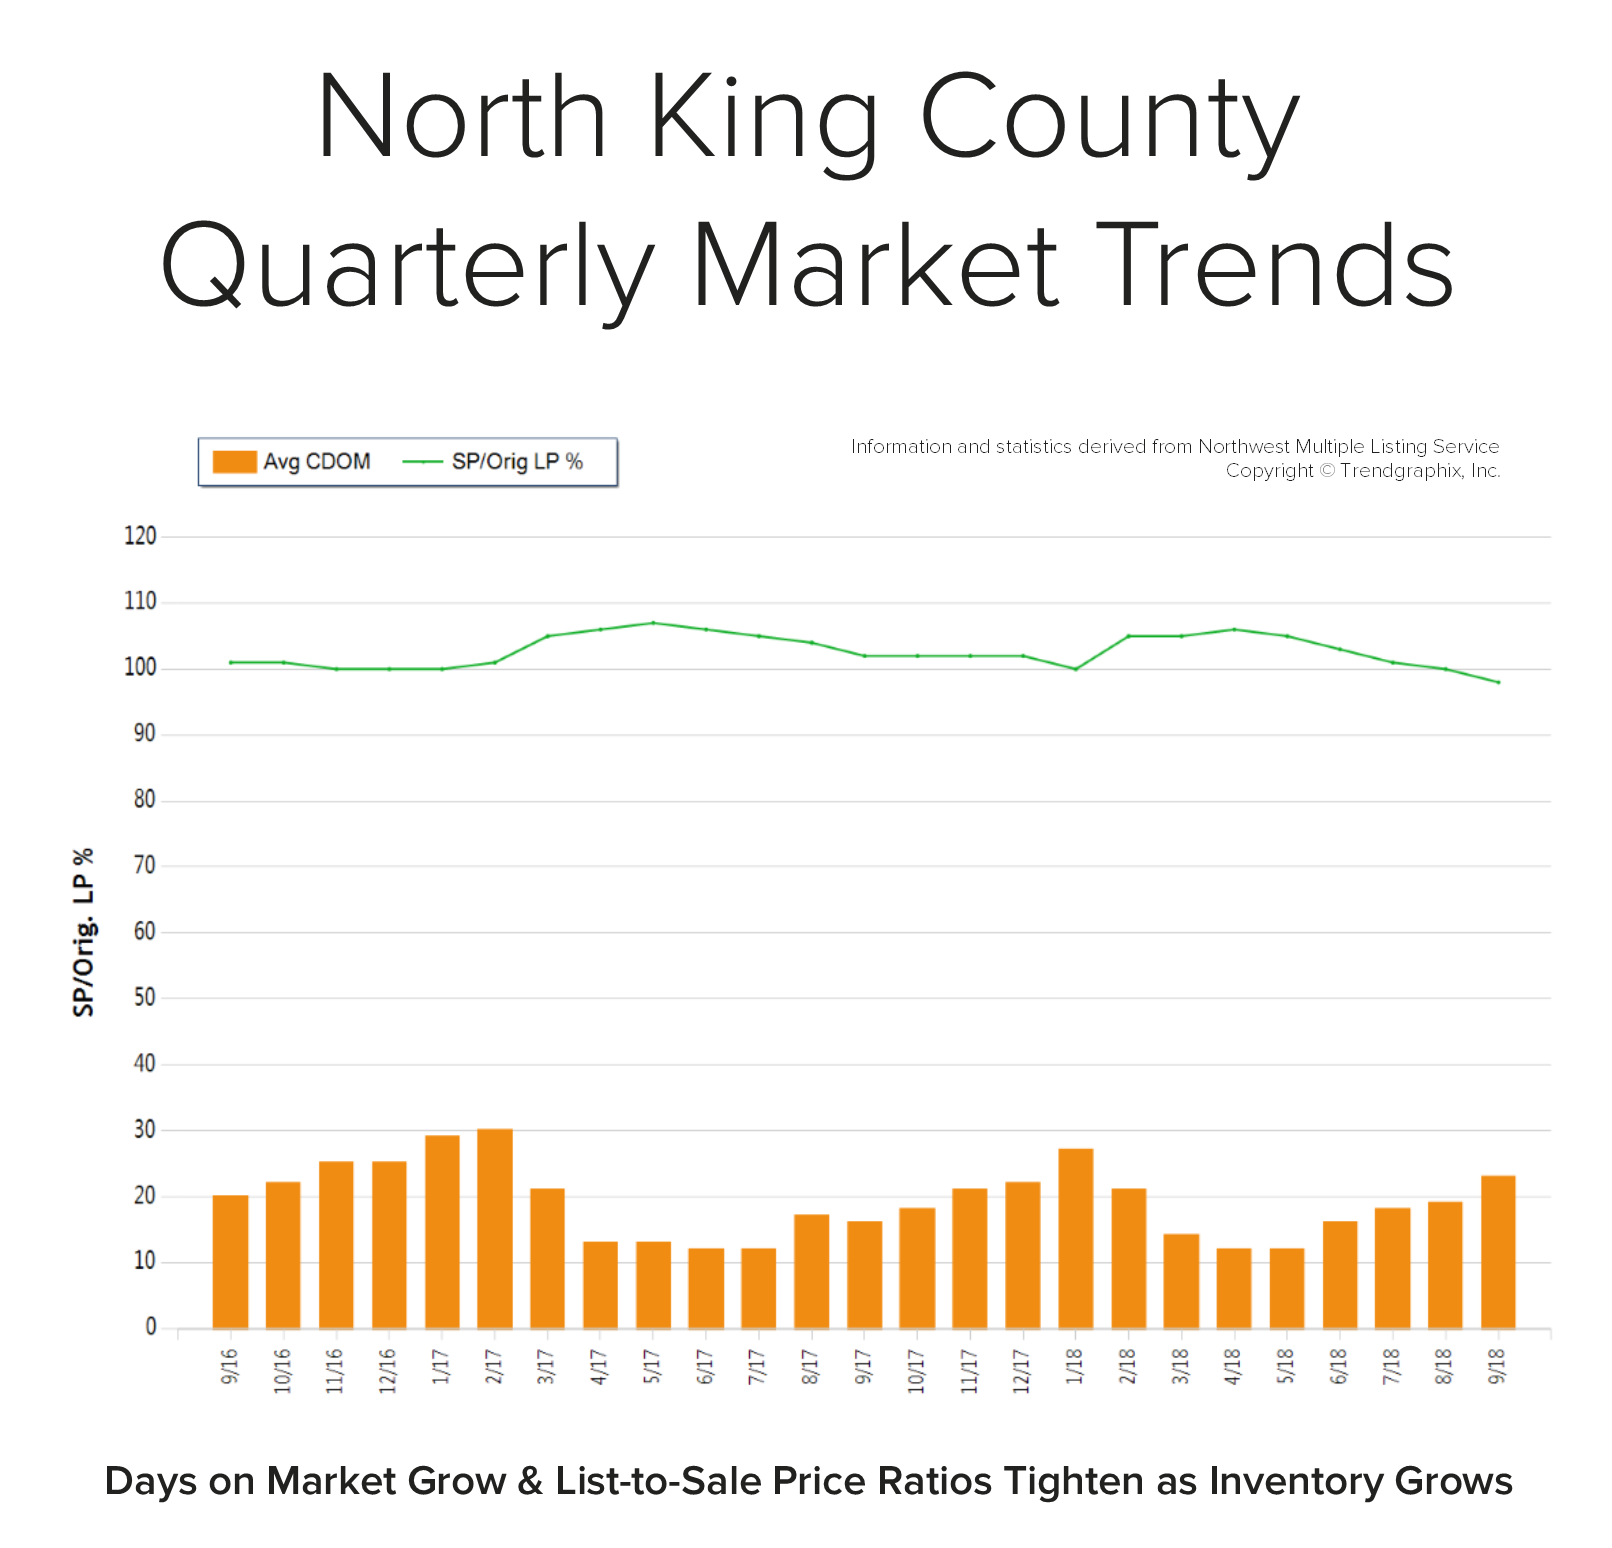 Back in April, the average days on market was 12 days and the original list-to-sale price ratio 106%; but months of inventory based on pending sales was 0.8 months, compared to 2.2 months currently. Year-over-year, prices are up 10%, still well above the historical norm of 3%-5% year-over-year gains—but note that the majority of this growth happened during the spring, due to constricted inventory levels.
Supply has increased, creating more options for buyers and helping to buffer affordability issues. Many sellers are deciding to make moves and cash in on the equity gained over the last six years. An average original list-to-sale price ratio of 98% is a positive return, yet illustrates a softening in the market after some very extreme times. With 10% price growth over the last 12-months in a seller’s favor, the increase in selection has led to more nimble moves from one house to another. Where sellers need to be careful is anticipating the month-over-month price growth we saw prior to the shift in inventory. Prospective buyers would be smart to take advantage of today’s historically low interest rates and the added inventory selection.
This is only a snapshot of the trends in north King County; please contact us if you would like further explanation of how the latest trends relate to you.
Quarterly Reports: Q3 Seattle Metro
Q3: July 1 – September 30, 2018
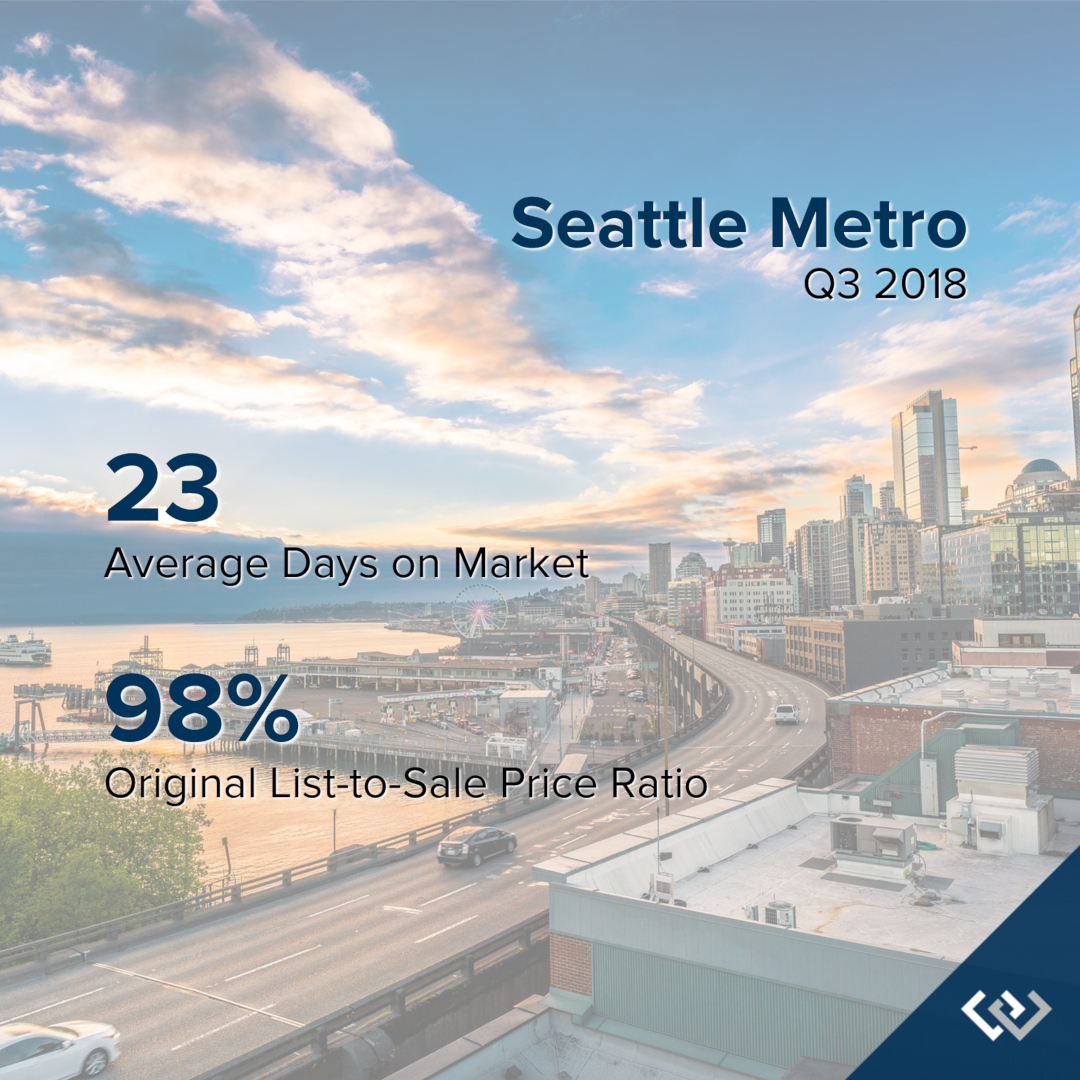
SEATTLE METRO: In September, the average days on market landed at 23 days and the original list-to-sale price ratio 98%. Since May, inventory growth has been noticeable, and has given buyers more options. This has led to more negotiations and fewer bidding wars, which is tempering month-over-month price growth to a more sustainable level.
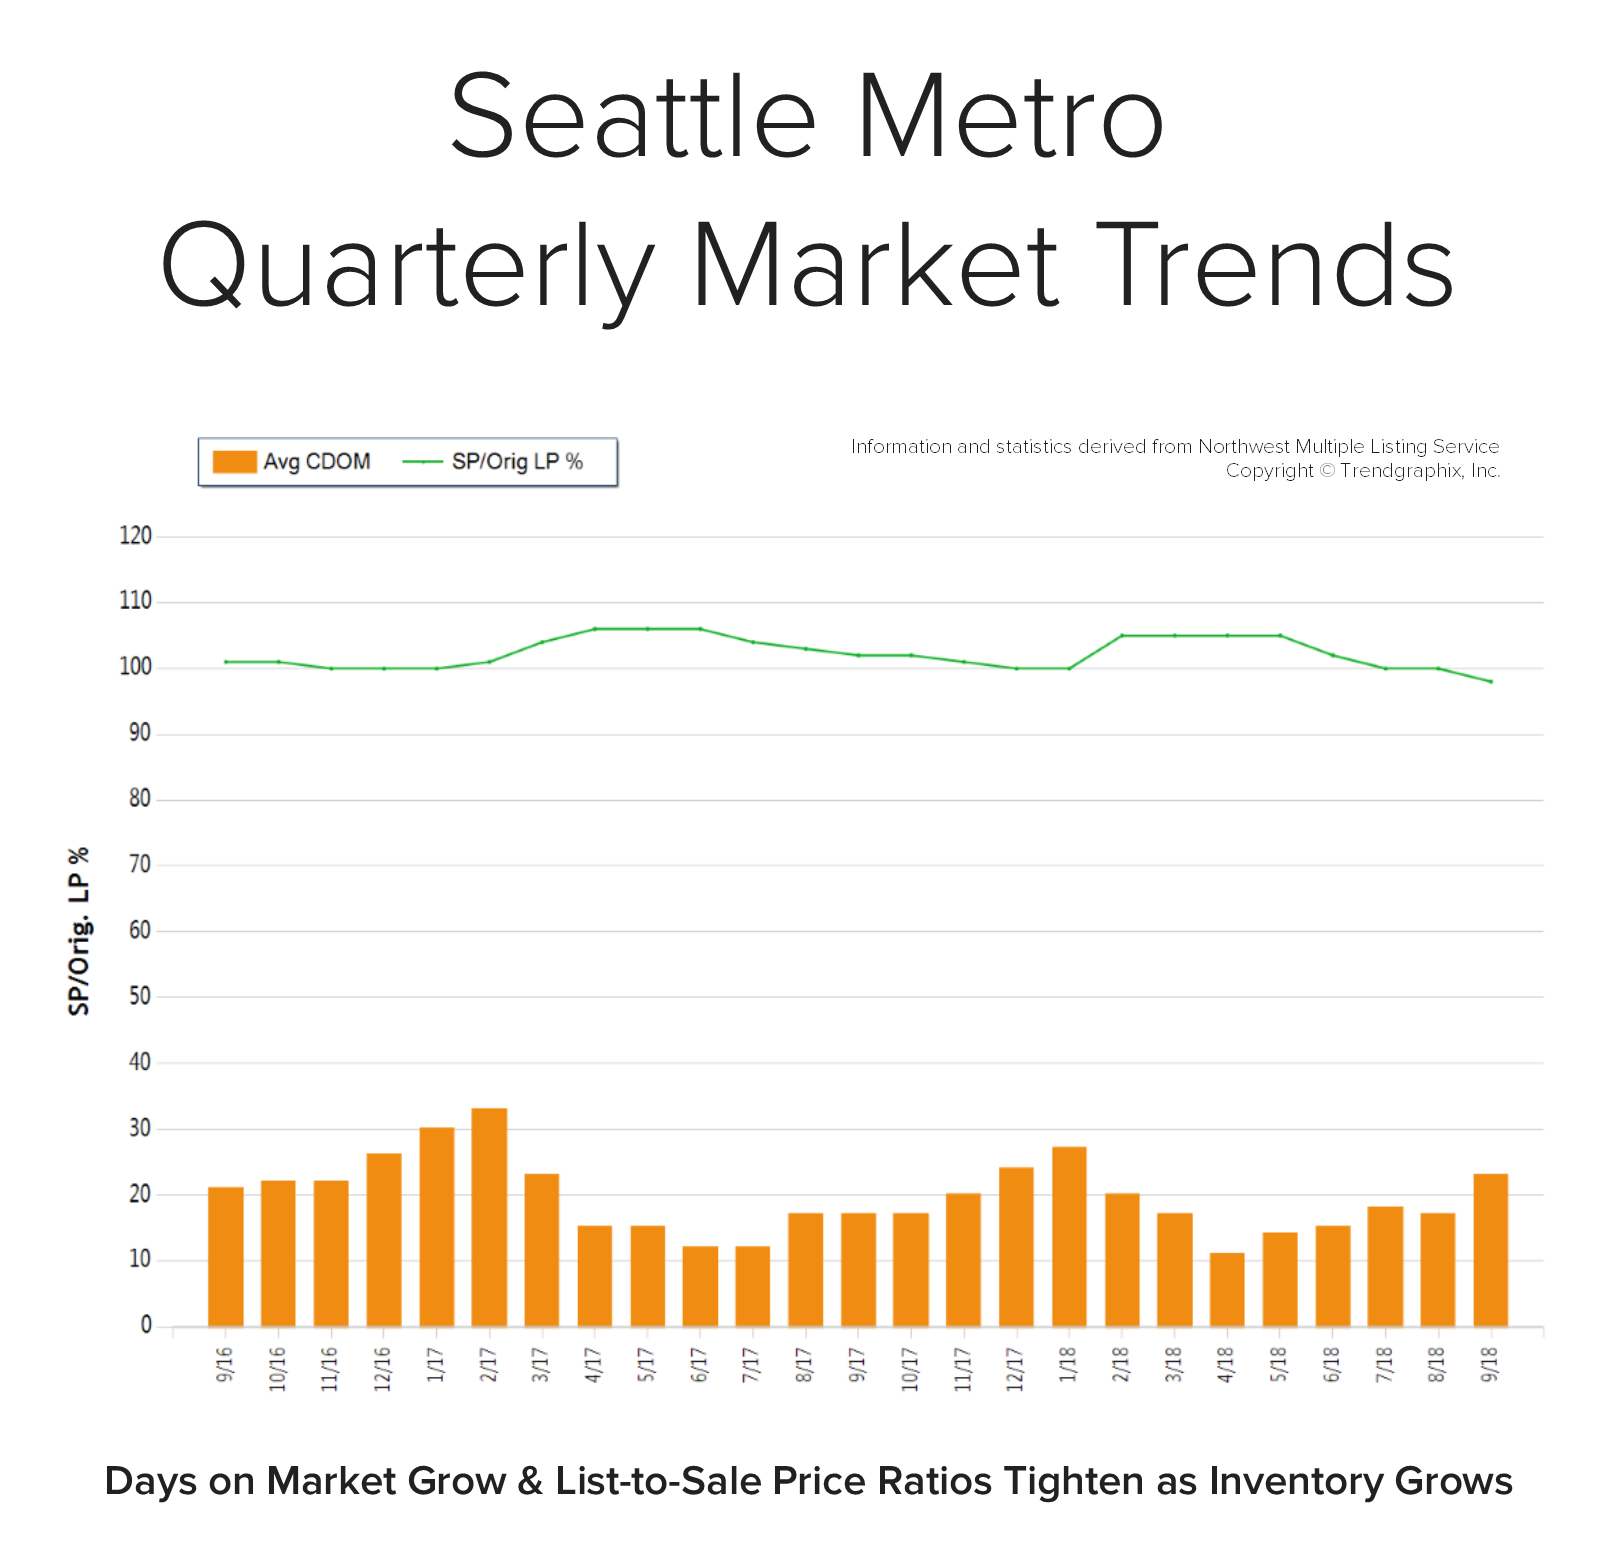 Back in April, the average days on market was 11 days and the original list-to-sale price ratio 105%; but months of inventory based on pending sales was 0.8 months, compared to 2.4 months currently. Year-over-year, prices are up 11%, still well above the historical norm of 3%-5% year-over-year gains—but note that the majority of this growth happened during the spring, due to constricted inventory levels.
Supply has increased, creating more options for buyers and helping to buffer affordability issues. Many sellers are deciding to make moves and cash in on the equity gained over the last six years. An average original list-to-sale price ratio of 98% is a positive return, yet illustrates a softening in the market after some very extreme times. With 10% price growth over the last 12-months in a seller’s favor, the increase in selection has led to more nimble moves from one house to another. Where sellers need to be careful is anticipating the month-over-month price growth we saw prior to the shift in inventory. Prospective buyers would be smart to take advantage of today’s historically low interest rates and the added inventory selection.
This is only a snapshot of the trends in the Seattle Metro area; please contact us if you would like further explanation of how the latest trends relate to you.
Quarterly Reports: Q3 Eastside
Q3: July 1 – September 30, 2018
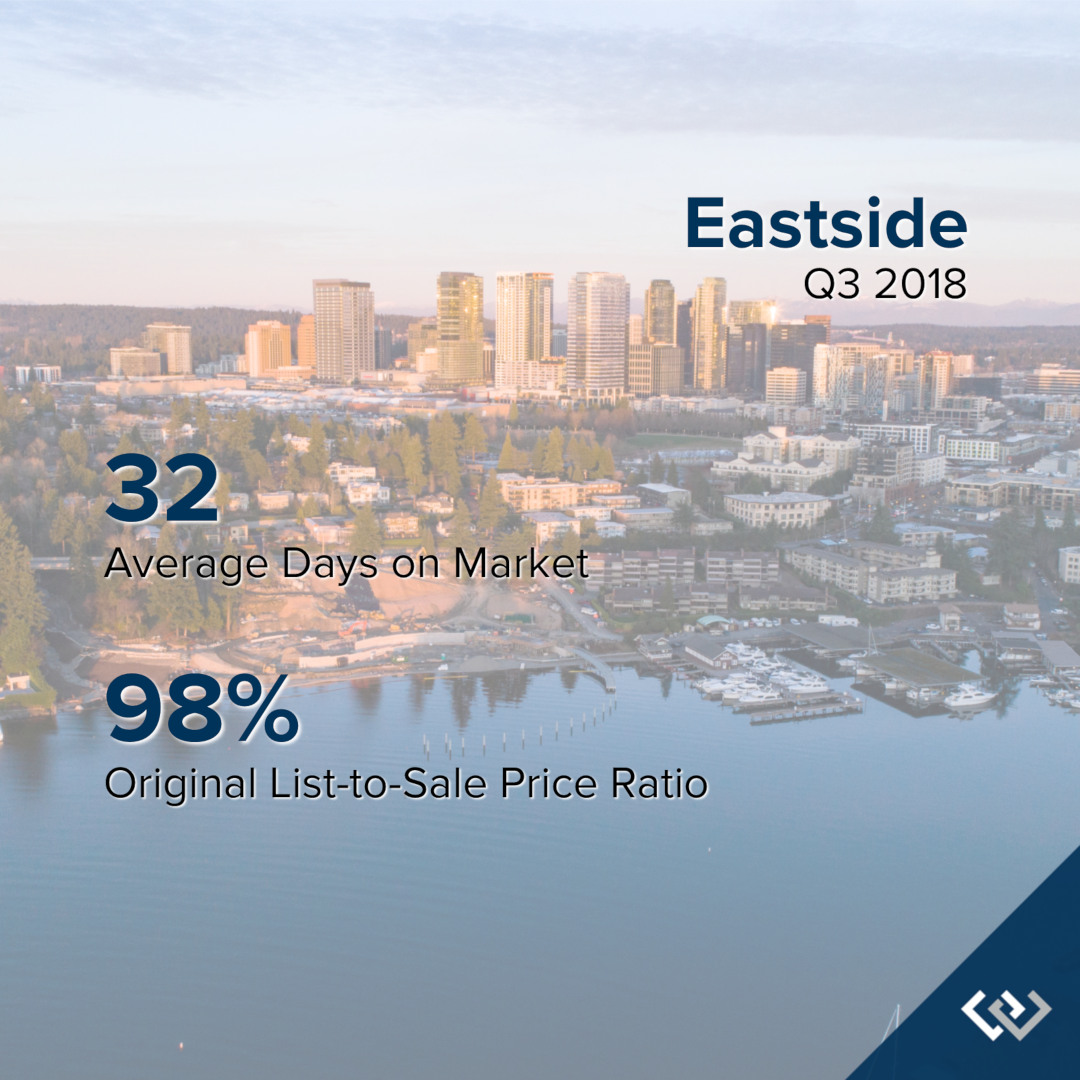
THE EASTSIDE: In September, the average days on market landed at 32 days and the original list-to-sale price ratio 98%. Since May, inventory growth has been noticeable, and has given buyers more options. This has led to more negotiations and fewer bidding wars, which is tempering month-over-month price growth to a more sustainable level.
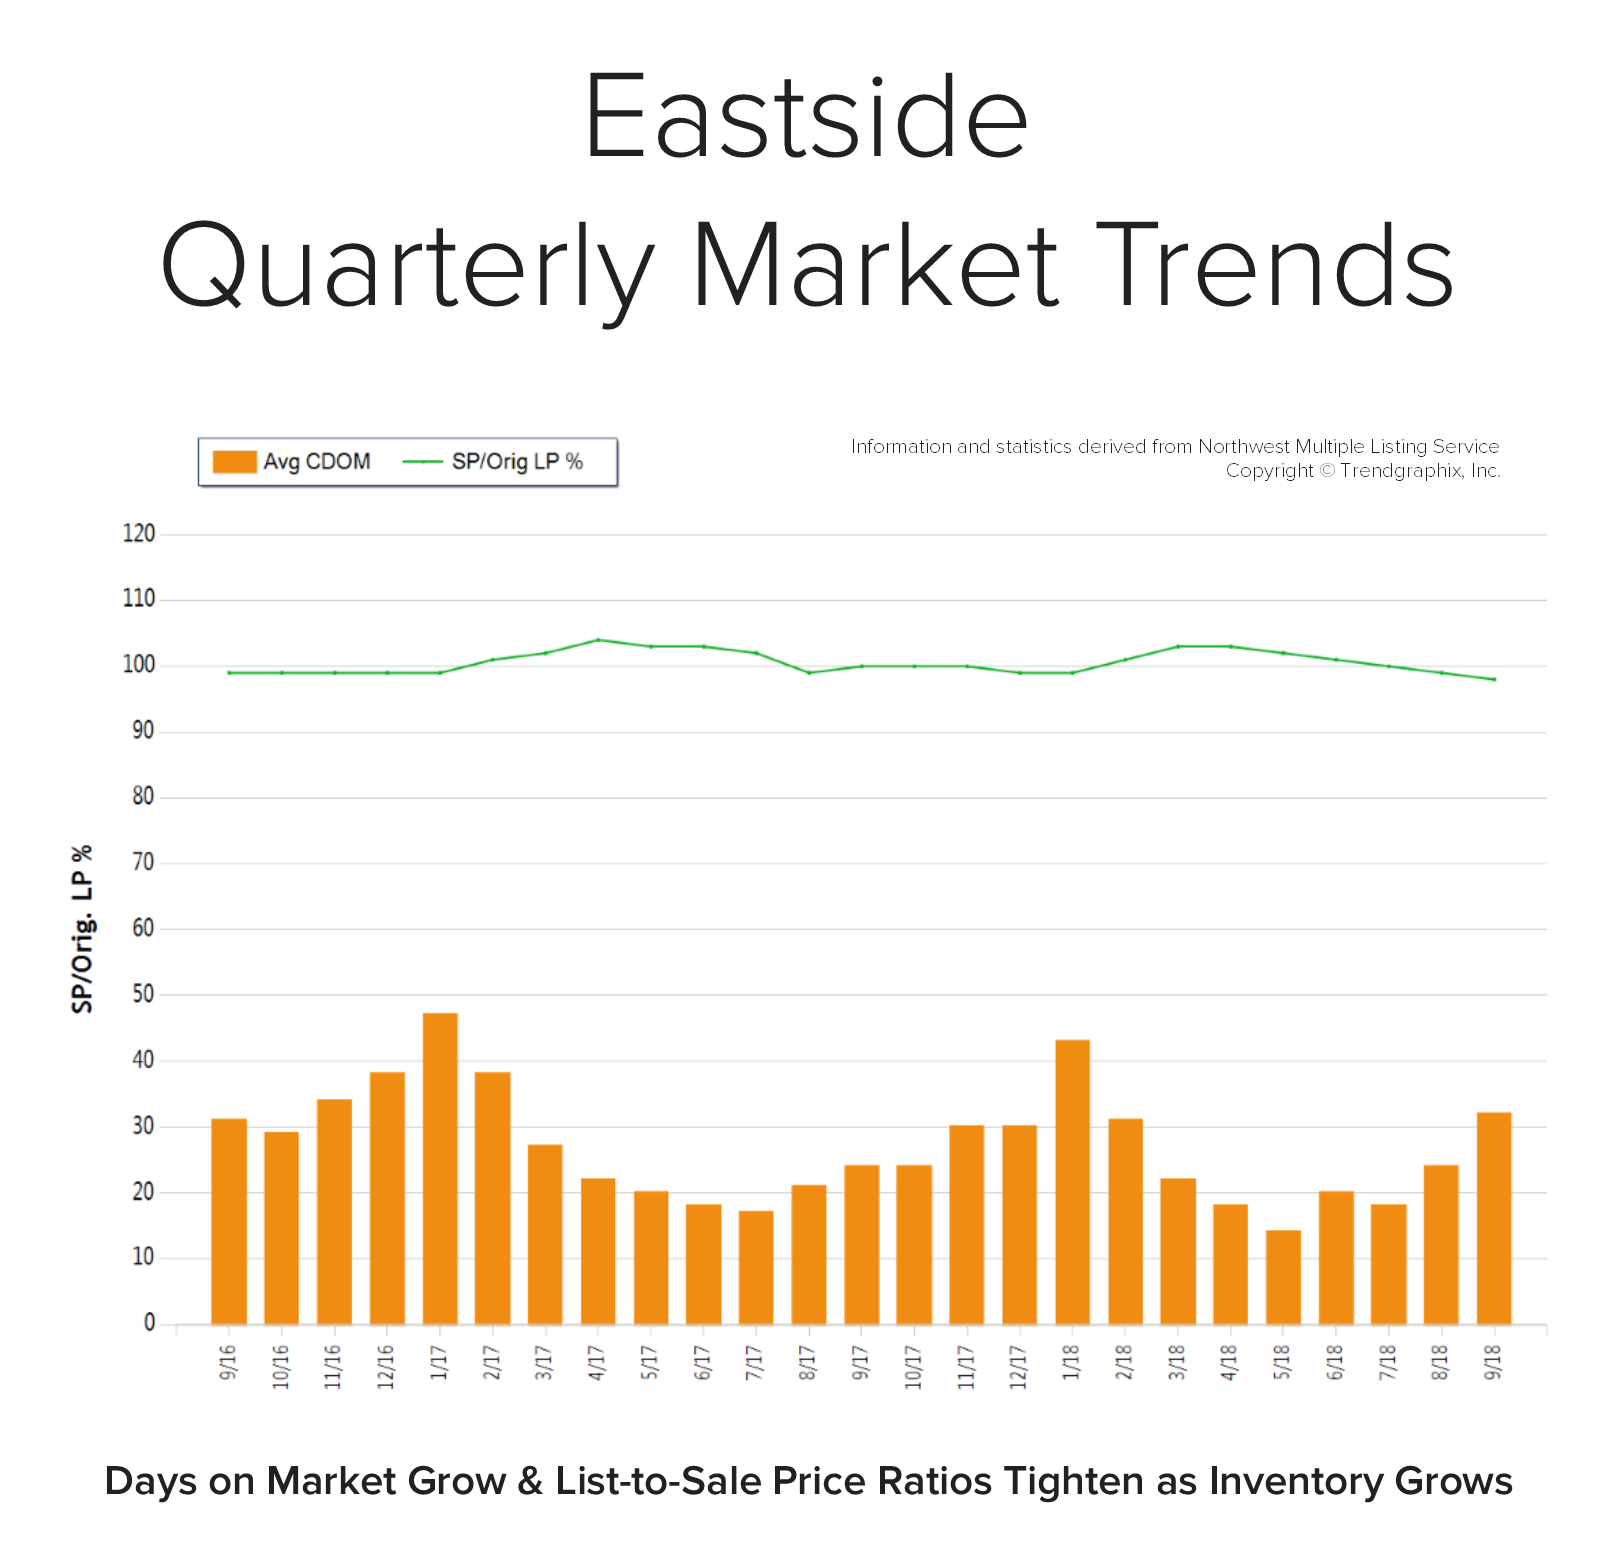 Back in April, the average days on market was 13 days and the original list-to-sale price ratio 103%; but months of inventory based on pending sales was 0.8 months, compared to 2.9 months currently. Year-over-year, prices are up 10%, still well above the historical norm of 3%-5% year-over-year gains—but note that the majority of this growth happened during the spring, due to constricted inventory levels.
Supply has increased, creating more options for buyers and helping to buffer affordability issues. Many sellers are deciding to make moves and cash in on the equity gained over the last six years. An average original list-to-sale price ratio of 98% is a positive return, yet illustrates a softening in the market after some very extreme times. With 10% price growth over the last 12-months in a seller’s favor, the increase in selection has led to more nimble moves from one house to another. Where sellers need to be careful is anticipating the month-over-month price growth we saw prior to the shift in inventory. Prospective buyers would be smart to take advantage of today’s historically low interest rates and the added inventory selection.
This is only a snapshot of the trends on the Eastside; please contact us if you would like further explanation of how the latest trends relate to you.
Quarterly Reports: Q3 North Snohomish
Q3: July 1 – September 30, 2018
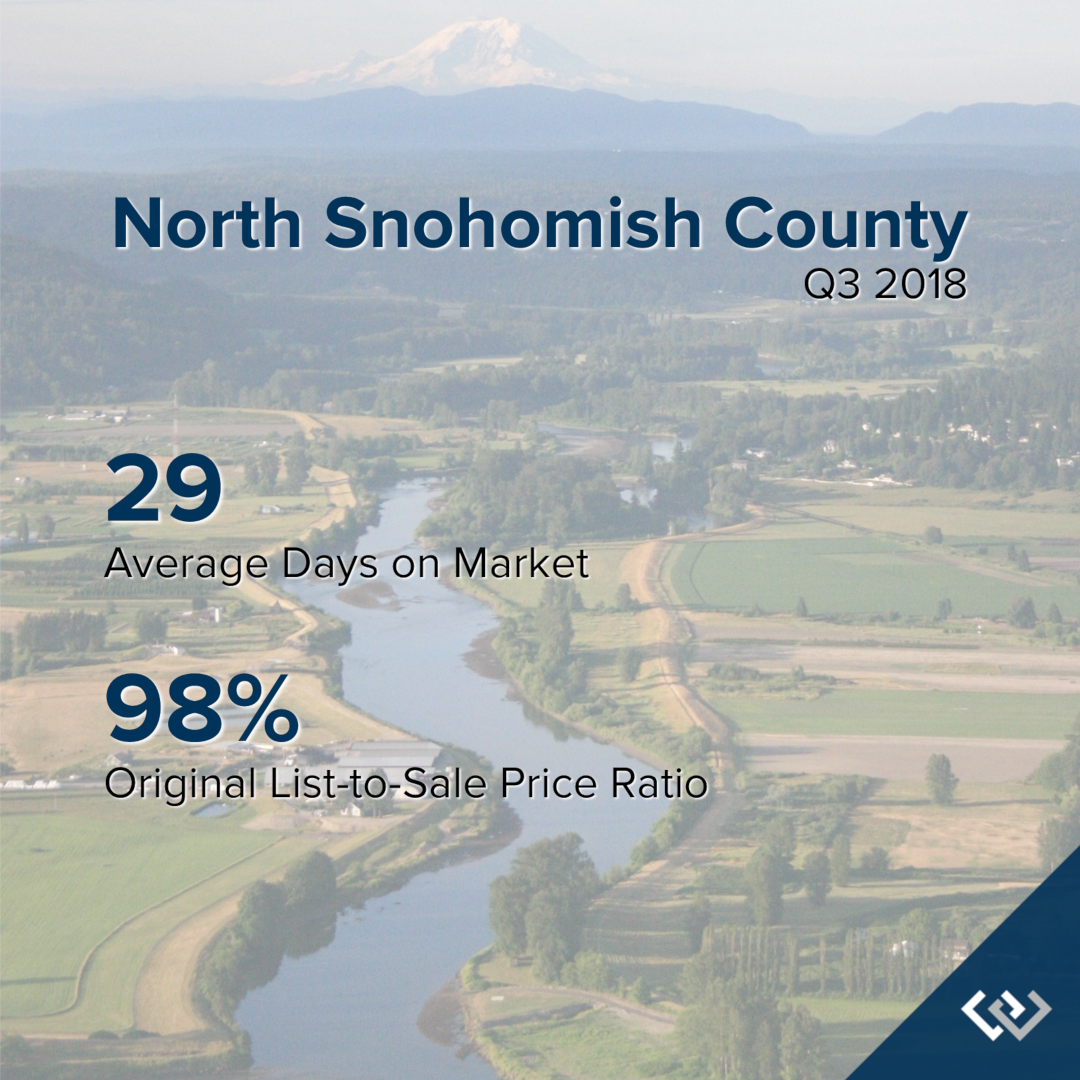
NORTH SNOHOMISH COUNTY: In September, the average days on market landed at 29 days and the original list-to-sale price ratio at 98%. Since May, inventory growth has been noticeable, and has given buyers more options. This has led to more negotiations and fewer bidding wars, which is tempering month-over-month price growth to a more sustainable level.
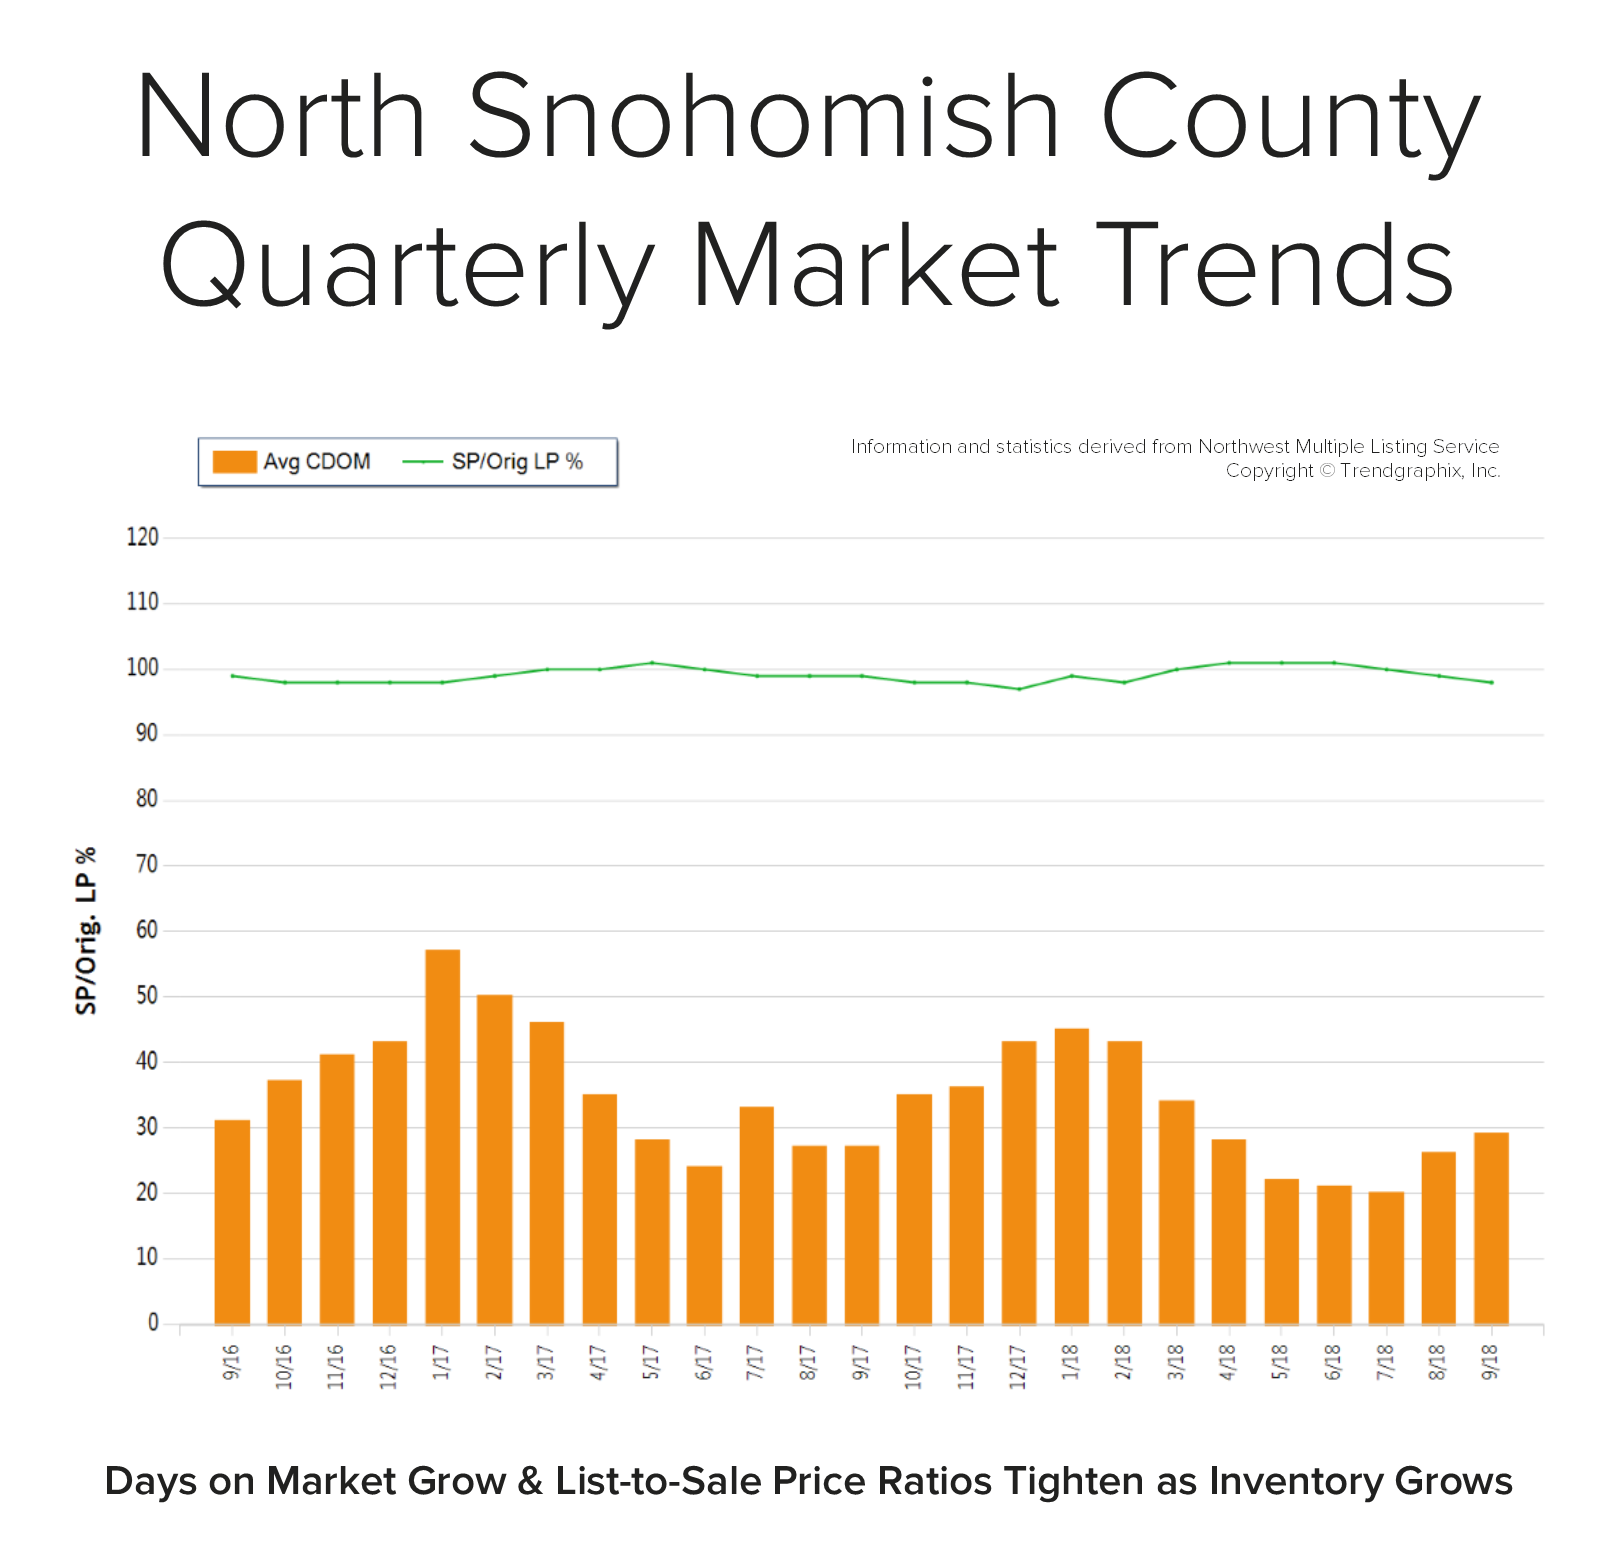 Back in May, the average days on market was 22 days and the original list-to-sale price ratio 101%; but months of inventory based on pending sales was 1 month compared to 2.3 months currently. Year-over-year, prices are up 11%, still well above the historical norm of 3%-5% year-over-year gains—but note that the majority of this growth happened during the spring, due to constricted inventory levels.
Supply has increased, creating more options for buyers and helping to buffer affordability issues. Many sellers are deciding to make moves and cash in on the equity gained over the last six years. An average original list-to-sale price ratio of 98% is a positive return, yet illustrates a softening in the market after some very extreme times. With 11% price growth over the last 12-months in a seller’s favor, the increase in selection has led to more nimble moves from one house to another. Where sellers need to be careful is anticipating the month-over-month price growth we saw prior to the shift in inventory. Prospective buyers would be smart to take advantage of today’s historically low interest rates and the added inventory selection.
This is only a snapshot of the trends in north Snohomish County; please contact me if you would like further explanation of how the latest trends relate to you.
Quarterly Reports: Q3 South King County
Q3: July 1 – September 30, 2018
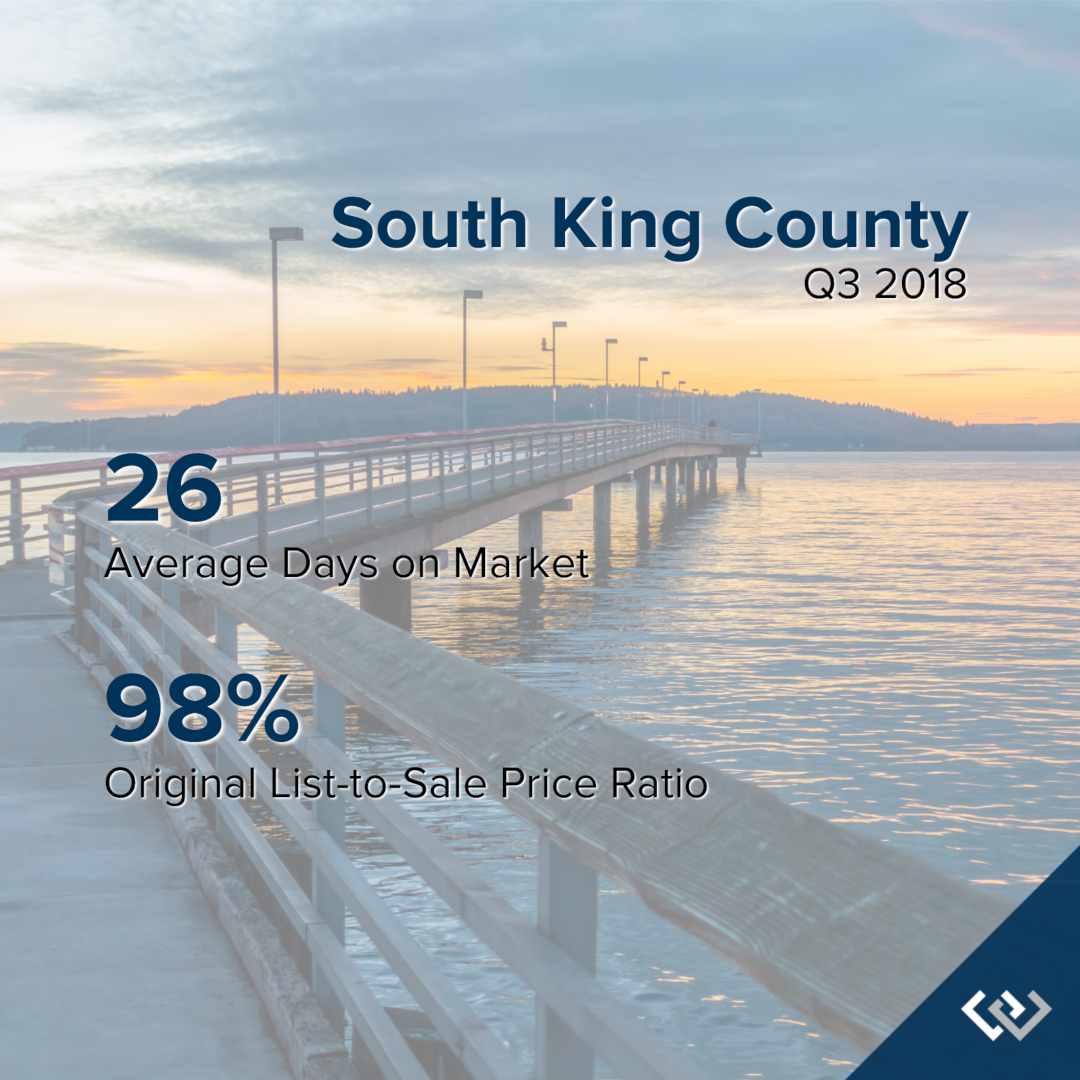
SOUTH KING COUNTY: In September, the average days on market landed at 26 days and the original list-to-sale price ratio 98%. Since May, inventory growth has been noticeable, and has given buyers more options. This has led to more negotiations and fewer bidding wars, which is tempering month-over-month price growth to a more sustainable level.
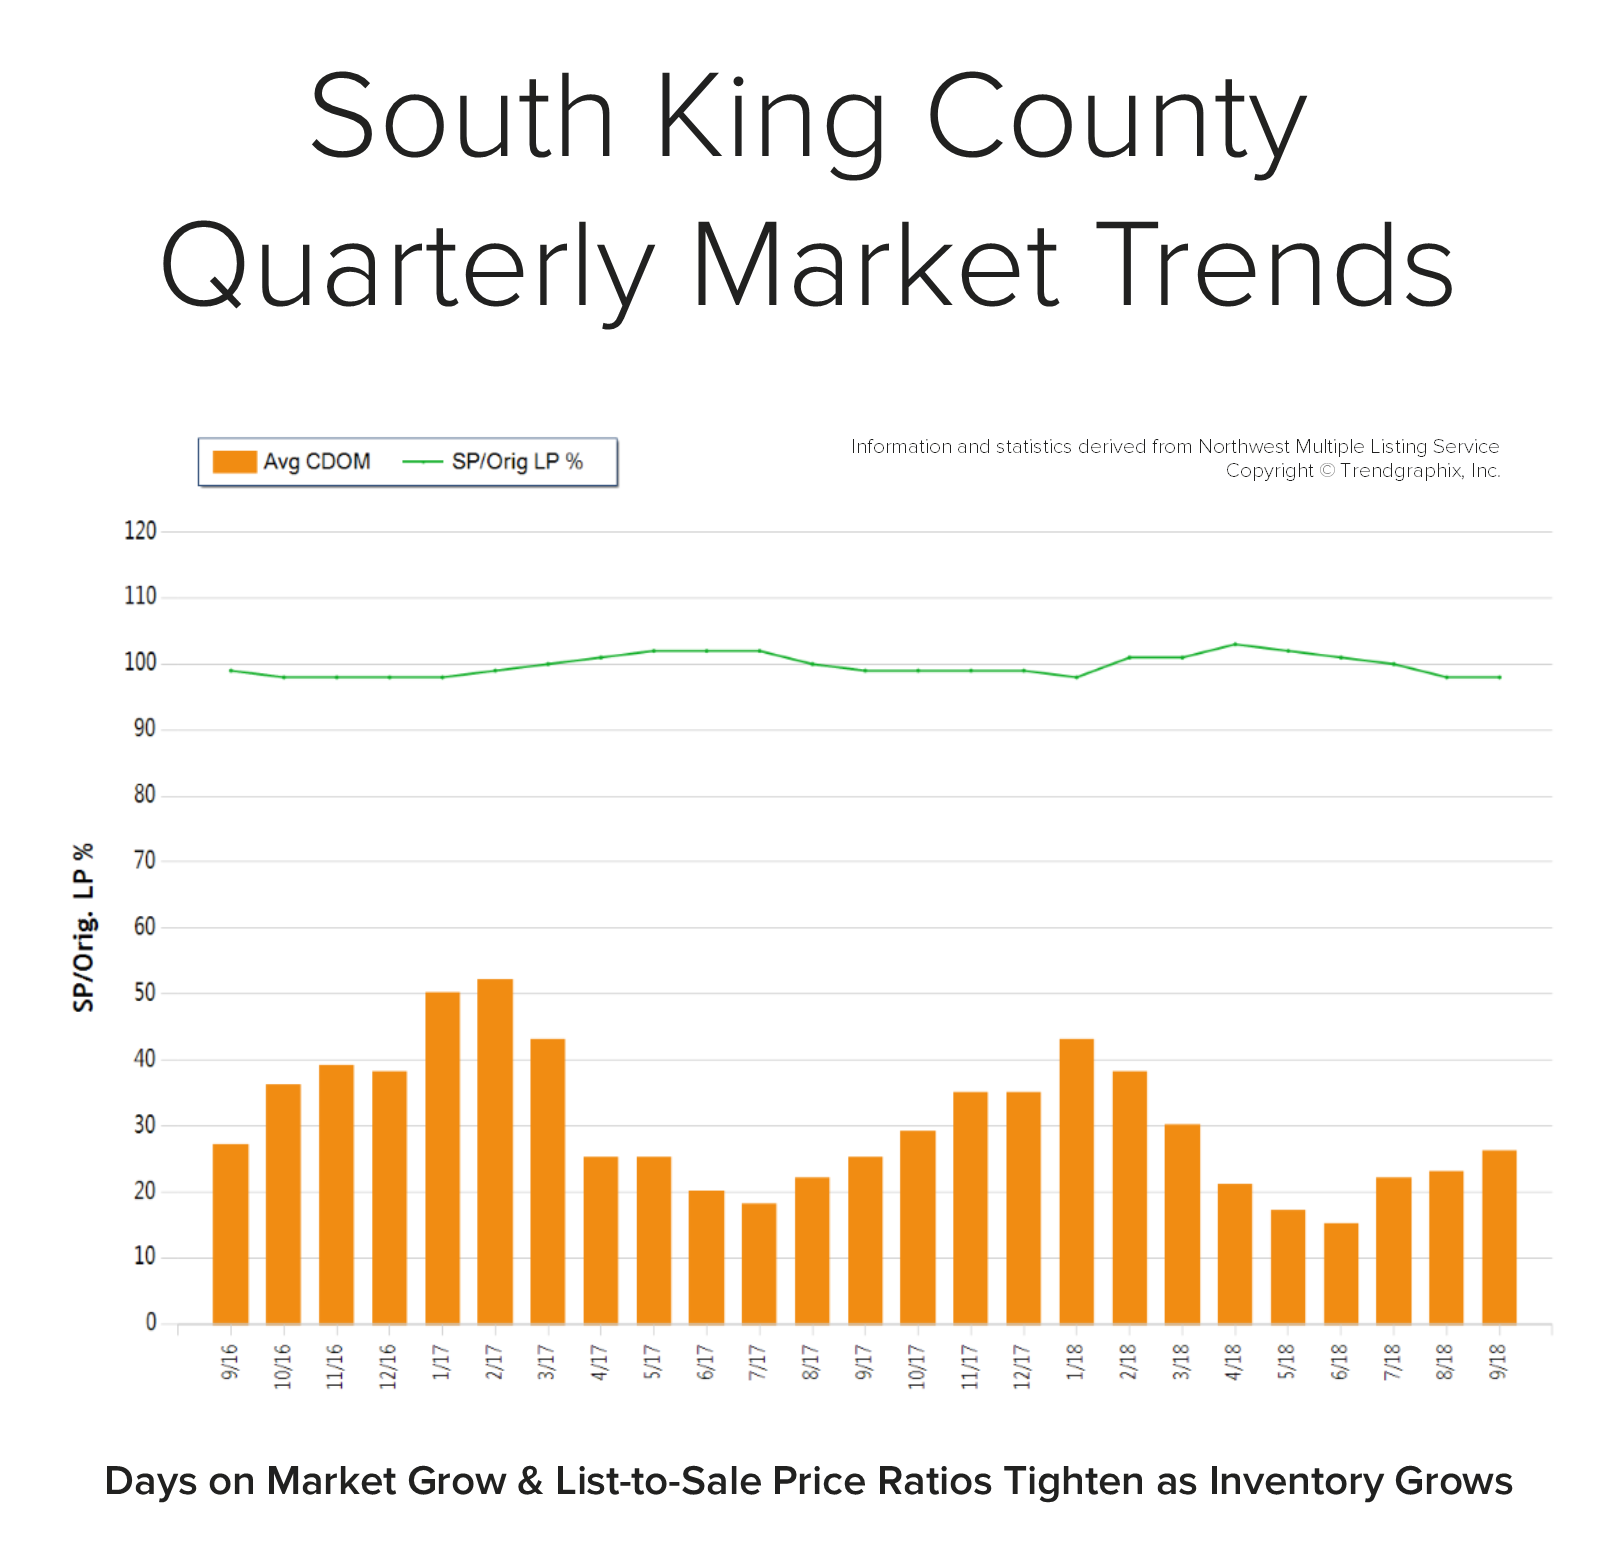 Back in April, the average days on market was 21 days and the original list-to-sale price ratio 103%; but months of inventory based on pending sales was 0.9 months, compared to 2.6 months currently. Year-over-year, prices are up 10%, still well above the historical norm of 3%-5% year-over-year gains—but note that the majority of this growth happened during the spring, due to constricted inventory levels.
Supply has increased, creating more options for buyers and helping to buffer affordability issues. Many sellers are deciding to make moves and cash in on the equity gained over the last six years. An average original list-to-sale price ratio of 98% is a positive return, yet illustrates a softening in the market after some very extreme times. With 10% price growth over the last 12-months in a seller’s favor, the increase in selection has led to more nimble moves from one house to another. Where sellers need to be careful is anticipating the month-over-month price growth we saw prior to the shift in inventory. Prospective buyers would be smart to take advantage of today’s historically low interest rates and the added inventory selection.
This is only a snapshot of the trends in south King County; please contact us if you would like further explanation of how the latest trends relate to you.
Wealth-Building Opportunities Abound for First Time Home Buyers


With the sharpest increase of available homes for sale in years, more opportunities are now available for buyers, including first-timers. Many first-time home buyers have sat on the sidelines and remained renters due to the constriction of inventory, which put major pressure on price affordability. Not only has affordability been an issue, but the terms required to prevail in a multiple-offer situation were often not within reach for someone entering the market for the first time.
For example, over the last 12 months in the Seattle Metro area we have seen a 66% increase in the selection of homes for buyers to choose from. There is currently 1.8 months of available inventory based on pending sales versus 0.8 months that was available the same month last year. This is still a seller’s market (0-3 months), but it is providing more than twice as much selection than a year ago. This loosening up of the market has helped to temper price growth by reducing the amount of price escalations and the need to have super aggressive financing terms in order to secure a home.
You see, over the last 3-4 years we have experienced double-digit price appreciation (10-14%) year-over-year, each year. A normal rate of appreciation is 3-5%. Minimal amounts of available inventory, low interest rates, and rapid job growth lead to this increase in prices. Now that more homes are coming to market and job growth has stabilized a bit (still growing, but not as fast), price growth has slowed. This is good news for sustainability and affordability. Here’s the deal though – we are still experiencing growth in values, making home ownership a sound investment over renting.
According to the most recent survey from rentcafe.com, the average rent for an apartment in Seattle is $1,906 with an average square footage of 736 sq. ft. That is quite a bit of money for not a ton of space. Further, that monthly expenditure does not create any wealth for the renter, only for the landlord. With renting, rates can be increased at any time, and you are paying down someone else’s asset, not your own. Also, owning gives the homeowner control of their overhead, while getting to make their house their home by adding improvements such as painting.
There are several factors to consider that will lead a person to make the best decision for their lifestyle and their financial bottom line. One of the biggest factors is interest rates! Currently, the rate for a 30-year fixed, conventional, conforming loan is hovering around 4.88%. Up from earlier this year and predicted to rise, but still historically low over the course of the last 30 years. These rates need to be considered the greatest opportunity of them all! With prices tempering and rates still under the 30-year average of 6.65%, buyers are able to secure a sound investment with very low debt service.
With interest rates predicted to rise over the next year, a good rule of thumb to remember is that for every one-point increase in rate, a buyer loses 10% of their buying power. For example, if the rate jumps from 4.75% to 5.75% and one wants to keep the same monthly payment, they must adjust their price point down by 10%. So, a $450,000 budget becomes a $405,000 budget, and that isn’t taking appreciation into consideration. If you assume an average appreciation rate of 4% year-over-year, today’s $450,000 house will be $468,000 next year. What side of the equity growth do you want to be on? As an owner now, or a buyer a year from now, when prices are higher and interest rates are most likely higher as well?
Once you secure a mortgage, the payment stays the same over the term of the entire loan. The long-term benefits of owning are abundant, including the stability of not being asked to move. These are important factors to consider for everyone, but especially millennials, who are enjoying the benefits of Seattle’s attractive job market. One myth to address is the common belief that you must have a 20% down payment in order to buy a home. That is simply not true. There are loan programs as low as 3% down, decreasing the need to have a large sum of money saved up before being able to buy.
Where folks are having to compromise the most due to affordability is commute times, and settling in less-urban neighborhoods. Worth pointing out, is the average home price in south Snohomish County is 34% less than Seattle Metro – that is a huge savings! Further, south King County is 74% more affordable than Seattle. Some people, mainly millennials, have not been willing to give up living in the core urban neighborhoods that have high walk scores and shorter commute times. That should be apt to change with more selection available in the purchase market, coupled with low interest rates. The advantages of moving out a little further and securing a home will start people on the track of building long-term wealth. If you or anyone you know is currently renting and is considering a change, please let me know, as I would be happy to get their questions answered and help them make an informed decision.
Don’t Wait for a Disaster to Build Your Emergency Kit

Two Weeks Ready: Be Prepared. Build Kits. Help Each Other.

The first few days after a disaster are often the most critical. Government and essential services may not be available right away, depending on the circumstances. It is imperative to have a plan in place for such a time, and be ready to act on your own.
Washington’s biggest disaster threat is from earthquakes. Washington State’s Emergency Management Division advises that we take precautions to be on our own for at least 2 weeks. Take a look at their Two Week Ready Brochure (PDF) that outlines the basics necessary for your emergency kit. While it is important to get ready, don’t feel like you have to do it all at once. The list of necessities is long, so take a look at the agency’s year-long prep plan. You will also find information on pet preparedness, as well as the agency’s Drop, Cover, and Hold Earthquake Scenario map.
Windermere and the Seahawks are Back for Another Season to #TackleHomelessness!

All of us at Windermere are very excited to kick off our third season as the Official Real Estate Company of the Seattle Seahawks!

Once again, our #tacklehomelessness campaign is front-and-center, with the Windermere Foundation donating $100 for every Seahawks home-game tackle during the 2018 season to YouthCare, a Seattle-based non-profit organization that has been providing services and support to homeless youth for more than 40 years. Over the last two years, the Seahawks helped us raise over $66,000 through our #tacklehomelessness campaign, and this year we are looking forward to raising even more money – and awareness – for this important cause.
Our partnership with the Seahawks and YouthCare fits perfectly with the mission of the Windermere Foundation which is to support low-income and homeless families in the communities where we have offices. Through the #tacklehomelessness campaign, we hope to be able to do even more.
