
 Facebook
 X
X
 Pinterest
 Copy Link
Q1: January 1 – March 31, 2018
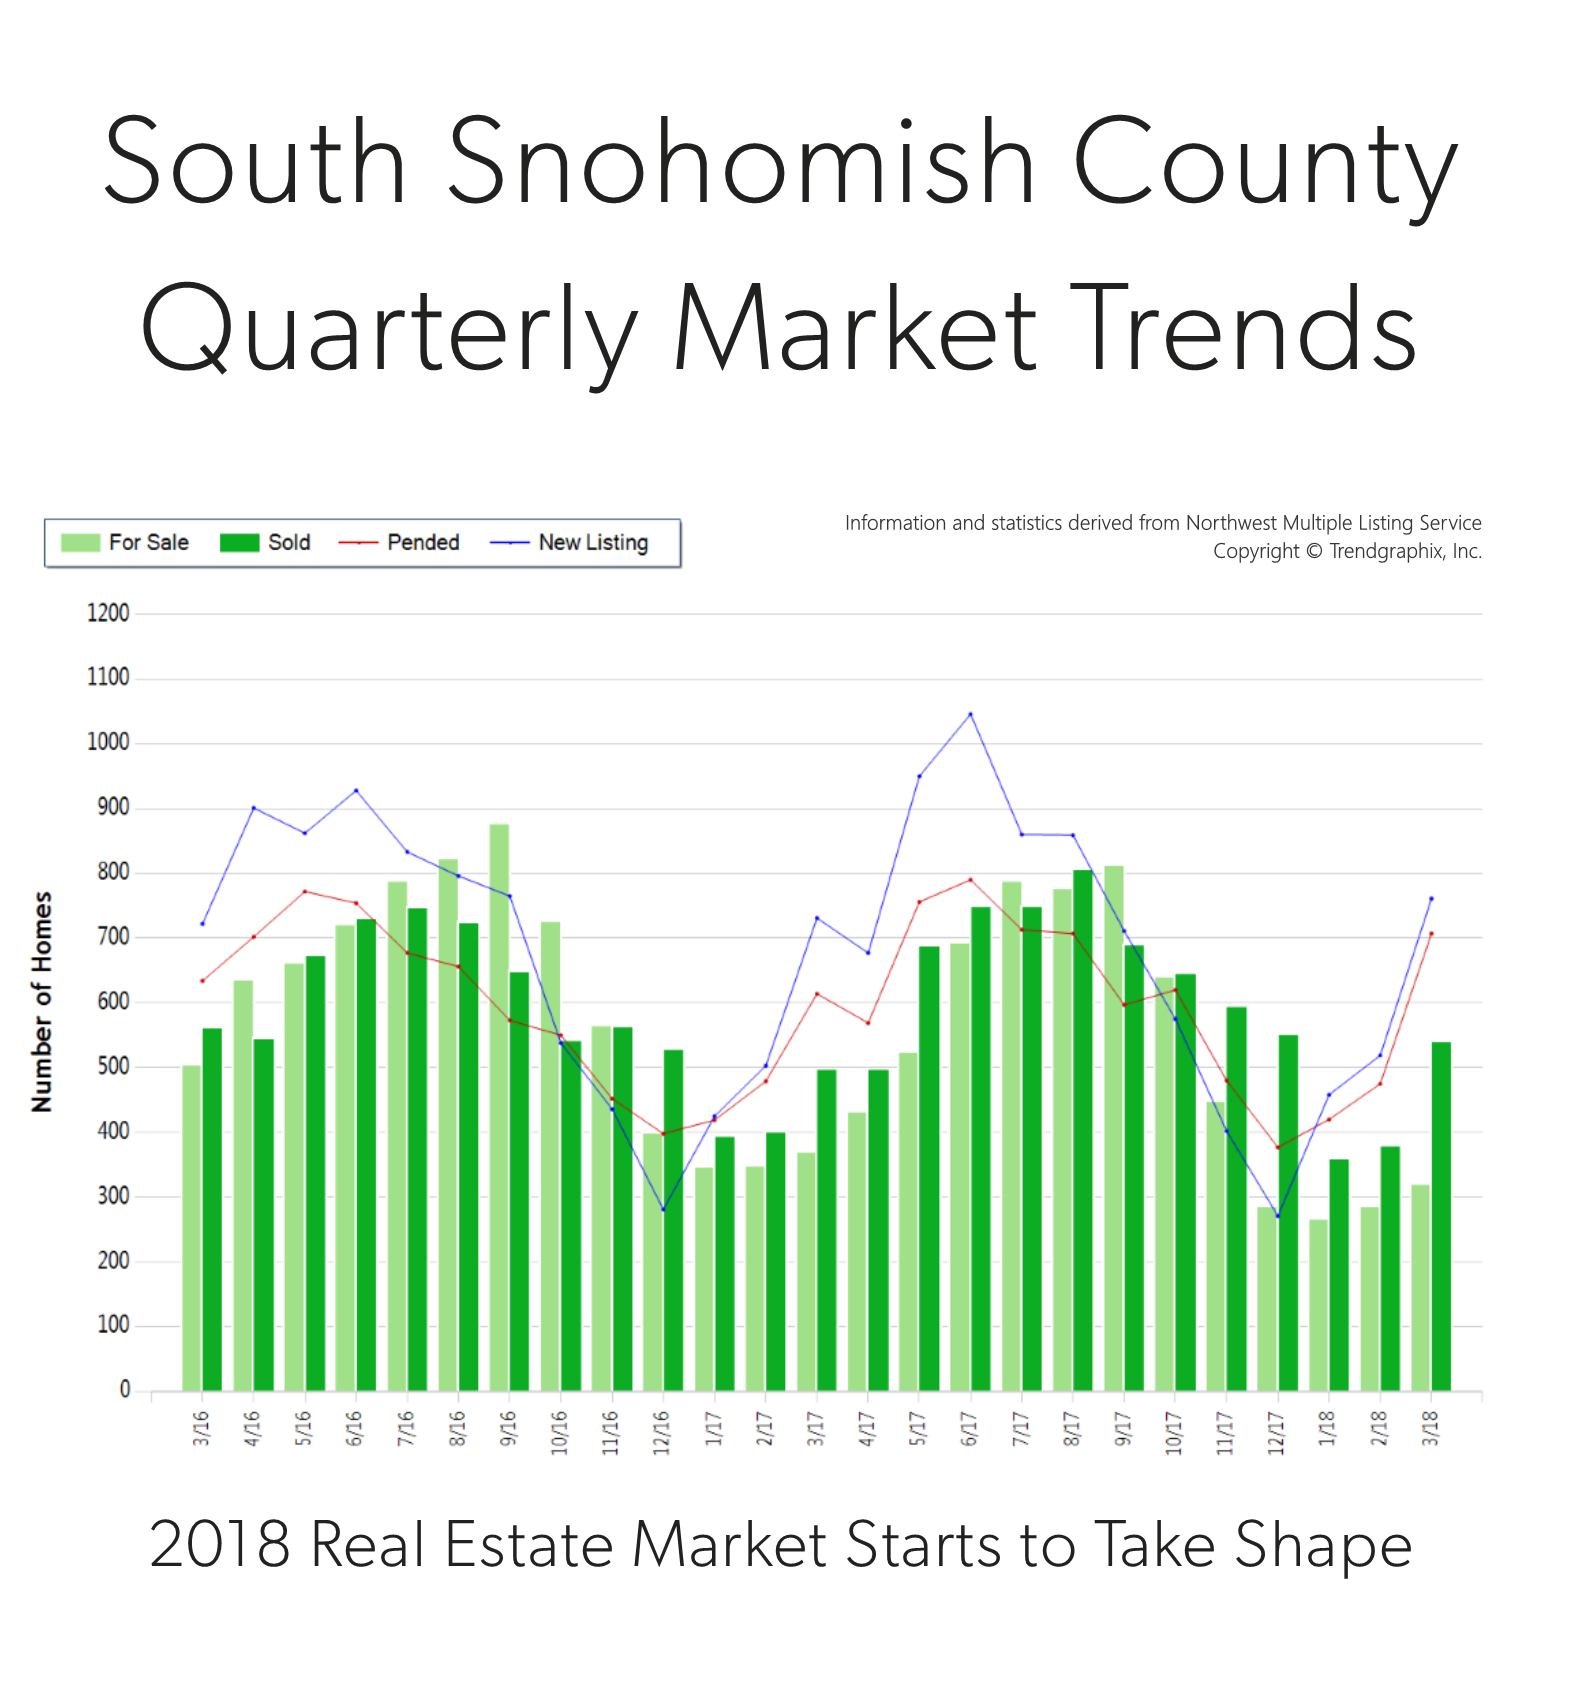
It is the time of year when our market starts to take off. Spring is here and we are starting to see seasonal increases in inventory.
 In fact, there was a 47% increase in new listings in March compared to February. That increase was matched by a 48% rise in pending sales, illustrating very strong demand for housing in your area. Last month, the average list-to-sale price ratio (how the sale price relates to the list price) was 103%, indicating that multiple offers were the norm. We ended the quarter with 0.5 months of inventory – the lowest level yet. More inventory would be absorbed by happy buyers looking for more selection and would help temper price growth, which is up 15% year-over-year.
South Snohomish County real estate has been a hot spot due to reasonable commute times and overall affordability compared to “in-city” real estate. In fact, the median price in March was 47% higher in Seattle Metro. Sellers are enjoying amazing returns due to this phenomenon, and buyers are securing mortgages with minor debt service due to low interest rates. This is a very strong seller’s market, but buyers who are securing a home are already enjoying appreciation in equity.
This is only a snapshot of the trends in south Snohomish County; please contact us if you would like further explanation of how the latest trends relate to you.
