
 Facebook
 X
X
 Pinterest
 Copy Link
Monthly Newsletter – January 2019

Happy 2019! As we head into the New Year, it’s a great time to look ahead to what the real estate market has in store. Just last week, I had the pleasure of hosting an Economic Forecast Event with Windermere’s Chief Economist, Matthew Gardner, and soaked up his knowledge and predictions. Below are his general predictions for the at-large real estate market across the nation. Please review and let me know if you have any questions.
Beyond the national forecast, at the event Matthew reported specifically on the Greater Seattle market, including both King and Snohomish counties. I received his Power Point presentation and I am happy to share his slides, should you request them.
A few take-a-ways to note are:
- Seattle remains strong economically and our job market is thriving.
- Interest rates are still historically low and will rise, but not beyond 6%.
- It is still a seller’s market in our area, but price escalations are softening, creating more balance and sustainability. We are NOT experiencing a bubble.
- 25% of homeowners in our region have 50% equity in their homes.
- An economic recession is upon us in 2020. This one should be much like the 1991 recession; short and not based in housing.
- Be careful how you process the media’s take on the market as they often use extreme month-over-month numbers vs. richer long-term data.
- Prices are expected to rise 5-7% in 2019, which is more normal, but above the long-term average, yet lower than the recent double-digit year-over-year gains we’ve seen since 2012.
It is always my goal to help empower my clients with information to help them make informed decisions regarding their real estate. Let me know if you’d like that Power Point. I’m happy to share and help you dissect the information. Here’s to a great 2019!
2019 Economic and Housing Forecast
Posted on Windermere.com in Market News by Matthew Gardner, Chief Economist, Windermere Real Estate
What a year it has been for both the U.S. economy and the national housing market. After several years of above-average economic and home price growth, 2018 marked the start of a slowdown in the residential real estate market. As the year comes to a close, it’s time for me to dust off my crystal ball to see what we can expect in 2019.
The U.S. Economy
Despite the turbulence that the ongoing trade wars with China are causing, I still expect the U.S. economy to have one more year of relatively solid growth before we likely enter a recession in 2020. Yes, it’s the dreaded “R” word, but before you panic, there are some things to bear in mind.
Firstly, any cyclical downturn will not be driven by housing. Although it is almost impossible to predict exactly what will be the “straw that breaks the camel’s back”, I believe it will likely be caused by one of the following three things: an ongoing trade war, the Federal Reserve raising interest rates too quickly, or excessive corporate debt levels. That said, we still have another year of solid growth ahead of us, so I think it’s more important to focus on 2019 for now.
The U.S. Housing Market
Existing Home Sales
This paper is being written well before the year-end numbers come out, but I expect 2018 home sales will be about 3.5% lower than the prior year. Sales started to slow last spring as we breached affordability limits and more homes came on the market. In 2019, I anticipate that home sales will rebound modestly and rise by 1.9% to a little over 5.4 million units.
Existing Home Prices
We will likely end 2018 with a median home price of about $260,000 – up 5.4% from 2017. In 2019 I expect prices to continue rising, but at a slower rate as we move toward a more balanced housing market. I’m forecasting the median home price to increase by 4.4% as rising mortgage rates continue to act as a headwind to home price growth.
New Home Sales
In a somewhat similar manner to existing home sales, new home sales started to slow in the spring of 2018, but the overall trend has been positive since 2011. I expect that to continue in 2019 with sales increasing by 6.9% to 695,000 units – the highest level seen since 2007.
That being said, the level of new construction remains well below the long-term average. Builders continue to struggle with land, labor, and material costs, and this is an issue that is not likely to be solved in 2019. Furthermore, these constraints are forcing developers to primarily build higher-priced homes, which does little to meet the substantial demand by first-time buyers.
Mortgage Rates
In last year’s forecast, I suggested that 5% interest rates would be a 2019 story, not a 2018 story. This prediction has proven accurate with the average 30-year conforming rates measured at 4.87% in November, and highly unlikely to breach the 5% barrier before the end of the year.
In 2019, I expect interest rates to continue trending higher, but we may see periods of modest contraction or levelling. We will likely end the year with the 30-year fixed rate at around 5.7%, which means that 6% interest rates are more apt to be a 2020 story.
I also believe that non-conforming (or jumbo) rates will remain remarkably competitive. Banks appear to be comfortable with the risk and ultimately, the return, that this product offers, so expect jumbo loan yields to track conforming loans quite closely.
Conclusions
There are still voices out there that seem to suggest the housing market is headed for calamity and that another housing bubble is forming, or in some cases, is already deflating. In all the data that I review, I just don’t see this happening. Credit quality for new mortgage holders remains very high and the median down payment (as a percentage of home price) is at its highest level since 2004.
That is not to say that there aren’t several markets around the country that are overpriced, but just because a market is overvalued, does not mean that a bubble is in place. It simply means that forward price growth in these markets will be lower to allow income levels to rise sufficiently.
Finally, if there is a big story for 2019, I believe it will be the ongoing resurgence of first-time buyers. While these buyers face challenges regarding student debt and the ability to save for a down payment, they are definitely on the comeback and likely to purchase more homes next year than any other buyer demographic.
Originally published on Inman News.

At Windermere we help people buy and sell homes, but we also help build community. I’m proud to support the Windermere Foundation with every home I help sell or buy. 2018 concluded with another great year of fundraising and giving for the Windermere Foundation, thanks to the continued support of agents, franchise owners, staff, and the community. Nearly $2.5 million was raised in 2018, bringing our grand total to over $38 million raised since the Foundation’s inception in 1989! This money goes right back into our community, helping low-income and homeless families. Read the full blog post here.
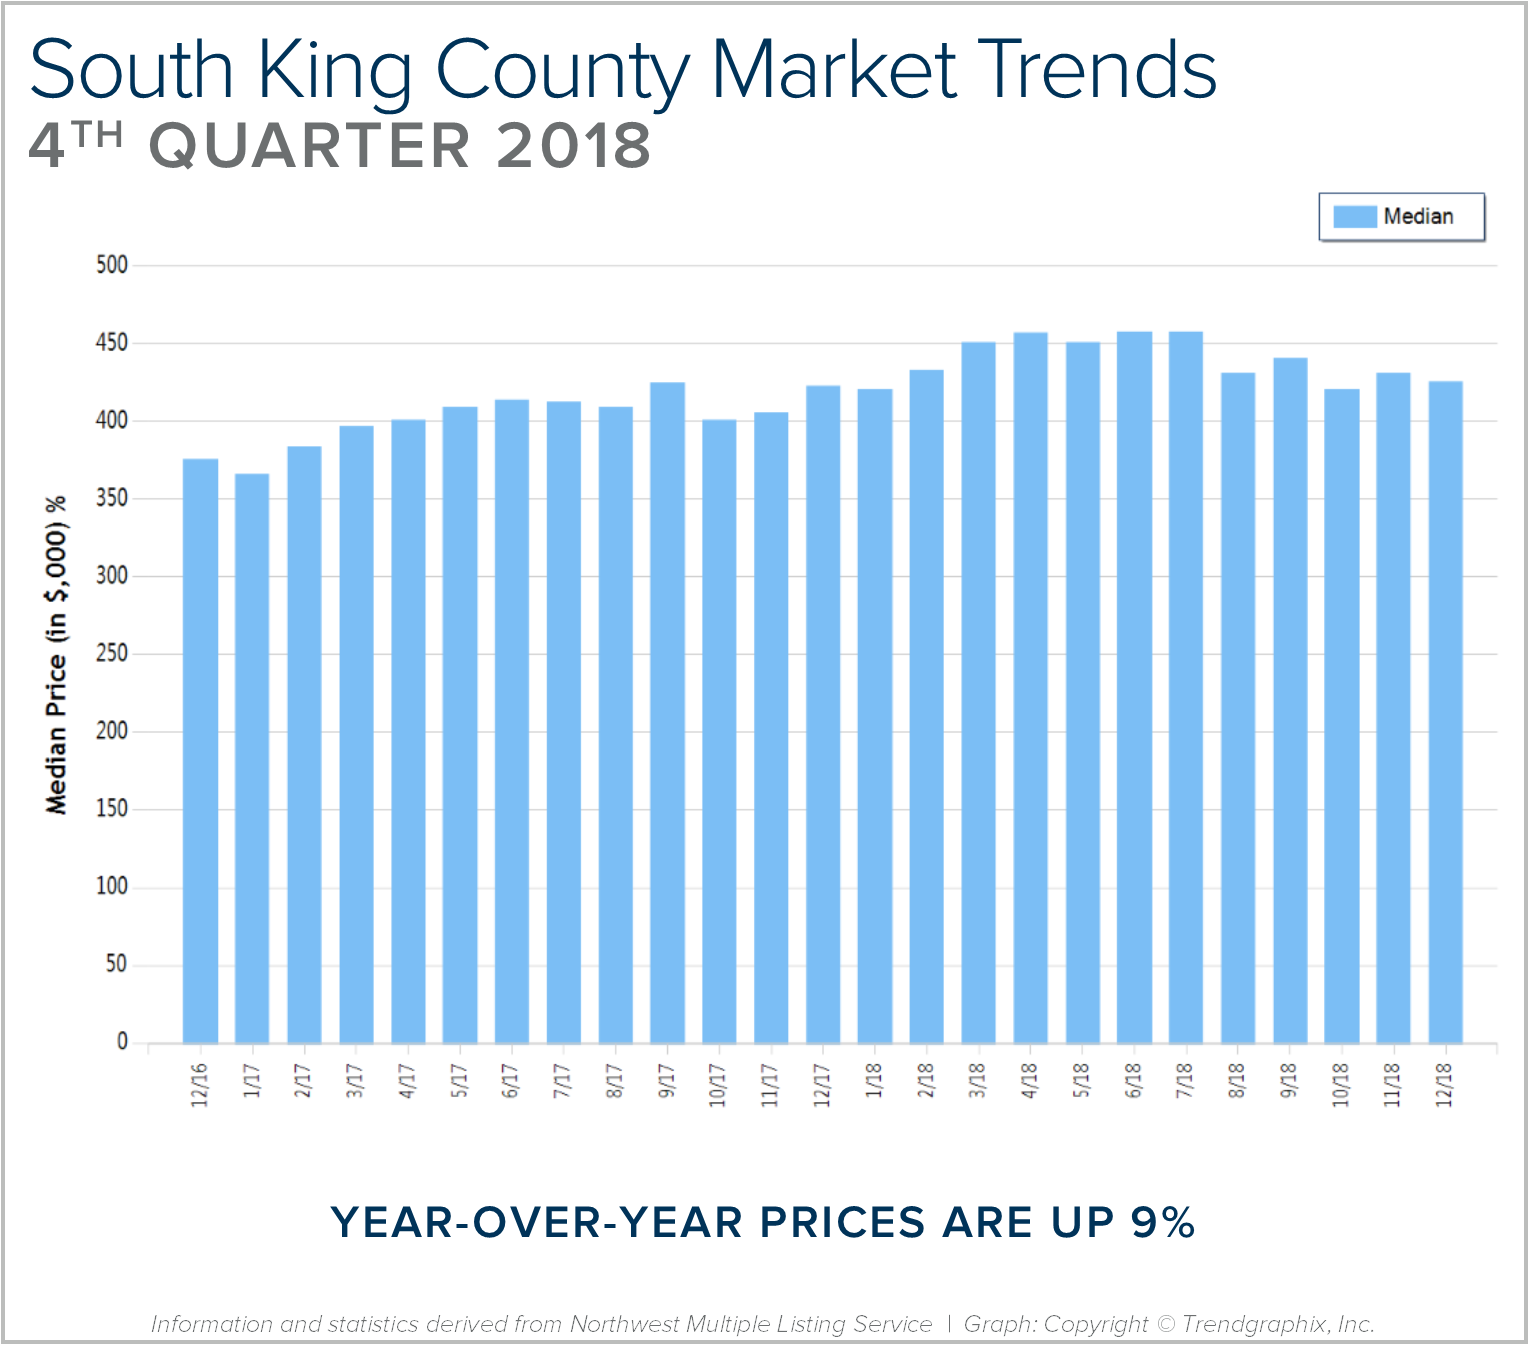
Quarterly Reports: Q4 South King County
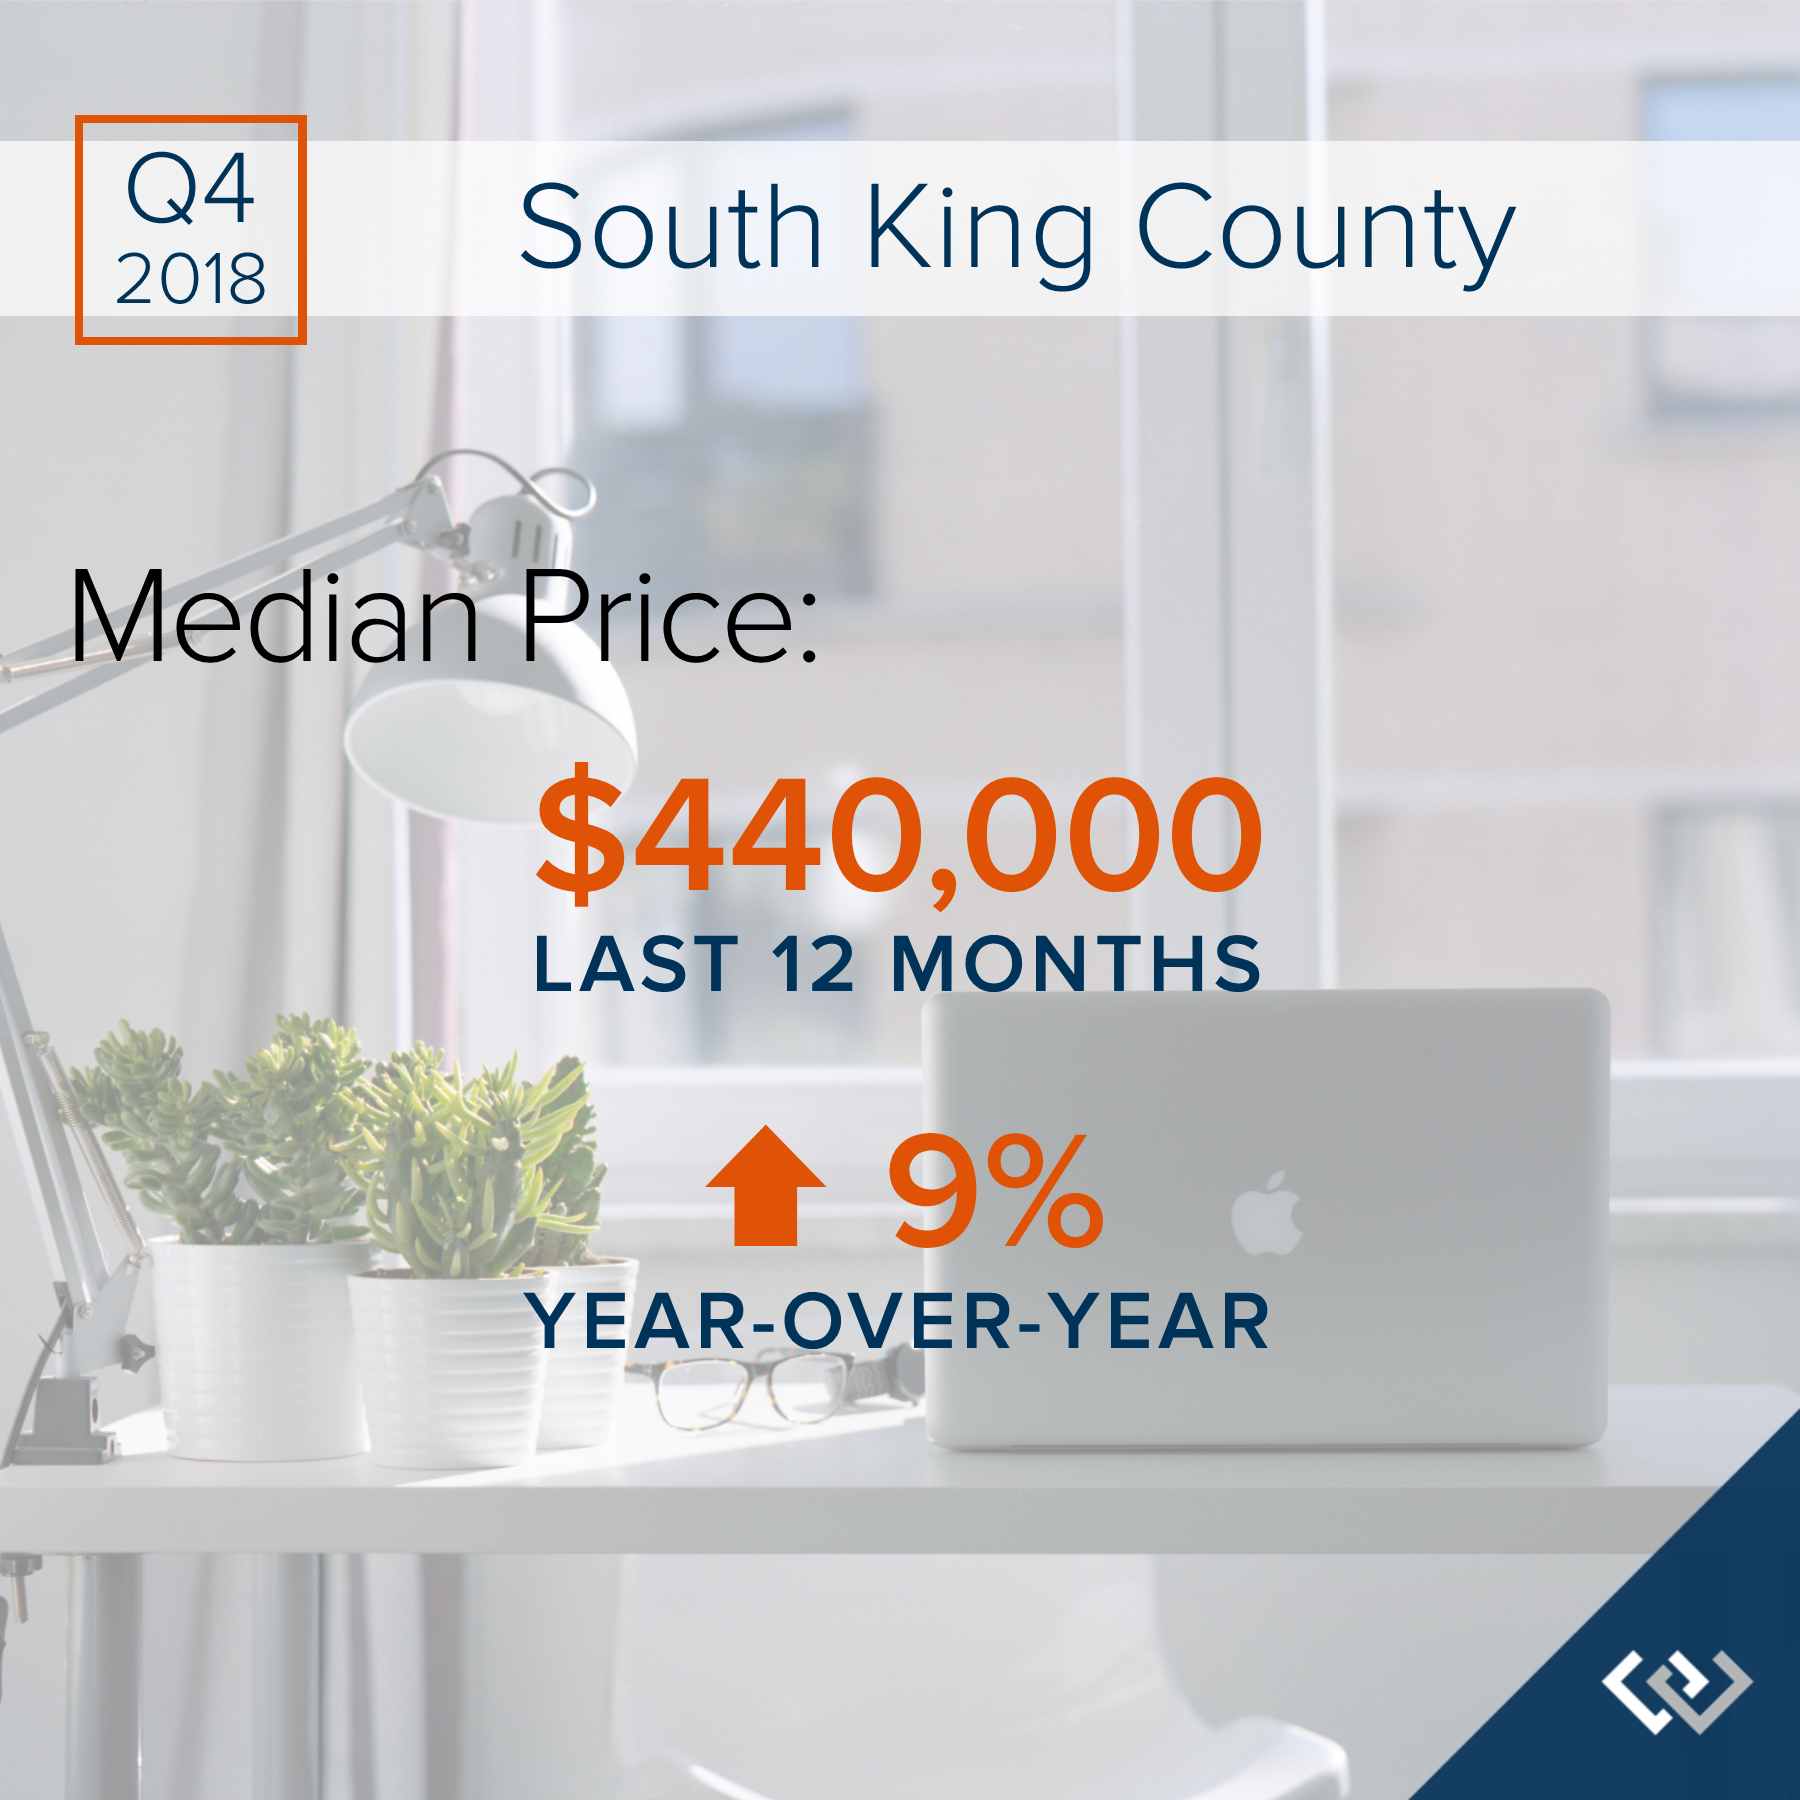
Q4: October 1 – December 31, 2018
SOUTH KING COUNTY: 2018 was a year of change and growth. The market shifted from an extreme seller’s market, but still had strong gains. Year-over-year, median price is up 9% and since 2012 has increased 89%! Over the last 19 years, the average year-over-year price increase has been 6%. This puts into perspective the growth we have experienced, resulting in well-established equity levels. In 2018, inventory averaged 1.7 months, 30% more than 2017. This caused the month-over-month price gains to slow, and we experienced a price correction over the second half of the year. We expect to see more average levels of price appreciation in 2019 as the market continues to balance out.
After six years of expansion resulting in an extreme seller’s market, in 2018 we encountered a market shift in the late spring. Inventory increased, interest rates took a jump, and demand took a step back to re-evaluate the new playing field. This resulted in a tempering of month-over-month price appreciation, and has established some long-awaited balance. This balance has brought opportunities for both buyers and sellers. Buyers have more selection and are negotiating terms like inspection items and concessions. Sellers are sitting on 6+ years of equity growth, and are now able to sell their home and make a move without fearing where they will land next. Interest rates are still well below the 30-year average, currently hovering just under 5%. We are seeing demand start to re-engage now that the new normal has settled in.
This is only a snapshot of the trends in south King County; please contact us if you would like further explanation of how the latest trends relate to you.
Quarterly Reports: Q4 Eastside
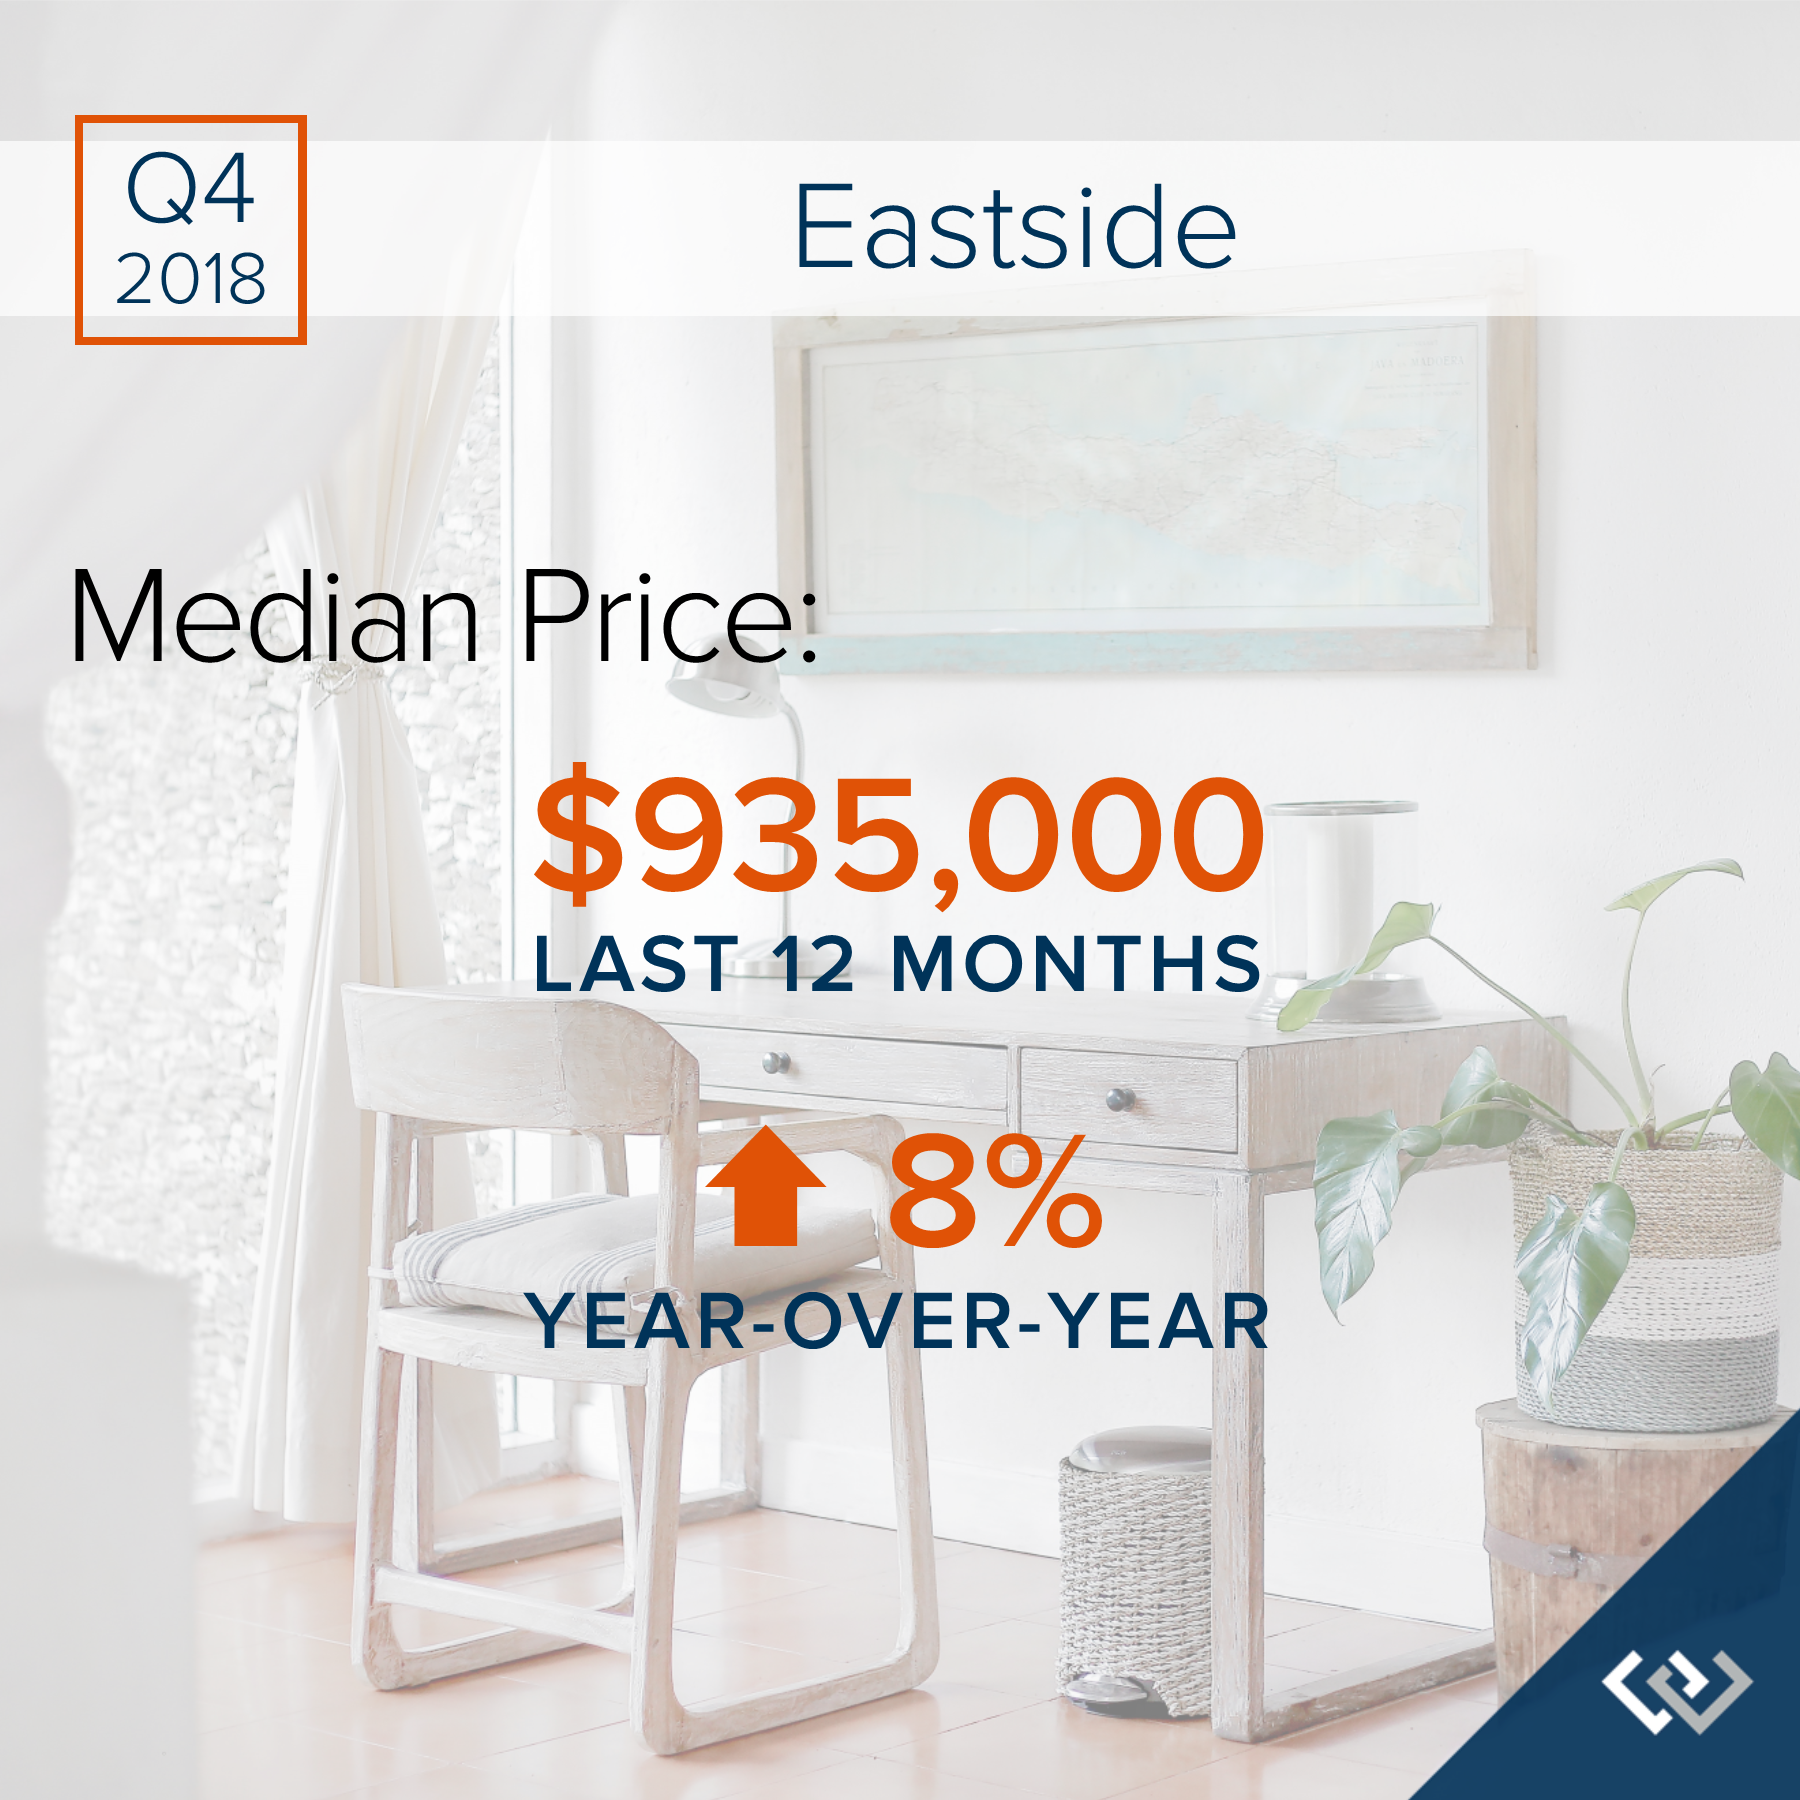
Q4: October 1 – December 31, 2018
EASTSIDE: 2018 was a year of change and growth. The market shifted from an extreme seller’s market, but still had strong gains. Year-over-year, median price is up 8% and since 2012 has increased 87%! Over the last 19 years, the average year-over-year price increase has been 6%. This puts into perspective the growth we have experienced, resulting in well-established equity levels. In 2018, inventory averaged 2 months, double that of 2017. This caused the month-over-month price gains to slow, and we experienced a price correction over the second half of the year. We expect to see more average levels of price appreciation in 2019 as the market continues to balance out.
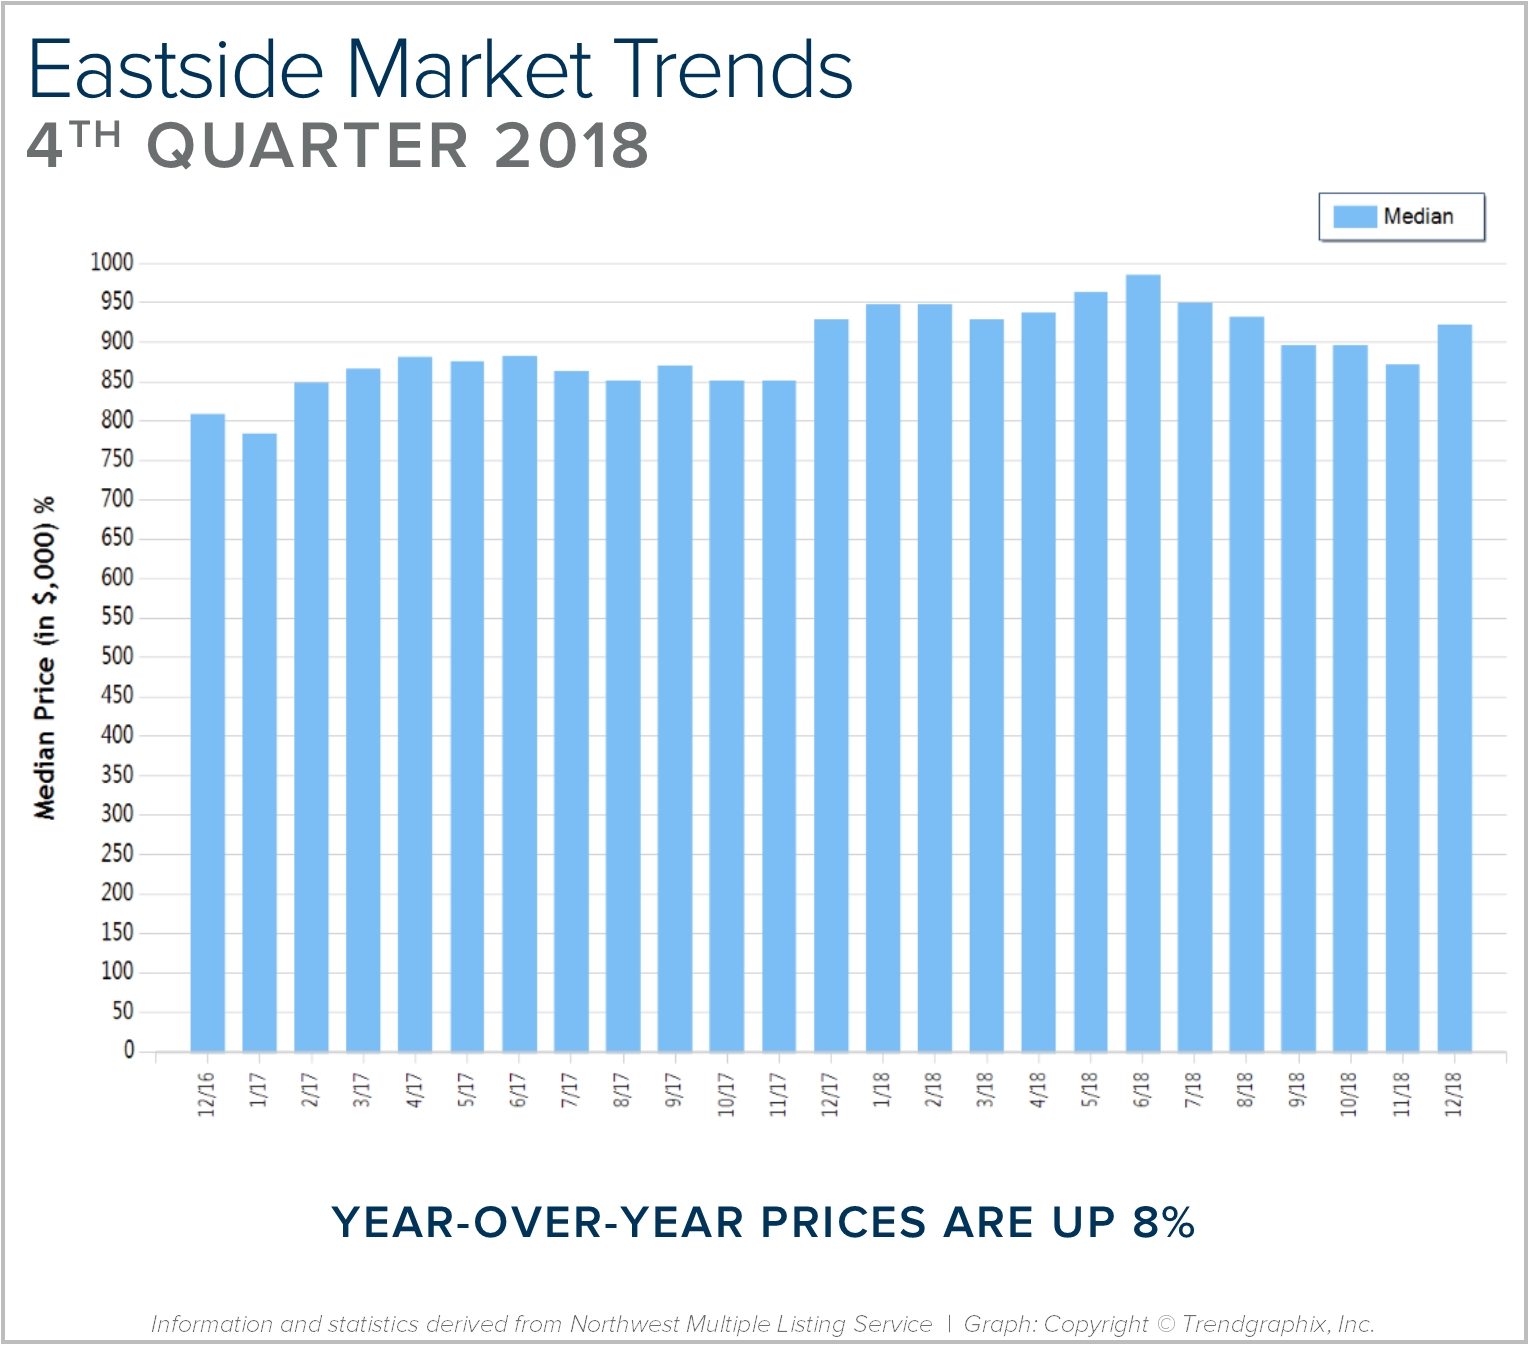
After six years of expansion resulting in an extreme seller’s market, in 2018 we encountered a market shift in the late spring. Inventory increased, interest rates took a jump, and demand took a step back to re-evaluate the new playing field. This resulted in a tempering of month-over-month price appreciation, and has established some long-awaited balance. This balance has brought opportunities for both buyers and sellers. Buyers have more selection and are negotiating terms like inspection items and concessions. Sellers are sitting on 6+ years of equity growth, and are now able to sell their home and make a move without fearing where they will land next. Interest rates are still well below the 30-year average, currently hovering just under 5%. We are seeing demand start to re-engage now that the new normal has settled in.
This is only a snapshot of the trends on the Eastside; please contact us if you would like further explanation of how the latest trends relate to you.
Quarterly Reports: Q4 Seattle Metro
Q4: October 1 – December 31, 2018
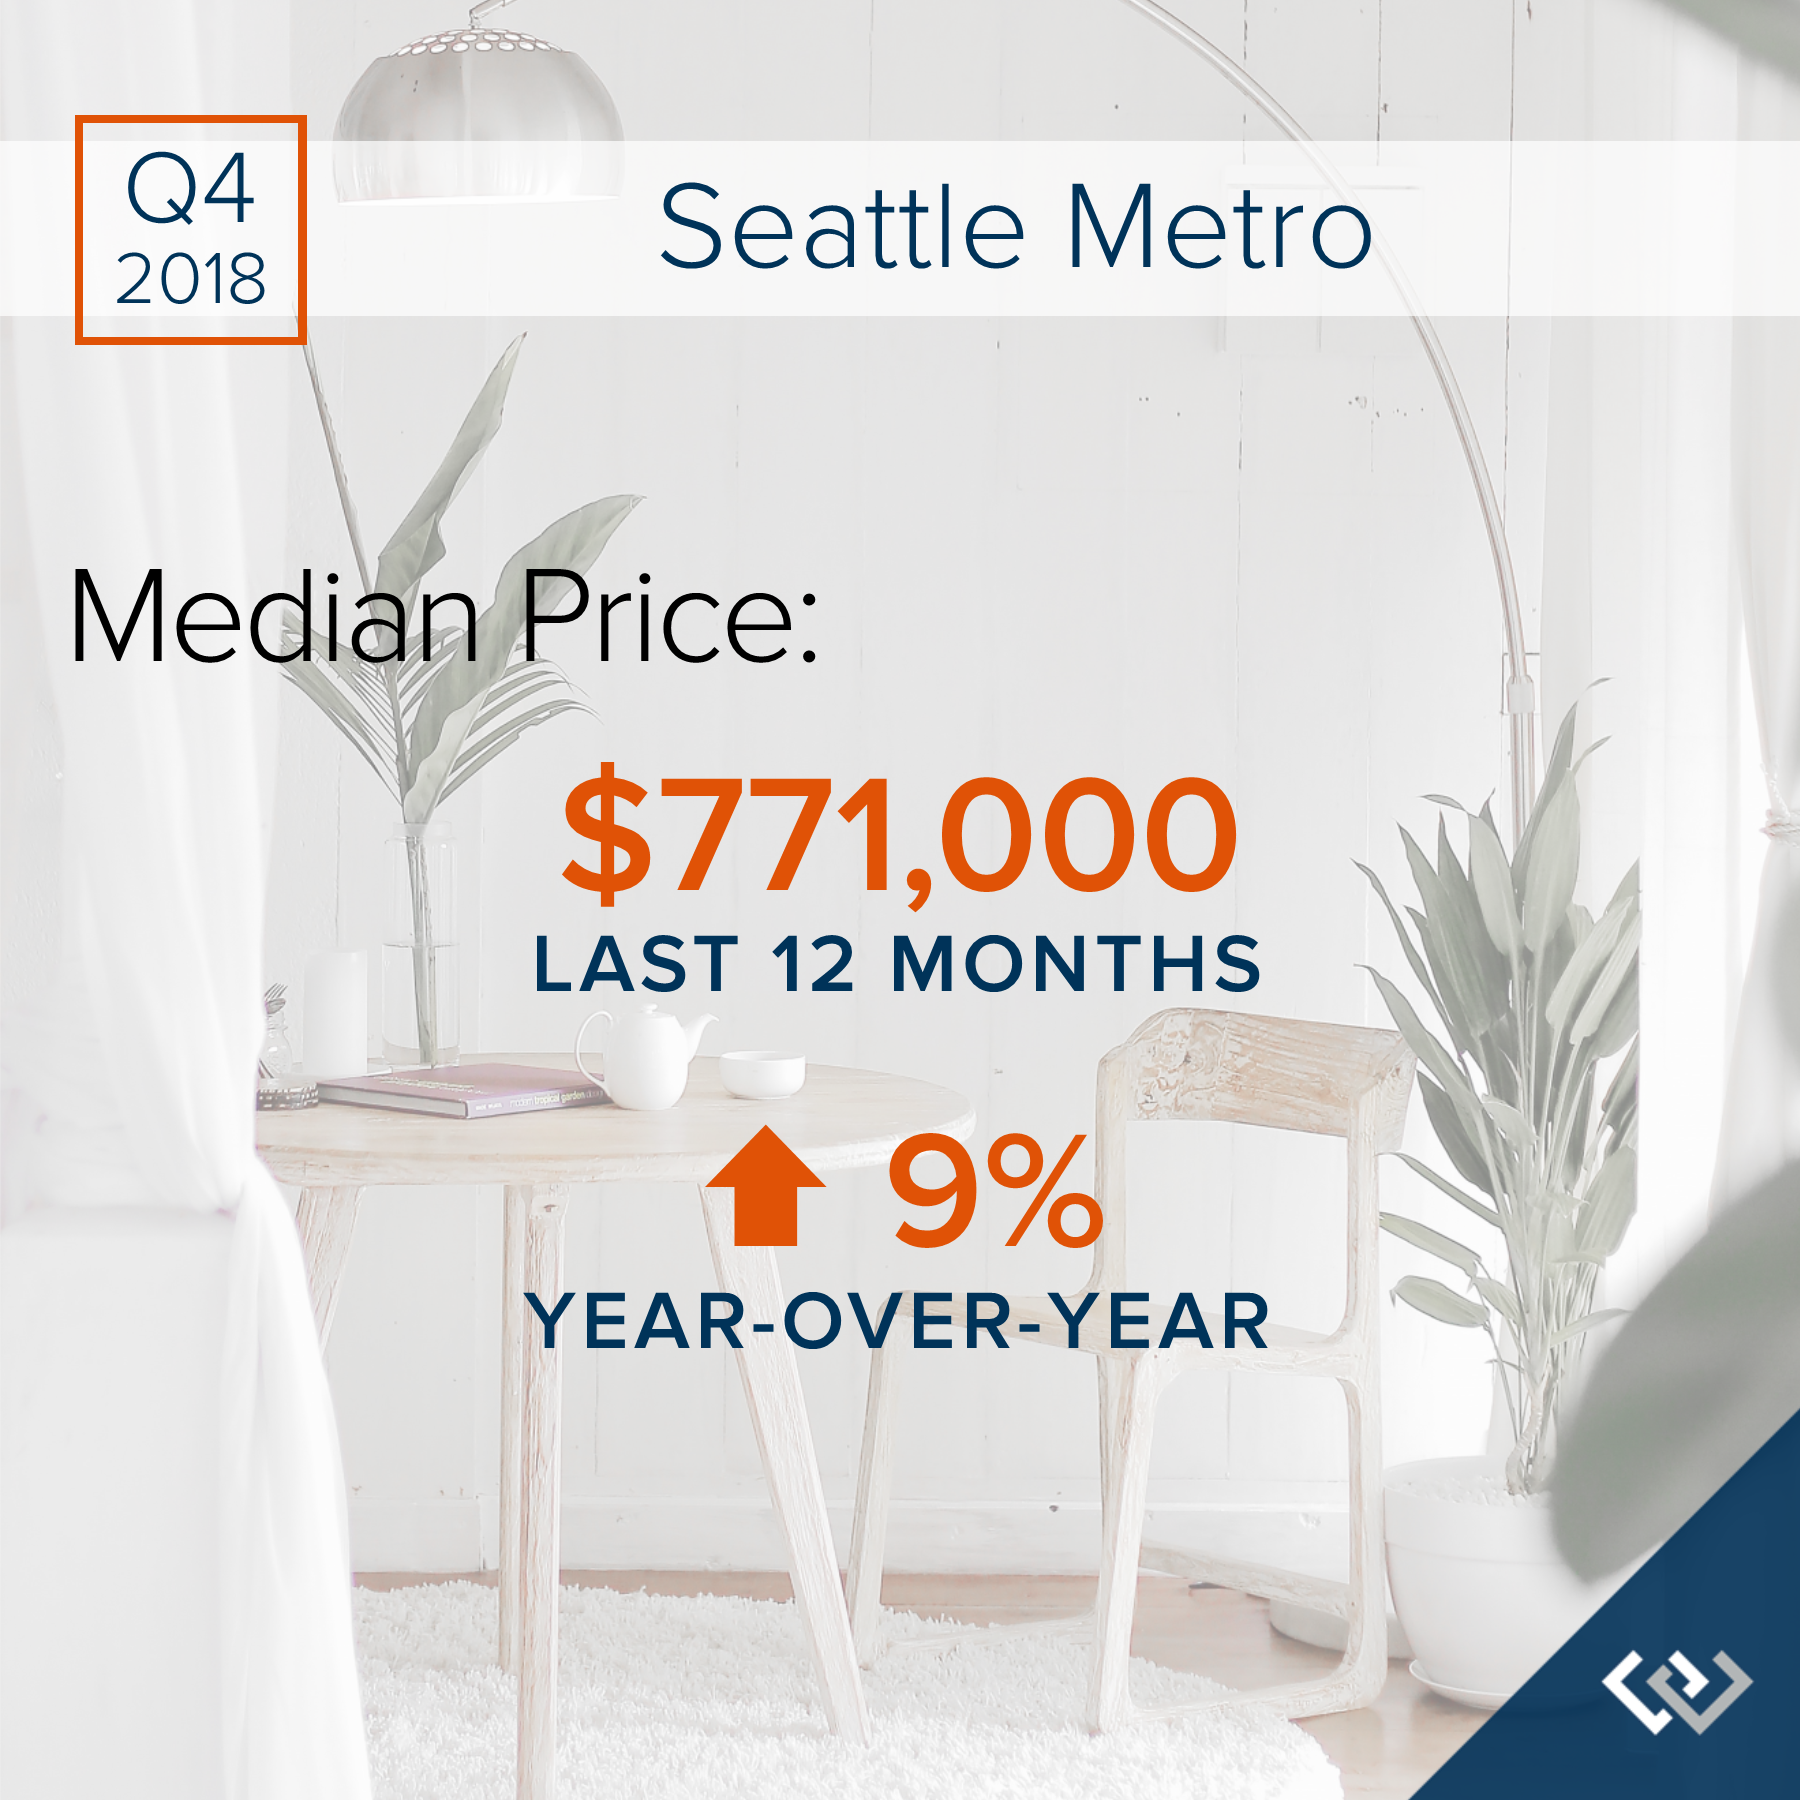
SEATTLE METRO: 2018 was a year of change and growth. The market shifted from an extreme seller’s market, but still had strong gains. Year-over-year, median price is up 9% and since 2012 has increased 93%! Over the last 19 years, the average year-over-year price increase has been 6%. This puts into perspective the growth we have experienced, resulting in well-established equity levels. In 2018, inventory averaged 1.5 months, double that of 2017. This caused the month-over-month price gains to slow, and we experienced a price correction over the second half of the year. We expect to see more average levels of price appreciation in 2019 as the market continues to balance out.
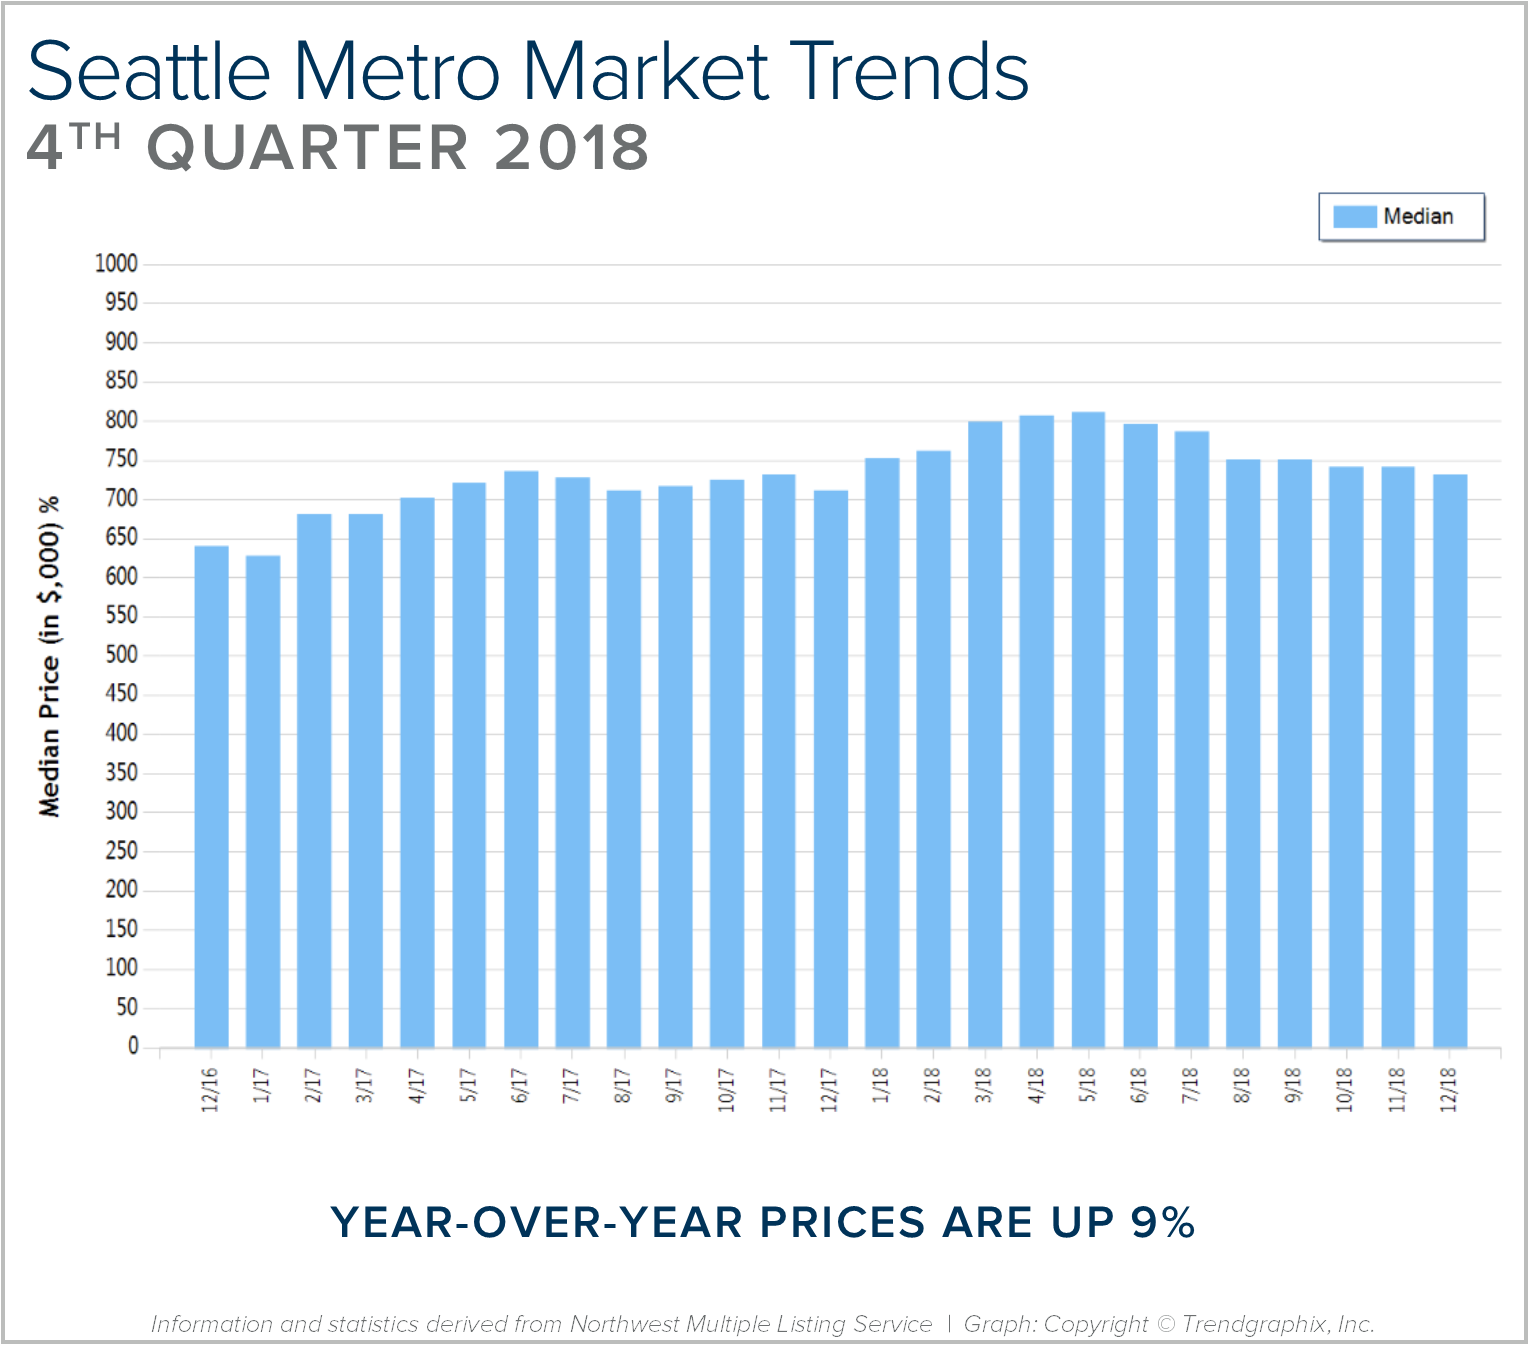
After six years of expansion resulting in an extreme seller’s market, in 2018 we encountered a market shift in the late spring. Inventory increased, interest rates took a jump, and demand took a step back to re-evaluate the new playing field. This resulted in a tempering of month-over-month price appreciation, and has established some long-awaited balance. This balance has brought opportunities for both buyers and sellers. Buyers have more selection and are negotiating terms like inspection items and concessions. Sellers are sitting on 6+ years of equity growth, and are now able to sell their home and make a move without fearing where they will land next. Interest rates are still well below the 30-year average, currently hovering just under 5%. We are seeing demand start to re-engage now that the new normal has settled in.
This is only a snapshot of the trends the Seattle Metro area; please contact us if you would like further explanation of how the latest trends relate to you.
Quarterly Reports: Q4 North King County
Q4: October 1 – December 31, 2018
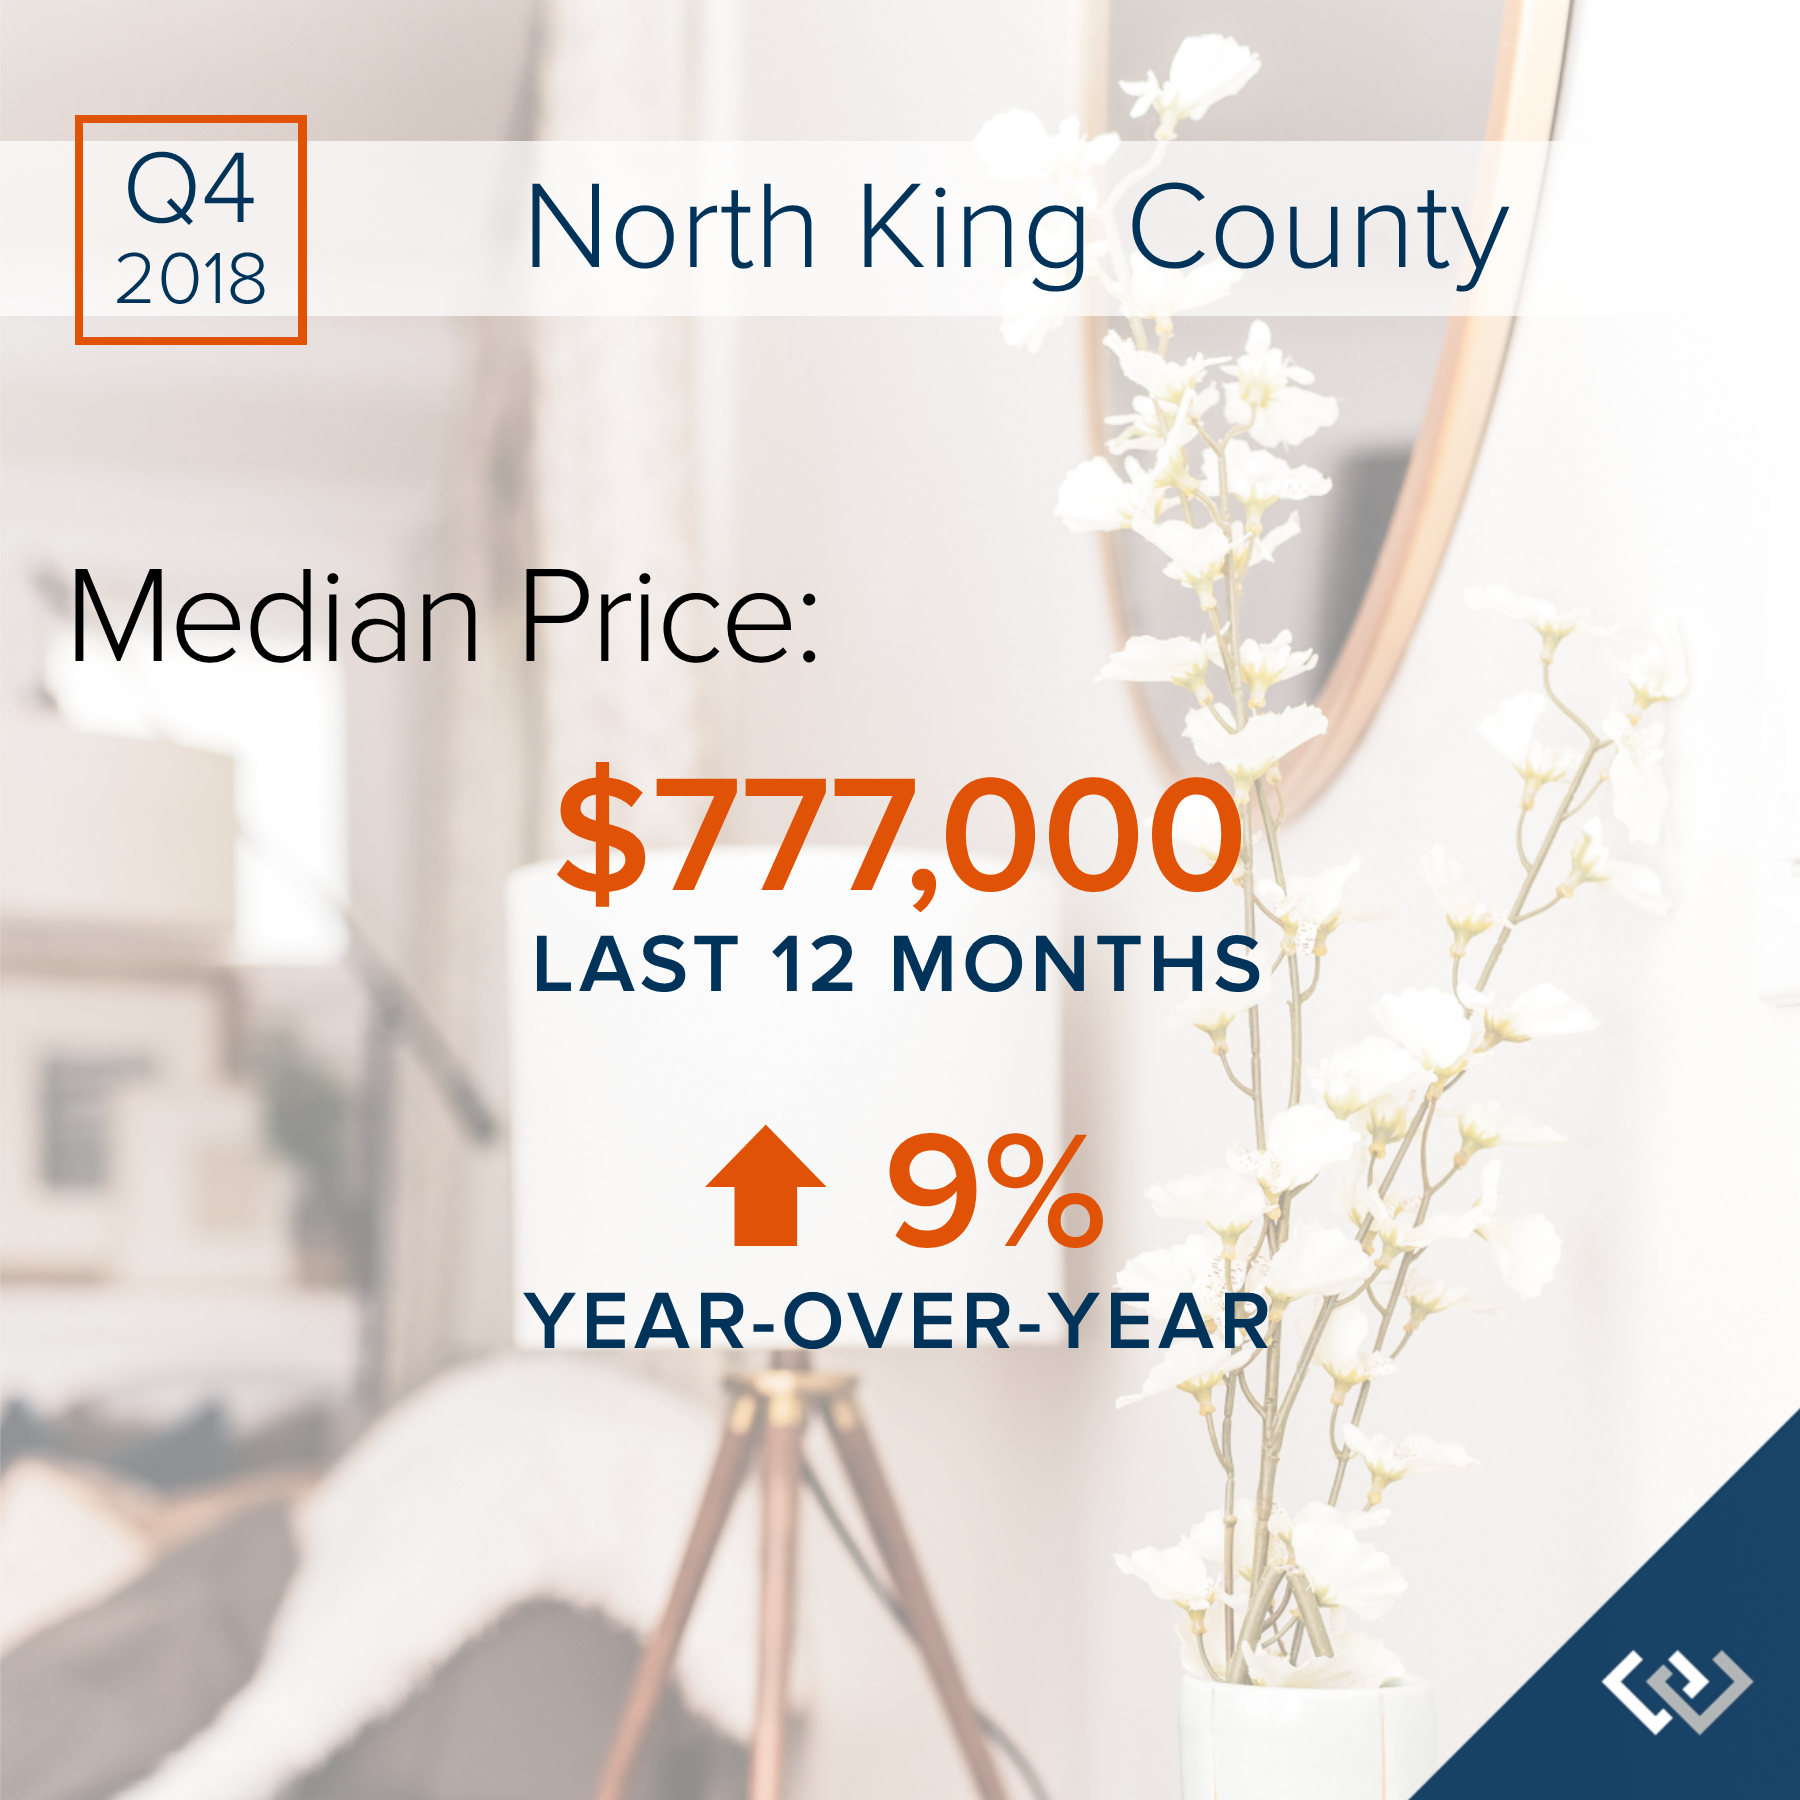
NORTH KING COUNTY: 2018 was a year of change and growth. The market shifted from an extreme seller’s market, but still had strong gains. Year-over-year, median price is up 9% and since 2012 has increased 92%! Over the last 19 years, the average year-over-year price increase has been 6%. This puts into perspective the growth we have experienced, resulting in well-established equity levels. In 2018, inventory averaged 1.5 months, double that of 2017. This caused the month-over-month price gains to slow, and we experienced a price correction over the second half of the year. We expect to see more average levels of price appreciation in 2019 as the market continues to balance out.

After six years of expansion resulting in an extreme seller’s market, in 2018 we encountered a market shift in the late spring. Inventory increased, interest rates took a jump, and demand took a step back to re-evaluate the new playing field. This resulted in a tempering of month-over-month price appreciation, and has established some long-awaited balance. This balance has brought opportunities for both buyers and sellers. Buyers have more selection and are negotiating terms like inspection items and concessions. Sellers are sitting on 6+ years of equity growth, and are now able to sell their home and make a move without fearing where they will land next. Interest rates are still well below the 30-year average, currently hovering just under 5%. We are seeing demand start to re-engage now that the new normal has settled in.
This is only a snapshot of the trends in north King County; please contact us if you would like further explanation of how the latest trends relate to you.
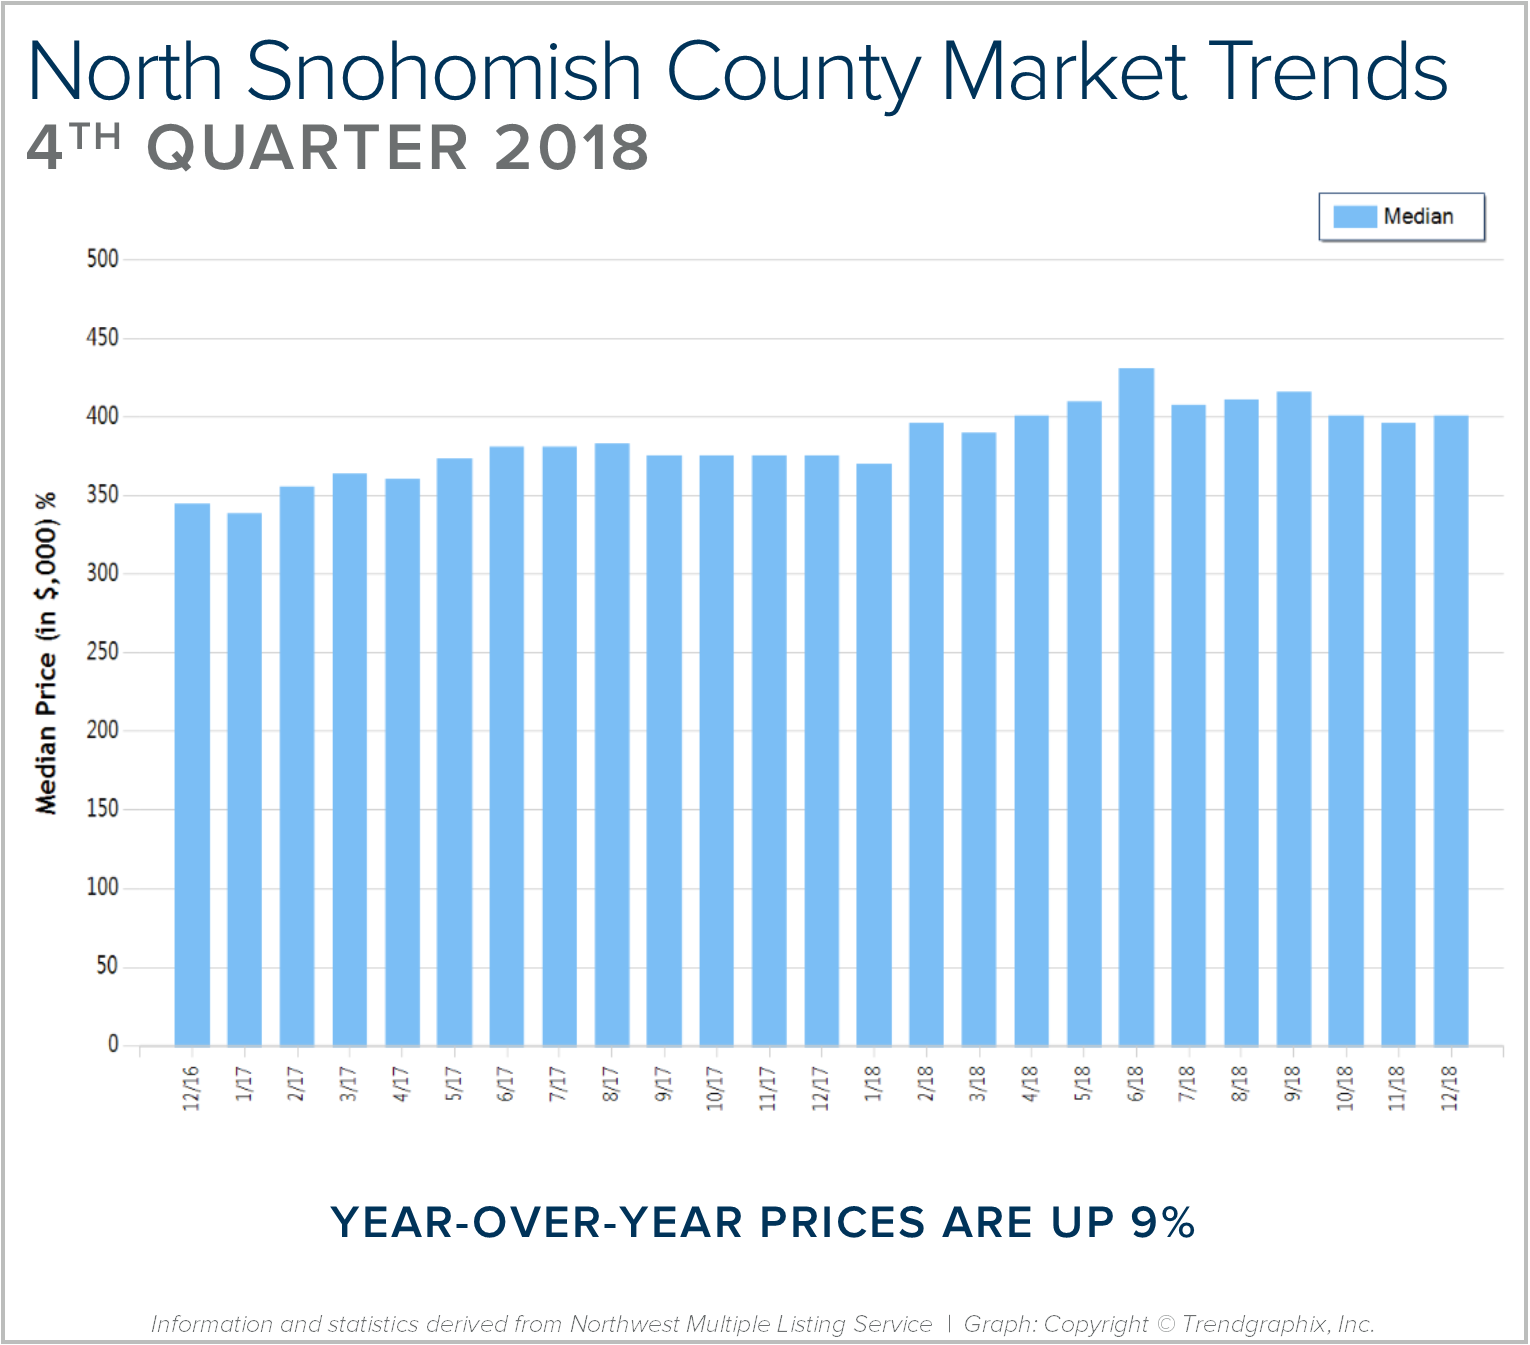
Quarterly Reports: Q4 North Snohomish County
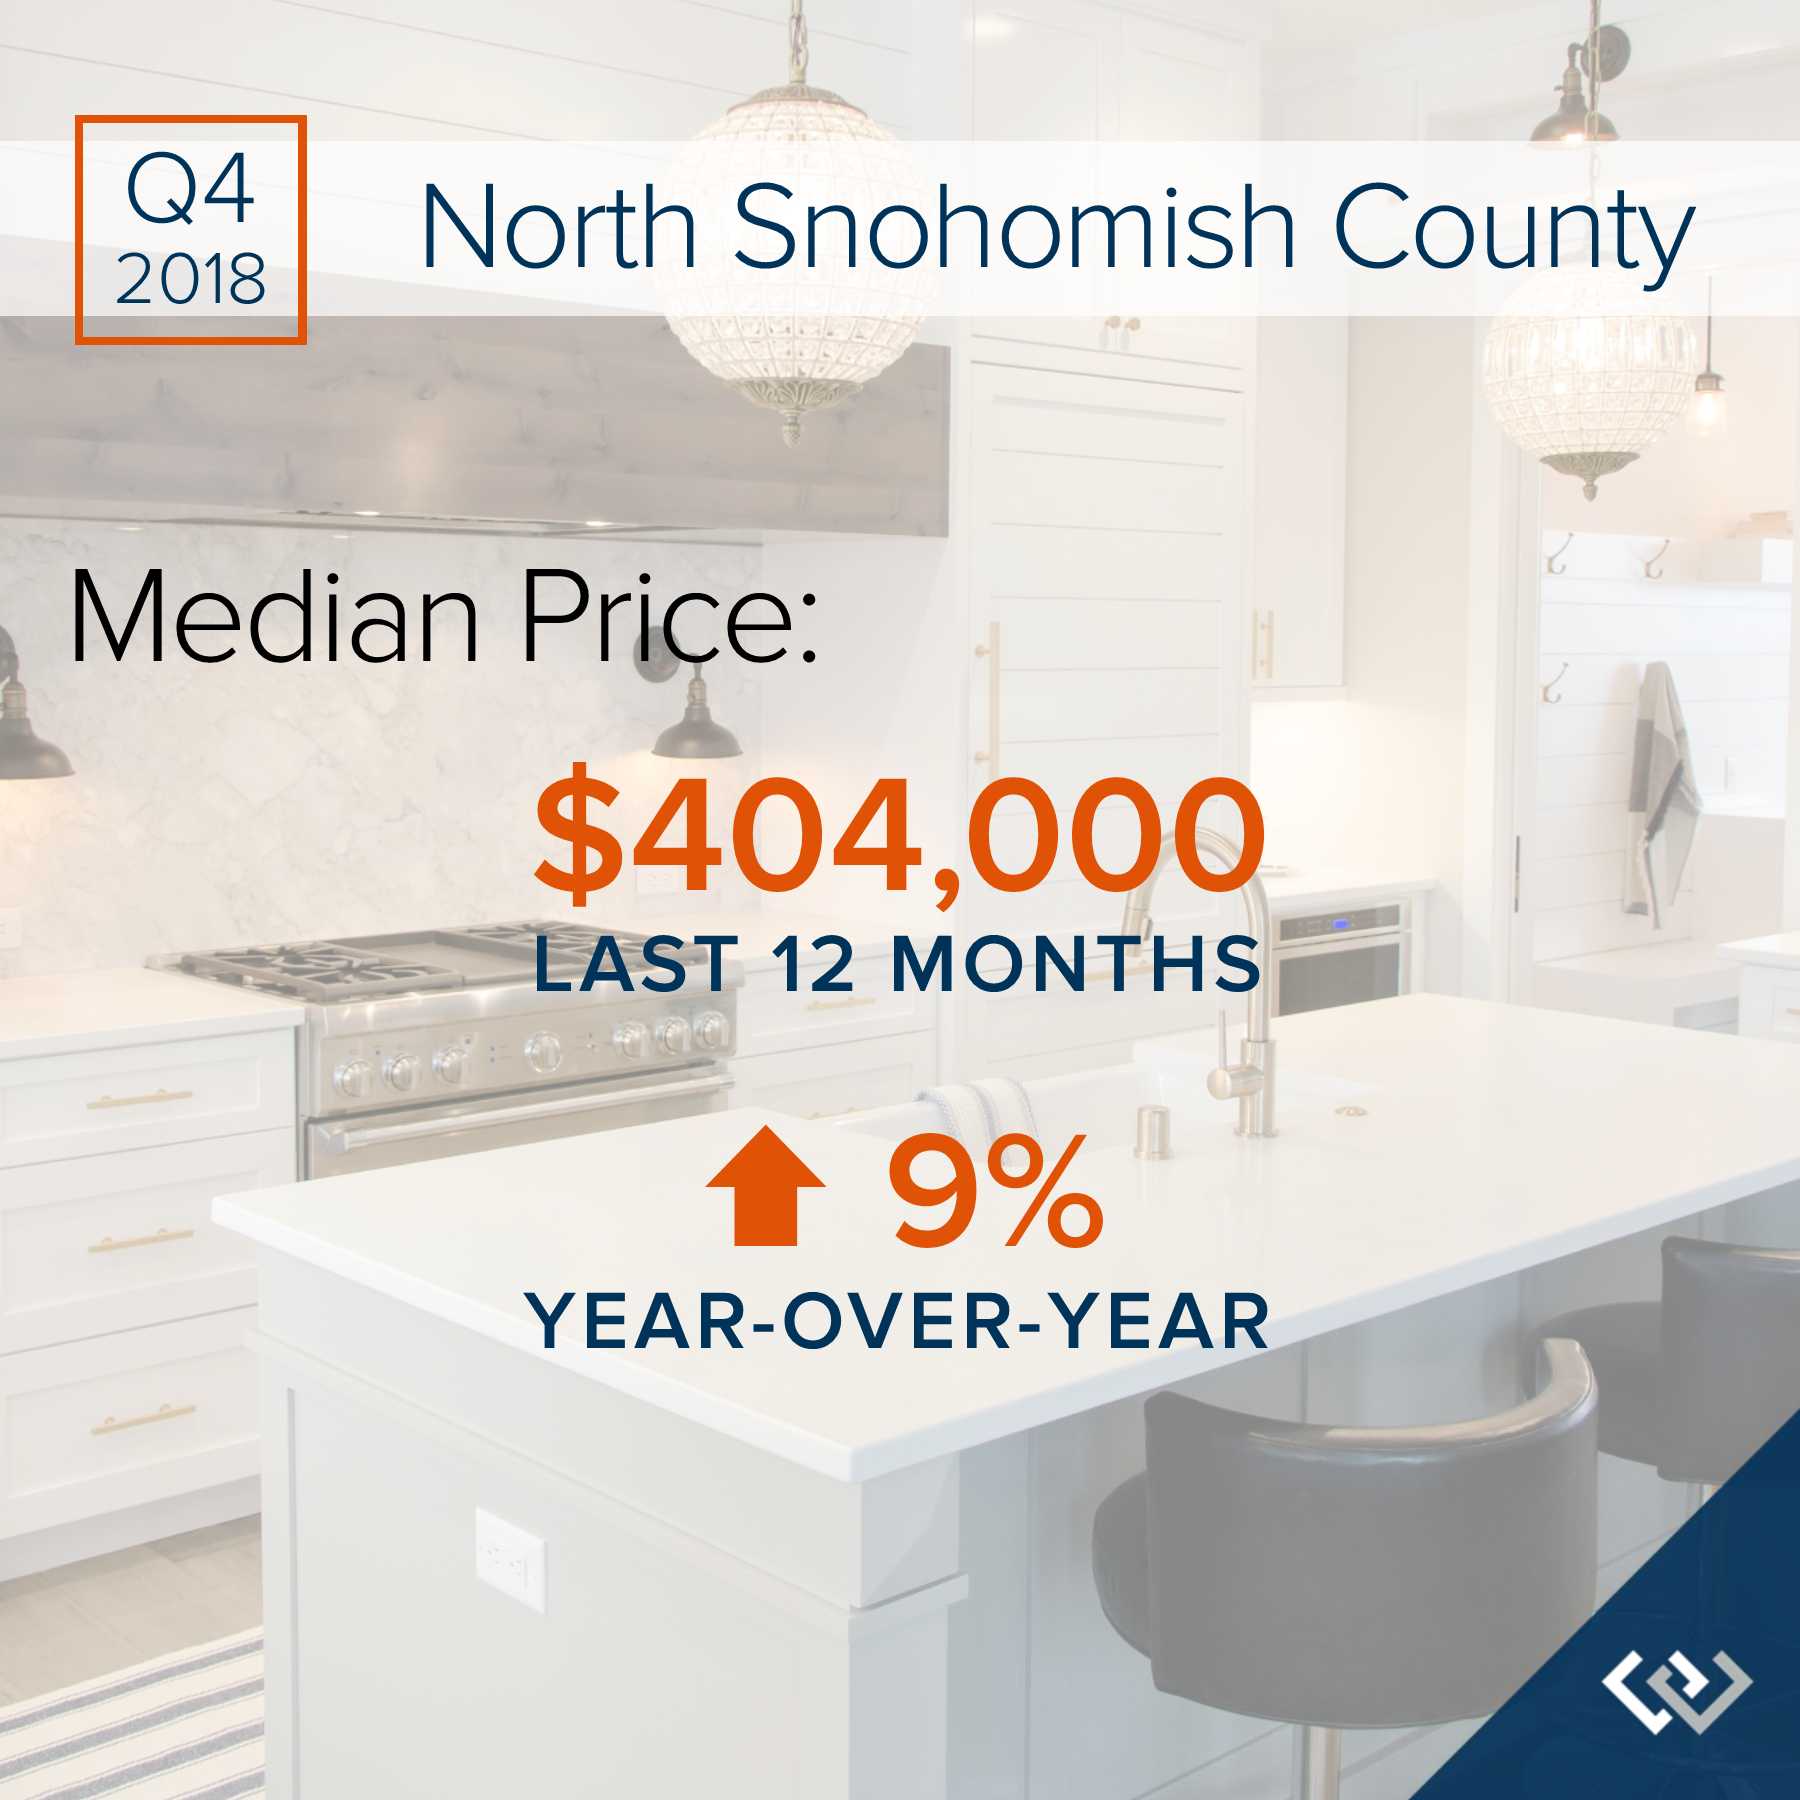
Q4: October 1 – December 31, 2018
NORTH SNOHOMISH COUNTY: 2018 was a year of change and growth. The market shifted from an extreme seller’s market, but still had strong gains. Year-over-year, median price is up 9% and since 2012 has increased 88%! Over the last 19 years, the average year-over-year price increase has been 6%. This puts into perspective the growth we have experienced, resulting in well-established equity levels. In 2018, inventory averaged 1.6 months, higher than 2017. This caused the month-over-month price gains to slow, and we experienced a price correction over the second half of the year. We expect to see more average levels of price appreciation in 2019 as the market continues to balance out.
After six years of expansion resulting in an extreme seller’s market, in 2018 we encountered a market shift in the late spring. Inventory increased, interest rates took a jump, and demand took a step back to re-evaluate the new playing field. This resulted in a tempering of month-over-month price appreciation, and has established some long-awaited balance. This balance has brought opportunities for both buyers and sellers. Buyers have more selection and are negotiating terms like inspection items and concessions. Sellers are sitting on 6+ years of equity growth, and are now able to sell their home and make a move without fearing where they will land next. Interest rates are still well below the 30-year average, currently hovering just under 5%. We are seeing demand start to re-engage now that the new normal has settled in.
This is only a snapshot of the trends in north Snohomish County; please contact us if you would like further explanation of how the latest trends relate to you.
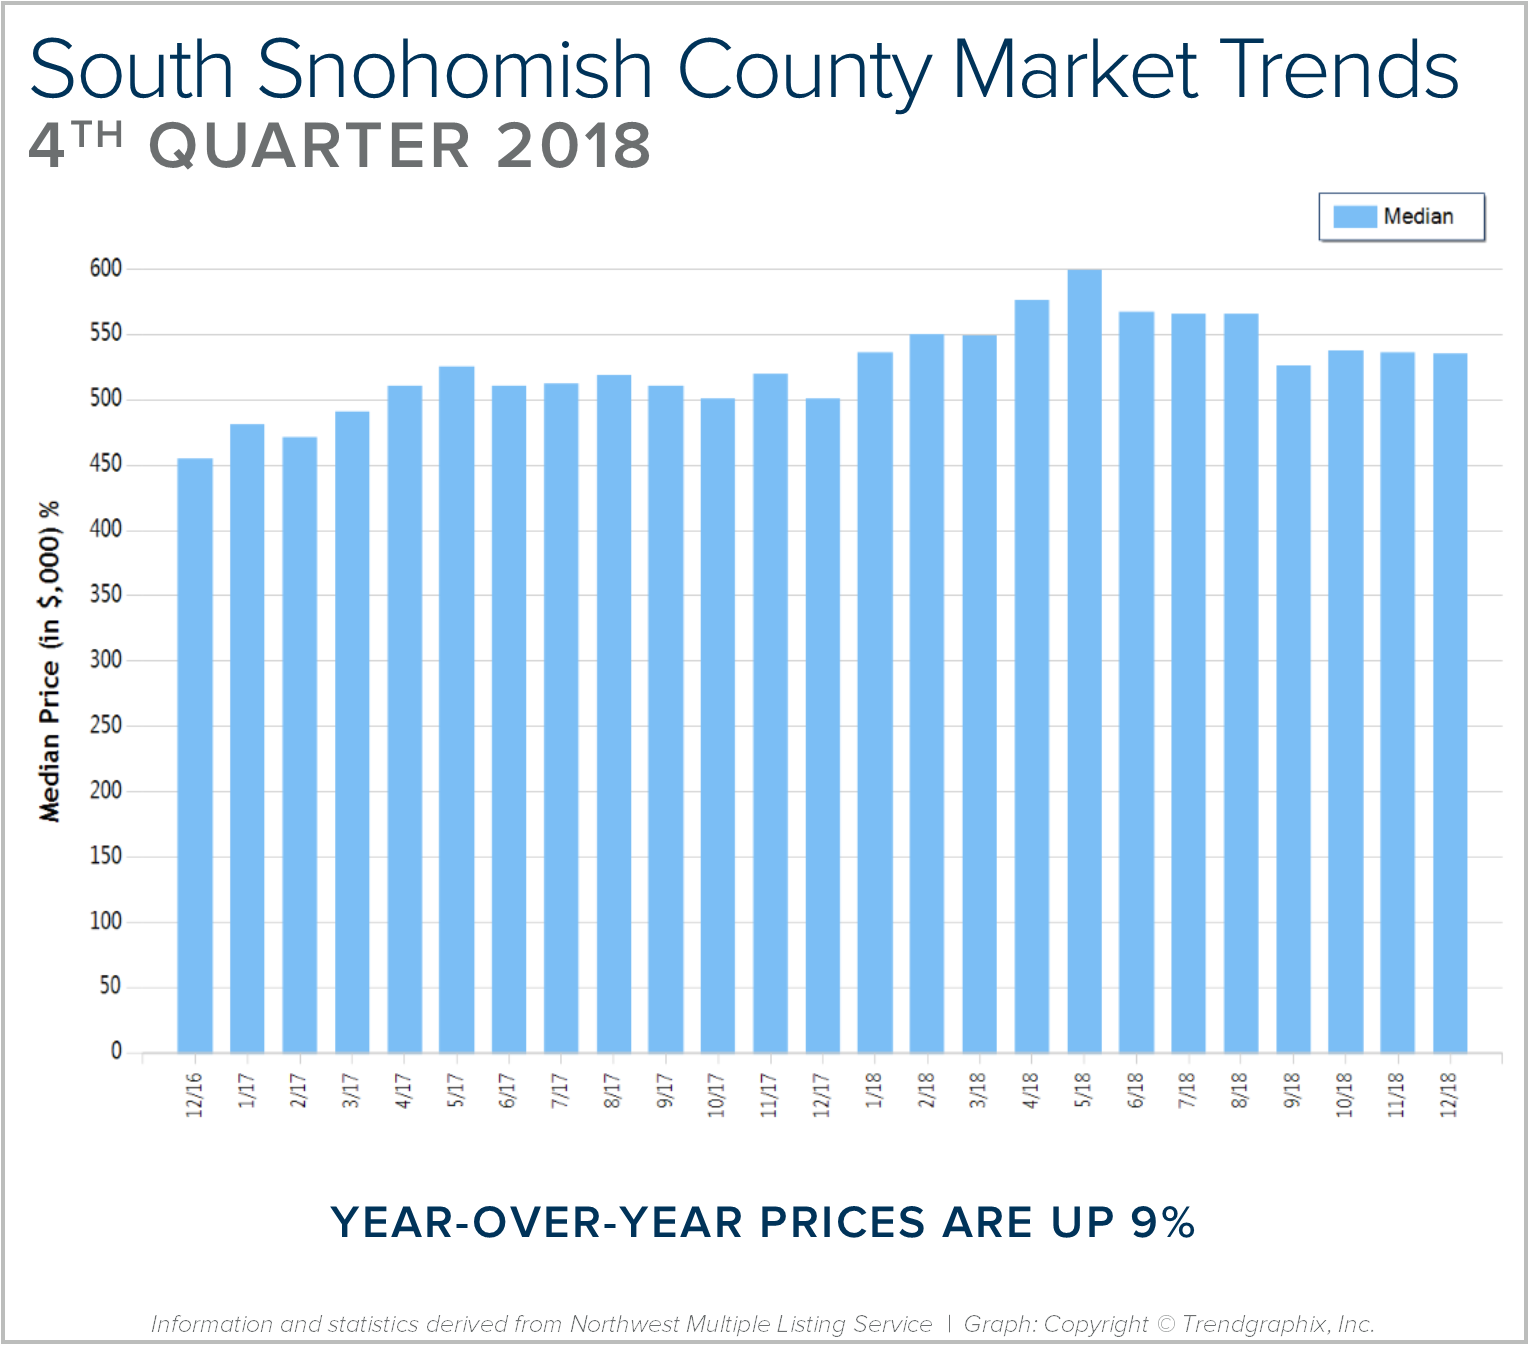
Quarterly Reports: Q4 South Snohomish County
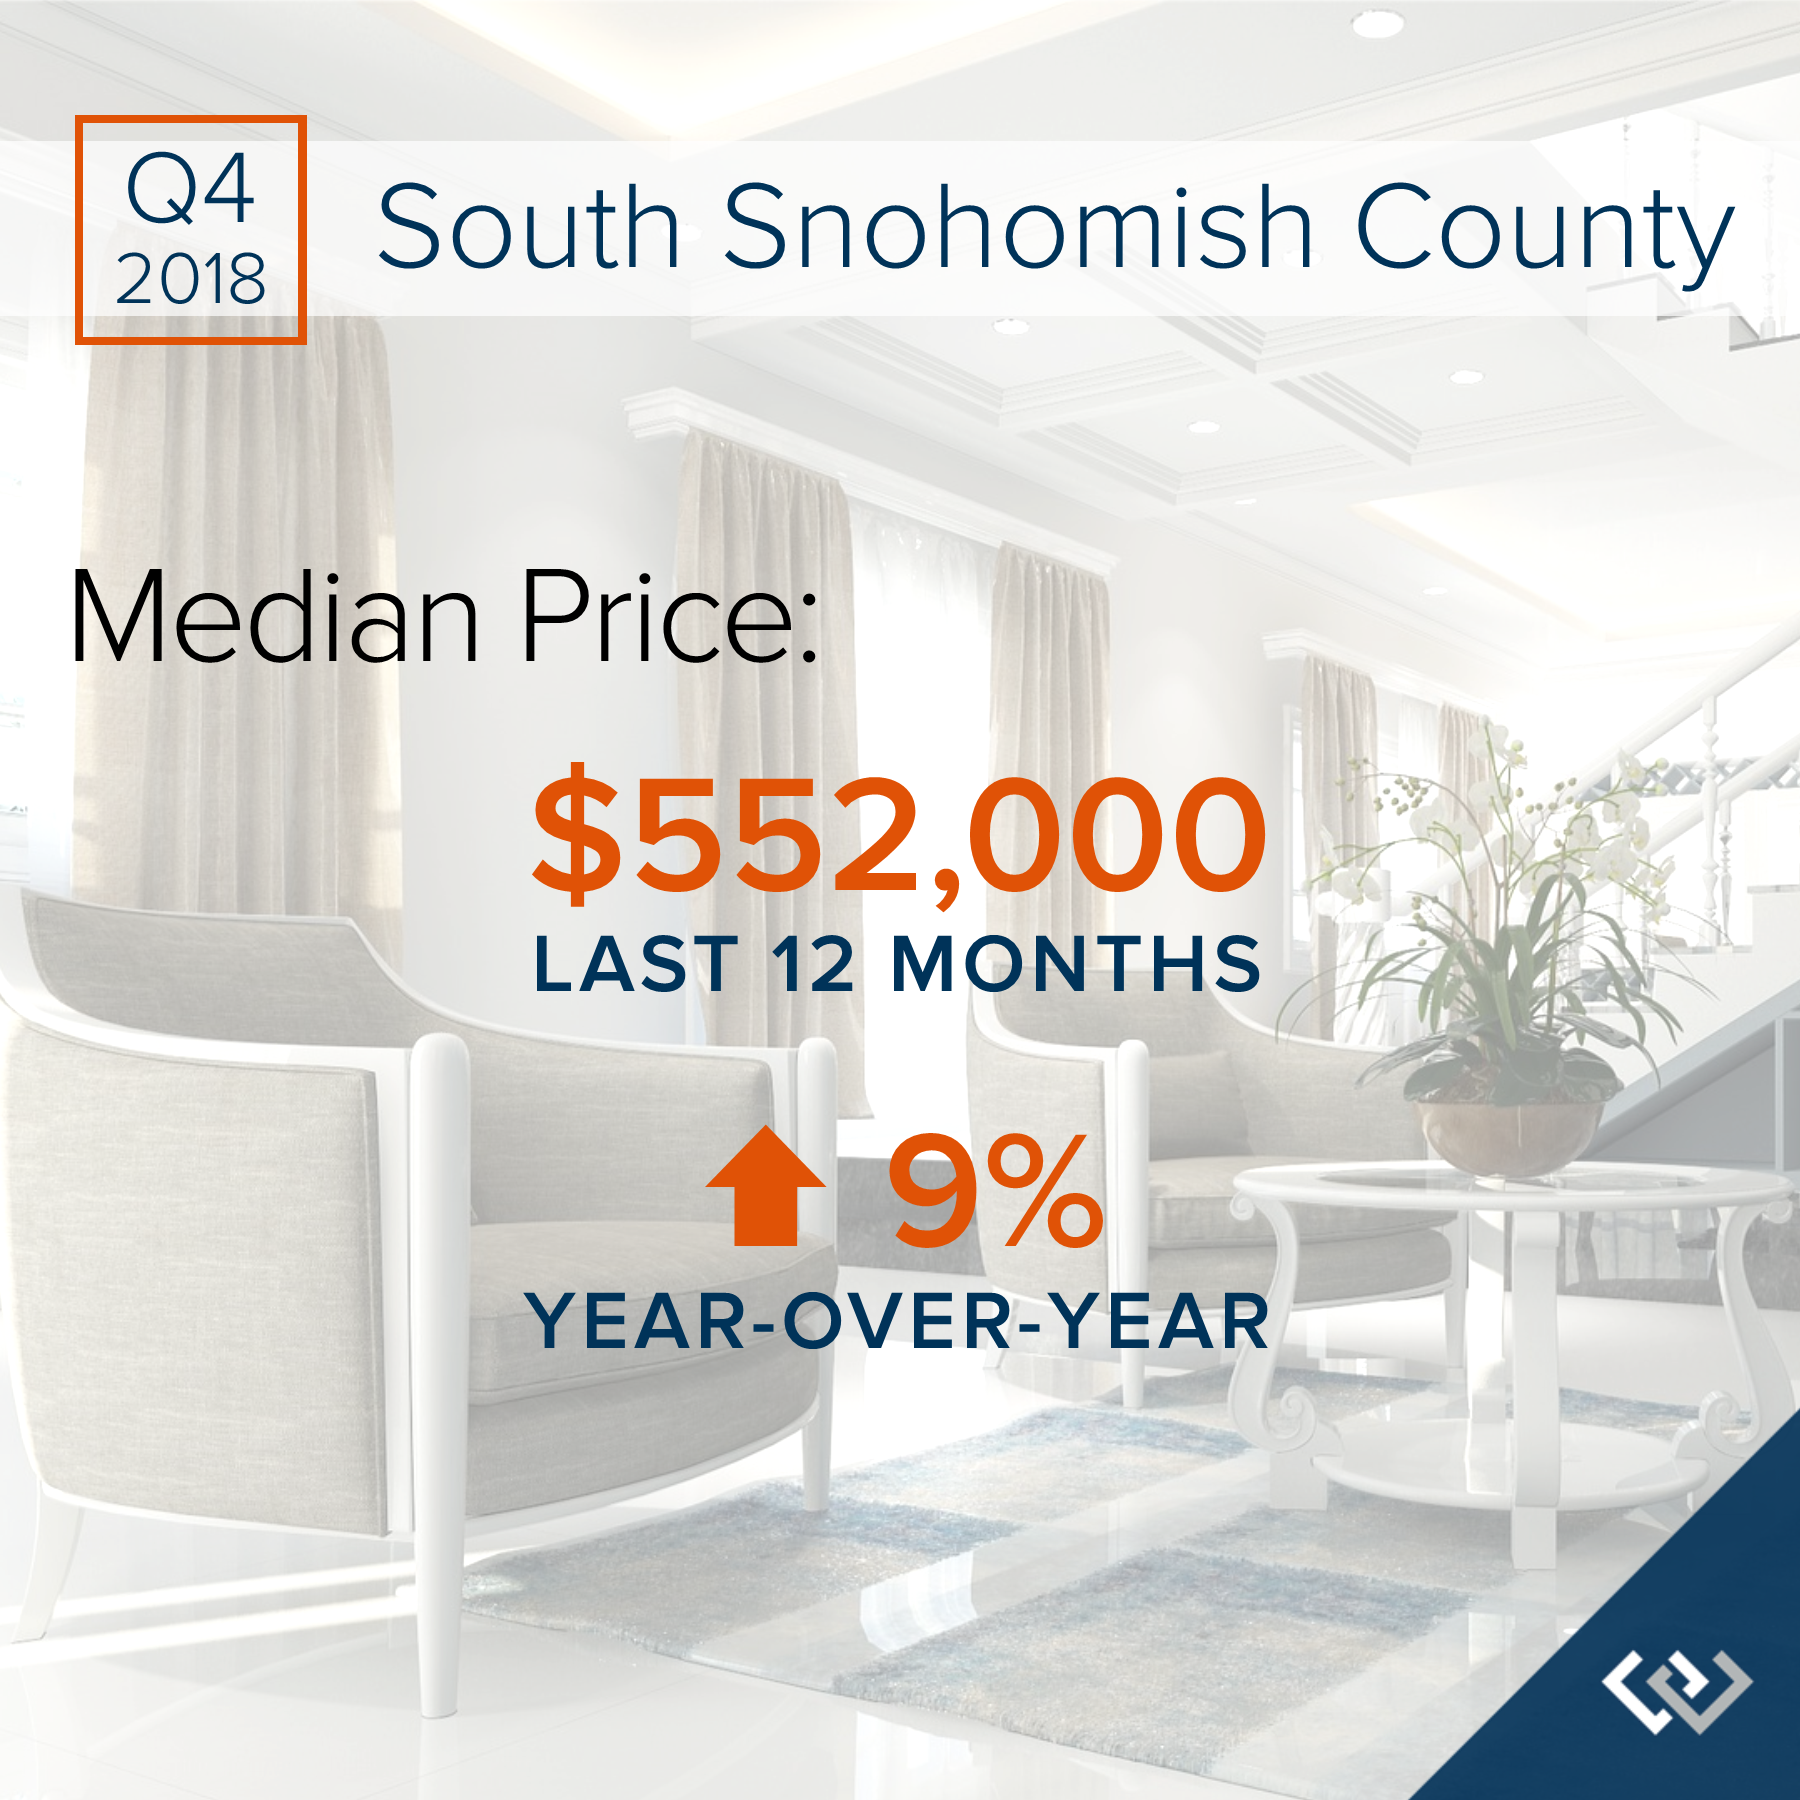
Q4: October 1 – December 31, 2018
SOUTH SNOHOMISH COUNTY: 2018 was a year of change and growth. The market shifted from an extreme seller’s market, but still had strong gains. Year-over-year, median price is up 9% and since 2012 has increased 85%! Over the last 19 years, the average year-over-year price increase has been 6%. This puts into perspective the growth we have experienced, resulting in well-established equity levels. In 2018, inventory averaged 1.5 months, double that of 2017. This caused the month-over-month price gains to slow, and we experienced a price correction over the second half of the year. We expect to see more average levels of price appreciation in 2019 as the market continues to balance out.
After six years of expansion resulting in an extreme seller’s market, in 2018 we encountered a market shift in the late spring. Inventory increased, interest rates took a jump, and demand took a step back to re-evaluate the new playing field. This resulted in a tempering of month-over-month price appreciation, and has established some long-awaited balance. This balance has brought opportunities for both buyers and sellers. Buyers have more selection and are negotiating terms like inspection items and concessions. Sellers are sitting on 6+ years of equity growth, and are now able to sell their home and make a move without fearing where they will land next. Interest rates are still well below the 30-year average, currently hovering just under 5%. We are seeing demand start to re-engage now that the new normal has settled in.
This is only a snapshot of the trends in south Snohomish County; please contact us if you would like further explanation of how the latest trends relate to you.
2018 Year in Review


2018 was a year of growth and change. The dynamic greater Seattle area and hottest real estate market in the country started to head toward some balance. After six years of expansion resulting in an extreme seller’s market, we encountered a market shift in the late spring. Where it is tricky, is the media paints a somewhat scary picture, cherry picking month-over-month statistics instead of looking at the entire year in review. I thought I’d take the opportunity to recap what led to this shift and where we might be headed.
In May, we saw a 40% increase in homes for sale. For so many years, the lack of inventory was the central theme of the market, with inventory levels as low as a two-week supply in the first quarter of 2018. These constricted inventory levels led to huge price escalations from buyers competing in multiple offers. It was not uncommon to have 10 buyers fighting over one house, resulting in a sale price 20% over the list price. That type of price growth is unreasonable and the result of the extreme market conditions. In May, that changed as many sellers started to come to market. Suddenly, buyers had more choices and multiple offers started to wane. This phenomenon led to a decrease in month-over-month price appreciation.
It just so happened that the increase in inventory was accompanied by two other influential factors. We had an increase in interest rate, and the now-repealed “Seattle Head Tax” was passed on May 14th, 2018 by the Seattle City Council.
Interest rates had been hovering in the low 4%s during all of 2017 and even in the high 3%s in 2016. We started 2018 in the low 4%s, but by May the rate had jumped a half-point. Coupled with extreme price jumps from limited inventory, affordability became an issue for many buyers. This started bringing folks to the sidelines.
A large contributor to the growth in our real estate market over the past 6 years was our robust job market, and the employment growth of companies such as Amazon. The “Seattle Head Tax” that passed in mid-May, but then repealed on June 12th, 2018, was a huge threat to our thriving economy. The angst it created in our region about the future of Seattle’s job market was palpable, and had companies like Amazon making bold moves such as halting all current construction projects. Also, we were in the midst of Amazon’s HQ2 search, and the head tax had Seattle on the line in regards to remaining the home to the big employers that have fed our job growth and economic rise.
The combination of a 40% increase in new listings, a half-point rise in interest rates, and the month-long battle over the head tax created pause in our real estate market. With more selection, more expensive money, and the drama in the Seattle City Council, folks were unsure of where we were headed. This created confusion, and when people are not clear they are less likely to make decisions. In retrospect, it was the perfect storm. Like any storm, it changed the environment, and like a washed-out road, we had to find a new route.
The new route, while a bit bumpy and new to navigate, has been refreshing and necessary. For so many years, we have been begging for more inventory to help temper price growth and create more mobility in the market. From 2016 to 2017, we had 14% year-over-year growth in median price in both King and Snohomish counties. To put that in perspective, the average year-over-year appreciation rate over the last 19 years has been 6%. Home values growing at double-digit appreciation rates was unsustainable, and quite frankly not affordable. This balancing-out of the market is a healthy and more sustainable new route.
Year-to-date, Snohomish County’s median price has grown 10% over the previous year and King county, 9%. A large part of that growth happened in the first half of the year, and we have seen some month-over-month prices go down since, as the market starts to find some balance. The media loves to report these month-over-month numbers to create headlines, but buries the big picture of growth over the previous year and the fact that balance is healthy, in the last few paragraphs of any given article.
The mobility that this created has been a welcome change. People were not putting their homes up for sale because they feared the prospect of finding their next one, so they stayed put. The almost overnight increase in selection created a more comfortable environment for the seller who also had to buy their next home. We have even started to see home sale contingency offers come together as this market has started to balance out.
As we round out 2018, in Snohomish County we ended November with two months of inventory based on pending sales, and 2.4 months in King County. This is still a seller’s market, but not the extreme seller’s market that had only two weeks of inventory – and that is a good thing. A balanced market is when you hit four months of inventory, and we have a way to go to get there. Bear in mind that these measurements are of the entire county and do not take price points into consideration. We have seen inventory pile a little higher in the higher price points. The big news is that sellers are sitting on a ton of equity. In Snohomish County, we have seen a 62% increase in median price since 2012, and in King County, 66%. As long as sellers keep this in perspective and understand that pricing needs to reflect the inventory levels, they will find great success.
The opportunity to make a move-up, downsize, or even buy your first home is awesome right now. Selection is actually an option and interest rates are still historically low. Currently, we are hovering around 5%, and they have actually recently dropped. Rates are predicted to head toward the mid 5%s in 2019, making a purchase now very appealing.
If you are just curious about the value of your home in today’s market or you are considering a move in 2019, please reach out to any of our agents. We would be happy to relate the current market conditions to your investment and your goals. Education and awareness led to clarity, and when one is clear, they are empowered to make strong decisions. It is our mission to help educate our clients and assist them in making these big life decisions. Whatever your goals are in 2019, it is our honor to help keep you informed on all things real estate related.
5 Alternatives to a New Year’s Resolution

The pressure to come up with resolutions and improvements always mounts near the end of the year, but everyone knows that statistically speaking, most of us won’t stick to our New Year’s resolutions much past February. So rather than give in to societal pressure, guilt, and feelings of hopelessness, I propose a shift in perspective this year.
Rather than viewing the New Year as catalyst for sweeping lifestyle and character changes, let’s instead take this opportunity to renew our sense of purpose and determination. Here are five ideas to make some positive changes in a different way this year.
- Express Gratitude
“Gratitude can transform common days into thanksgivings, turn routine jobs into joy, and change ordinary opportunities into blessings.” -William Arthur Ward. You will be amazed at the ways your life will begin to change simply by expressing gratitude regularly. It will help you maintain a fresh perspective day in and day out, and will help to keep stress at bay. Make a list of all the things you are thankful for in your life, big and small. Take some time to really lean in to this list and reflect on each one. Especially focus on why you are thankful for each of those things.
- Create a list of things to look forward to
This goes hand-in-hand with gratitude. What are you looking forward to this year? A vacation, a family member getting married, a new restaurant opening, a new novel or a new season of your favorite show. By focusing on the good things coming your way, it will be easier to keep a positive and hope-filled attitude.
- Pick a word for the year
Before the year starts, take some time to look at the big picture of the coming year. Find the theme of what you would like to accomplish or focus on, and chose a theme word to guide you. This will give you clarity and focus. Maybe your word for the year is Intentional. Simplify. Peace. Discipline. Fun. When you have your theme word for the year, share it on oneword365.com
- Schedule a quarterly retreat
Life happens, and trying to balance work, family, social life, friends, and other commitments often results in very little time for you. Take some time before the new year starts and schedule yourself a quarterly one-day (or weekend!) retreat to focus on YOU. Remember, if you don’t take care of yourself, you won’t be able to take care of anyone else.
- Try a 30-day challenge
A 30-day challenge consists of setting a small goal that can be achieved in 30 days, as well as a small, specific action that you will take each day to achieve that goal. For example:
Declutter: every day for 30 days, choose 3 items to donate, sell, give away or throw away.
Random acts of kindness: every day for 30 days, perform a random act of kindness such as: leaving change in a vending machine; buying the coffee of the person behind you at Starbucks; send a thank you email to a coworker who deserves more recognition. Spreading kindness will always come back to you.
Happy New Year!
Where to Celebrate NYE

New Year’s Eve 2018 is almost upon us, and if you are still looking for something to do, read on! There are lots of options in the greater Seattle area, whether you are looking for the biggest blow-out bash or an earlier, family-friendly event.
There are actually two parties that will converge at midnight for the iconic Seattle fireworks show.
The Armory Stage will host rock band SWAY from 8pm until midnight. And at the International Fountain, you can dance the night away with live electronic music and video projection show (starts at 10pm). Tickets are required for both parties, however the big fireworks show is free to enjoy.
The Pacific Science Center transforms on NYE with fire sculptures, drinks and live music. There will be special entertainment throughout the night, as well as the standard Science Center exhibits. At midnight, head outside for the Space Needle fireworks. Purchase tickets in advance.
Watch the Seattle Center fireworks from under the glass of Chihuly Gardens. The evening includes appetizers, desserts, live music and a midnight toast. Purchase tickets in advance.
Another Seattle Center option, the Museum of Popular Culture offers four 21+ parties in one. With live music on three performance stages, comedians, party favors, special VIP areas, more than 20 bars, and a special singles-only cocktail hour, this is one of the largest parties of the year. Museum access is included in the price of the party, purchase tickets in advance.
- Tacoma’s First Night
First Night is an all-ages, family-friendly celebration in Downtown Tacoma’s Theater District. The affordable admission price includes museums, music, art, drama, dance, and a whole day and night of activities. The cost of entry increases as the festival gets closer, so buy early to save!
The perfect NYE celebration if you have older kids, this pajama party features comedians, balloon makers, pizza, snacks, and educational, hands-on activities throughout the night. The fun culminates at 9pm with a ball drop.
- New Year’s Eve with Ivar’s Salmon House
Ivar’s on Northlake will host live music, tasty food and view of the fireworks without the crowds. Advanced reservations are required, and will range in price depending on your selections.
Ring in the new year with the latest in R&B, Old School, Jazz and Hip Hop music. This is a 21+, semi-formal event, and hotel packages are available with your ticket purchase.
- Resolution New Year’s Eve Party at WAMU Theater
A Seattle tradition for almost a decade, this 18+ party always brings a mixed crowd together for a night of dancing. This is one of the biggest EDM parties of the year.
Celebrate the coming new year all day at KidsQuest! There are activities every hour from 10am to 4pm, including Bubble Wrap Stomp, New Year’s Hats, Storytime, glittery tattoos, and more. Admission is free with membership or museum admission.
