
 Facebook
 X
X
 Pinterest
 Copy Link
Quarterly Reports: Q1 2019 South Snohomish
Q1: January 1 – March 31, 2019
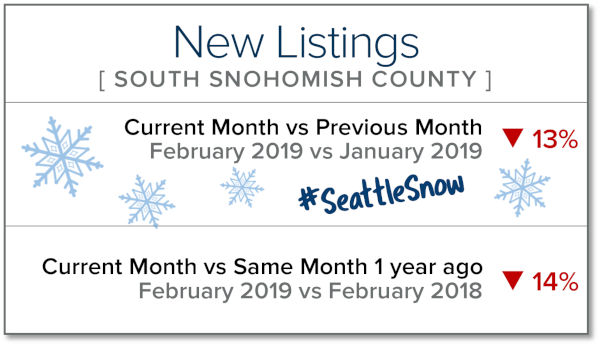
SOUTH SNOHOMISH COUNTY: Months of inventory was reduced as we finished out the first quarter of 2019. Months of inventory is the amount of months it would take to sell out of homes if no new listings came to market. This illustrates the balance between supply and demand. We peaked at 2.8 months in September of 2018 and found ourselves at 1 month this March.
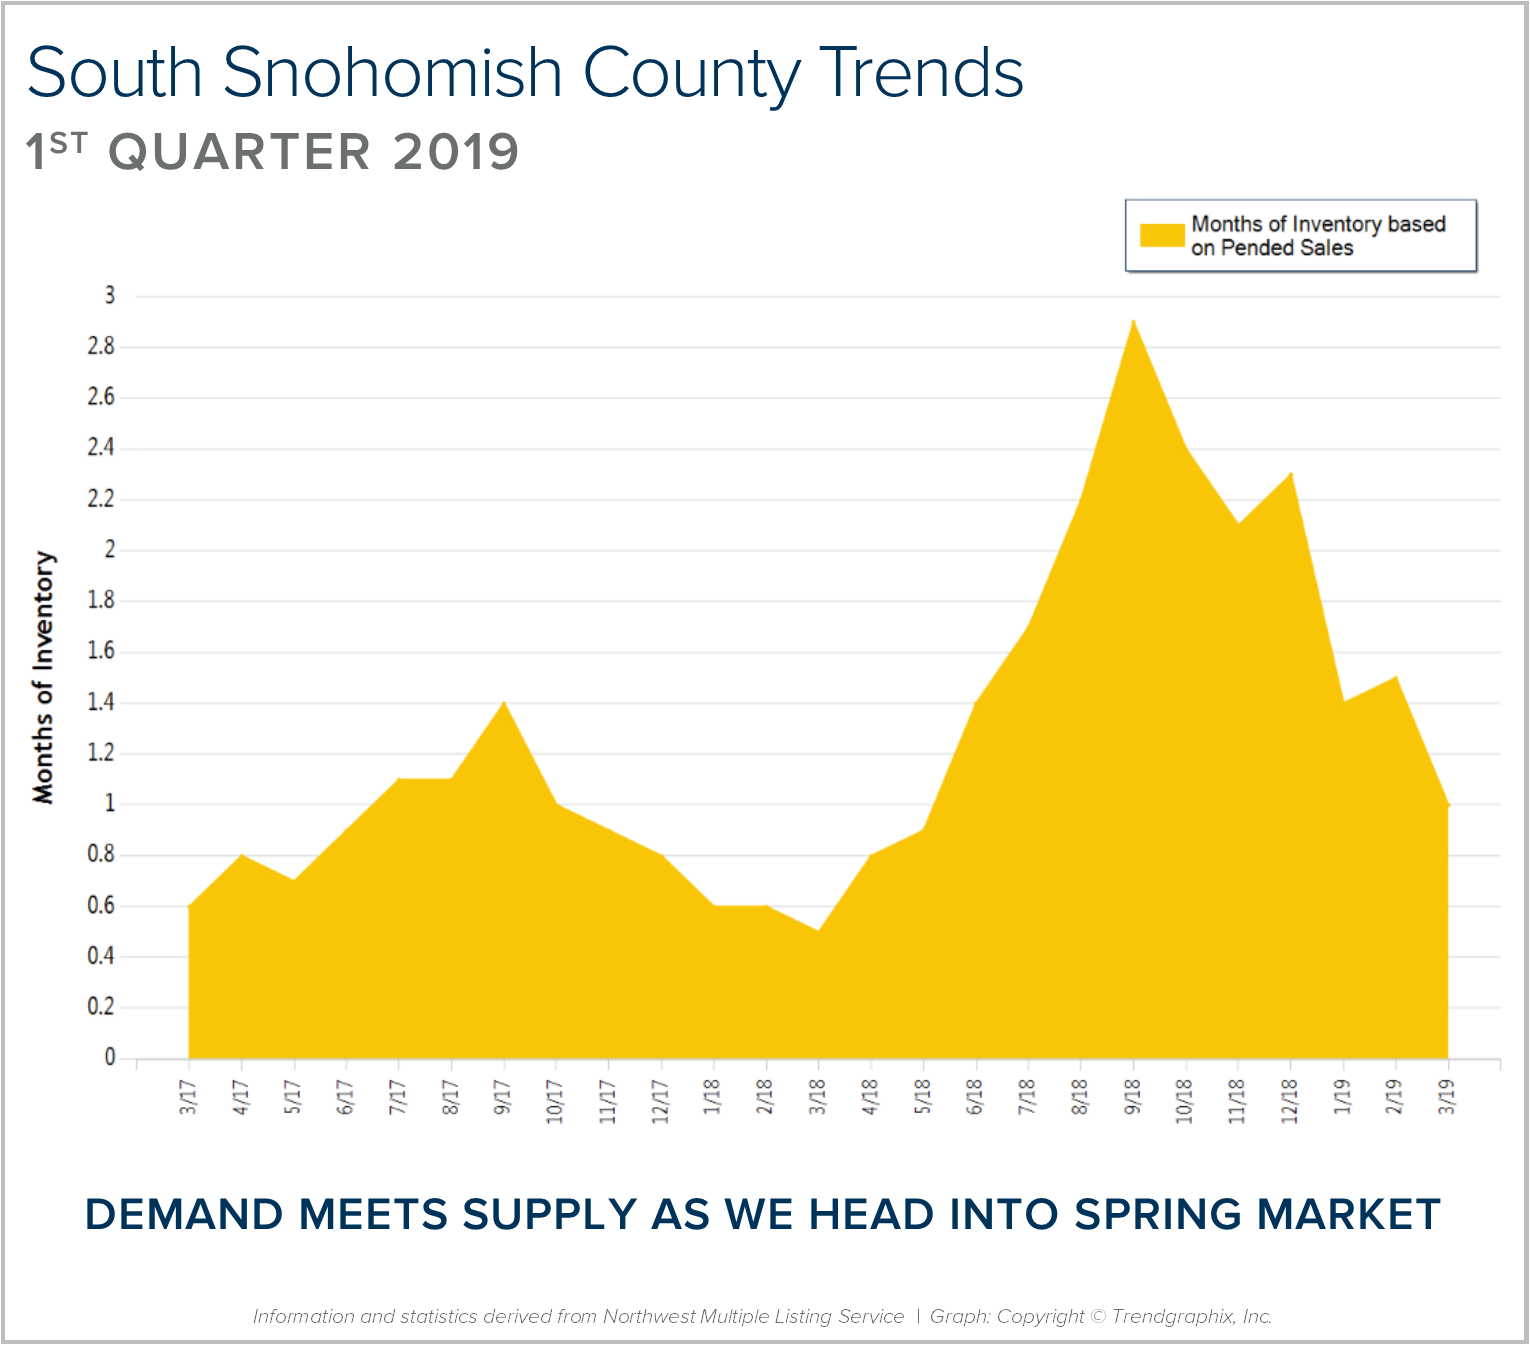 The first quarter of 2019 saw 1,708 new listings and 1,547 pending sales – demand tracked quite well with supply! It remains a seller’s market (0-3 months of inventory), but not as constricted of a market as last year, which saw an average of 0.6 months in the first quarter compared to 1.3 months this year. As we head into spring, we should see continued growth in new listings and demand will be strong, fueled by low interest rates and positive jobs reports.
The second half of 2018 had a large influx of homes that came to market, and an interest rate jump which created a gap between supply and demand. Buyers enjoyed some negotiations and credits in the fall and winter due to more selection, but as interest rates reduced in the first quarter, we saw demand increase. This is helping to absorb inventory and reduce the average days on market it takes to sell a home. Median price is up 6% complete year-over-year, which is still higher than the 4% norm, but much less than the unsustainable 15% gains from 2017 to 2018. This balancing out in the market has been a positive phenomenon as affordability has been a challenge for many. Both sellers and buyers are finding great opportunities in the current market.
This is only a snapshot of the trends in south Snohomish County; please contact us if you would like further explanation of how the latest trends relate to you.
Quarterly Reports: Q1 2019 North King County

Q1: January 1 – March 31, 2019
NORTH KING COUNTY: Months of inventory was reduced as we finished out the first quarter of 2019. Months of inventory is the amount of months it would take to sell out of homes if no new listings came to market. This illustrates the balance between supply and demand. We peaked at 2.5 months in November of 2018 and found ourselves at 1.2 month this March.
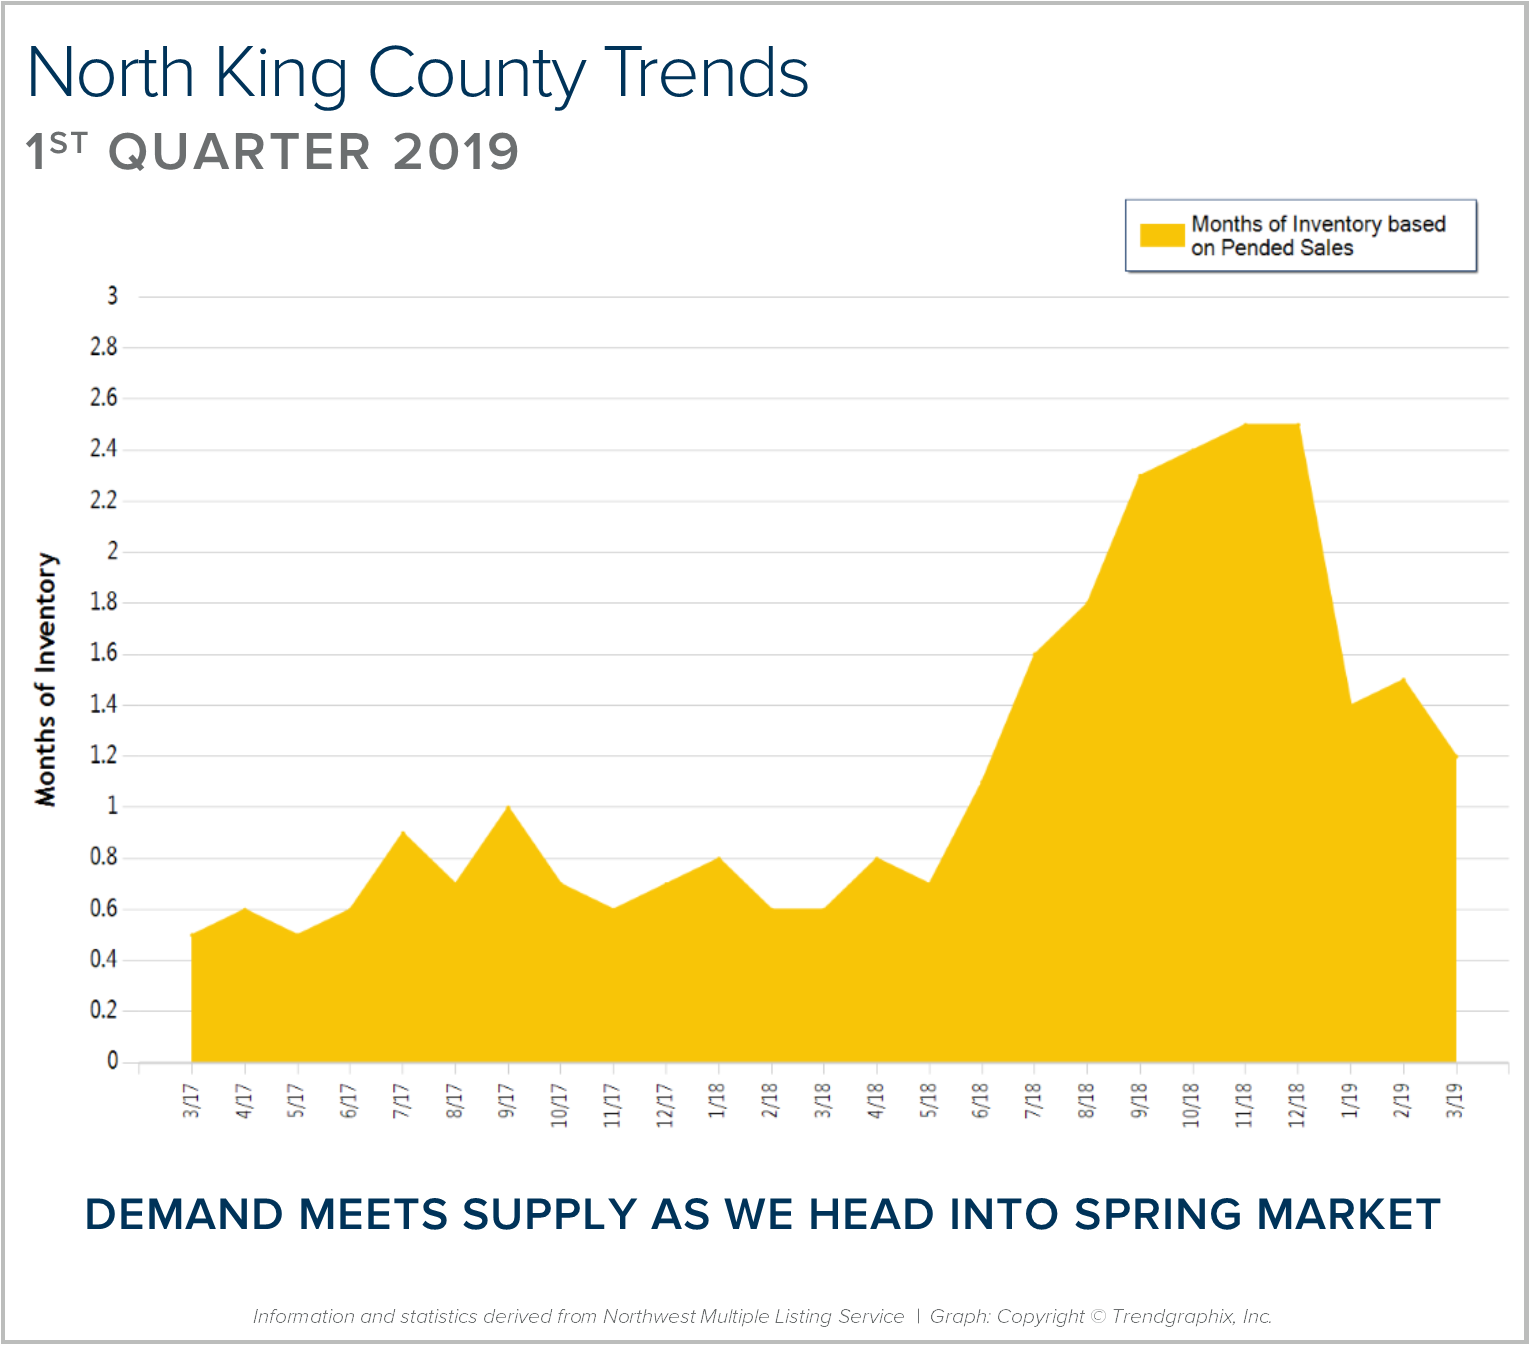 The first quarter of 2019 saw 1,667 new listings and 1,325 pending sales – demand tracked well with supply! It remains a seller’s market (0-3 months of inventory), but not as constricted of a market as last year, which saw an average of 0.7 months in the first quarter compared to 1.4 months this year. As we head into spring, we should see continued growth in new listings and demand will be strong, fueled by low interest rates and positive jobs reports.
The second half of 2018 had a large influx of homes that came to market, and an interest rate jump which created a gap between supply and demand. Buyers enjoyed some negotiations and credits in the fall and winter due to more selection, but as interest rates reduced in the first quarter, we saw demand increase. This is helping to absorb inventory and reduce the average days on market it takes to sell a home. Median price is up 6% complete year-over-year, which is still higher than the 4% norm, but much less than the unsustainable 14% gains from 2017 to 2018. This balancing out in the market has been a positive phenomenon as affordability has been a challenge for many. Both sellers and buyers are finding great opportunities in the current market.
This is only a snapshot of the trends in north King County; please contact us if you would like further explanation of how the latest trends relate to you.
Quarterly Reports: Q1 2019 Seattle Metro

Q1: January 1 – March 31, 2019
SEATTLE METRO: Months of inventory was reduced as we finished out the first quarter of 2019. Months of inventory is the amount of months it would take to sell out of homes if no new listings came to market. This illustrates the balance between supply and demand. We peaked at 2.5 months in November of 2018 and found ourselves at 1.2 month this March.
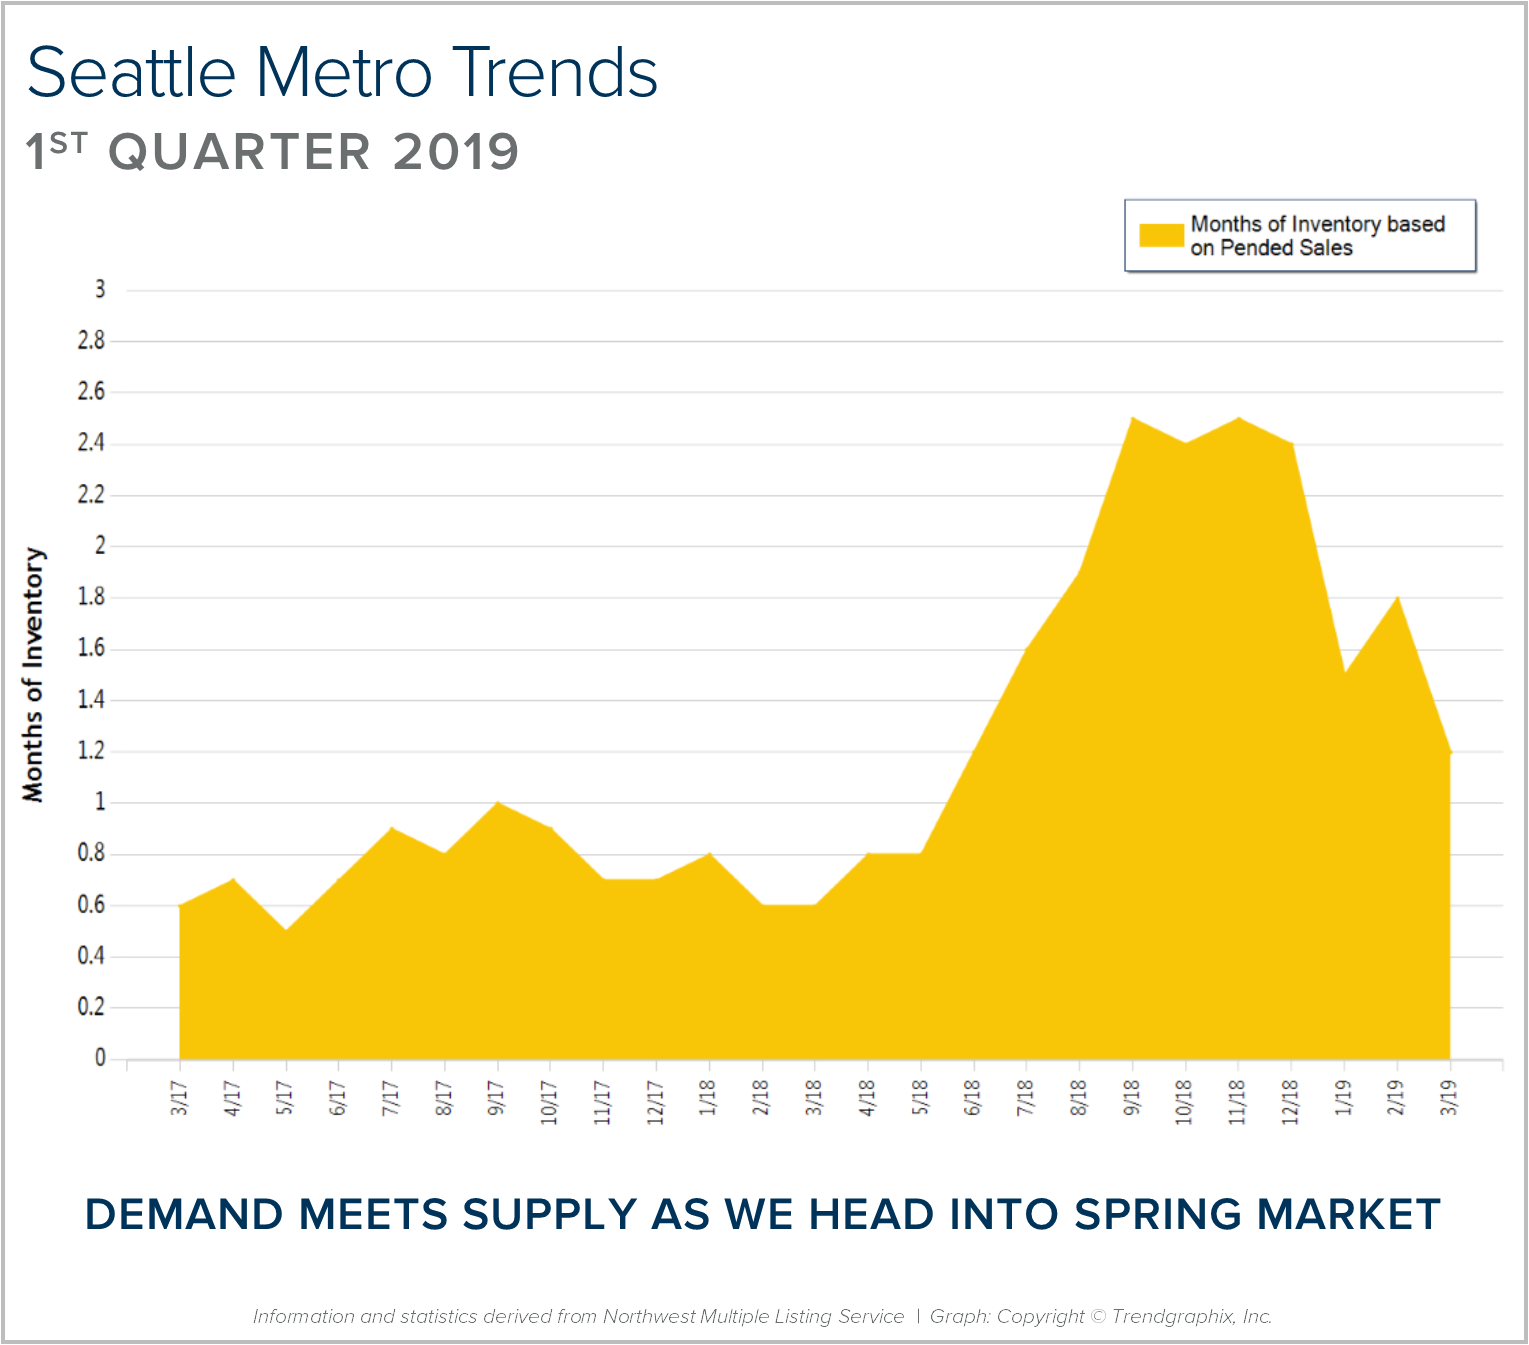 The first quarter of 2019 saw 2,456 new listings and 1,892 pending sales – demand tracked quite well with supply! It remains a seller’s market (0-3 months of inventory), but not as constricted of a market as last year, which saw an average of 0.7 months in the first quarter compared to 1.5 months this year. As we head into spring, we should see continued growth in new listings and demand will be strong, fueled by low interest rates and positive jobs reports.
The second half of 2018 had a large influx of homes that came to market, and an interest rate jump which created a gap between supply and demand. Buyers enjoyed some negotiations and credits in the fall and winter due to more selection, but as interest rates reduced in the first quarter, we saw demand increase. This is helping to absorb inventory and reduce the average days on market it takes to sell a home. Median price is up 5% complete year-over-year, which is still higher than the 4% norm, but much less than the unsustainable 16% gains from 2017 to 2018. This balancing out in the market has been a positive phenomenon as affordability has been a challenge for many. Both sellers and buyers are finding great opportunities in the current market.
This is only a snapshot of the trends in the Seattle Metro area; please contact us if you would like further explanation of how the latest trends relate to you.
Quarterly Reports: Q1 2019 Eastside

Q1: January 1 – March 31, 2019
EASTSIDE: Months of inventory has reduced as we finished out the first quarter of 2019. Months of inventory is the amount of months it would take to sell out of homes if no new listings came to market. This illustrates the balance between supply and demand. We peaked at 3.6 months in December of 2018 and found ourselves at 1.5 months this March.
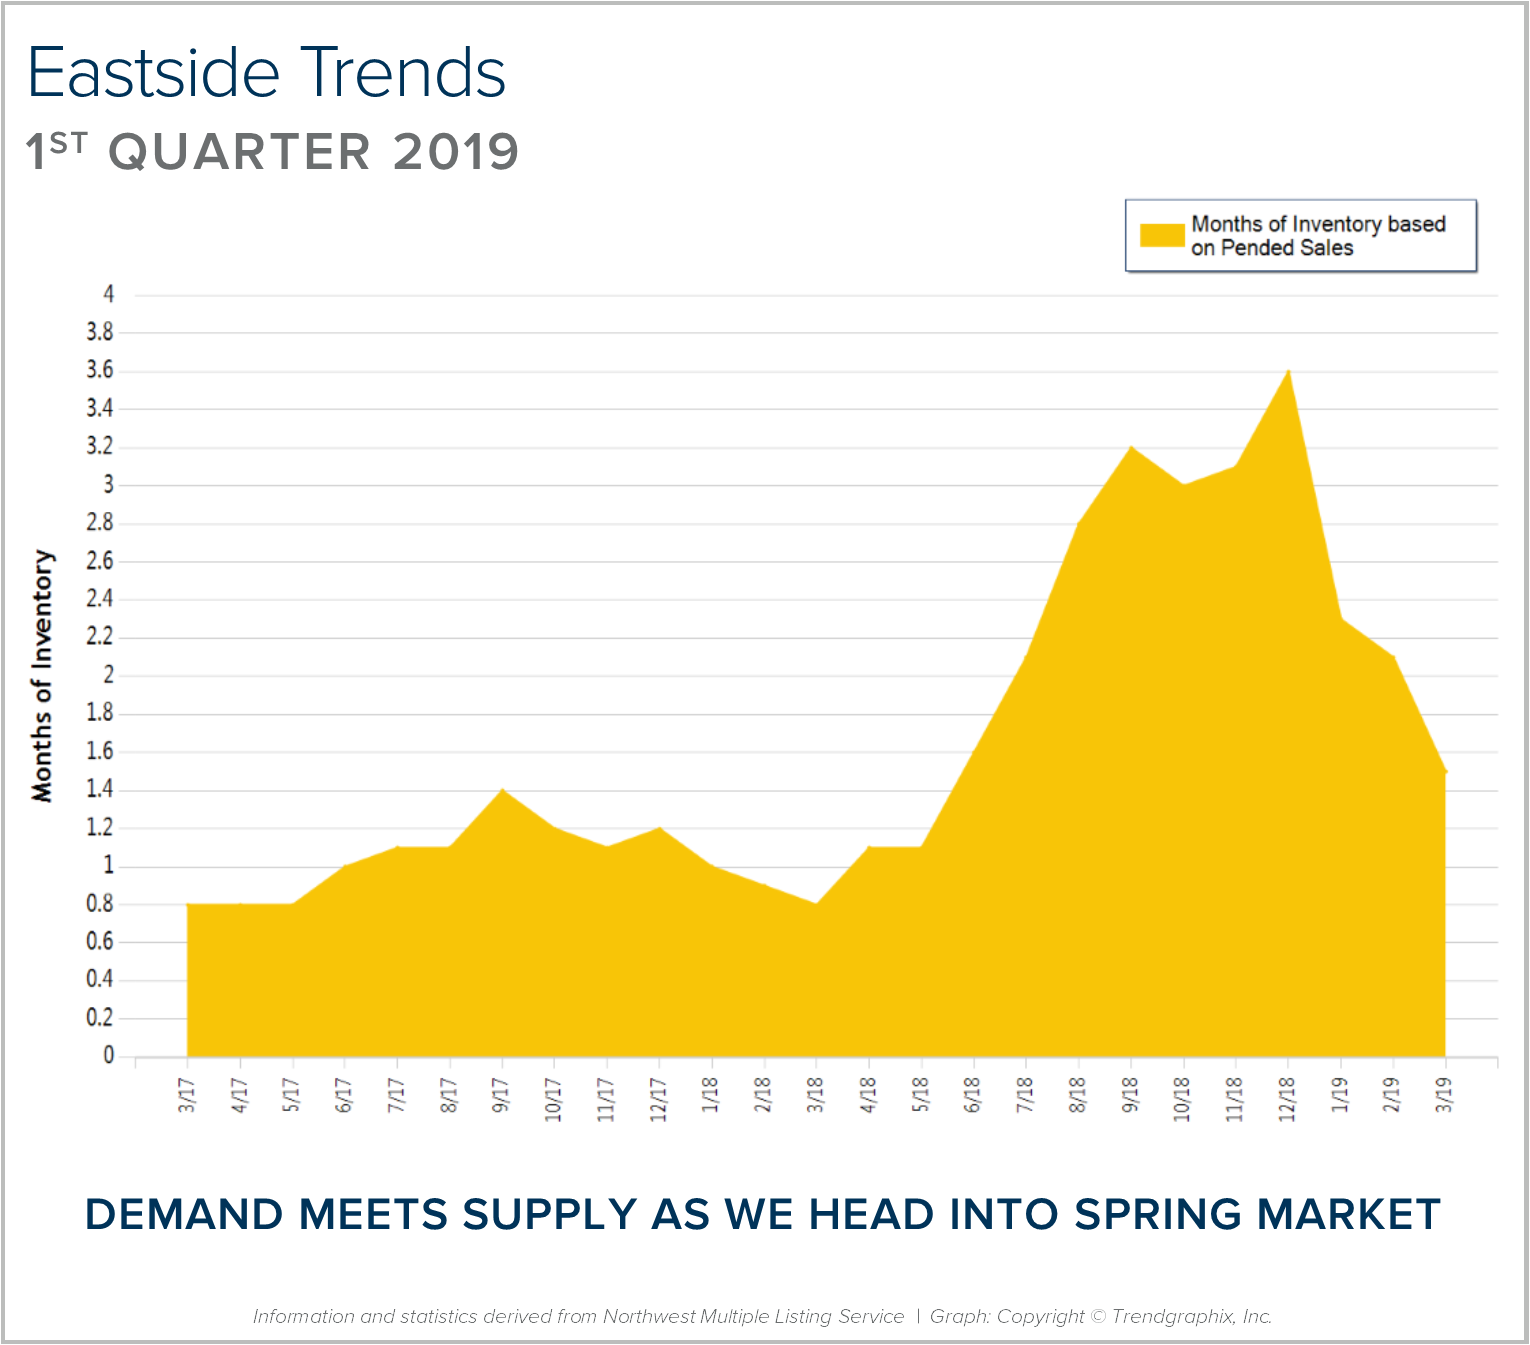 The first quarter of 2019 saw 2,304 new listings and 1,703 pending sales – demand tracked well with supply! It remains a seller’s market (0-3 months of inventory), but not as constricted of a market as last year, which saw an average of 0.9 months in the first quarter compared to 2 months this year. As we head into spring, we should see continued growth in new listings and demand will be strong, fueled by low interest rates and positive jobs reports.
The second half of 2018 had a large influx of homes that came to market, and an interest rate jump which created a gap between supply and demand. Buyers enjoyed some negotiations and credits in the fall and winter due to more selection, but as interest rates reduced in the first quarter, we saw demand increase. This is helping to absorb inventory and reduce the average days on market it takes to sell a home. Median price is up 6% complete year-over-year, which is still higher than the 4% norm, but much less than the unsustainable 14% gains from 2017 to 2018. This balancing out in the market has been a positive phenomenon as affordability has been a challenge for many. Both sellers and buyers are finding great opportunities in the current market.
This is only a snapshot of the trends on the Eastside; please contact US if you would like further explanation of how the latest trends relate to you.
Quarterly Reports: Q1 2019 North Snohomish County

Q1: January 1 – March 31, 2019
NORTH SNOHOMISH COUNTY: Months of inventory was reduced as we finished out the first quarter of 2019. Months of inventory is the amount of months it would take to sell out of homes if no new listings came to market. This illustrates the balance between supply and demand. We peaked at 2.5 months in September of 2018 and found ourselves at 0.9 month this March.
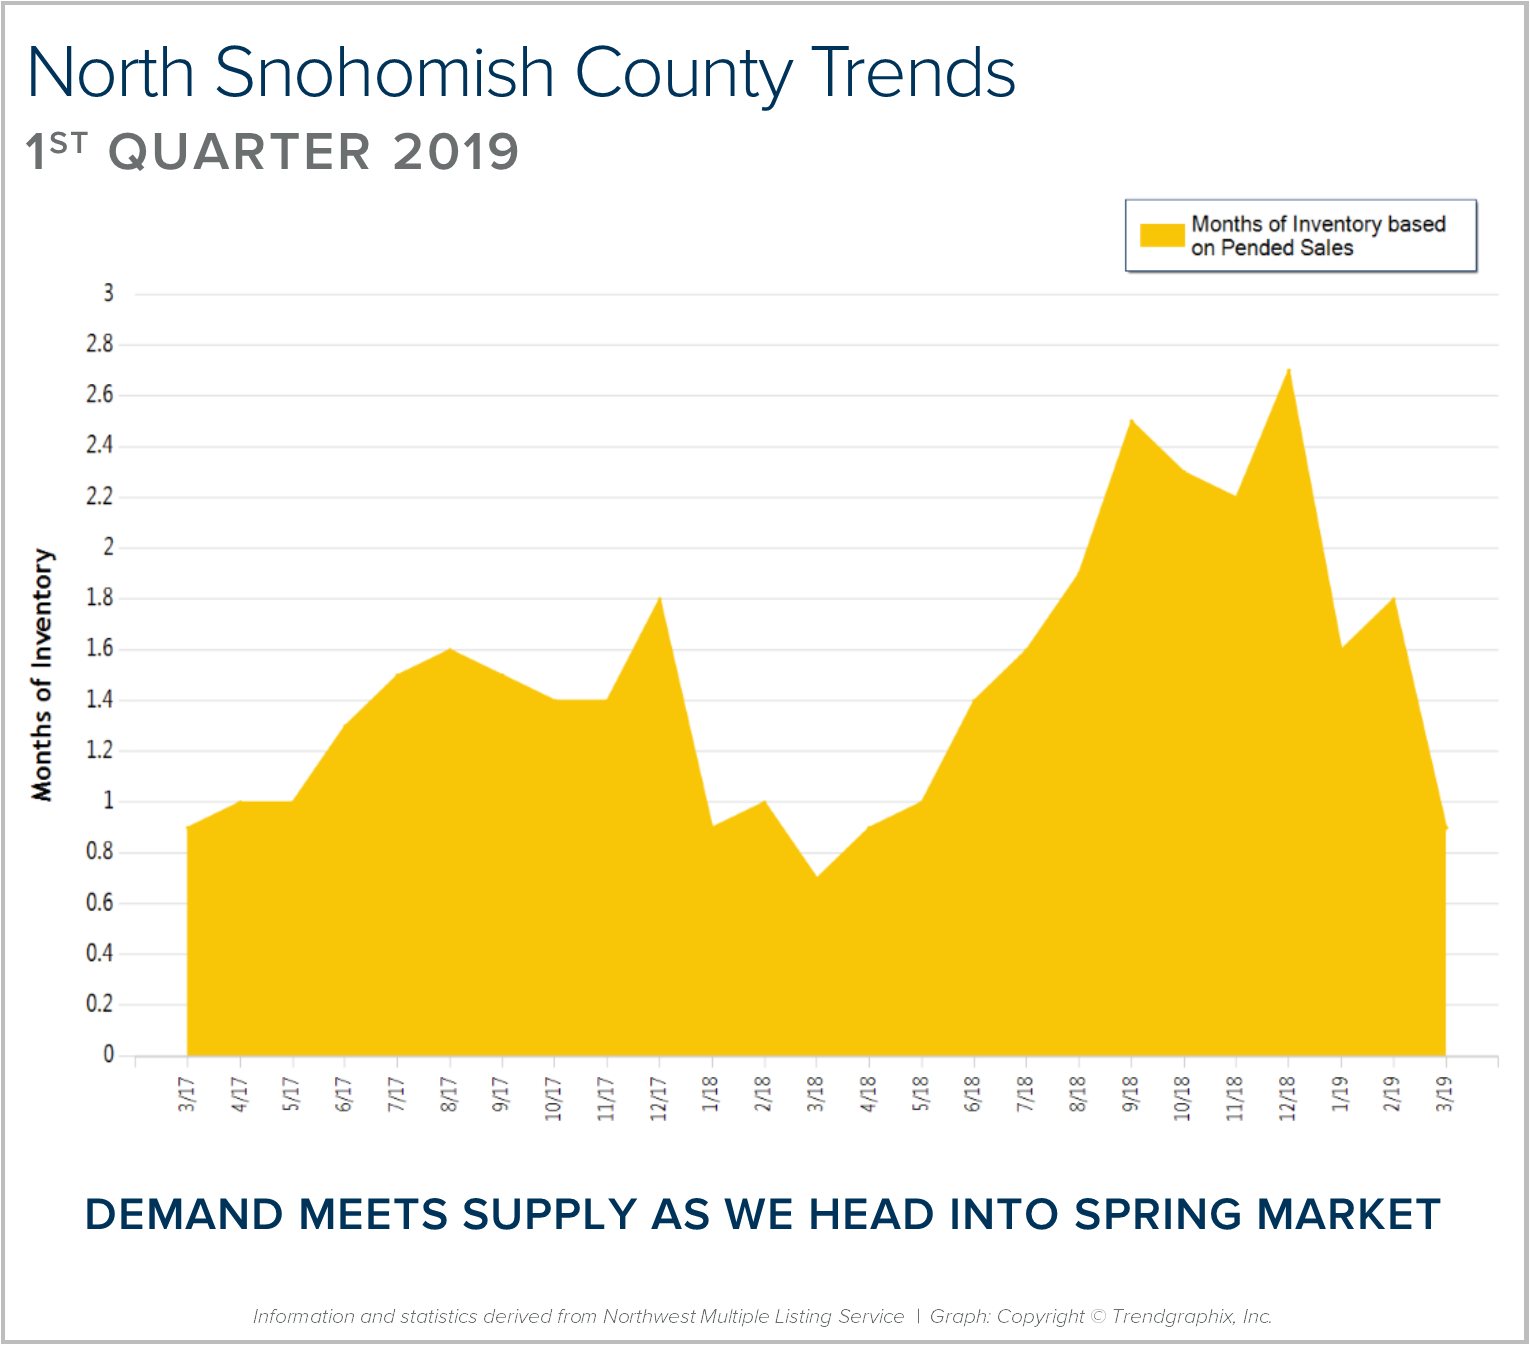 The first quarter of 2019 saw 934 new listings and 921 pending sales – demand tracked quite well with supply! It remains a seller’s market (0-3 months of inventory), but not as constricted of a market as last year, which saw an average of 0.9 months in the first quarter compared to 1.4 months this year. As we head into spring, we should see continued growth in new listings and demand will be strong, fueled by low interest rates and positive jobs reports.
The second half of 2018 had a large influx of homes that came to market, and an interest rate jump which created a gap between supply and demand. Buyers enjoyed some negotiations and credits in the fall and winter due to more selection, but as interest rates reduced in the first quarter, we saw demand increase. This is helping to absorb inventory and reduce the average days on market it takes to sell a home. Median price is up 9% complete year-over-year, which is higher than the 4% norm, but much less than the unsustainable 12% gains from 2017 to 2018. This balancing out in the market has been a positive phenomenon as affordability has been a challenge for many. Both sellers and buyers are finding great opportunities in the current market.
This is only a snapshot of the trends in north Snohomish County; please contact us if you would like further explanation of how the latest trends relate to you.
Quarterly Reports: Q1 2019 South King County

Q1: January 1 – March 31, 2019
SOUTH KING COUNTY: Months of inventory was reduced as we finished out the first quarter of 2019. Months of inventory is the amount of months it would take to sell out of homes if no new listings came to market. This illustrates the balance between supply and demand. We peaked at 2.9 months in September of 2018 and found ourselves at 1.2 months this March.
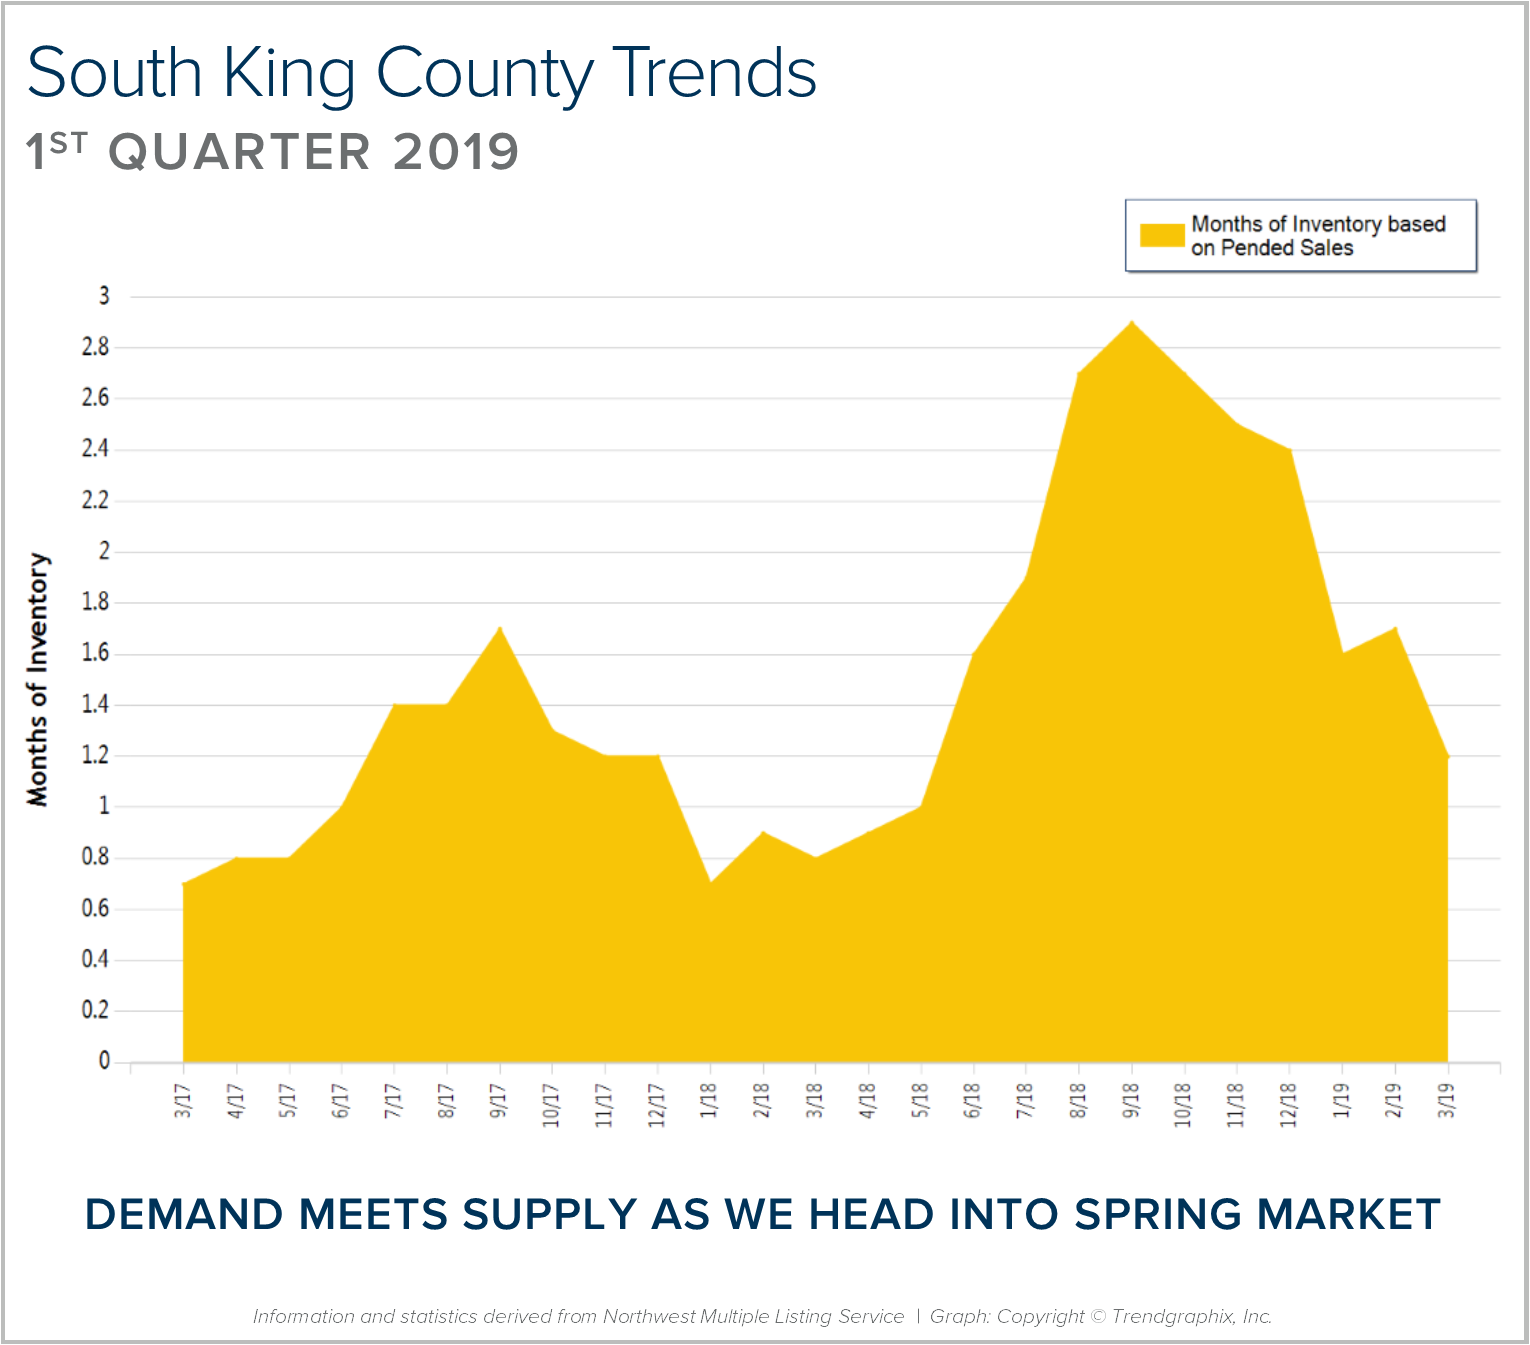 The first quarter of 2019 saw 2,306 new listings and 2,096 pending sales – demand tracked with supply quite well! It remains a seller’s market (0-3 months of inventory), but not as constricted of a market as last year, which saw an average of 0.8 months in the first quarter compared to 1.5 months this year. As we head into spring, we should see continued growth in new listings and demand will be strong, fueled by low interest rates and positive jobs reports.
The second half of 2018 had a large influx of homes that came to market, and an interest rate jump which created a gap between supply and demand. Buyers enjoyed some negotiations and credits in the fall and winter due to more selection, but as interest rates reduced in the first quarter, we saw demand increase. This is helping to absorb inventory and reduce the average days on market it takes to sell a home. Median price is up 7% complete year-over-year, which is still higher than the 4% norm, but much less than the unsustainable 12% gains from 2017 to 2018. This balancing out in the market has been a positive phenomenon as affordability has been a challenge for many. Both sellers and buyers are finding great opportunities in the current market.
This is only a snapshot of the trends in south King County; please contact us if you would like further explanation of how the latest trends relate to you.
Consulting your trusted advisor vs following the media


Spring is in the air! The bulbs are starting to poke out of the ground and we recently hit 70 degrees in the Greater Seattle area. This is the time of year, due to weather and the end of the school year approaching, that the local real estate market starts to take off with activity. Not only is the sun thawing out gardens and backyard patios, helping to ready homes for market, but interest rates are continuing to fall, providing a heyday for buyers and sellers.
Spring is the time of year we see more homes come to market providing more selection for buyers. This is what we call our peak season. This spring, however, is especially meaningful due to the recent decrease in interest rates. Seasonality naturally brings more activity, but 2019 has started out with a downward trajectory in regards to interest rates, which has been a welcome shift after watching rates increase by almost an entire point over the course of 2018.
According to Ycharts.com, as of March 14th the US 30-year mortgage rate is at 4.31%, compared to 4.41% the week prior and 4.46% last year. This is quite a bit lower than the long term average of 8.07%. Additionally, rates are now over half a point lower than they were just four months ago, which gives buyers 5% more buying power. Meaning they can increase their price range by 5% and keep the same mortgage payment.
We are beginning to see a ton of activity at open houses, market times are starting to shrink, and multiple offers are popping up again. Demand is on the rise, with first-time home buyers out in full-force along with move-up and down-size buyers all going after the same inventory. Price appreciation will start to happen again month-over-month as the tulips start to open and veggie gardens start sprouting.
This assessment is not only factual and researched, it is anecdotal. You see, statistics are only reported monthly from the NWMLS, so the stories from the streets tell the real story of where we have been, what’s happening now, and where we are headed in the real estate market. My daily engagement with the market, either helping buyers or sellers, researching values, showing properties, negotiating contracts, and working on inspections and appraisals helps me to be informed of the trends before they are even reported.
Around the third of each month, the NWMLS distributes a press release to the media reporting the previous month’s statistics. The media grabs the numbers that are most exciting to them to craft a story around. They create headlines to entice readership, which in turn sells advertising. The problem is that these news stories often only tell part of the story.
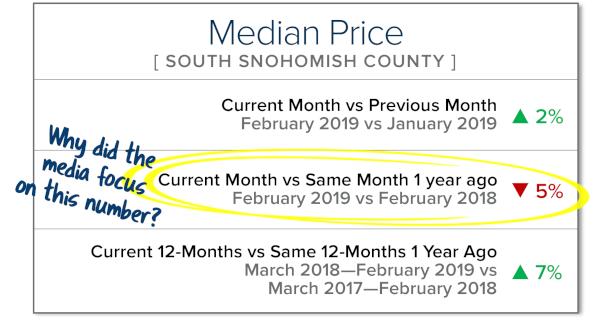
A classic example of cherry picked statistics used to create a headline came earlier this month. The Seattle Times reported in a sub-headline that Snohomish County home prices were falling at their fastest rate in seven years. This is simply not the whole truth. This is a common tactic of the media often only using month-over-month numbers (comparing the current month to the same month a year ago) versus a complete year-over-year analysis. Real estate is a long-term investment, and month-over-month numbers tend to provide more of a snapshot rather than a longer-term analysis of data and what influenced it.
We need to look at the data from all angles. Where were we a year ago, what has happened over the course of the last year in comparison to the previous year, and what happened this month compared to last month? Real-time experiences matter too, as the market changes weekly and even daily. Interactions throughout the month help me understand what opportunities the current environment will provide before the ink even dries on the media release. All of this helps us understand where we have come from and where we are headed. Couple that with front-line, daily experiences, and your trusted advisor can help you determine how all of this relates to your bottom line much more effectively than an article in the newspaper.
Another important factor to consider is that the bulk of the statistics reported in that monthly NWMLS press release are based on closed sales. While closed sales are very important, we must also closely track pending sales activity (homes currently under contract). Closed sales show where we have been and pending sales indicate where we are headed. February was a misleading month because of Snowmageddon. It halted new inventory reaching the market and kept buyers at home. The second half of February once the roads were cleared, had buyers lined up. Many of those buyers are anxiously waiting for that seasonal surge in inventory as we head into spring. This is indicated by conversations being had at open houses and one-on-one encounters with clients. Buyers want to take advantage of these surprisingly low interest rates now and sellers are enjoying the audience they are providing.
Unfortunately, the media is the initial source of information, and sometimes the only source a consumer considers when making such big decisions. I can’t tell you how often I encounter people that are grossly misled by alarming headlines and bite-sized bits of media when it comes to their largest asset, or the consideration of entering into home ownership.
Supply and demand illustrates where we are at in the market, and factors such as interest rates, the local and global economy, and simple things like weather and consumer mindset drive the market. Consumer mindset is influenced by the media. Take it a step further and make sure you are aligned with a professional who is committed to tracking all of this and can help explain how it all relates to you. Everyone has their own goals and their own concerns; it is the analysis of a well-researched trusted advisor that can help you navigate these meaningful financial decisions. It is our goal to provide our clients with the most up-to-date information to help empower strong decisions. If you are curious how this all relates to you, please reach out. We would be happy to connect you with agent who can discuss and help educate.
Is it better to rent or own?

The current break-even horizon* in the
Seattle Metro area is 1.69 years!
*The amount of time you need to own your home in order for owning to be a superior financial decision.
With expensive rental rates, historically low interest rates, and home prices softening, there are advantages to buying versus renting.
In fact, the Seattle Metro area has seen some of the sharpest rent hikes in the country over the last few years! There are several factors to consider that will lead you to make the best decision for your lifestyle and your financial bottom line. Zillow Research® has determined the break-even point for renting versus buying in our metro area. In other words, the amount of time you need to own your home in order for owning to be a superior financial decision. Currently in Seattle, the break-even point is 1.69 years – that is quick! What is so great about every month that ticks away thereafter, is that your nest egg is building in value.
I am happy to help you or someone you know assess your options; please contact me anytime.
These assumptions are based on a home buyer purchasing a home with a 30-year, fixed-rate mortgage and a 20 percent down payment; and a renter earning five percent annually on investments in the stock market.
Read the full article on the Zillow Research website here
Zillow Research® is a trademark of Zillow, Inc.
Monthly Newsletter – February 2019


Most recently, we have experienced an uptick in market activity. In fact, in King and Snohomish counties we saw a 53% increase in pending sales from December to January. While it is seasonally normal to see activity increase at the first of the year, it was 16% higher than the previous January. This increase is being driven by multiple factors, such as our thriving economy and job market, price acceleration softening, and the recent decrease in interest rates.
Currently, rates are as low as 4.5% for a 30-year fixed conventional mortgage – 0.75 points down from the fourth quarter of 2018. In fact, the interest rate in November was the highest we’ve seen in five years! The current rate level is the lowest we have seen in a year. This is meaningful because the rule of thumb is that for every one-point increase in interest rate, a buyer loses ten percent in purchase power. For example, if a buyer is shopping for a $500,000 home and the rate increases by a point during their search, in order to keep the same monthly payment, the buyer would need to decrease their purchase price to $450,000. Conversely, for every decrease in interest rate, a buyer can increase their purchase price and keep the same monthly mortgage payment.
Why is this important to pay attention to? Affordability! If you take the scenario I just described and apply it to the link above, you can see that the folks who choose to jump into the market this year will enjoy an interest cost savings when securing their mortgage. This lasts the entire life of the loan and can have a huge impact on the monthly cash flow of a household. This cost savings is also coupled with a slow-down in home-price appreciation. Complete year-over-year, prices are up around 8% in both King and Snohomish counties, but note that from 2017 to 2018 we saw a 14% increase. Price appreciation is adjusting to more normal levels and is predicted to increase 4-6% in 2019 over 2018.
As we head into spring market, the time of year we see the most inventory become available, the interest rates will have a positive influence on both buyers and sellers. Naturally, buyers will enjoy the cost savings, but sellers will enjoy a larger buyer pool looking at their homes due to the demand the lower rates are creating. Further, would-be sellers who are also buyers that secured a rate as low as 3.75% via a purchase or re-finance in 2015-2017, will consider giving up that lower rate for the right move-up house now that rates are not as big of a jump up as they were during the second half of 2018.
This recent decrease in rate is making the move-up market come alive. What is great about this, is that it opens up inventory for the first-time buyer and helps complete the market cycle. First-time buyers are abundant right now as the Millennial generation is gaining in age and making big life transitions such as buying real estate. According to Nerd Wallet, 49% of all Millennials have a home purchase in their 5-year plan.
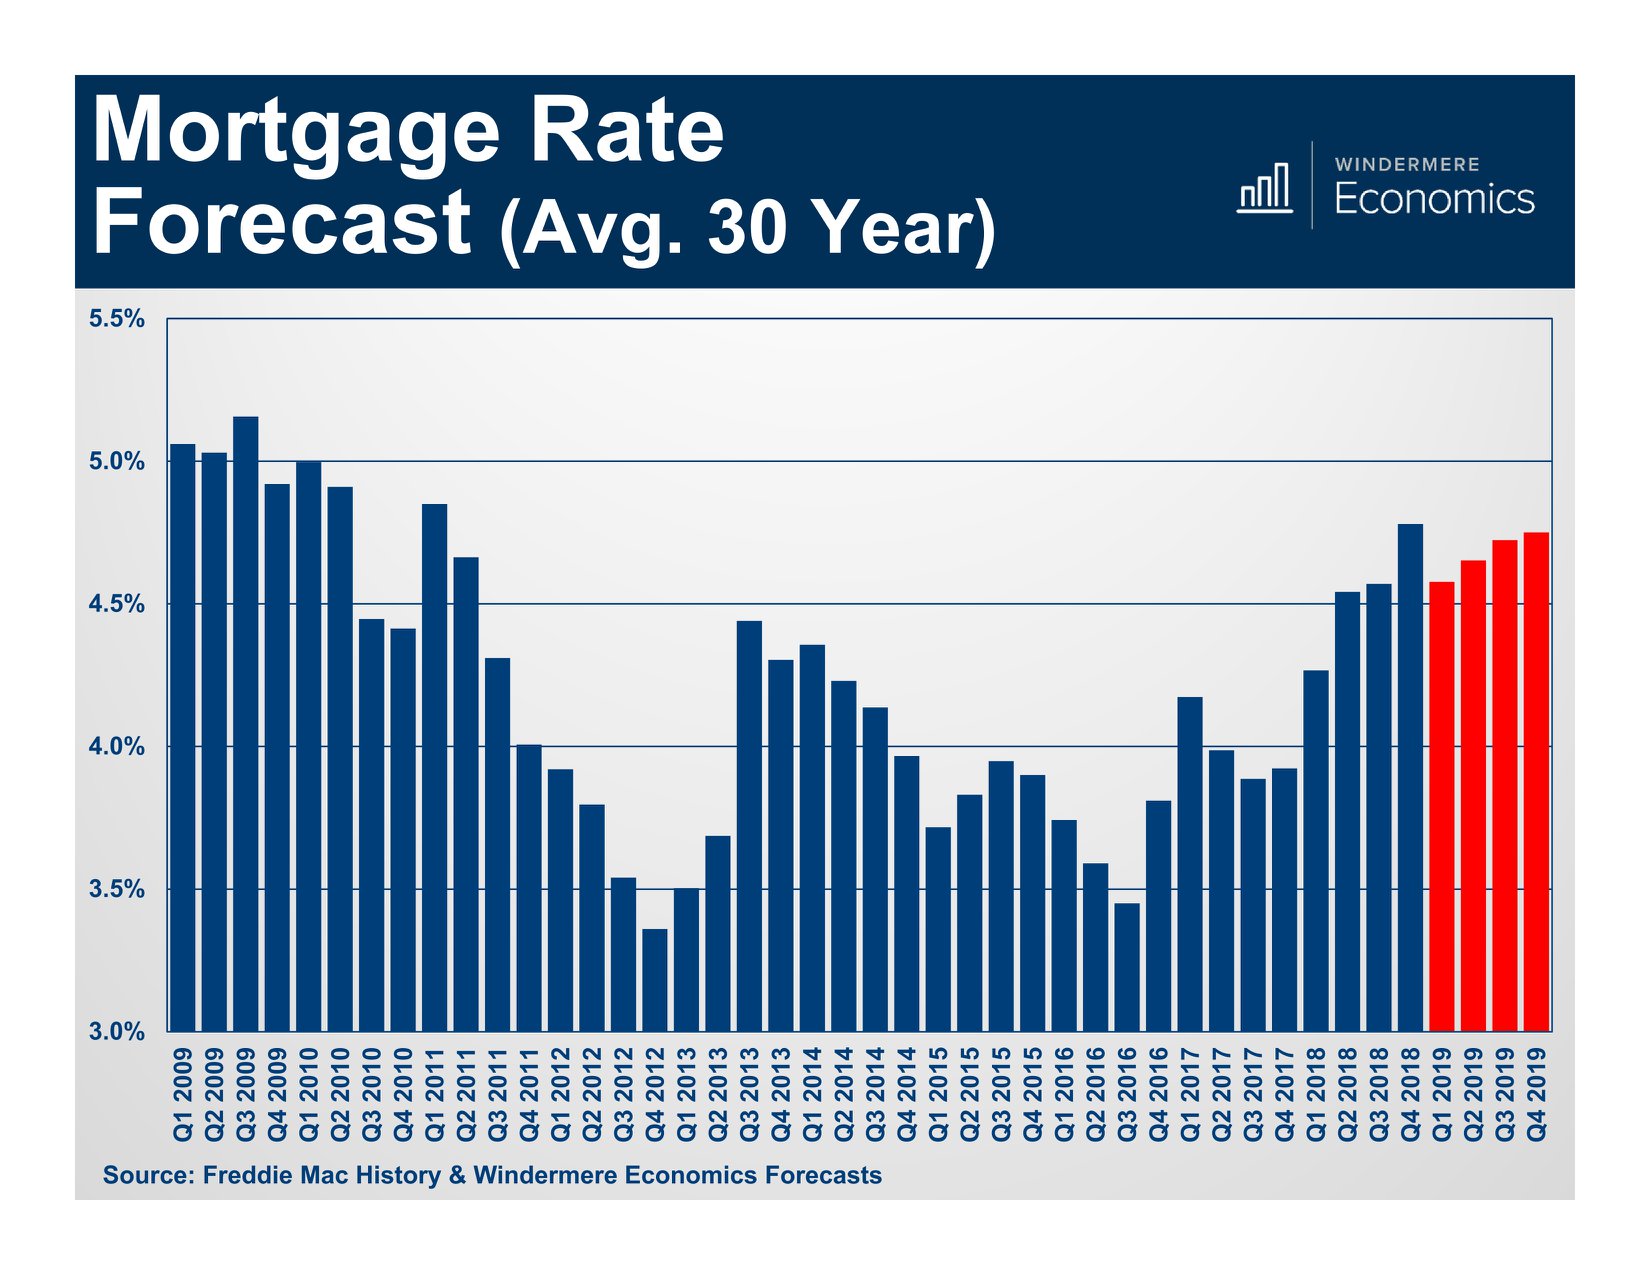 Will these rates last forever? Simply put, no! According to Matthew Gardner, Windermere’s Chief Economist, rates should increase into the mid-to-high 4’s in 2019. While still staying well below the 30-year average of 6.85%, increases are increases, and securing today’s rate could be hugely beneficial from a cost-saving perspective. Just like the 1980’s when folks were securing mortgages at 18%, the people that lock down on a rate from today will be telling these stories to their grandchildren. Note the 30-year average – it is reasonable to think that rates closer to that must be in our future at some point.
So what does this mean for you? If you have considered making a move, or even your first purchase, today’s rates are a huge plus in helping make that transition more affordable. If you are a seller, bear in mind that today’s interest rate market is creating strong buyer demand, providing a healthy buyer pool for your home. As a homeowner who has no intention to make a move, now might be the time to consider a refinance. What is so exciting about these refinances, is that it is not only possible to reduce your monthly payment, but also your term, depending on which rate you would be coming down from.
If you would like additional information on how today’s interest rates pertain to your housing goals, please contact me. I would be happy to educate you on homes that are available, do a market analysis on your current home, and/or put you in touch with a reputable mortgage professional to help you crunch numbers. Real estate success is rooted in being accurately informed, and it is my goal to help empower you to make sound decisions for you and your family.

Celebrate Earth Day with us! Bring all your sensitive documents to be professionally destroyed on-site by Confidential Data Disposal. Limit 20 file boxes per customer.
We will also be collecting non-perishable food and cash donations to benefit Concern for Neighbors Food Bank. Donations are not required, but are appreciated.
Saturday, April 20th, 10am – 2pm.
4211 Alderwood Mall Blvd, Lynnwood 98036
*This is a shredding-only event. Only paper will be accepted – no electronics or recyclables.
Get a Jump on Spring Cleaning

Whether you hire an outside professional for help, or tackle the project yourself, now is a great time to get a jump on spring cleaning. Many people wait for warmer temps to start cleaning, but I think most everyone can agree that those weekends would be better spent outdoors, soaking up that sun. So, take some inspiration from the list below to get you started now on freshening up your home for spring.
It will only take a few hours to check everything off this list, and you’ll feel so much better enjoying the last few weeks of winter, knowing that when the warmer weather finally comes, you can get outside and really enjoy it!
Rotate your mattress. Most mattresses need to be rotated regularly in order to even out the overall wear and prolong the lifespan of your bed. However, keep in mind that Sleep Number and Tempur-Pedic mattresses typically should not be rotated. Always check with your manufacturer for their recommendations on your specific mattress. If you own an older mattress with no pillowtop, it should probably be flipped as well as rotated.
Clean your mattress. Strip the mattress of all linens and covers. Start by vacuuming the mattress with the upholstery attachment, paying close attention to crevices and seams. Next, sprinkle baking soda (up to a one-pound box) all over the surface of your mattress. Let this sit for at least an hour, but 24 hours is best. Then go back over your mattress with your vacuum’s upholstery attachment again. If you have a steam cleaner, break it out and go over your whole mattress. The steam will reach further into the mattress than your vacuum is able to, and kills dust mites. *It is generally not recommended to clean memory foam with a steam cleaner.
Organize & clean the laundry room. Clean the outside of your washer and dryer; scrape any dried detergent from crevices. Next, clean the inside of the washing machine. Most newer models have a self-cleaning cycle. If you have an older machine that does not have a self-cleaning cycle, run a cycle with hot water and a quart of white vinegar. After it is finished, clean the detergent dispensers, using a vinegar and water solution and a scrubber. If you have a front-loader, be sure to clean the rubber seal on the door. This area is prone to mold growth, so use an all-purpose cleaner or maybe even bleach to get under and around the seal.
Next, organize a bit. Throw away products you never use, replace damaged sorting bins, and don’t forget to clean out the dryer vent to prevent a fire.
Deep clean the fridge. Twice a year (or more), you should give your fridge a front-to-back, top-down scrubbing. Start by taking everything out and throw away anything that has expired. Next, remove all the shelves and drawers. Put them to soak in a solution of two tablespoons baking soda and one-quart hot water. While they are soaking, wipe down the interior of the fridge with the same solution. Then scrub, rinse and dry the shelves and drawers.
Next, dry the drip pan. Remove the base grill, and pull out the drip pan. If it’s full of water, mop it with paper towels and wash the pan with soapy water. If your drop pan is fixed in place, wrap a cloth around the head of a long-handled brush and use to clean the pan.
Don’t forget the coils. In order to keep your refrigerator running efficiently, unplug it, pull it away from the wall, and use a coil brush or your vacuum’s crevice attachment to clean the condenser coils. This should be done at least twice a year, unless you have pets in the home, and then you should do this three to four times a year.
Clean out spice cabinet. Throw away all expired spices and seasonings. Not only do these lose taste, they actually harbor mold and bacteria.
Clean out expired medications & vitamins If you have unused medications, please take them to your local pharmacy for proper disposal.
Vacuum, wash, or steam window curtains
Wash window blinds
Add color to your table. Treat yourself to fresh flowers while waiting for the spring blooms outside.
And if you’re ready to get some deep cleaning done, check out this blog for the Ultimate Spring Cleaning Checklist.
