Cost vs. Value
 We are commonly asked which improvements sellers should make to get the greatest return on their home sale. Every year The Remodeling 2018 Cost vs. Value Report (www.costvsvalue.com) compiles all the information and analyzes the estimated percentage return on home improvements in each region. Getting a home prepared for market requires a keen eye and great resources. To access the entire Cost vs. Value report please visit www.costvsvalue.com and follow the steps to locate the Seattle area report.
Complete data from the Remodeling 2018 Cost vs. Value Report can be downloaded free at www.costvsvalue.com
© Hanley Wood Media Inc.
Quarterly Market Trends: Eastside
Q4 2017
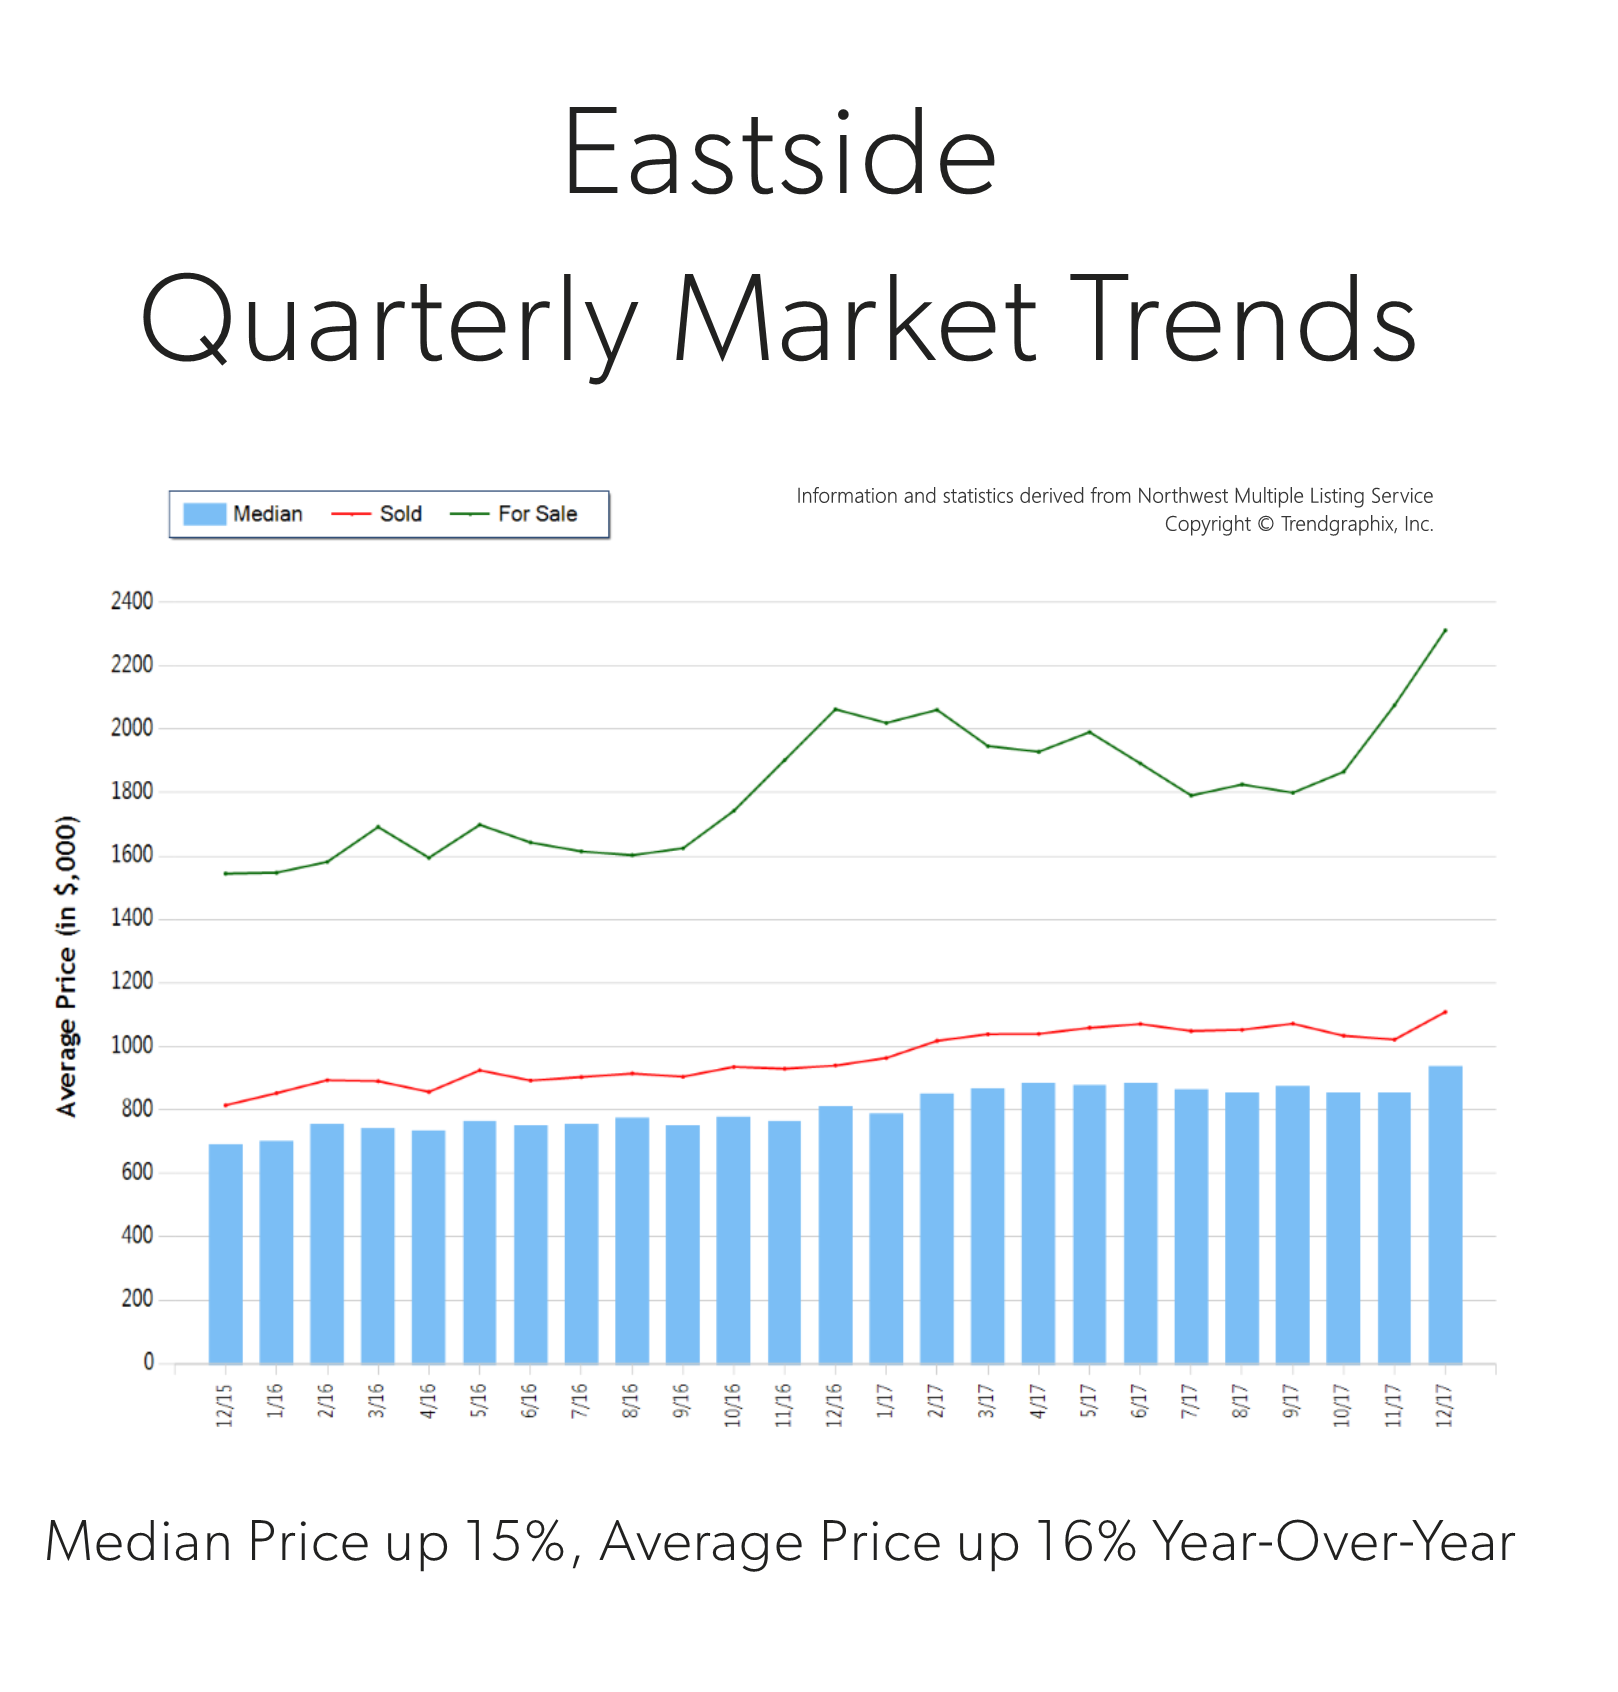
 Price growth was particularly strong in 2017! Median was up 15% and average price up 16% over 2016. Median price in 2017 landed at $865,000 and the average at $1,049,000. The average amount of days it took to sell a house in 2017 was 24 days, which is 17% faster than 2016. The average list-to-sale price ratio over the last year was 101%, with the spring months as high as 103%! In 2017, inventory growth continued to be a challenge, with a 4% decrease in new listings compared to 2016. Even with inventory limitations there were a near equal amount of sales! This phenomenon illustrates strong buyer demand and a need for more listings.
Demand for Eastside real estate has grown due to close proximity to job centers, great schools and quality of life. Over the last year, the Eastside was 70% more expensive than south Snohomish County and 22% over Seattle Metro. Historically low interest rates continue to drive the market as well, they have helped offset the increase in prices. Sellers are enjoying great returns due to this phenomenon and buyers are securing mortgages with minor debt service.
This is only a snapshot of the trends on the Eastside area; please contact us if you would like further explanation of how the latest trends relate to you.
Quarterly Market Trends: North King County

Q4 2017
 Price growth was particularly strong in 2017! Median and average prices were up 14% over 2016. Median price in 2017 landed at $715,000 and the average at $787,000. The average amount of days it took to sell a house in 2017 was 17 days, which is 19% faster than 2016. The average list-to-sale price ratio over the last year was 104%, with the spring months as high as 107%! In 2017, inventory growth continued to be a challenge, with a 4% decrease in new listings compared to 2016. Even with inventory limitations there were a near equal amount sales! This phenomenon illustrates strong buyer demand and a need for more listings.
Demand for north King County real estate has grown due to close proximity to job centers while maintaining a neighborhood feel. Over the last year, north King County was 41% more expensive than south Snohomish County and 77% over south King County. Historically low interest rates continue to drive the market as well, they have helped offset the increase in prices. Sellers are enjoying great returns due to this phenomenon and buyers are securing mortgages with minor debt service.
This is only a snapshot of the trends in north King County; please contact us if you would like further explanation of how the latest trends relate to you.
Quarterly Market Trends: South Snohomish County
Q4 2017
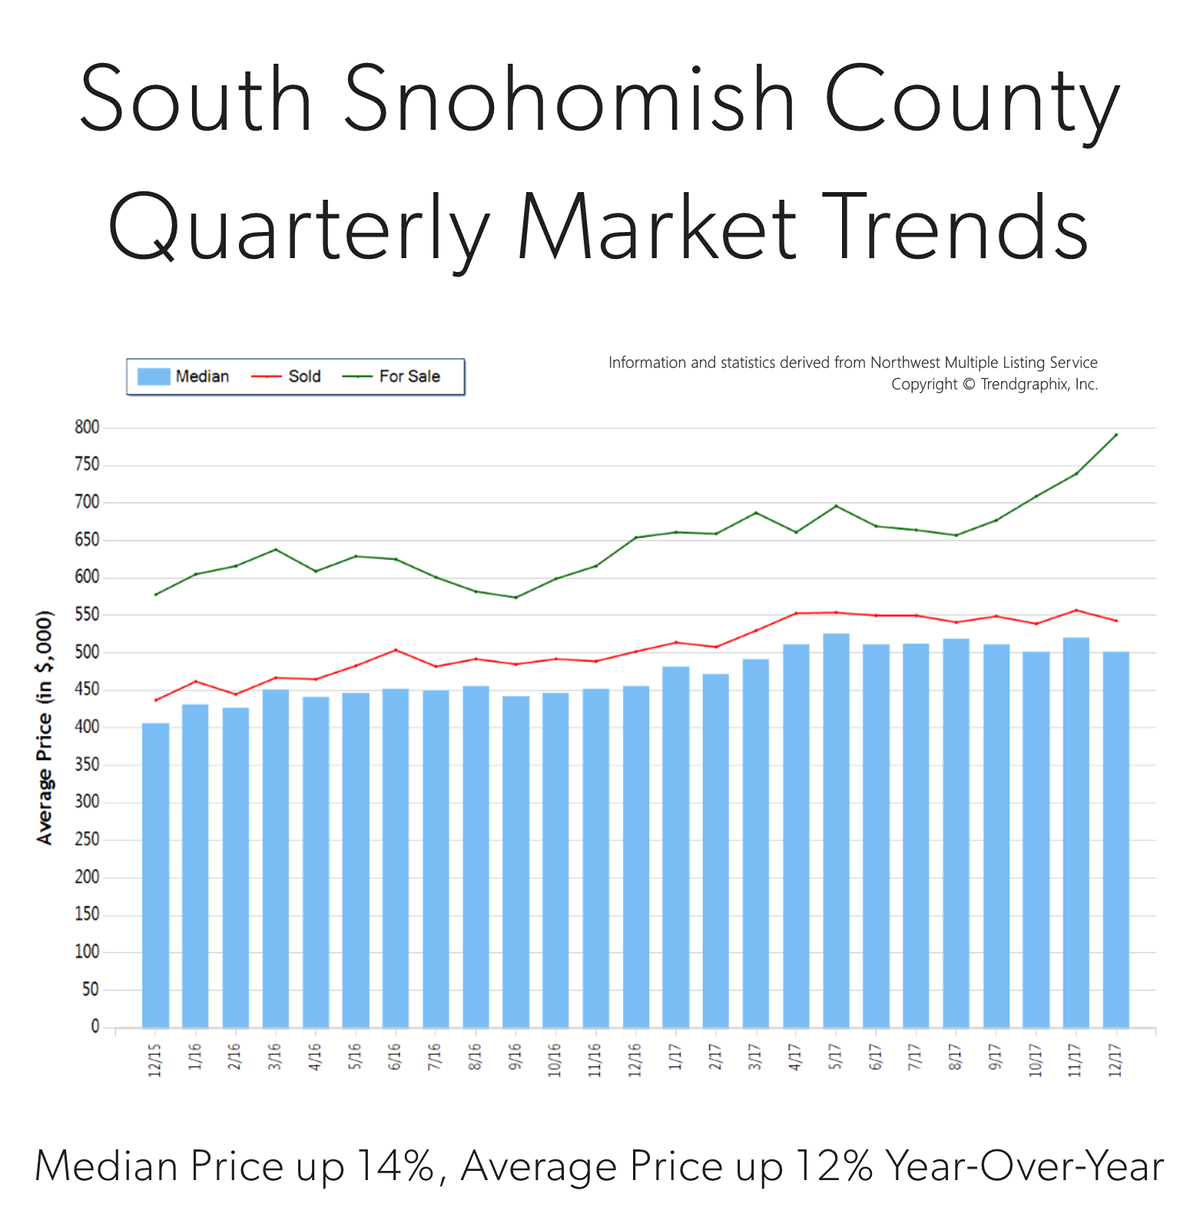
 Price growth was particularly strong in 2017! Median was up 14% and average price up 12% over 2016. Median price in 2017 landed at $508,000 and the average at $543,000. The average amount of days it took to sell a house in 2017 was 24 days, which is 17% faster than 2016. The average list-to-sale price ratio over the last year was 101%, with the spring months as high as 103%! In 2017, inventory growth continued to be a challenge, with a 1% decrease in new listings compared to 2016. Even with inventory limitations there were 4% more sales! This phenomenon illustrates strong buyer demand and a need for more listings.
South Snohomish County real estate has seen a steady stream of buyers come our way due to affordability, reasonable commute times to job centers and quality of life. In fact, the median price in 2017 was 41% higher in north King County. Historically low interest rates continue to drive the market as well, they have helped offset the increase in prices. Sellers are enjoying great returns due to this phenomenon and buyers are securing mortgages with minor debt service.
This is only a snapshot of the trends in south Snohomish County; please contact us if you would like further explanation of how the latest trends relate to you.
6 Predictions for the 2018 Housing Market & Economy Header


At Windermere, we have the privilege of working with esteemed economist, Matthew Gardner. Throughout the year, I have shared his quarterly Gardner Reports which delineate out all the different housing markets in Western Washington and reports on price appreciation and sales data. Below is a recent article he wrote about predictions for the 2018 real estate market; which was picked up by several news sources, including Inman News.
As a bonus, I recently had the opportunity to chat with him and get some specific insights on the Greater Seattle real estate market for 2018 and have included those at the end of this article. 2018 looks to be another strong year in real estate. If you are curious about how the market might affect your bottom line, please contact me. It is my goal to help keep my clients informed, empower strong decisions and create exceptional results. Here’s to a very happy New Year!
What Can We Expect From the 2018 Housing Market?
by Matthew Gardner, Chief Economist, Windermere Real EstateMillennial Home Buyers
Last year, I predicted that the big story for 2017 would be millennial home buyers and it appears I was a little too bullish. To date, first-time buyers have made up 34% of all home purchases this year – still below the 40% that is expected in a normalized market. Although they are buying, it is not across all regions of the country, but rather in less expensive markets such as North Dakota, Ohio, and Maryland.For the coming year, I believe the number of millennial buyers will expand further and be one of the biggest influencers in the U.S. housing market. I also believe that they will begin buying in more expensive markets. That’s because millennials are getting older and further into their careers, enabling them to save more money and raise their credit profiles.
Existing Home Sales
As far as existing home sales are concerned, in 2018 we should expect a reasonable increase of 3.7% – or 5.62 million housing units. In many areas, demand will continue to exceed supply, but a slight increase in inventory will help take some heat off the market. Because of this, home prices are likely to rise but by a more modest 4.4%.New Home Sales
New home sales in 2018 should rise by around 8% to 655,000 units, with prices increasing by 4.1%. While housing starts – and therefore sales – will rise next year, they will still remain well below the long-term average due to escalating land, labor, materials, and regulatory costs. I do hold out hope that home builders will be able to help meet the high demand we’re expecting from first-time buyers, but in many markets it’s very difficult for them to do so due to rising construction costs.Interest Rates
Interest rates continue to baffle forecasters. The anticipated rise that many of us have been predicting for several years has yet to materialize. As it stands right now, my forecast for 2018 is for interest rates to rise modestly to an average of 4.4% for a conventional 30-year fixed-rate mortgage – still remarkably low when compared to historic averages.Tax Reform
There are changes to the income tax structure that could potentially have a significant impact on homeowners and the housing market. The first is the mortgage interest rate deduction which will be capped at $750,000 – down from $1,000,000. In theory this can be considered a tax on wealthy households, but there have been nearly 100,000 home sales this year where the mortgage loan was over $750,000 (almost 4% of total sales), so the effect will be felt more broadly.That said, this change will disproportionately affect high-cost markets in California, New York, and Hawaii, and to a somewhat lesser degree, it will also be felt in Seattle, and parts of Colorado and Arizona. The capping of the deduction for state and local property taxes (SALT) at $10,000 will also negatively impact states with high property taxes, such as California, New York, and New Hampshire.
The final tax bill also eliminates the deduction for interest on home equity loans which is currently allowed on loans up to $100,000. This is significant because it will largely affect the growing number of homeowners who are choosing to remodel their home rather than try to find a new home in supply-starved markets like Seattle.
While these measures will likely have a dampening effect on housing, I do not believe they will lead to a substantial drop in home values. However, there is a concern that it will lead to fewer home sales, as households choose to stay put so they can continue to take advantage of the current mortgage interest deduction. The result could be fewer listings, which could actually cause home prices to rise at above-average rates for a longer period of time.
Housing Bubble
I continue to be concerned about housing affordability. Home prices have been rising across much of the country at unsustainable rates, and although I still contend that we are not in “bubble” territory, it does represent a substantial impediment to the long-term health of the housing market. But if home price growth begins to taper, as I predict it will in 2018, that should provide some relief in many markets where there are concerns about a housing bubble.In summary, along with slowing home price growth, there should be a modest improvement in the number of homes for sale in 2018, and the total home sales will be higher than 2017. First-time buyers will continue to play a substantial role in the nation’s housing market, but their influence may be limited depending on where the government lands on tax reform.
https://www.windermere.com/blogs/windermere/posts/1701
Gardner, Matthew. “What Can We Expect From The 2018 Housing Market?” Windermere Real Estate. Windermere.com, 8 December 2017. Web. 27 December 2017.
A Conversation with Matthew
It is always a pleasure to talk with Matthew. We recently discussed his thoughts on the Greater Seattle real estate market and what he sees shaping up for 2018.
Millennial homebuyers were more of an influence in the Greater Seattle market in 2017 because of the robust hiring that corporations such as Amazon have made. He thinks that this will continue to grow in 2018, because the cost of rent continues to rise at a rapid pace and in many cases owning makes superior financial sense. For example, it is not unheard of to pay $3,000 a month in rent for a unit in South Lake Union. While this eliminates a commute, it is an incredibly costly payment that goes entirely towards the landlord’s investment. If one is willing and able to pay that much in rent, it is important to look at the fact that that number is equivalent to a mortgage payment on a $550,000 home! He predicts that we will see more millennial homebuyers move out to the more traditional suburbs to start building their wealth in real estate. Ideally, Millennials would love to live in “ex-urban” areas that are still close to their places of work; however, listings are slim and prices very high for this type of product.Therefore, he expects to see Millennials having to look at the suburbs when deciding where to buy.
In 2017, net in-migration totaled 50,000 in the Greater Seattle area. Matthew predicts that we will see the same in 2018 due to our robust job market and Californians continuing to move to the area. Employment in the region will continue to expand, but at lower rates than seen in 2017. That said, he sees more wage growth than job growth in 2018 as companies have done so much hiring over the last 3 years, and now they are focused on maintaining their employee base. Amazon has signed on to occupy 5 million additional square feet of space over and above the 8+ million square feet that they currently occupy, so we will continue to see job growth there. The unemployment rate will stay below 4% in 2018.
Matthew believes we will see a slight increase in inventory taking our market to hot from boiling. Some new construction will help this increase and he does expect to see some Baby Boomers deciding to either cash-out and leave the area, or downsize. This inventory growth should temper price growth and increase sales by 6%. In 2017, we saw a year-over-year price appreciation rate of 13% in the Greater Seattle area, and he predicts 8-8.5% for 2018. This is still well above the normal rate of 5.5%, but certainly much more sustainable than 13%!
Lastly, Matthew is adamant that we are not headed toward another bubble. The average down payment in the Greater Seattle area is now over $100,000 and home owners have great equity positions, which is a critical ingredient to a non-bubble market. Additionally, credit is still very tight and buyers are very highly qualified, and the rampant speculation that is the key sign of a bubble is not being seen locally. His biggest concern is affordability, and that we need to continue to find ways to create more housing through zoning changes and decreasing the cost of regulation for builders. This density would create more affordable housing.
Demystifying the Zestimate®

 Knowing the value of your home is helpful in many ways. It can help determine one’s net worth, help decide if a home sale or purchase is a financially feasible move, determine the ability to get a loan – and it’s just nice to know where your largest investment stands. Consumers have the option to access websites such as Zillow® to search the Zestimate® or other Automated Valuation Model (AVM) on their property.
A Zestimate is an AVM. The product of an automated valuation technology comes from analysis of public record data and computer decision logic combined to provide a calculated estimate of a probable selling price of a residential property. An AVM generally uses a combination of two types of evaluation, a hedonic model and a repeat sales index. The results of each are weighted, analyzed and then reported as a final estimate of value based on a requested date.
Often times when we talk with potential sellers, their Zestimate (or other AVMs) come up in the overall conversation, which is understandable. This information is relatively easy to access and gives the seller a starting point on the value of their home. Where an AVM can become dangerous is when a consumer thinks it’s accurate. Even worse, when a consumer makes a major financial decision solely based on this information. According to Zillow, less than half of all Zestimates in the Seattle metro area are even within 5.4% of the actual value, and they only give themselves a 2-star (fair) rating on their accuracy. In fact, they publish an accuracy report that you can view here.
In August, the average home price in the Seattle Metro area was $824,000. With less than half of all Zestimates within 5% of the actual value, that is a beginning margin of error of $41,200! Further, they claim that 72.3% of their Zestimates are within 10% of the actual value, which is a marked difference – up to $82,400. Where AVMs are incomplete is that the basis of their formula is tax records, which in our experience are often inaccurate. Also, and most importantly, an AVM does not take into consideration the condition of the home, the neighborhood and other environmental impacts such as school district, road noise and unsightly neighboring homes, to name a few.
At the end of the day, to give an accurate accounting of the value of a home in today’s market requires actually physically touring the home and the surrounding homes that compare. As well as considering current market conditions such as supply and demand and seasonality. An algorithm cannot accomplish this, but a real estate broker can.
So why does the Zestimate exist? Zillow is a publicly traded company (ZG) and their website is their vehicle to create profit. The Zestimate drives consumers to the website who are often dipping their toe in the pool to see what their home might be worth, or searching available homes for sale. When a consumer is searching on the website they are surrounded by real estate broker and mortgage broker ads on every page. These real estate brokers and mortgage brokers are paying for that advertising space, which is how Zillow makes its money and why there is a Zestimate. The Zestimate is not a public service, it is a widget to bring eyes to their advertising space which in turn, sells more ads.
Another important item to note is that Zillow does NOT have all available inventory in the Greater Seattle area on their website. In May, they cut off access to manually input listings, leaving some real estate firms unable to get their listings on the site any longer. Some firms just plainly chose not to syndicate to them. It is estimated that Zillow has between 70%-80% of the total available inventory on their site. In an inventory-tight market like the one we are in now, it is important for consumers to understand that if Zillow is the only source they are searching with, they may be missing out. Brokerage firm websites such as ours have a direct IDX feed from the Northwest Multiple Listing Service which refreshes every 15 minutes, insuring the accuracy and completeness of all listing data.

The moral of the story is this: use Zillow as one of the many tools in your real estate evaluation and search toolbox. Zillow provides a great starting point and contains a ton of information to whet your palate when embarking on a real estate endeavor. However, we live in a time of information overload and we are overstimulated at best. Nothing beats the evaluation and discernment of a knowledgeable and experienced real estate broker to help you determine accuracy, which will lead to the empowerment of clarity.
If you are curious about the value of your home in today’s market, please contact us. Any one of our experienced agents can provide an annual real estate review of all of your real estate holdings, or even dive deep into a complete comparative market analysis if you would find that helpful. It is our goal to help keep our clients informed and empower strong decisions.
Zillow® and Zestimate® are trademarks of Zillow, Inc.
 Facebook
 X
X
 Pinterest
 Copy Link


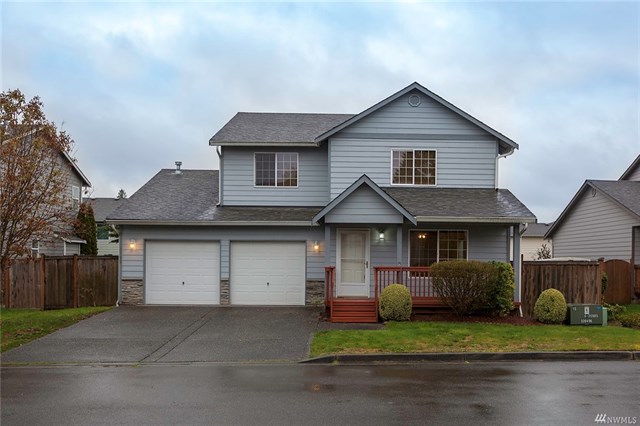 A happy family of five just moved in to this house in mid-May. Two hard working parents, Brandy and Juan, with three teenagers were renting a 3-bedroom, 1-bath rambler in Edmonds and needed more space. It was time to make a move, and they had saved up a 3% down payment for a new home. Their budget was $400,000.
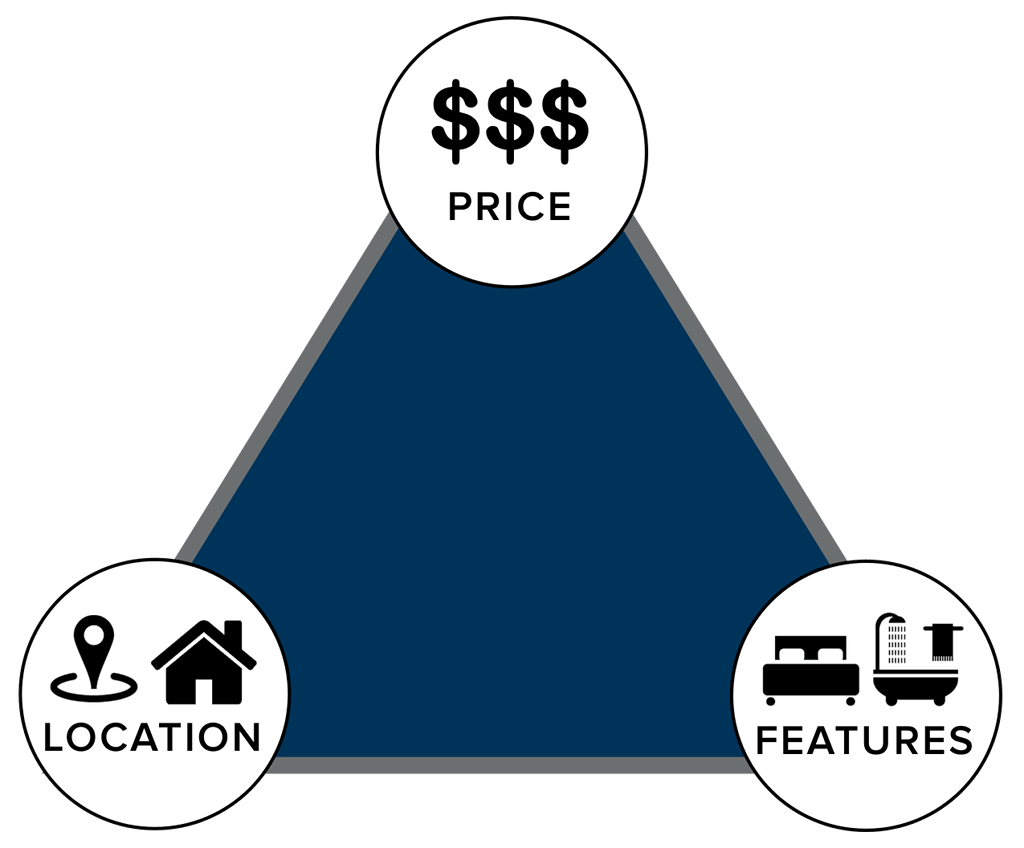 The first step in the home buying process was sitting down with their agent for the initial buyer consultation. This is where they discussed market conditions, desired features such as bedrooms, bathrooms and garage, and their budget. This lead them to explore which locations had the inventory that met their needs in order to stay within their budget. They had to marry these three key points – we like to call this the Triangle of Buyer Clarity. They then identified a few workable locations that had inventory which supported their desired features and their budget and went for it. This upfront research and partnership with their agent lead to Brandy and Juan finding success rather quickly, saving them money in an appreciating market, and a whole lot of strife.
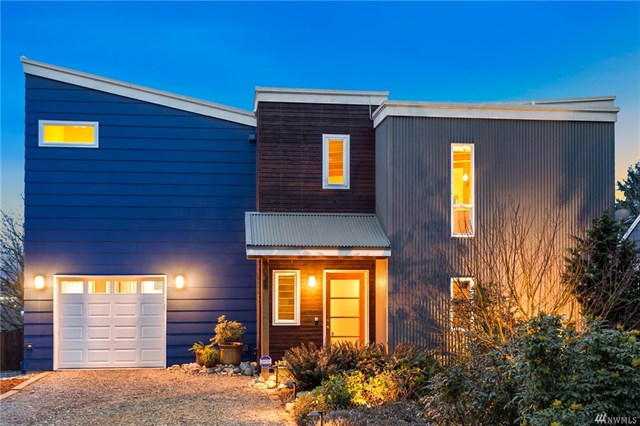 First, how cool is this house? Super cool! That’s just how Paul and Ange feel about their newly purchased home in the Highland Park neighborhood of West Seattle. They just closed in early April and have already attended two neighborhood BBQ’s, received gifts from their new neighbors, discovered new parks and restaurants and, wait for it…shortened their commute.
 The point of these two stories is to debunk the sentiment we hear from time to time, that first-time home buyers cannot find success in our market. With a well-laid-out plan strategically constructed by the agent and client, we are seeing many happy stories for first-timers. The end result is putting these new homeowners on the path to building wealth, growing thriving communities, and making their house their home.
 Double-digit price appreciation has taken place for over 3 years now, so prices are up. Way up. In fact, in just the last year we have seen prices rise 14% year-over-year. When talking with people about our real estate market, the conversation often involves the question, “are we headed toward a bubble?” We get asked this question often, and it is understandable. With the Great Recession not too far back in our rear-view mirror, the fear that surrounds the bottom dropping out in our home values is real. The large price gains might seem familiar to the gains of the previous up market of 2004-2007, but the environment is much different, and that is why we are not headed toward a housing collapse.
 Dear Greater Seattle Home Buyer,


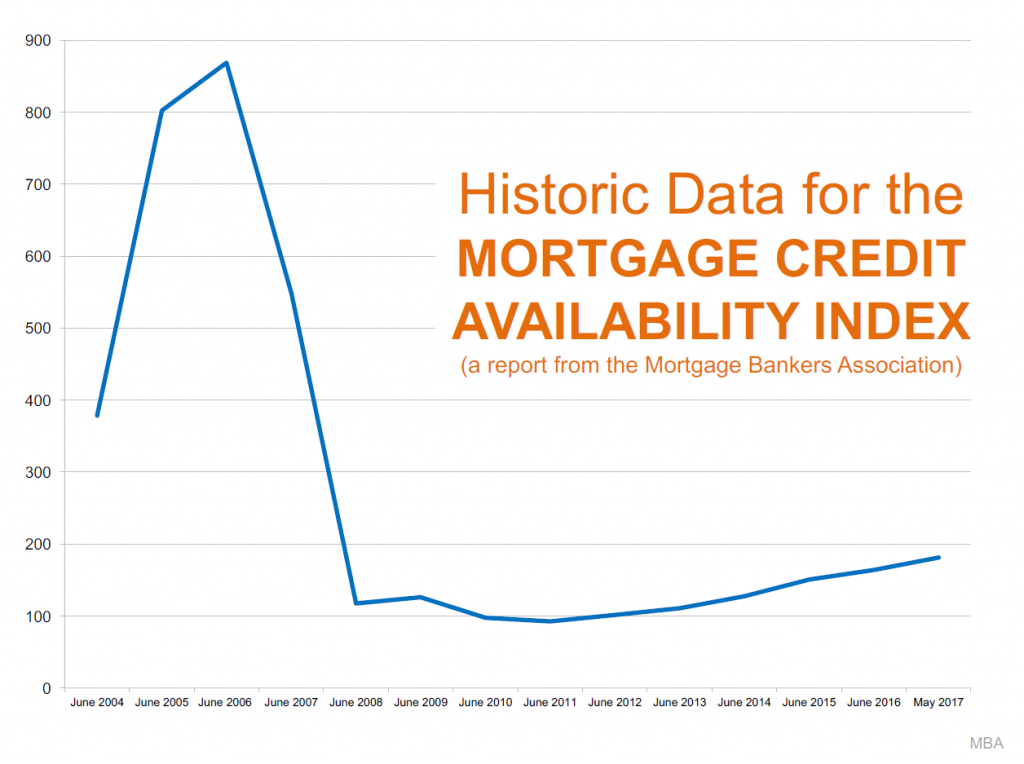
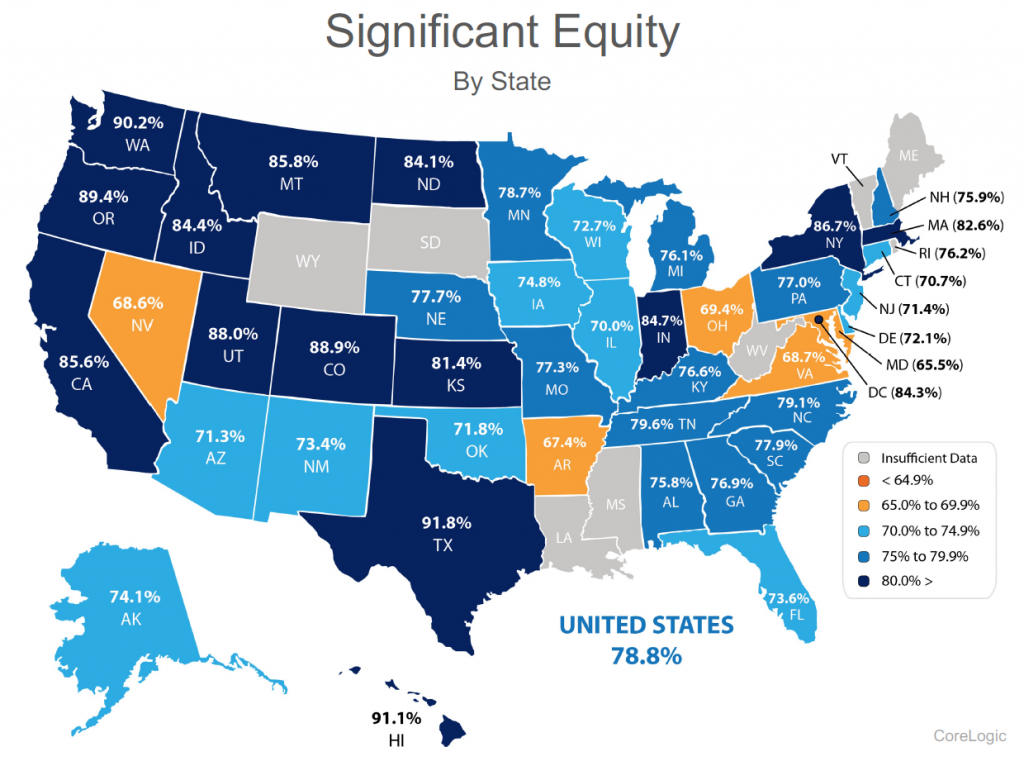
 We understand that the recent increase in home prices has been big and that it might remind you of the previous up market before the crash. Hopefully digging into the topics above has shed some light on how it is different. According to