Facebook
 X
X
 Pinterest
 Copy Link
QUARTERLY REPORTS Q1 2026

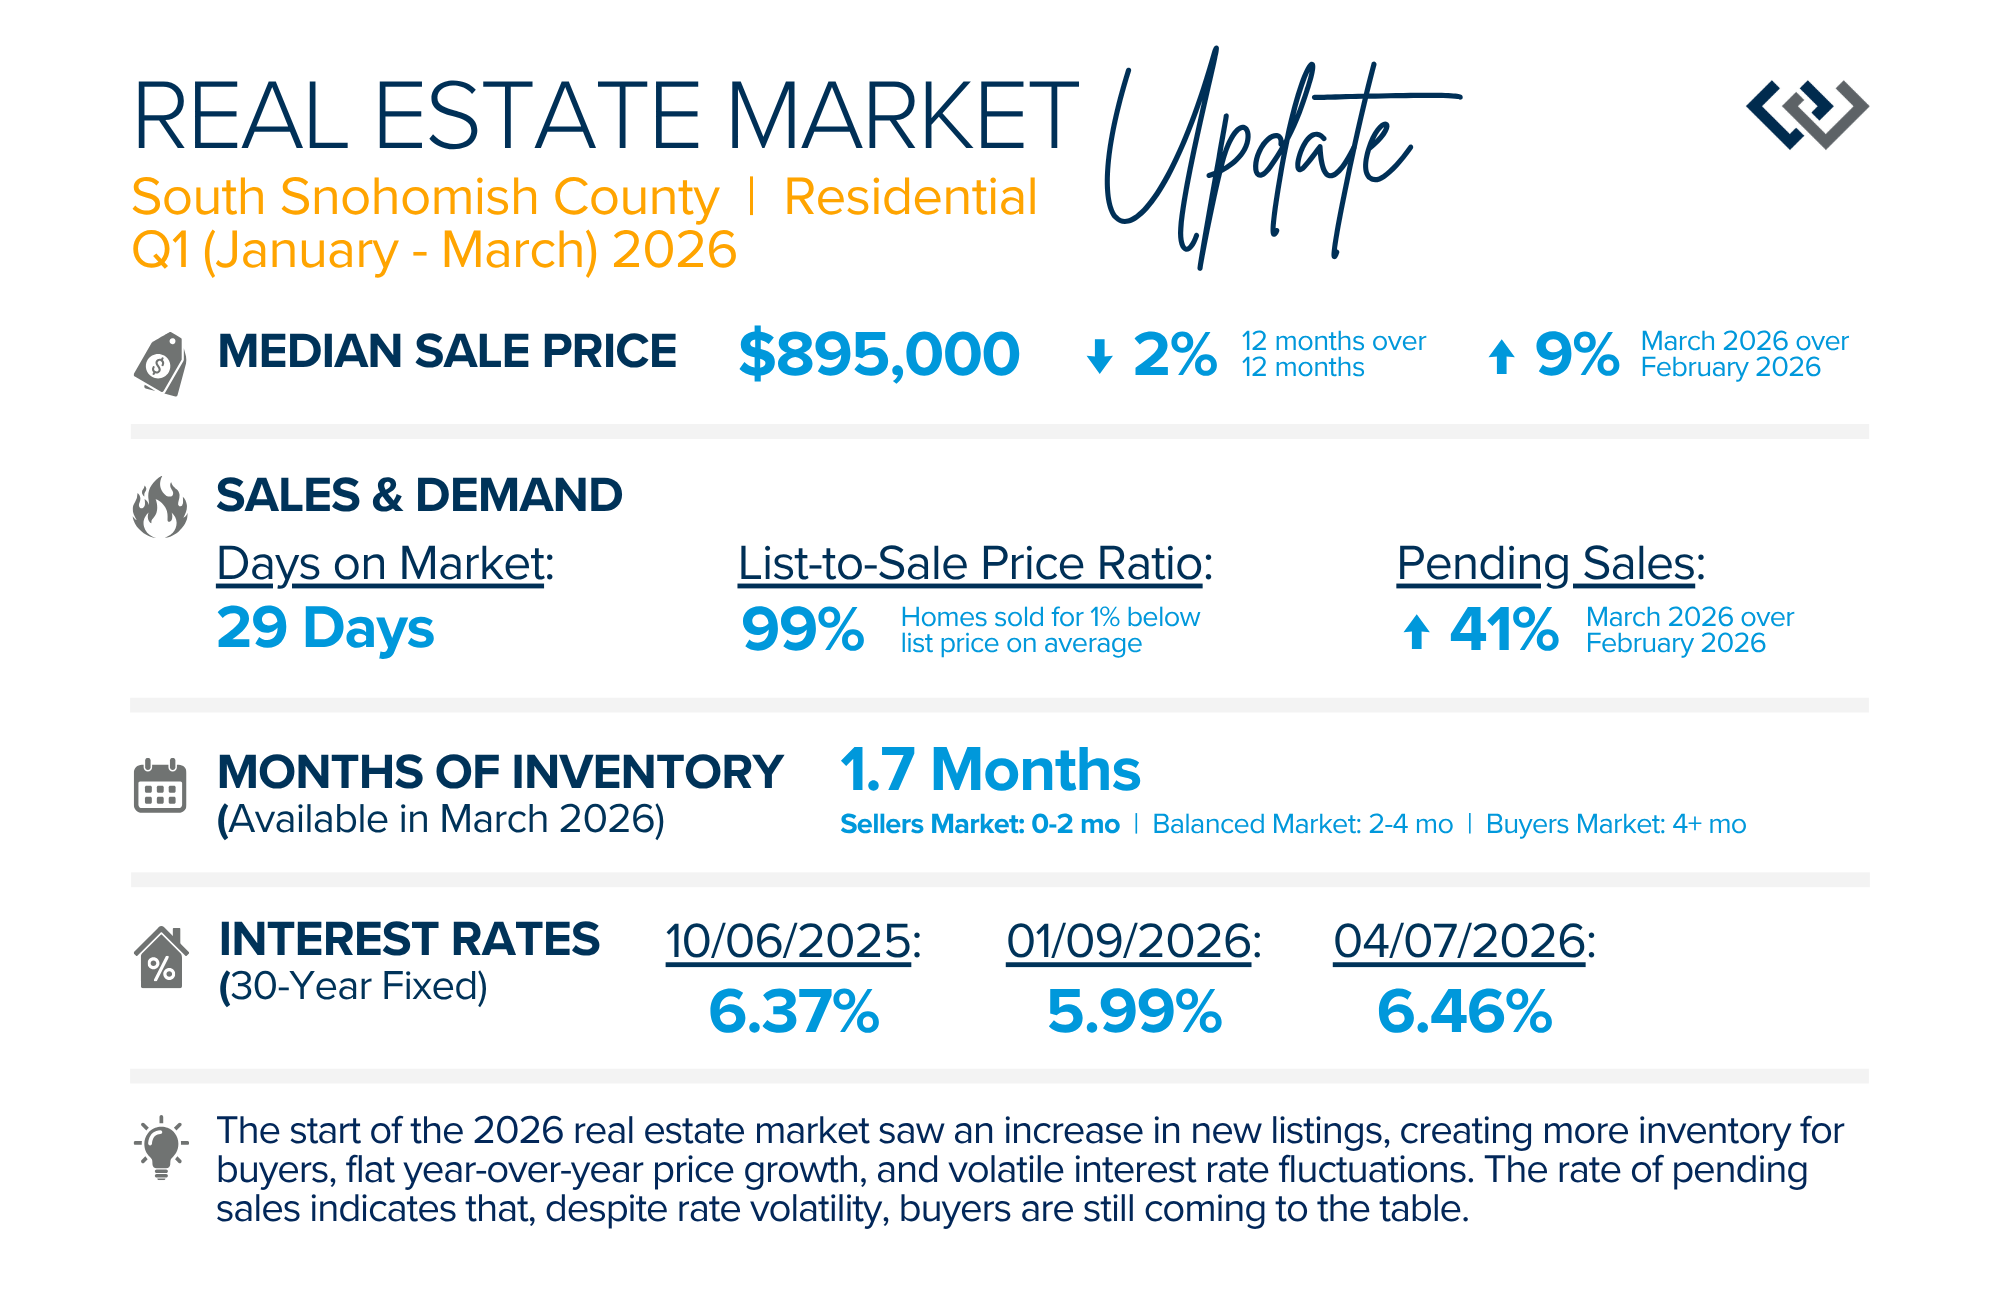
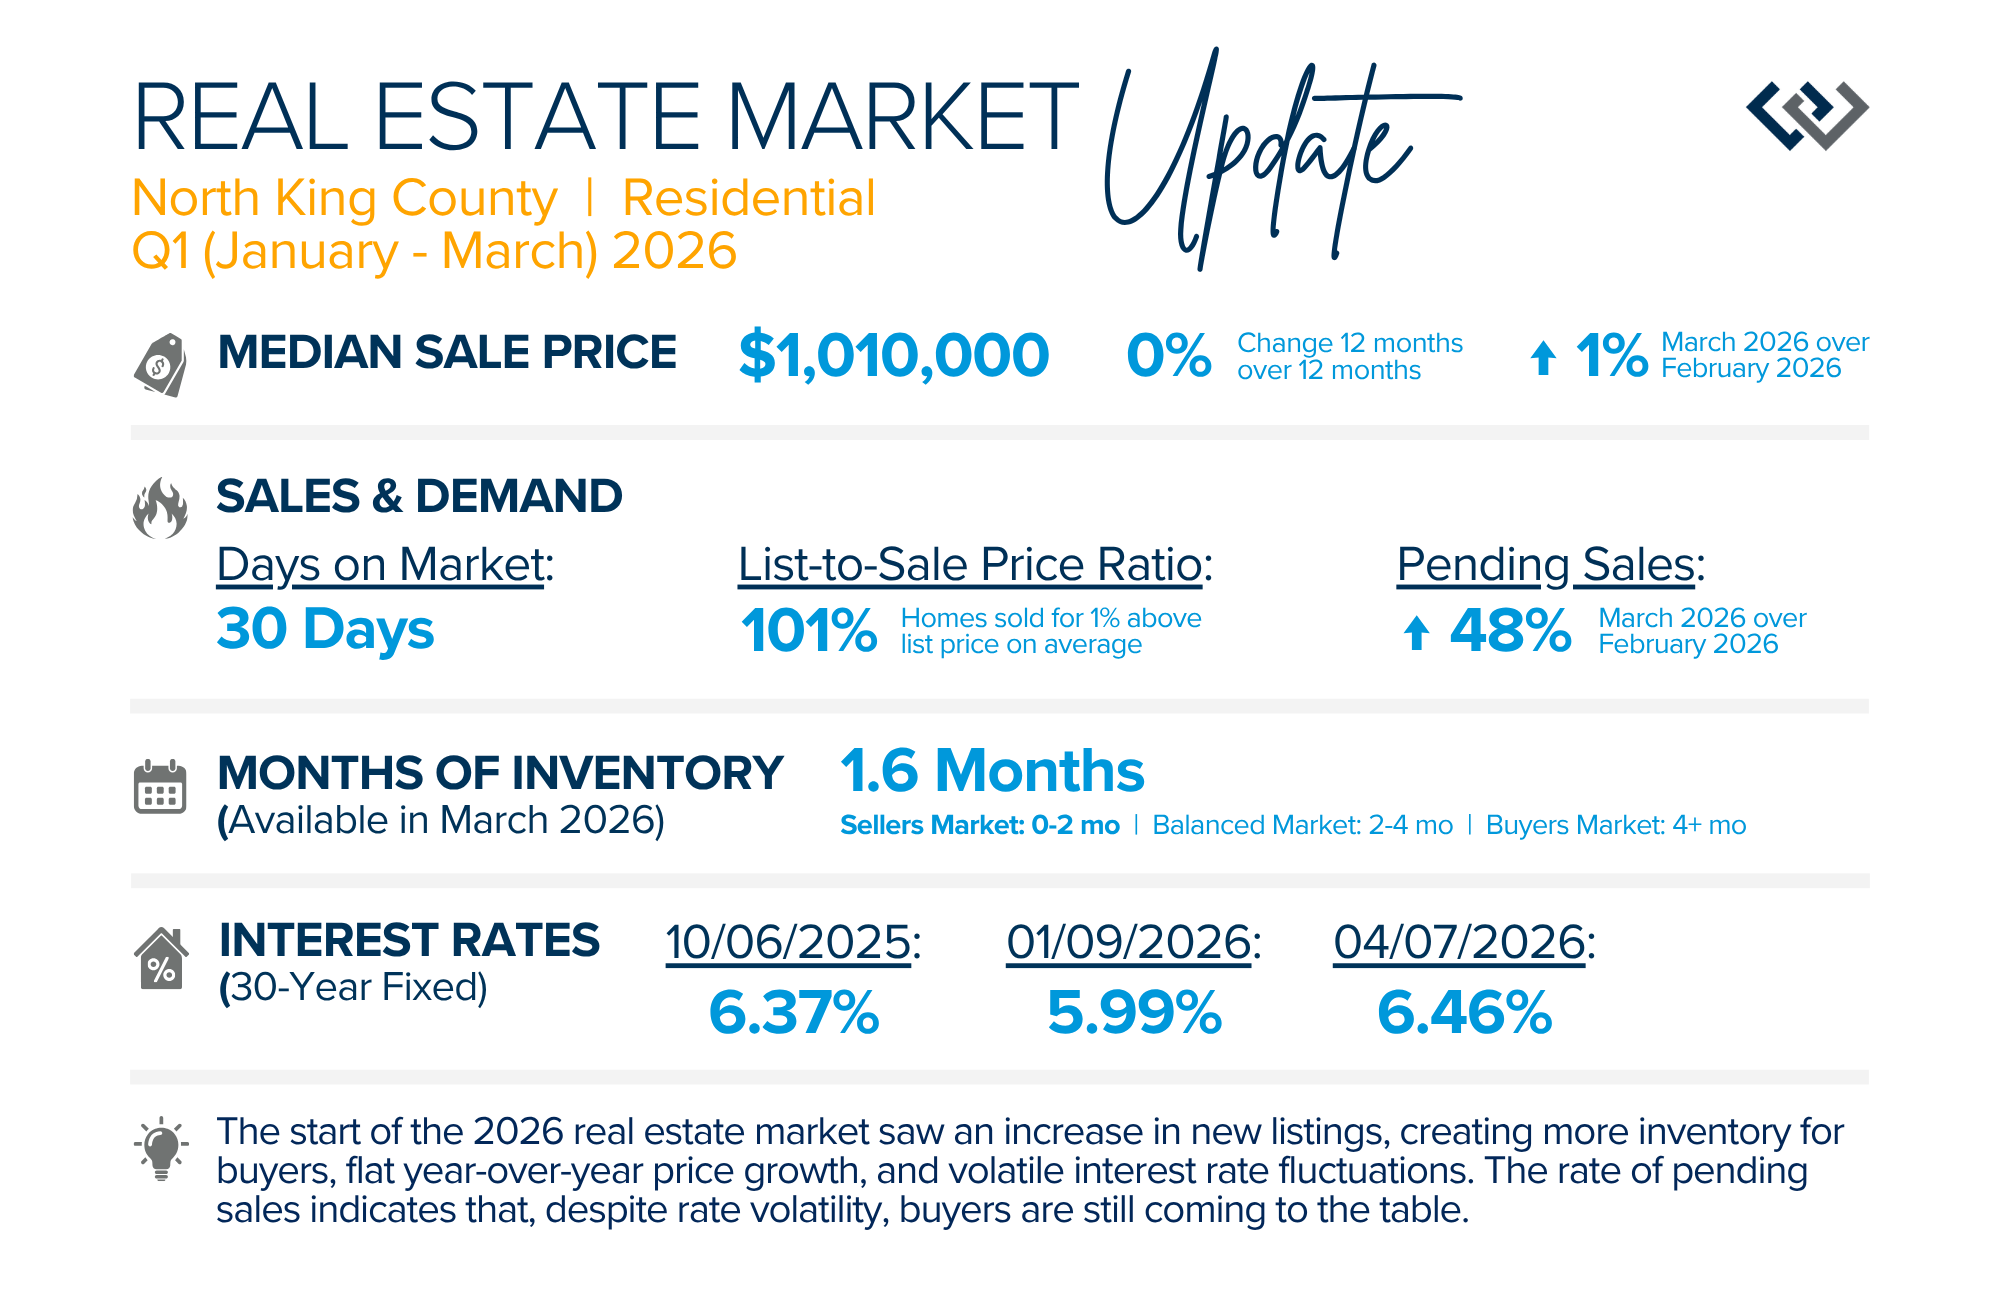
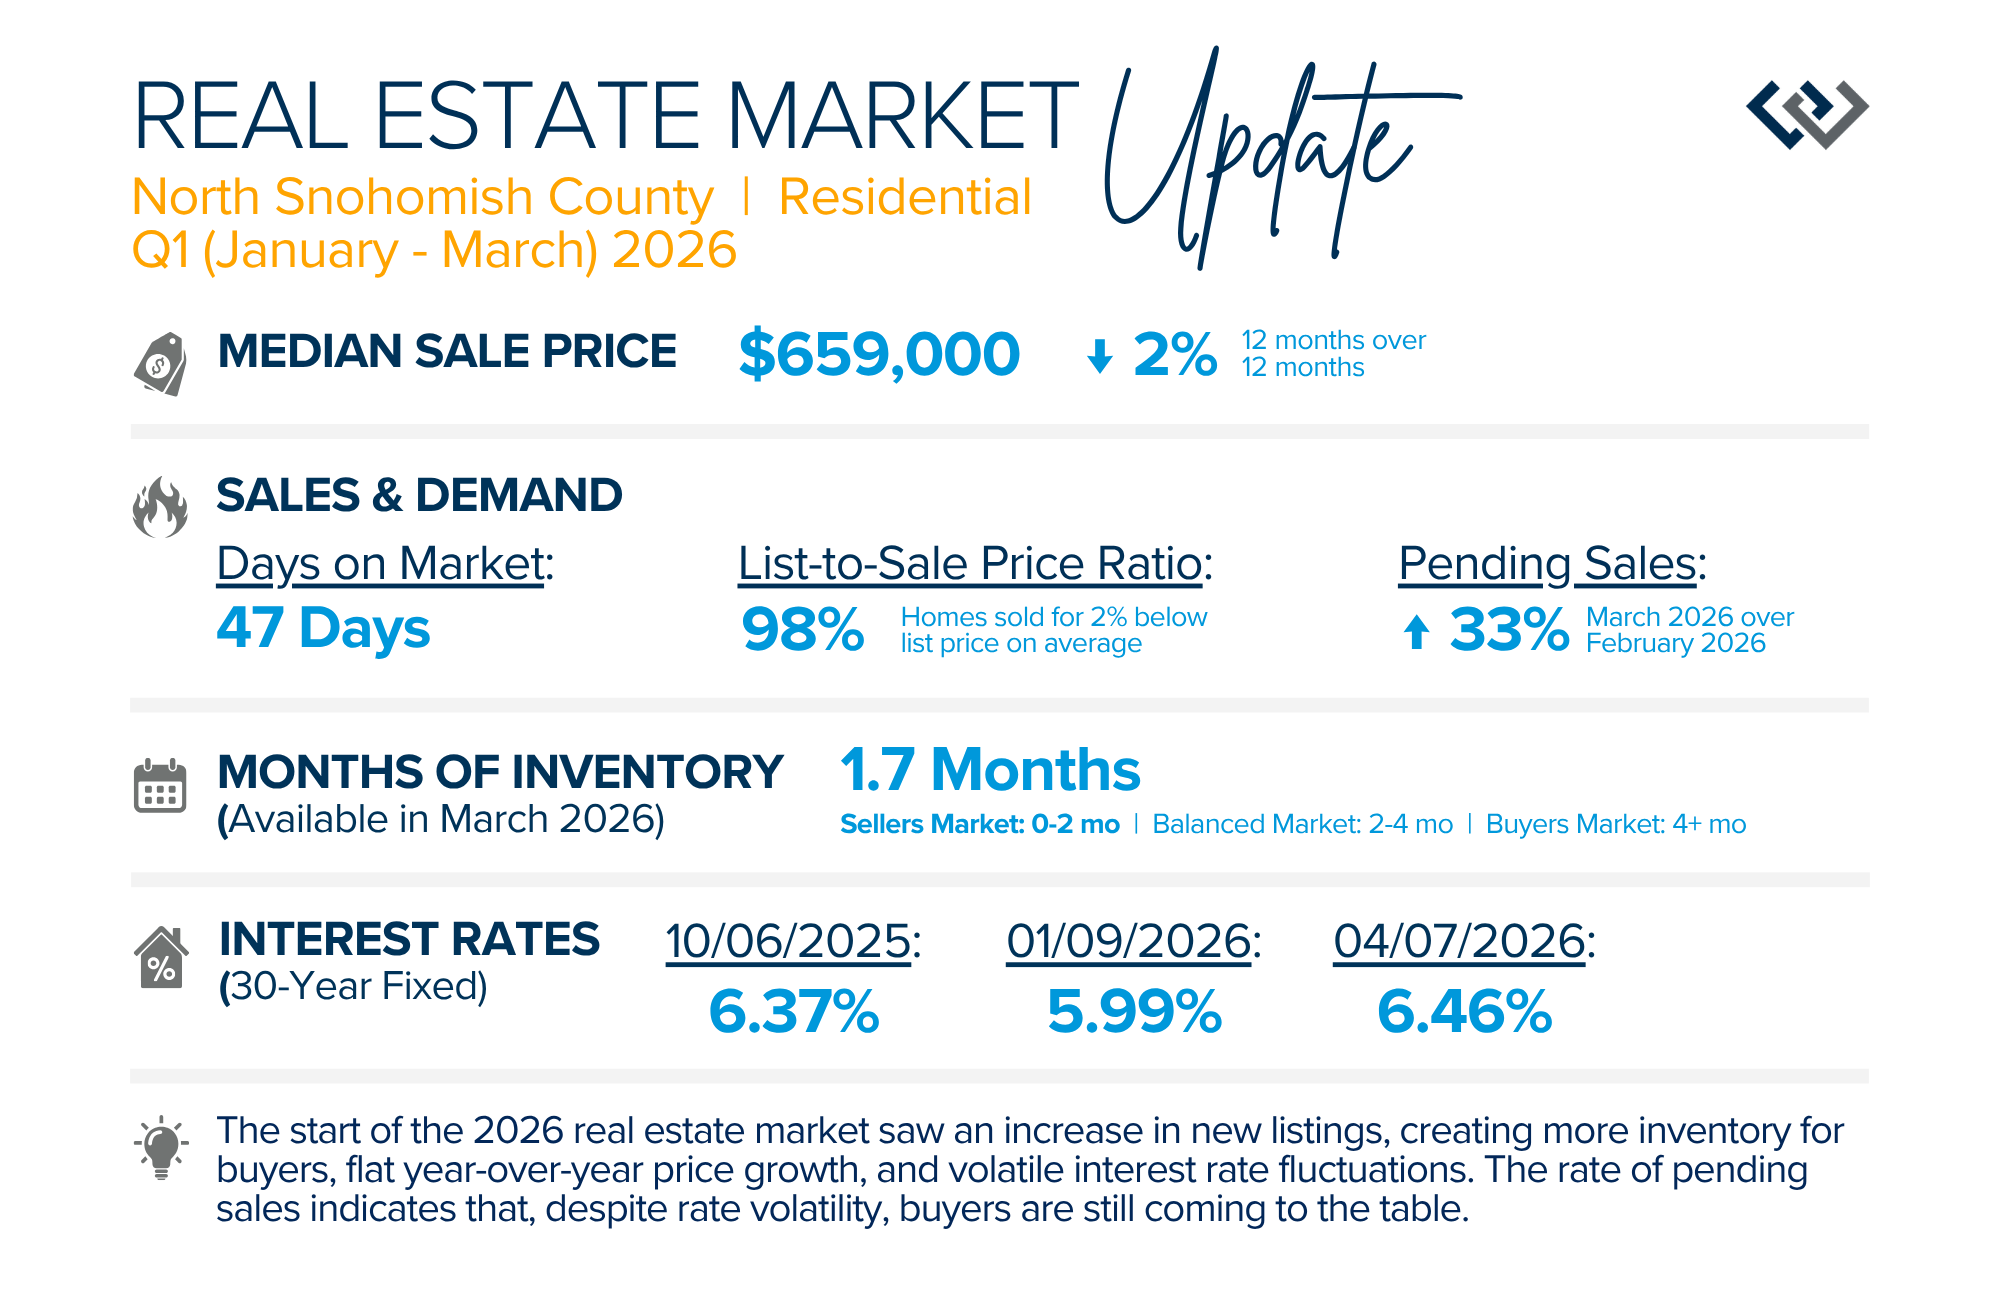
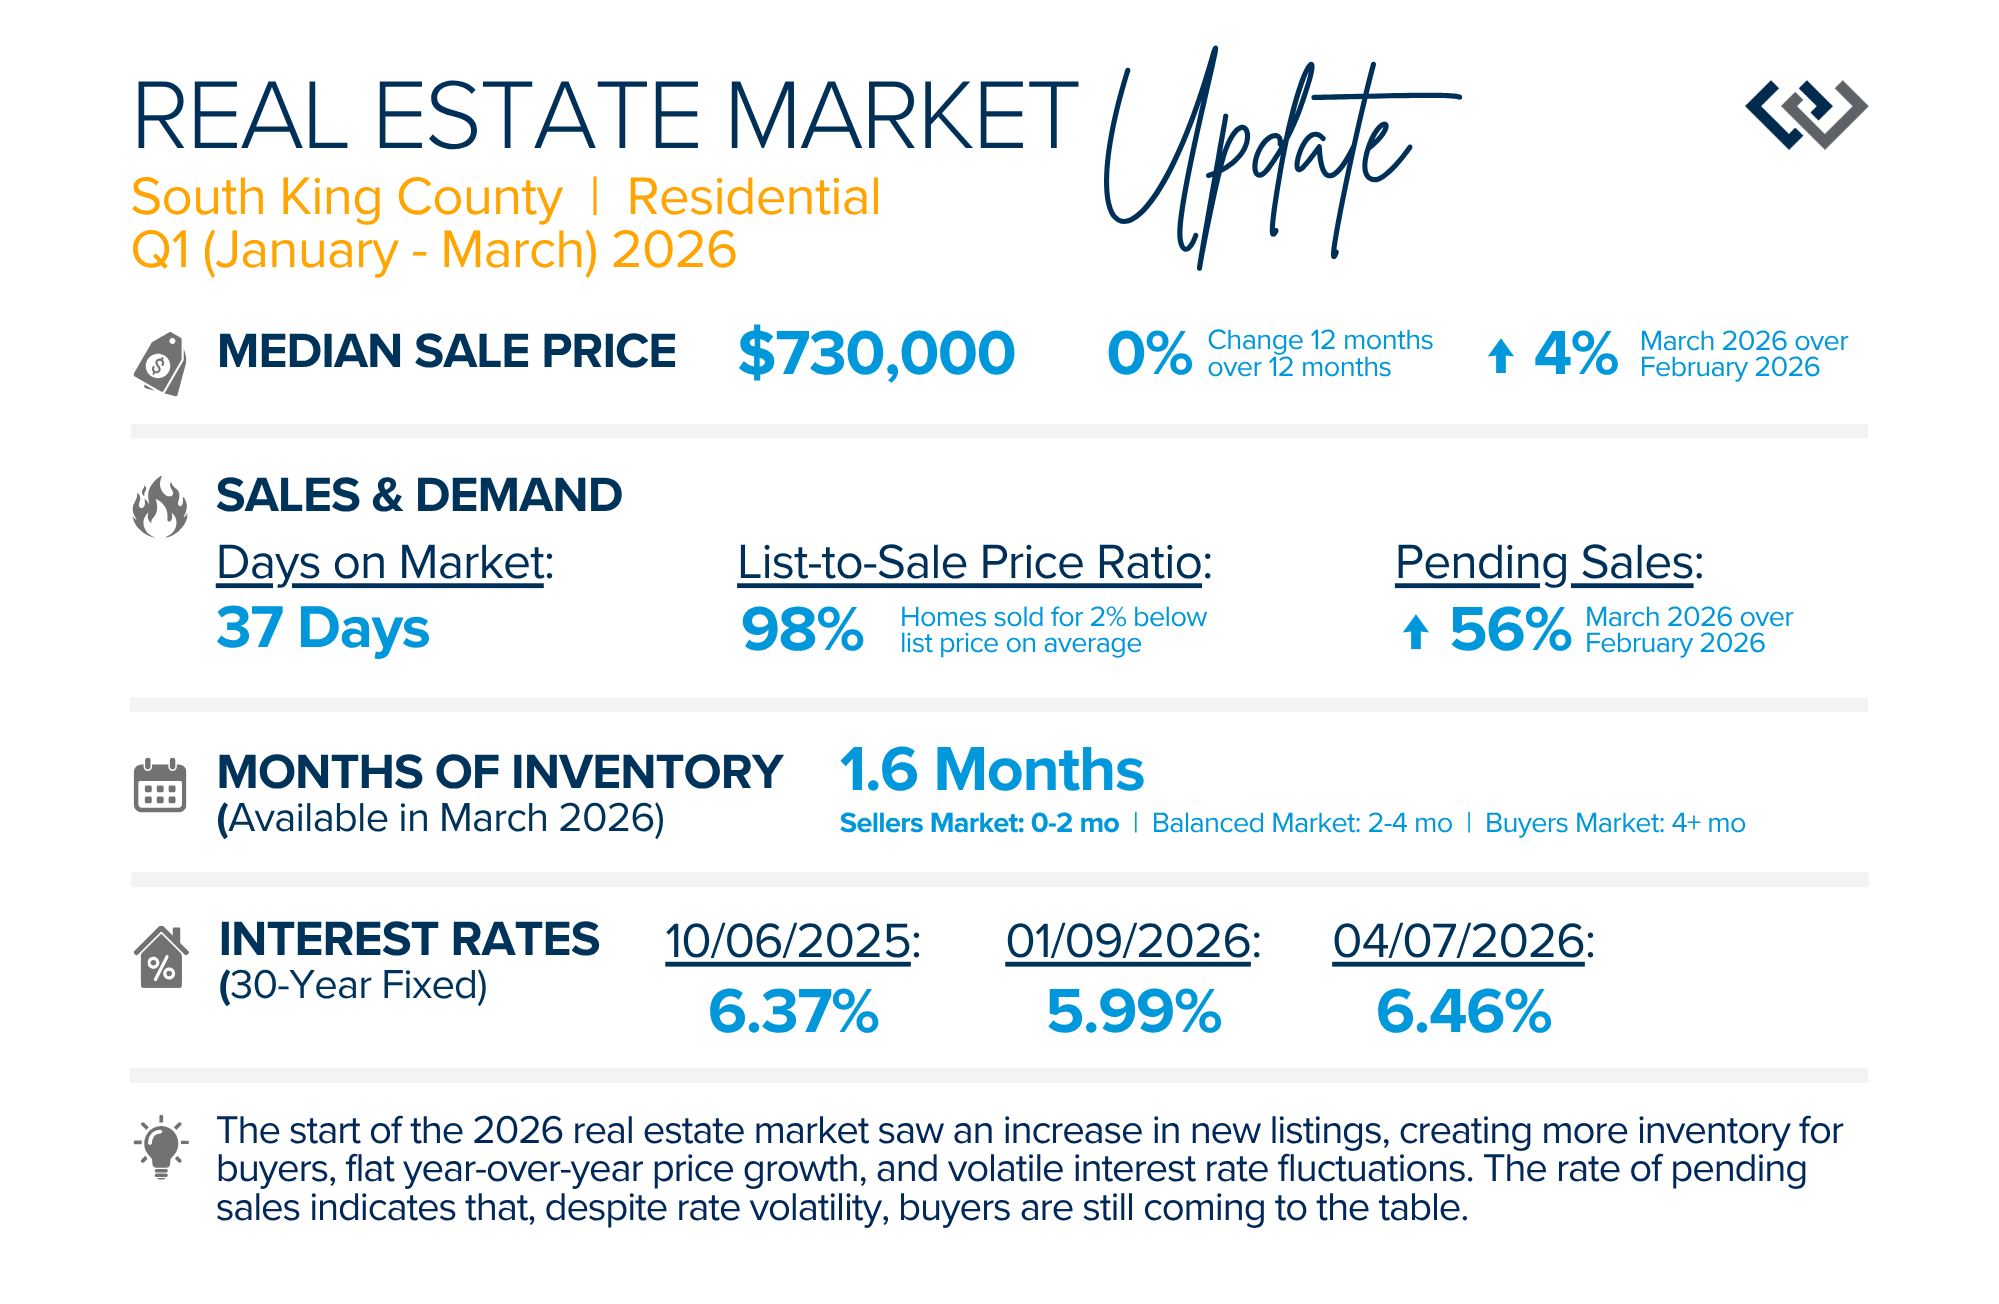
The start of the 2026 real estate market saw an increase in new listings, creating more inventory for buyers, flat year-over-year price growth, and volatile interest rate fluctuations. As we finished Q1, prices began their seasonal uptick month-over-month, with pending sales also starting to rise. With more selection, the market is favoring well-prepared homes that are priced accurately.
Flat year-over-year price growth has helped affordability, but the latest rise in interest rates could moderate the month-over-month growth as we head into Q2. The rate of pending sales indicates that, despite rate volatility, buyers are still coming to the table. Seller equity remains high, with over half of all homeowners having at least 50% equity.
If you are curious about how today’s trends align with your real estate goals, please reach out. It is always our goal to help keep our clients informed to empower strong decisions.


QUARTERLY REPORTS Q4 2025

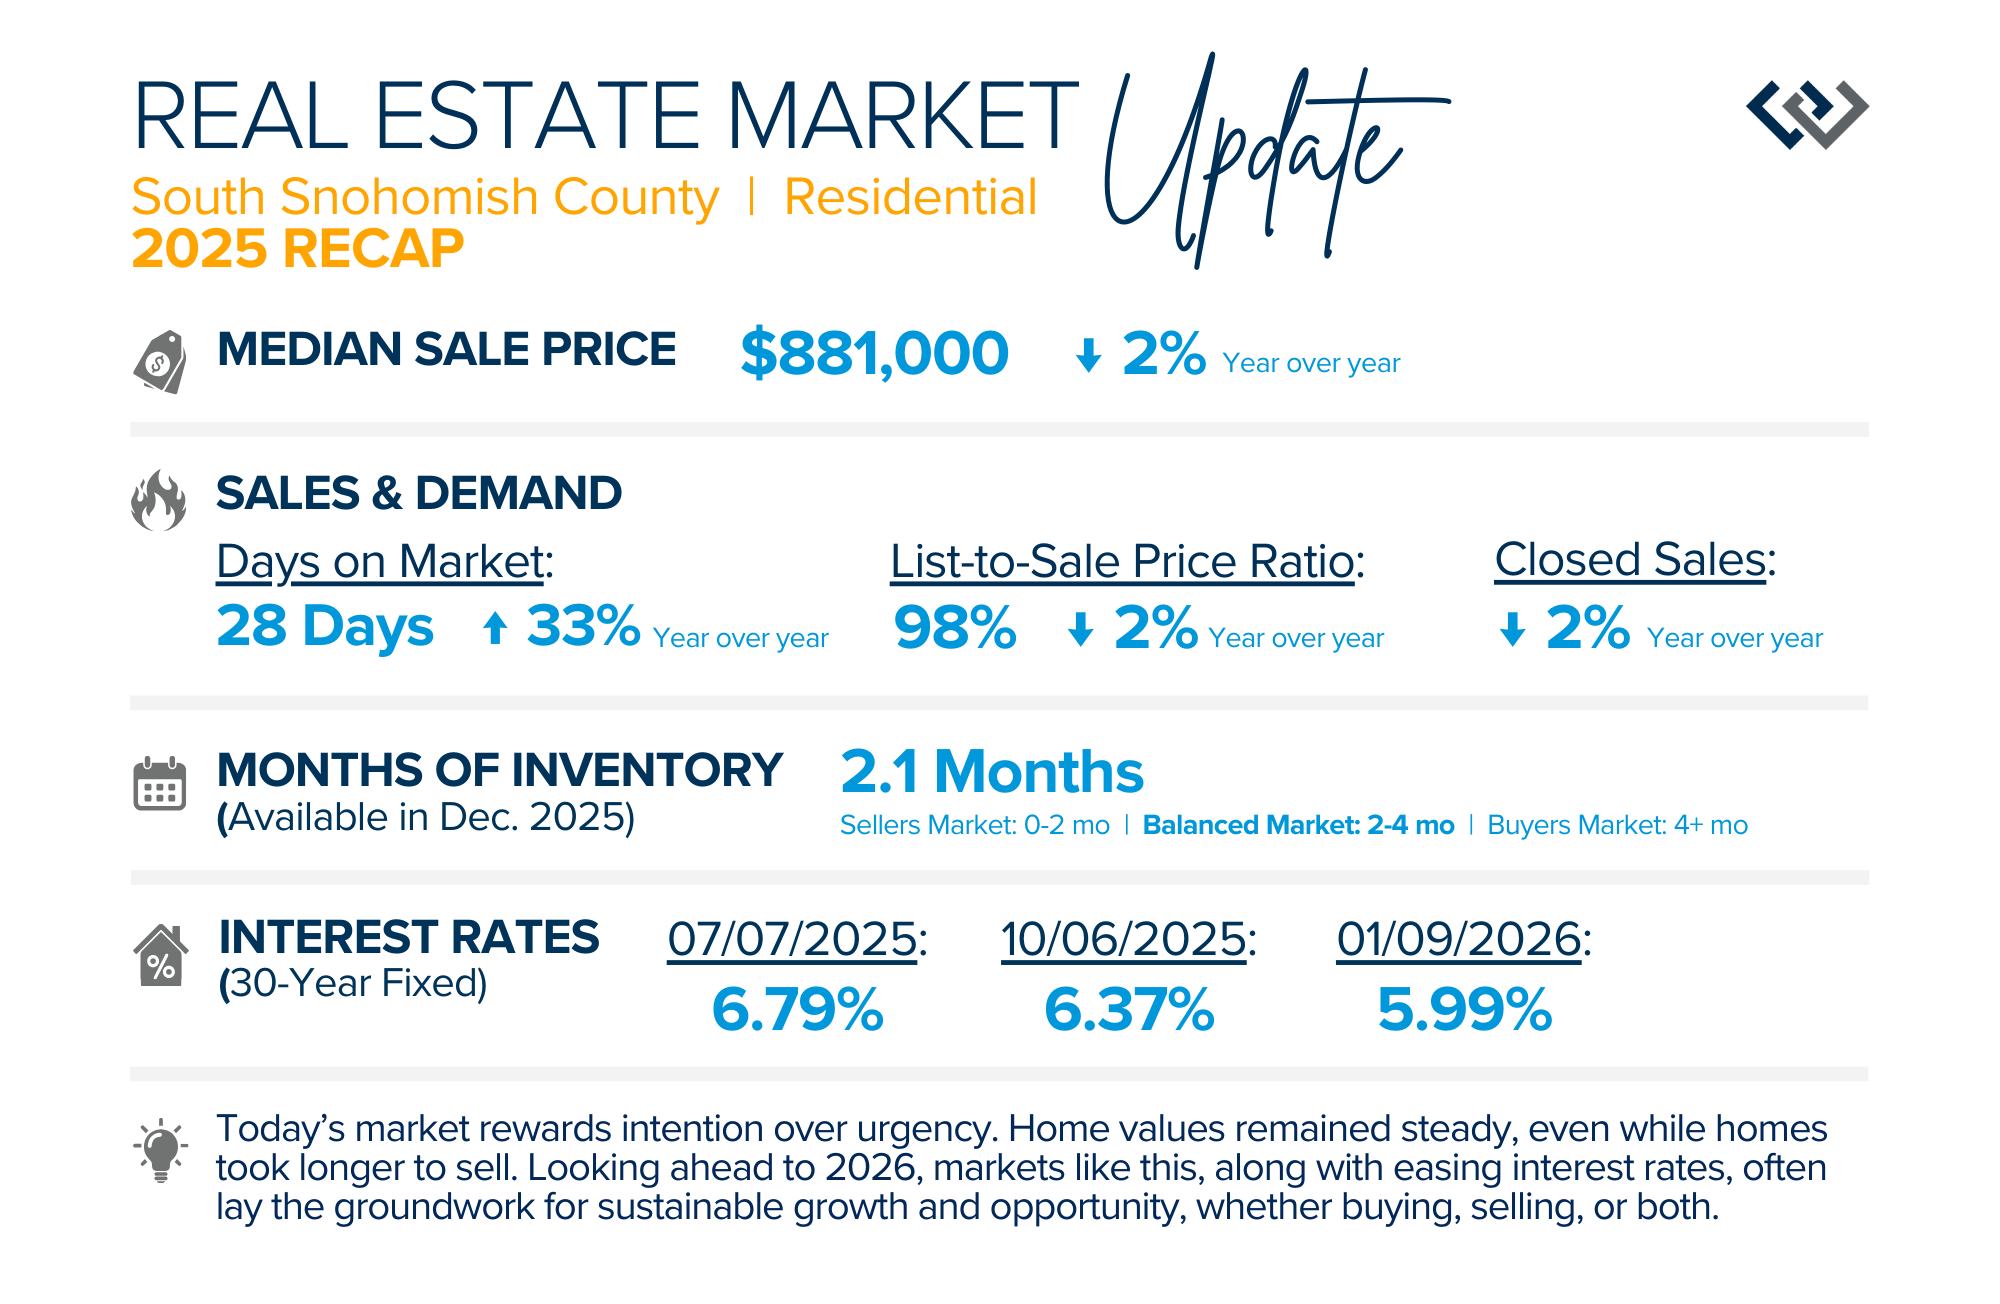
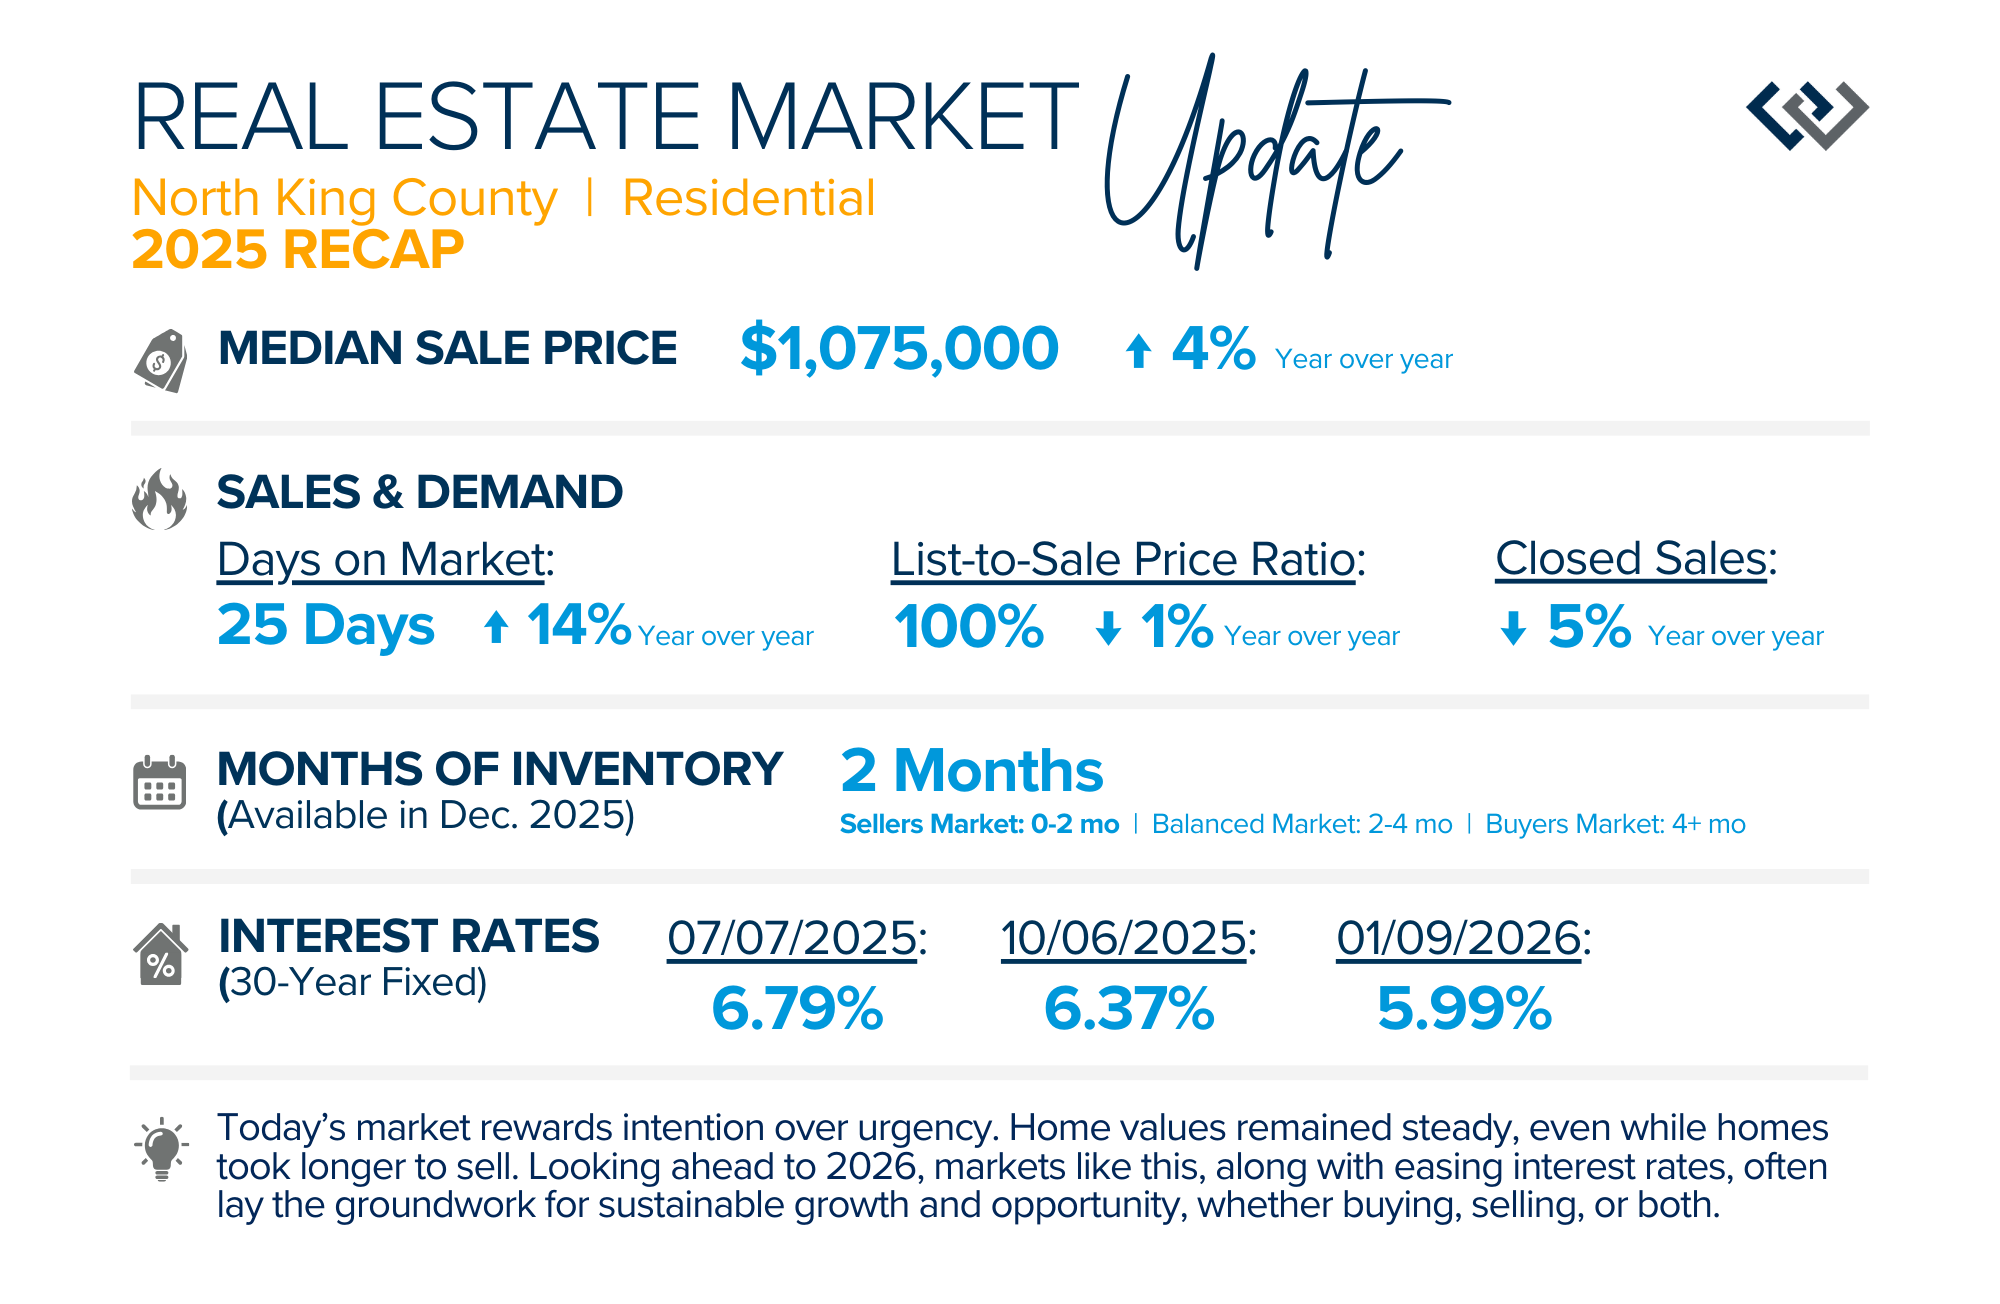
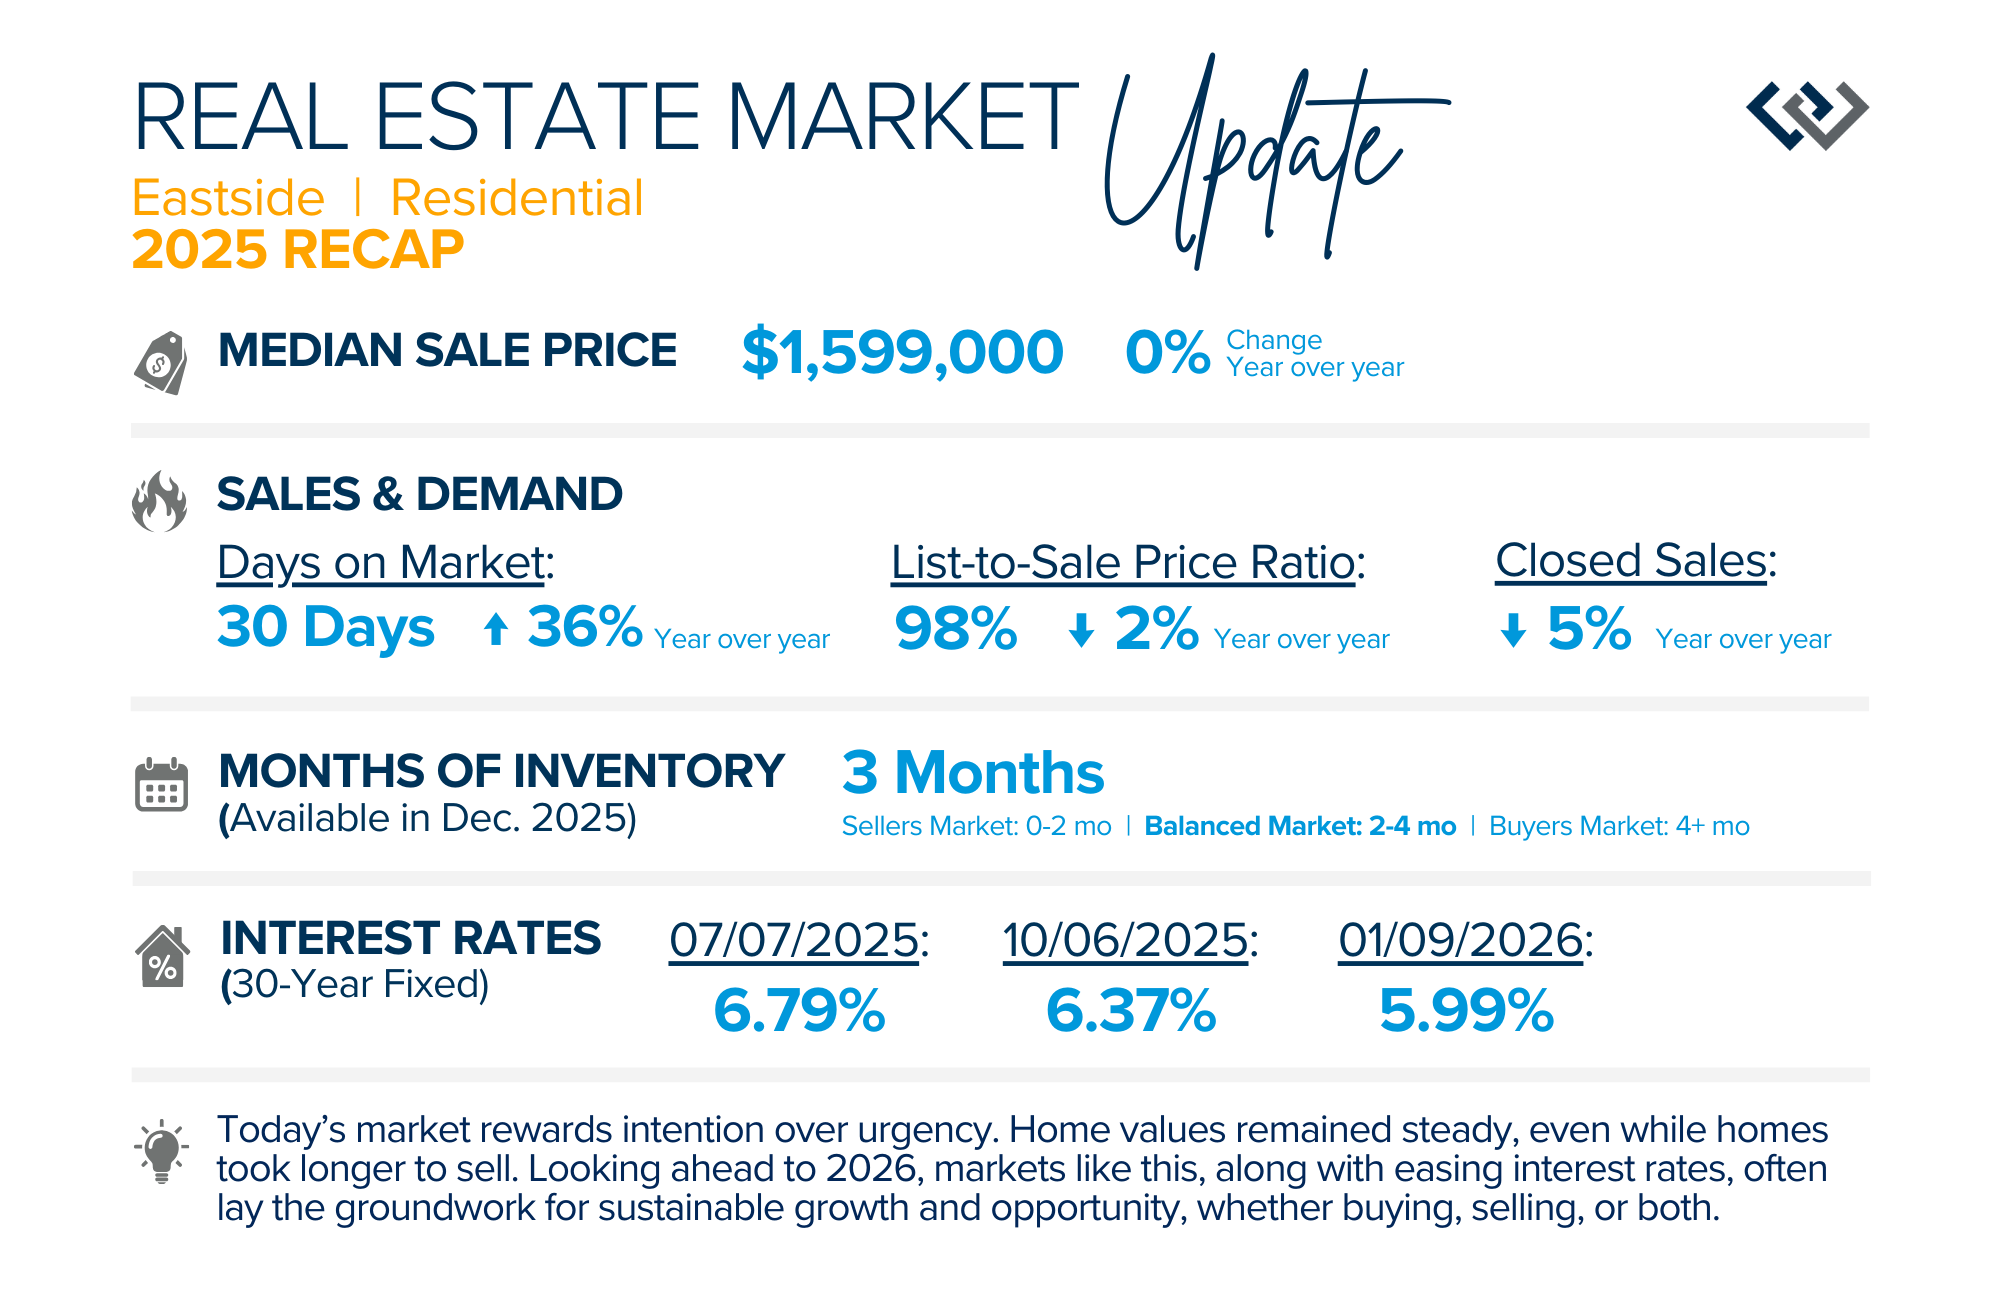
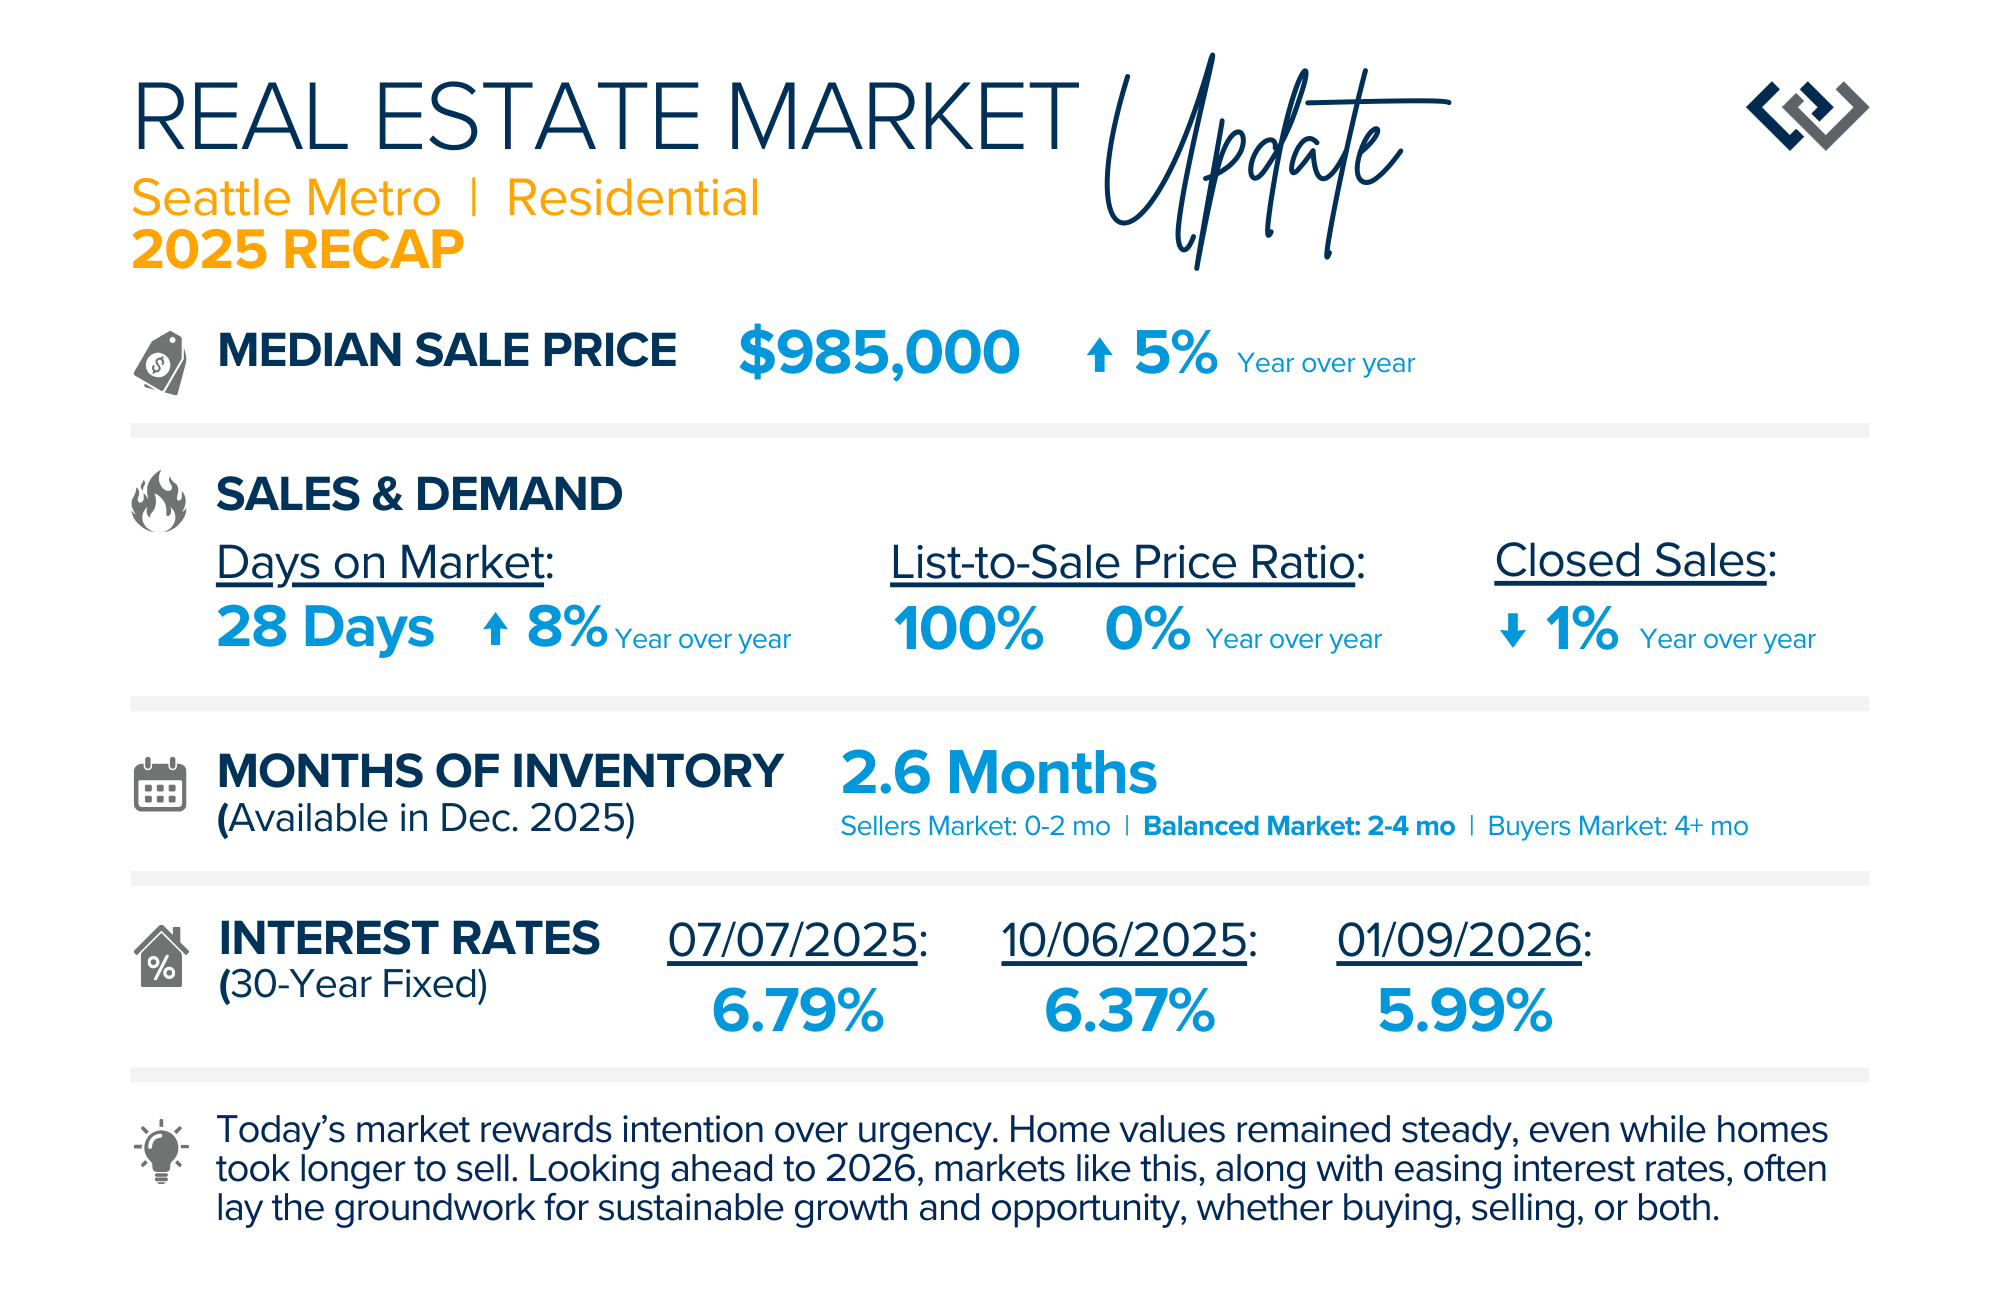
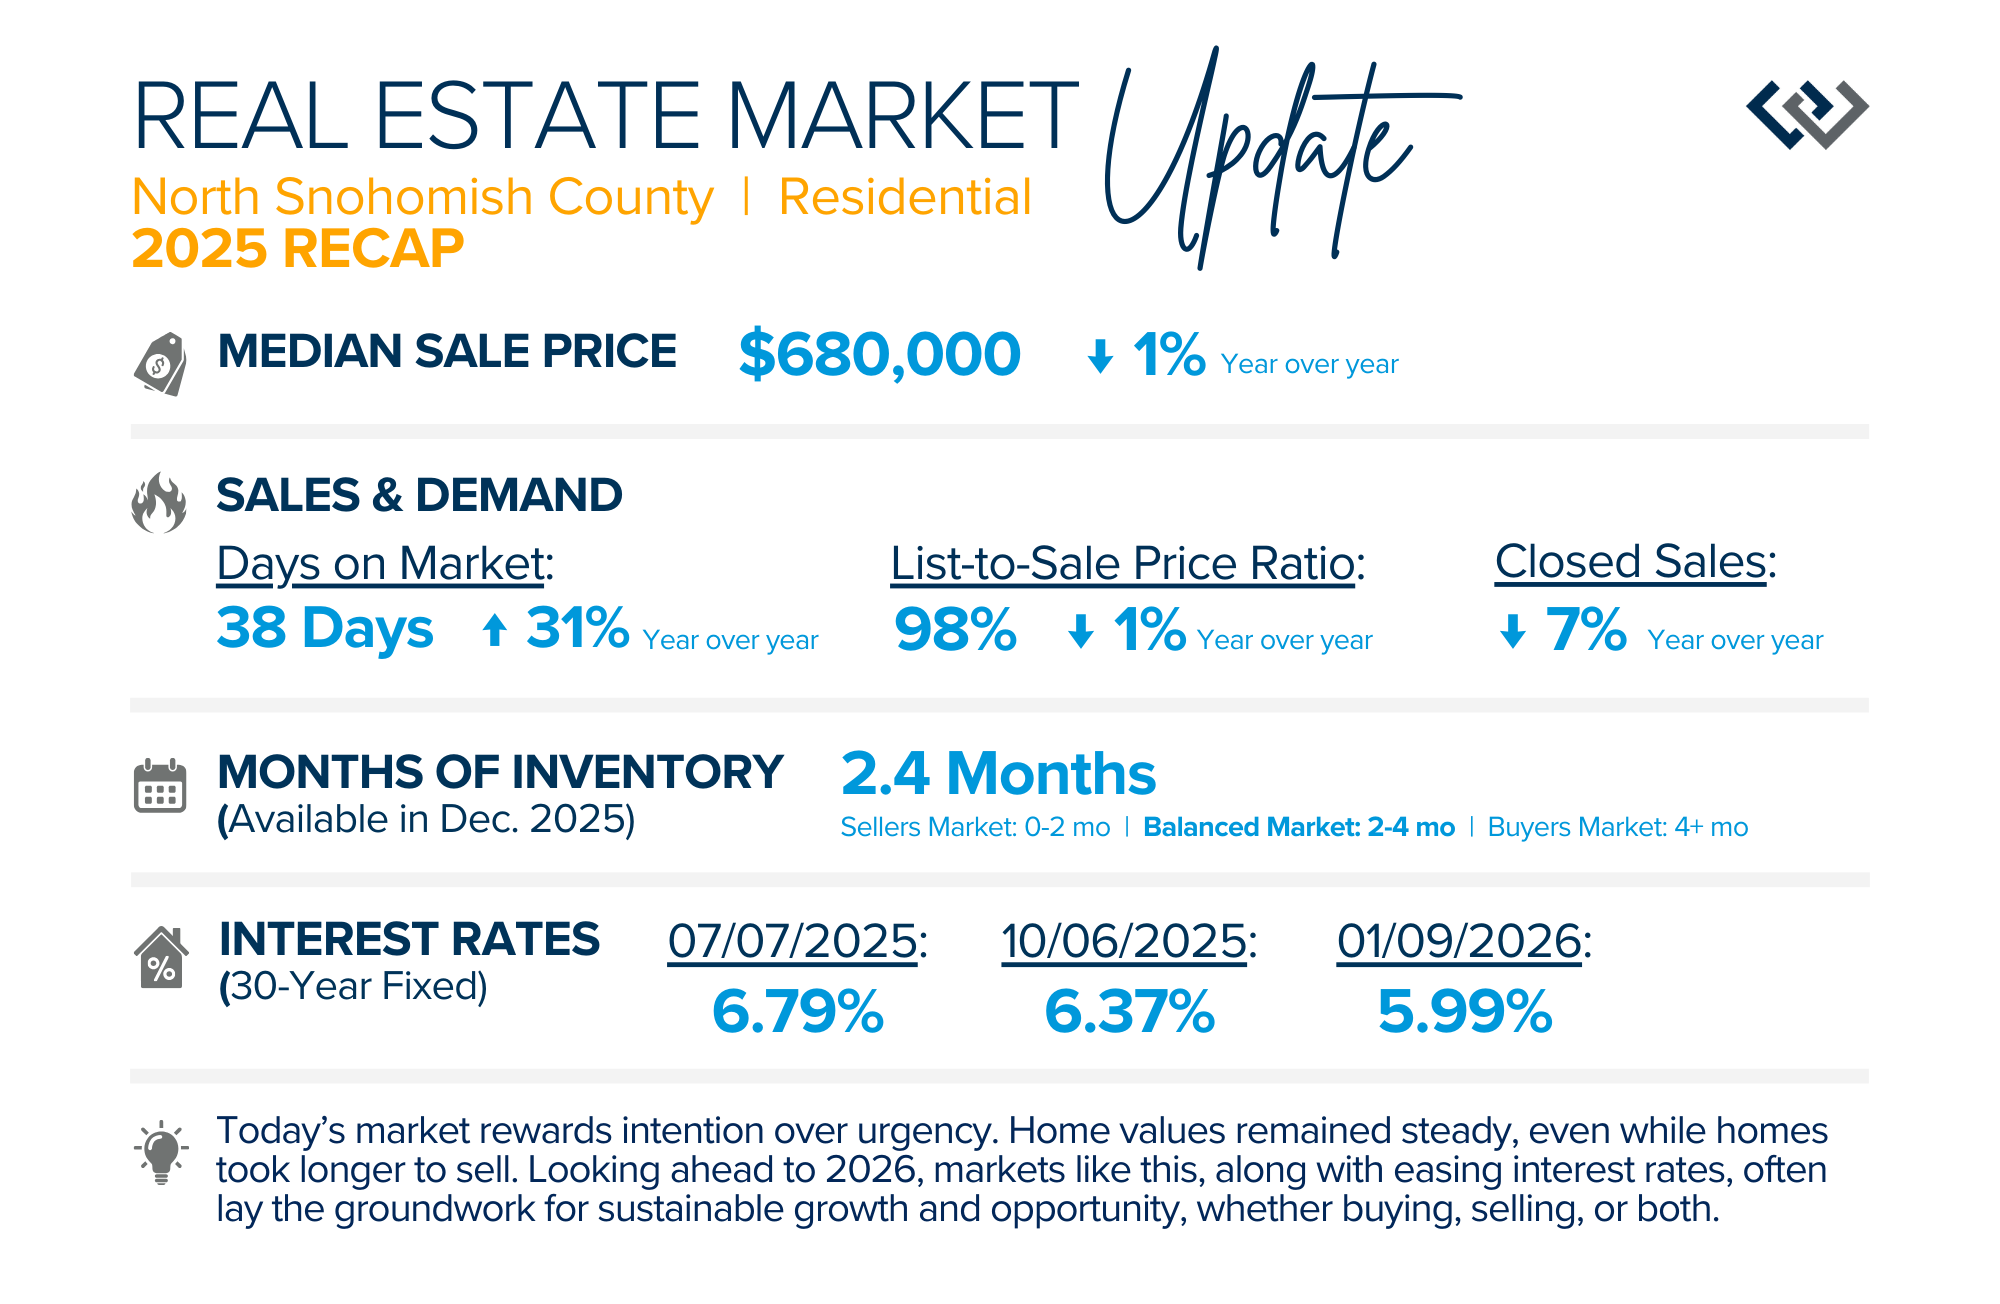
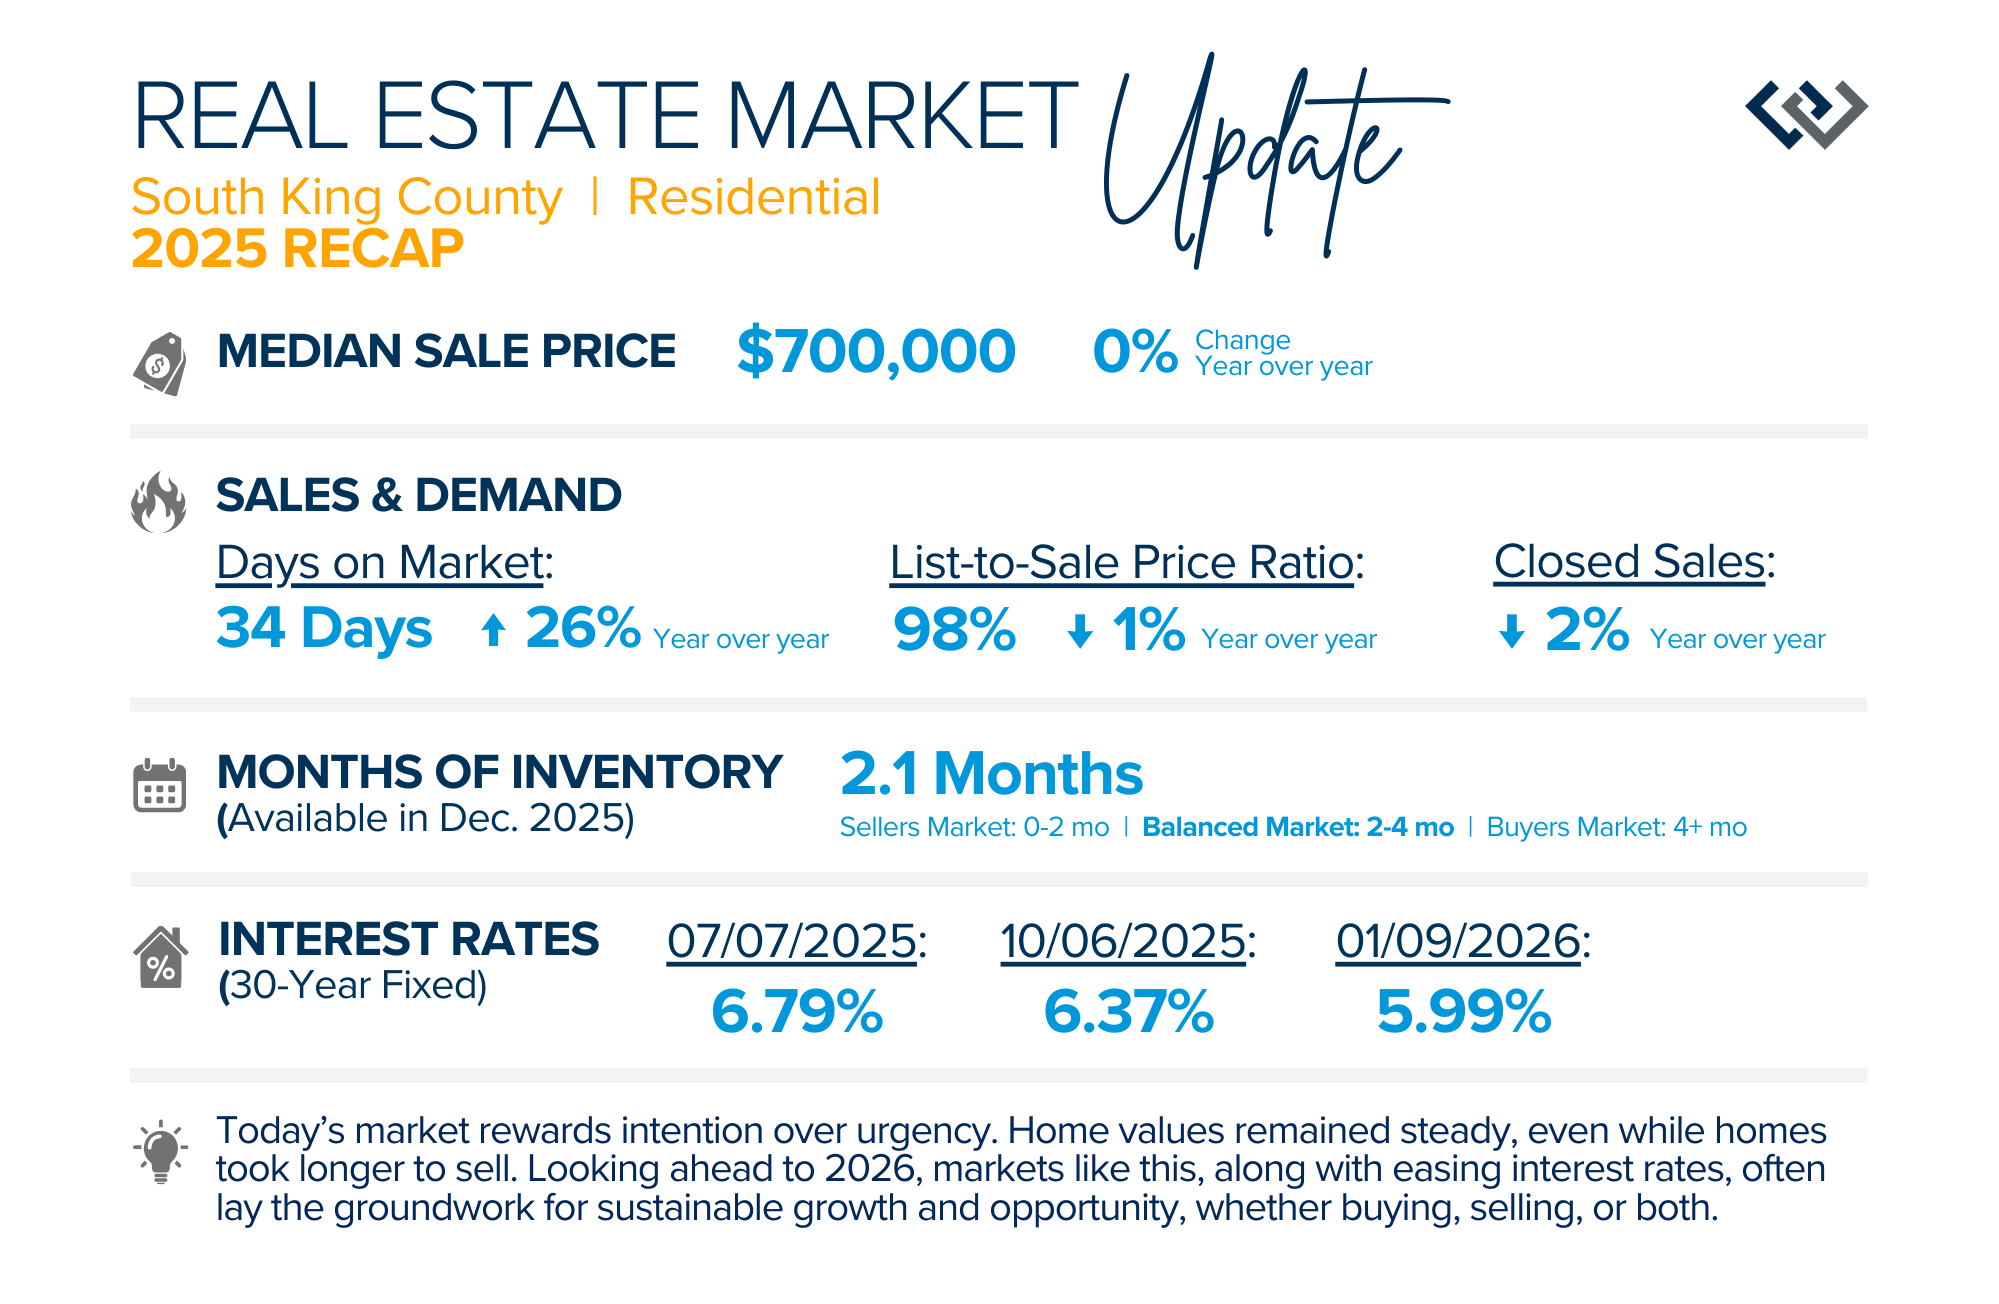
Today’s market rewards intention over urgency. Throughout 2025, sellers who focused on thoughtful preparation, strategic pricing, and strong presentation continued to achieve solid outcomes—even as buyers became more selective. Home values largely held steady even while homes generally took a bit longer to sell; this reflected more selective buyers, not a lack of demand. Buyers benefited from more balanced conditions, with greater opportunity to evaluate options, negotiate thoughtfully, and make confident decisions. As mortgage rates showed signs of easing and competition normalized, the market shifted away from extremes and back toward fundamentals.
Looking ahead to 2026, markets like this often lay the groundwork for sustainable growth and opportunities — whether buying, selling, or both. If you are curious how your goals align with the trends, please reach out. It is always our goal to educate to empower strong decisions.
QUARTERLY REPORTS Q3 2025

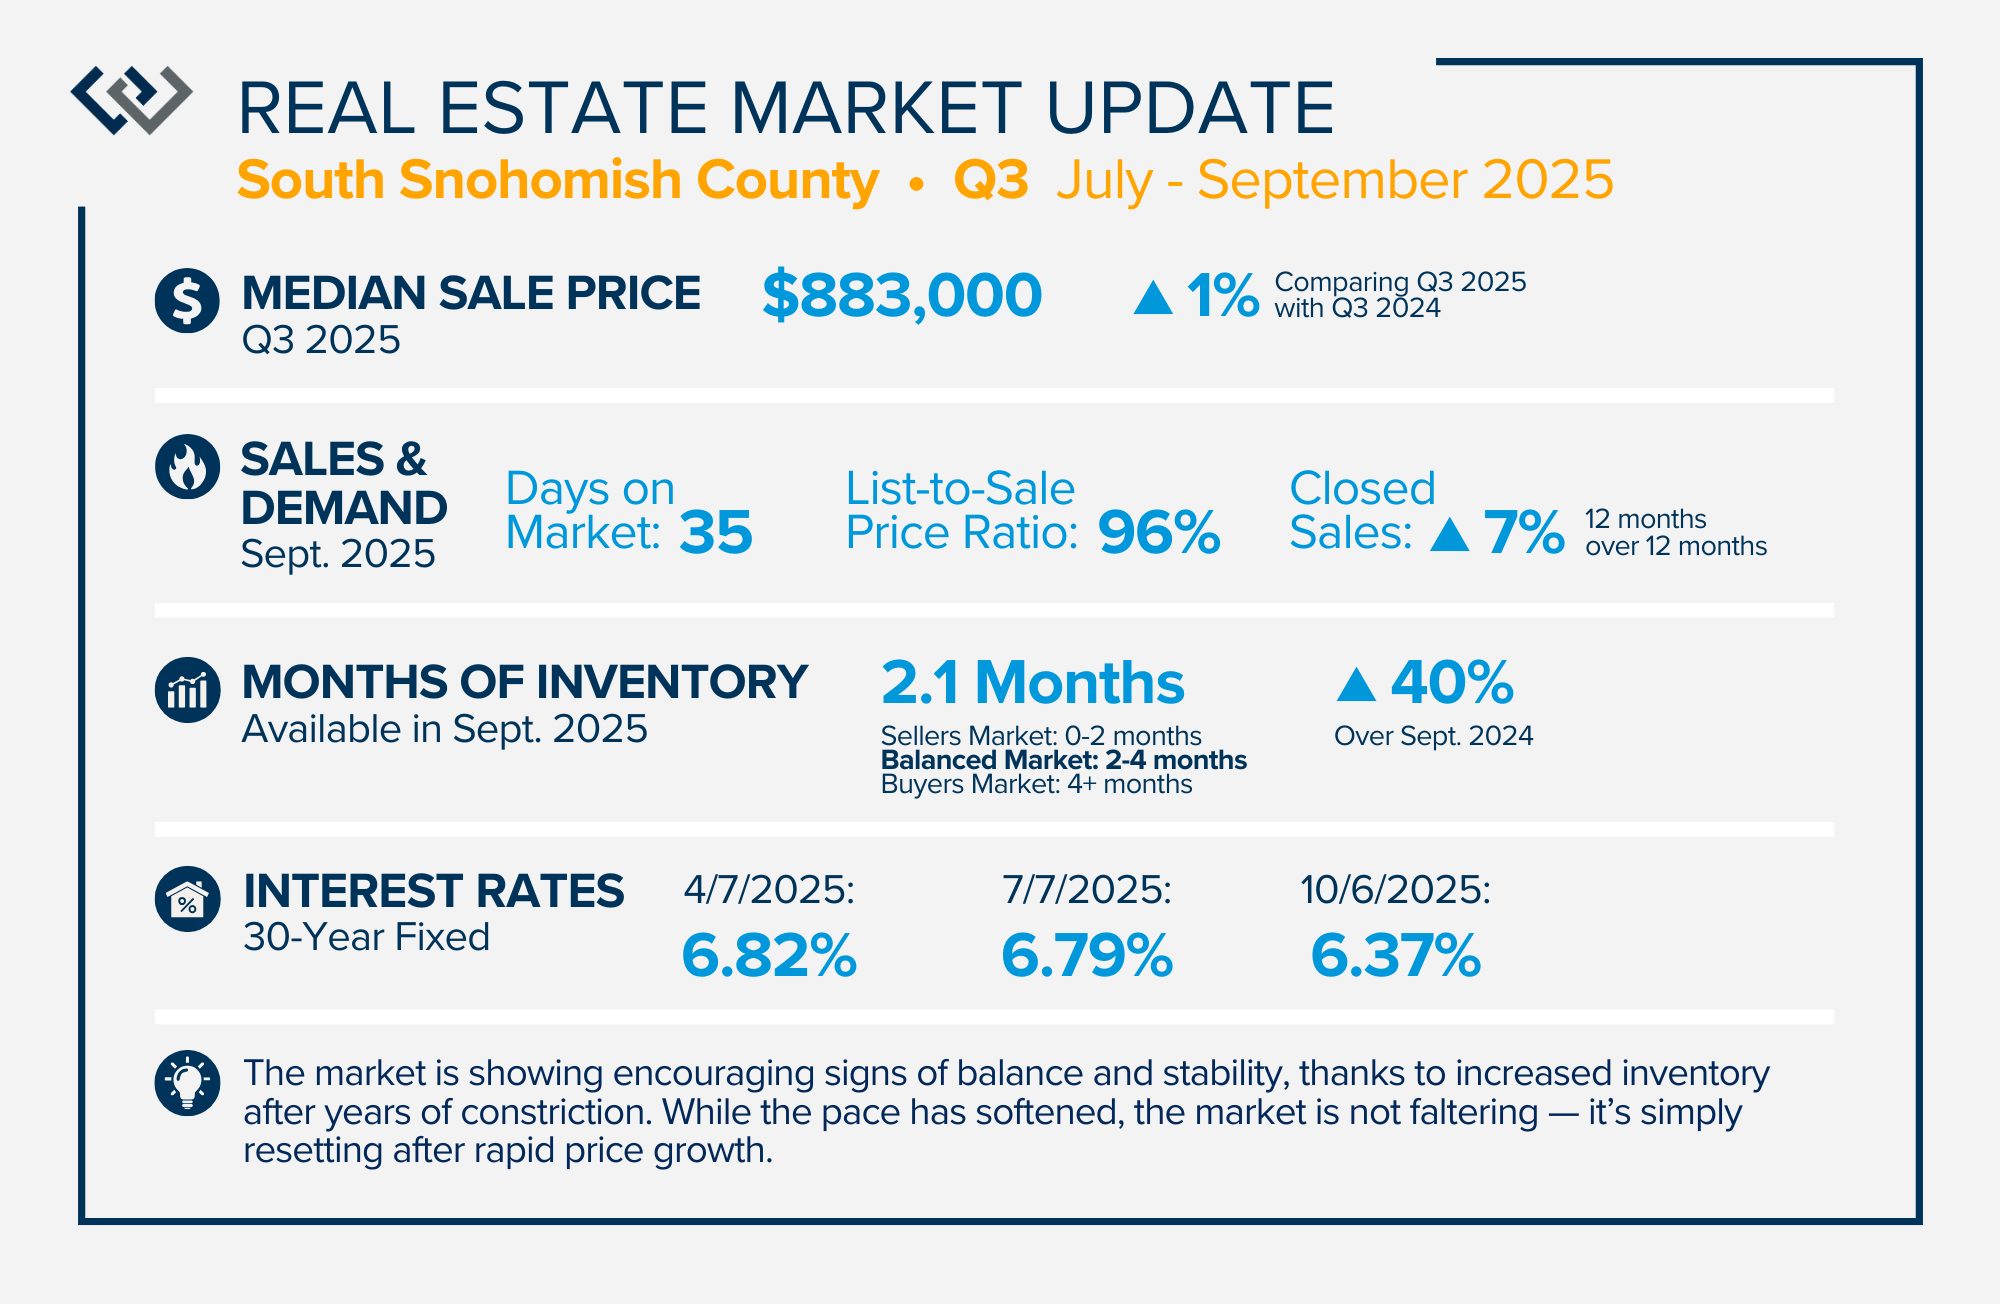
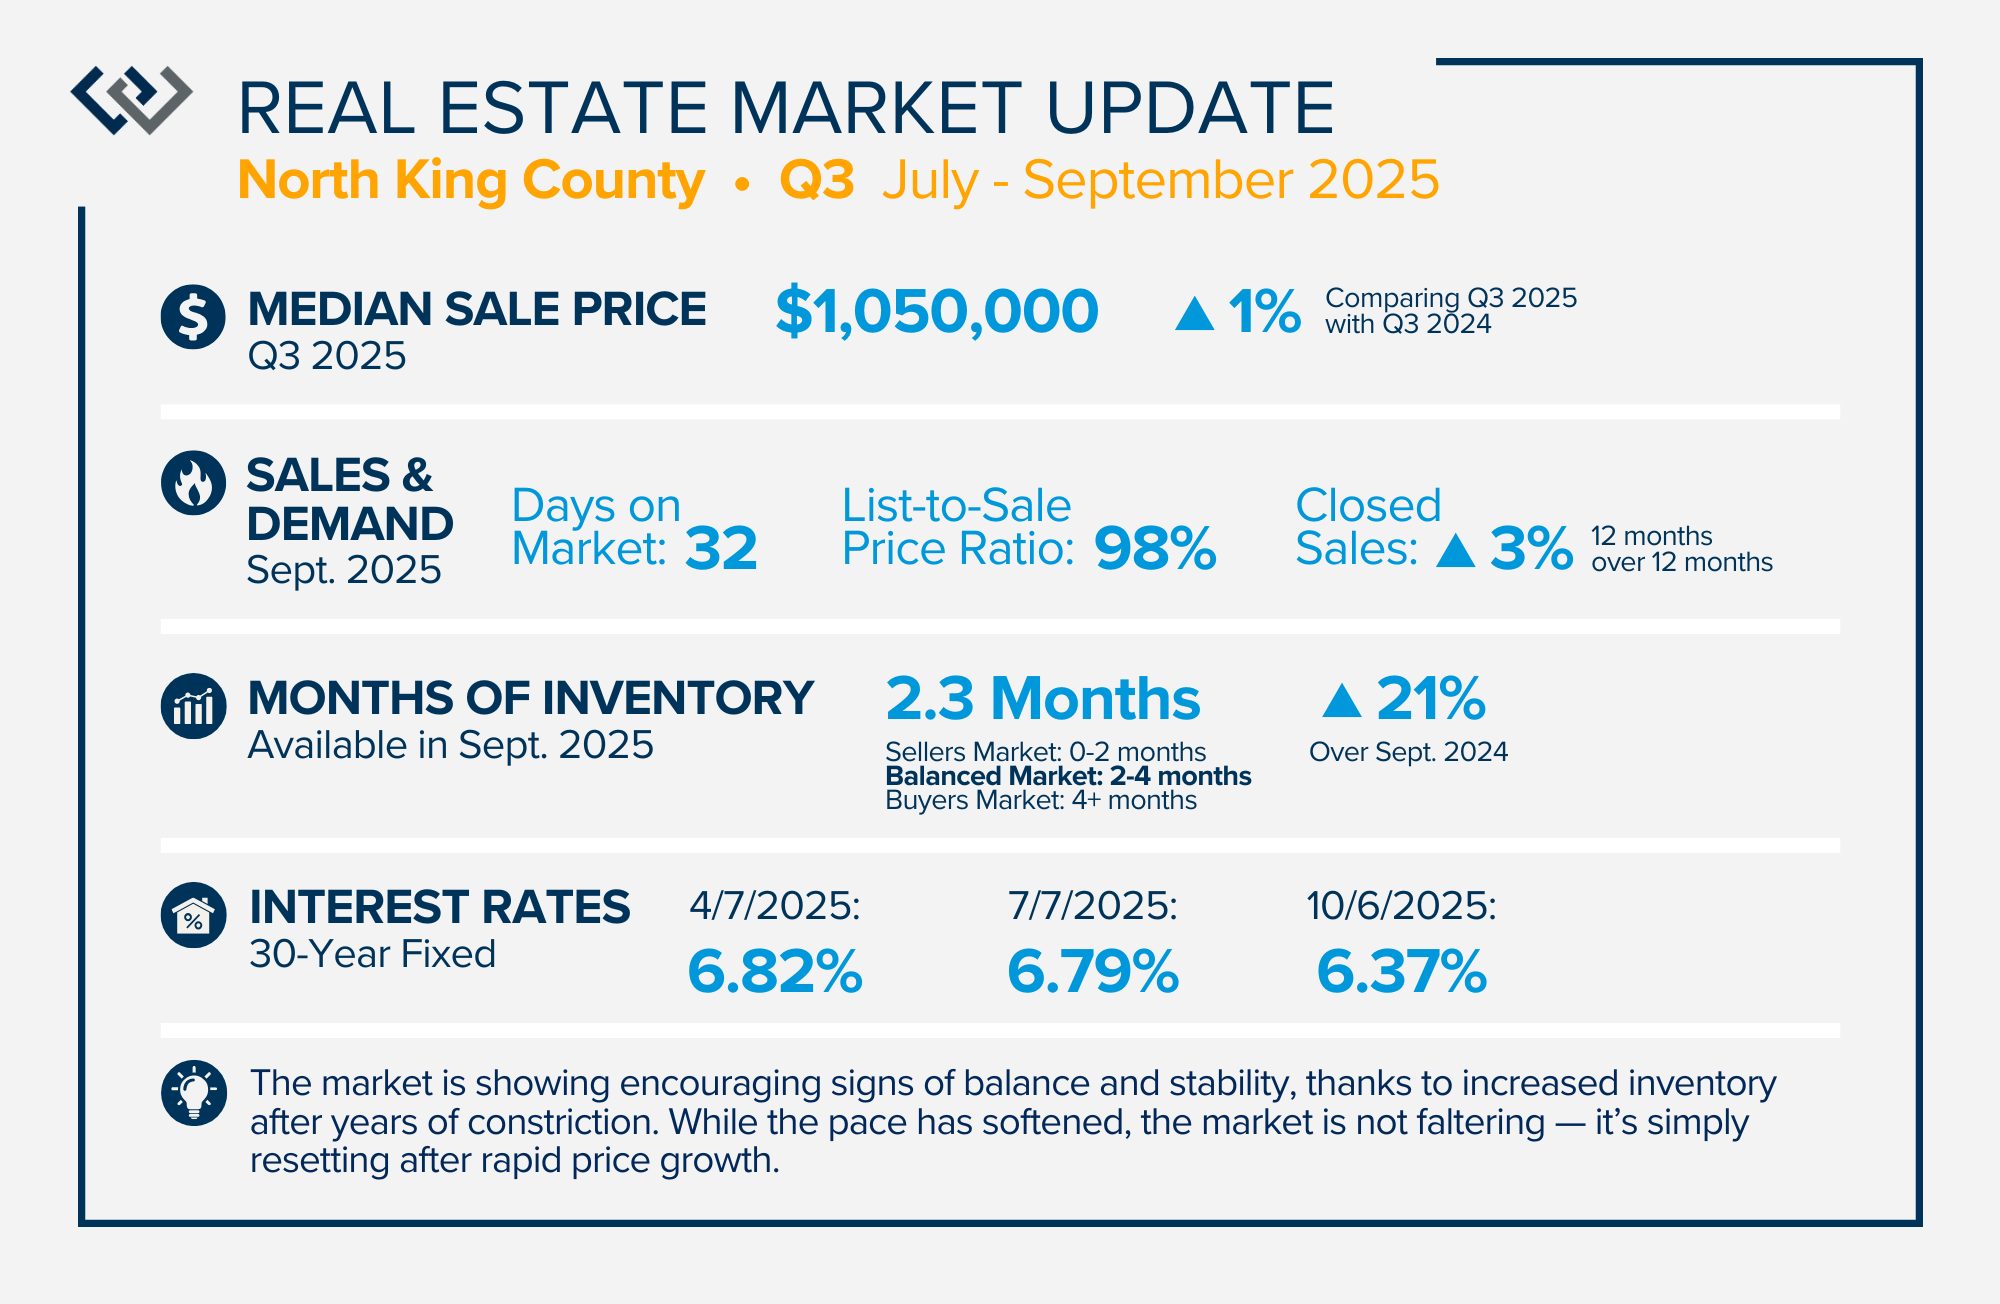
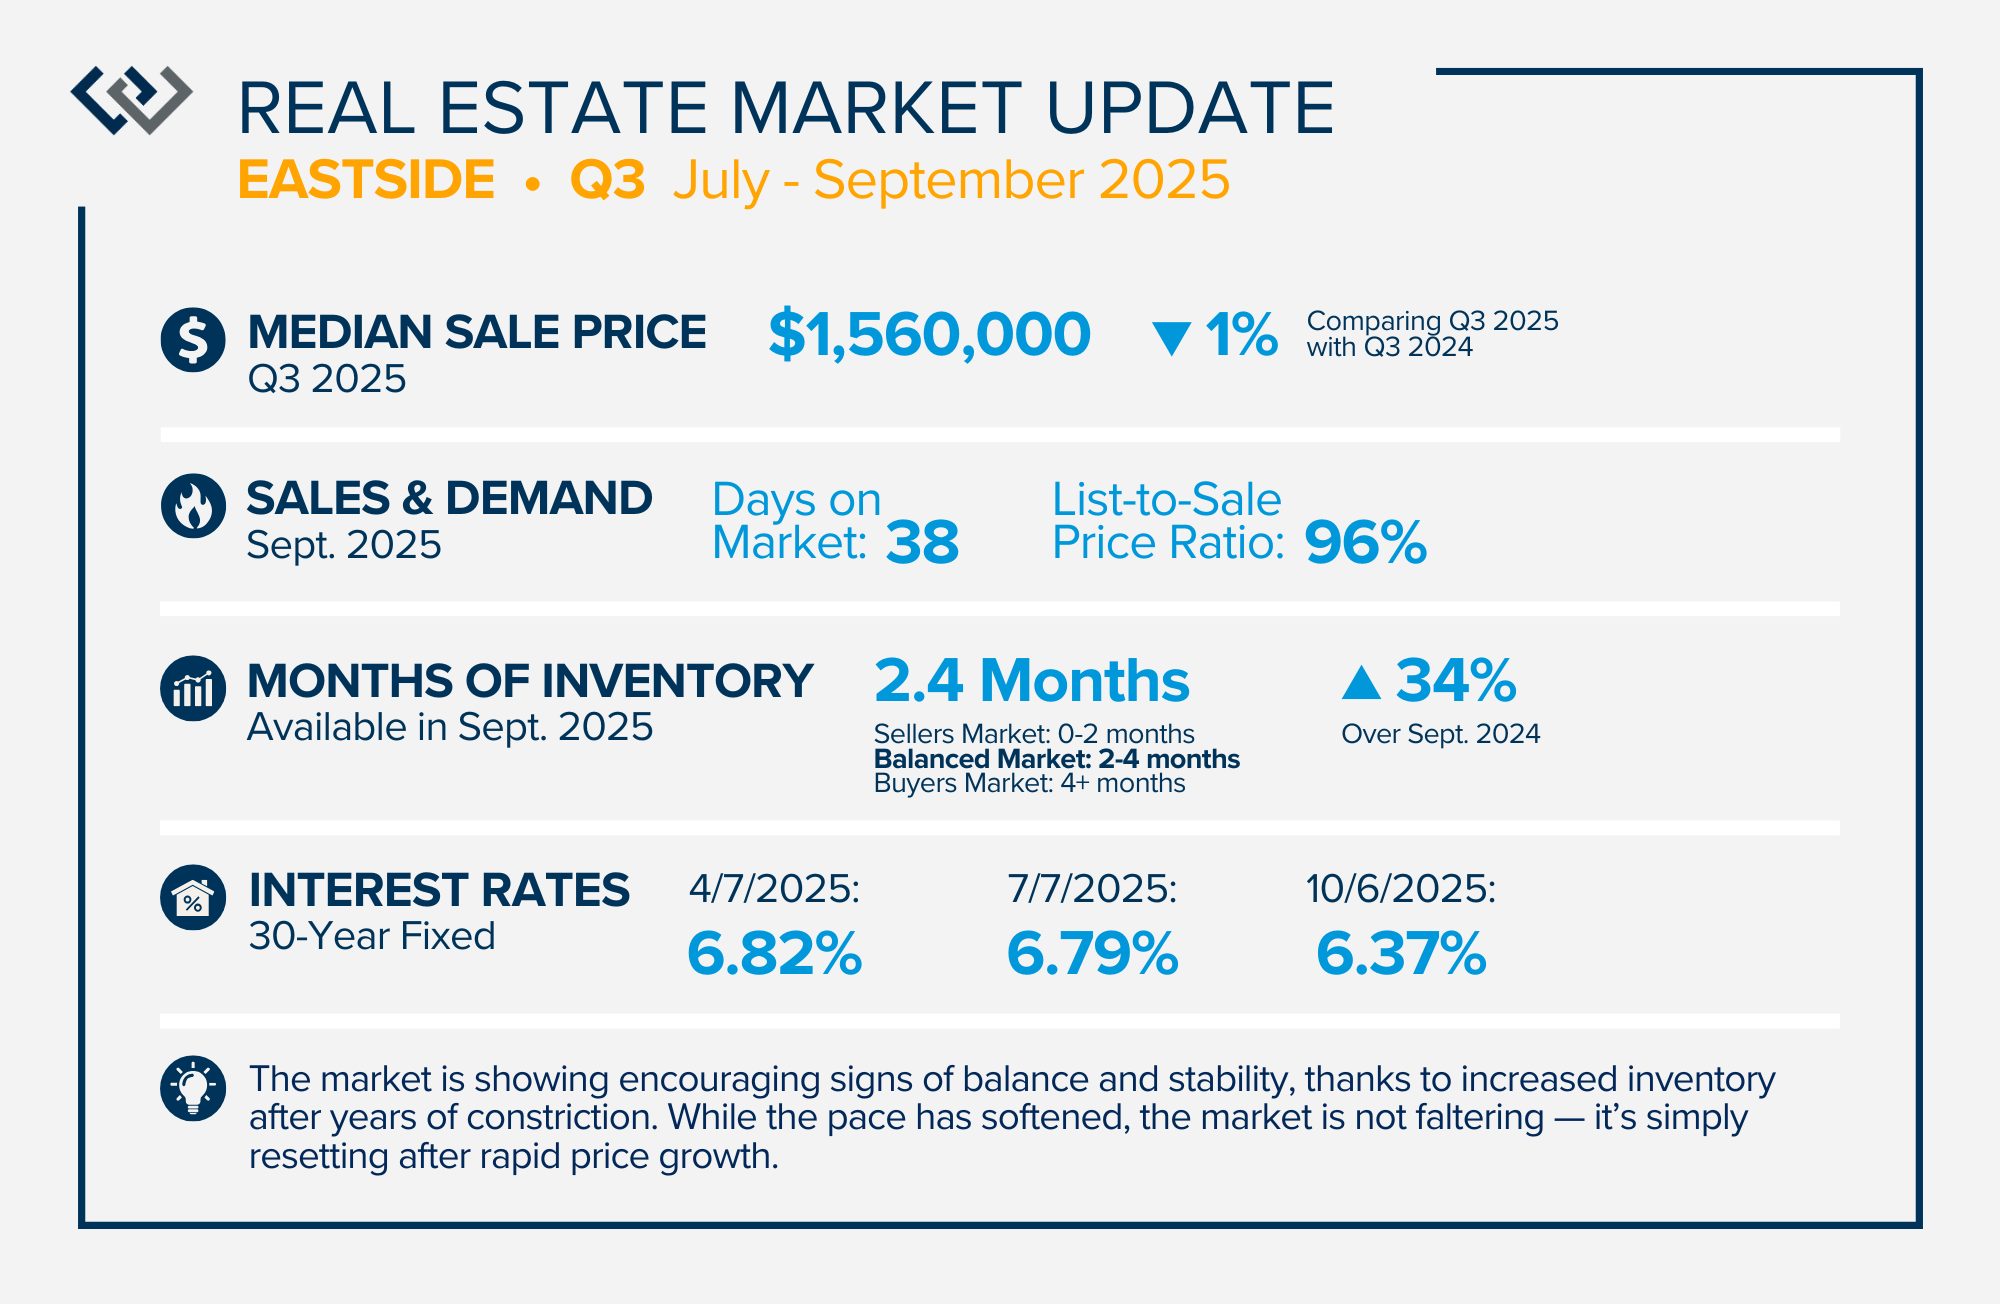
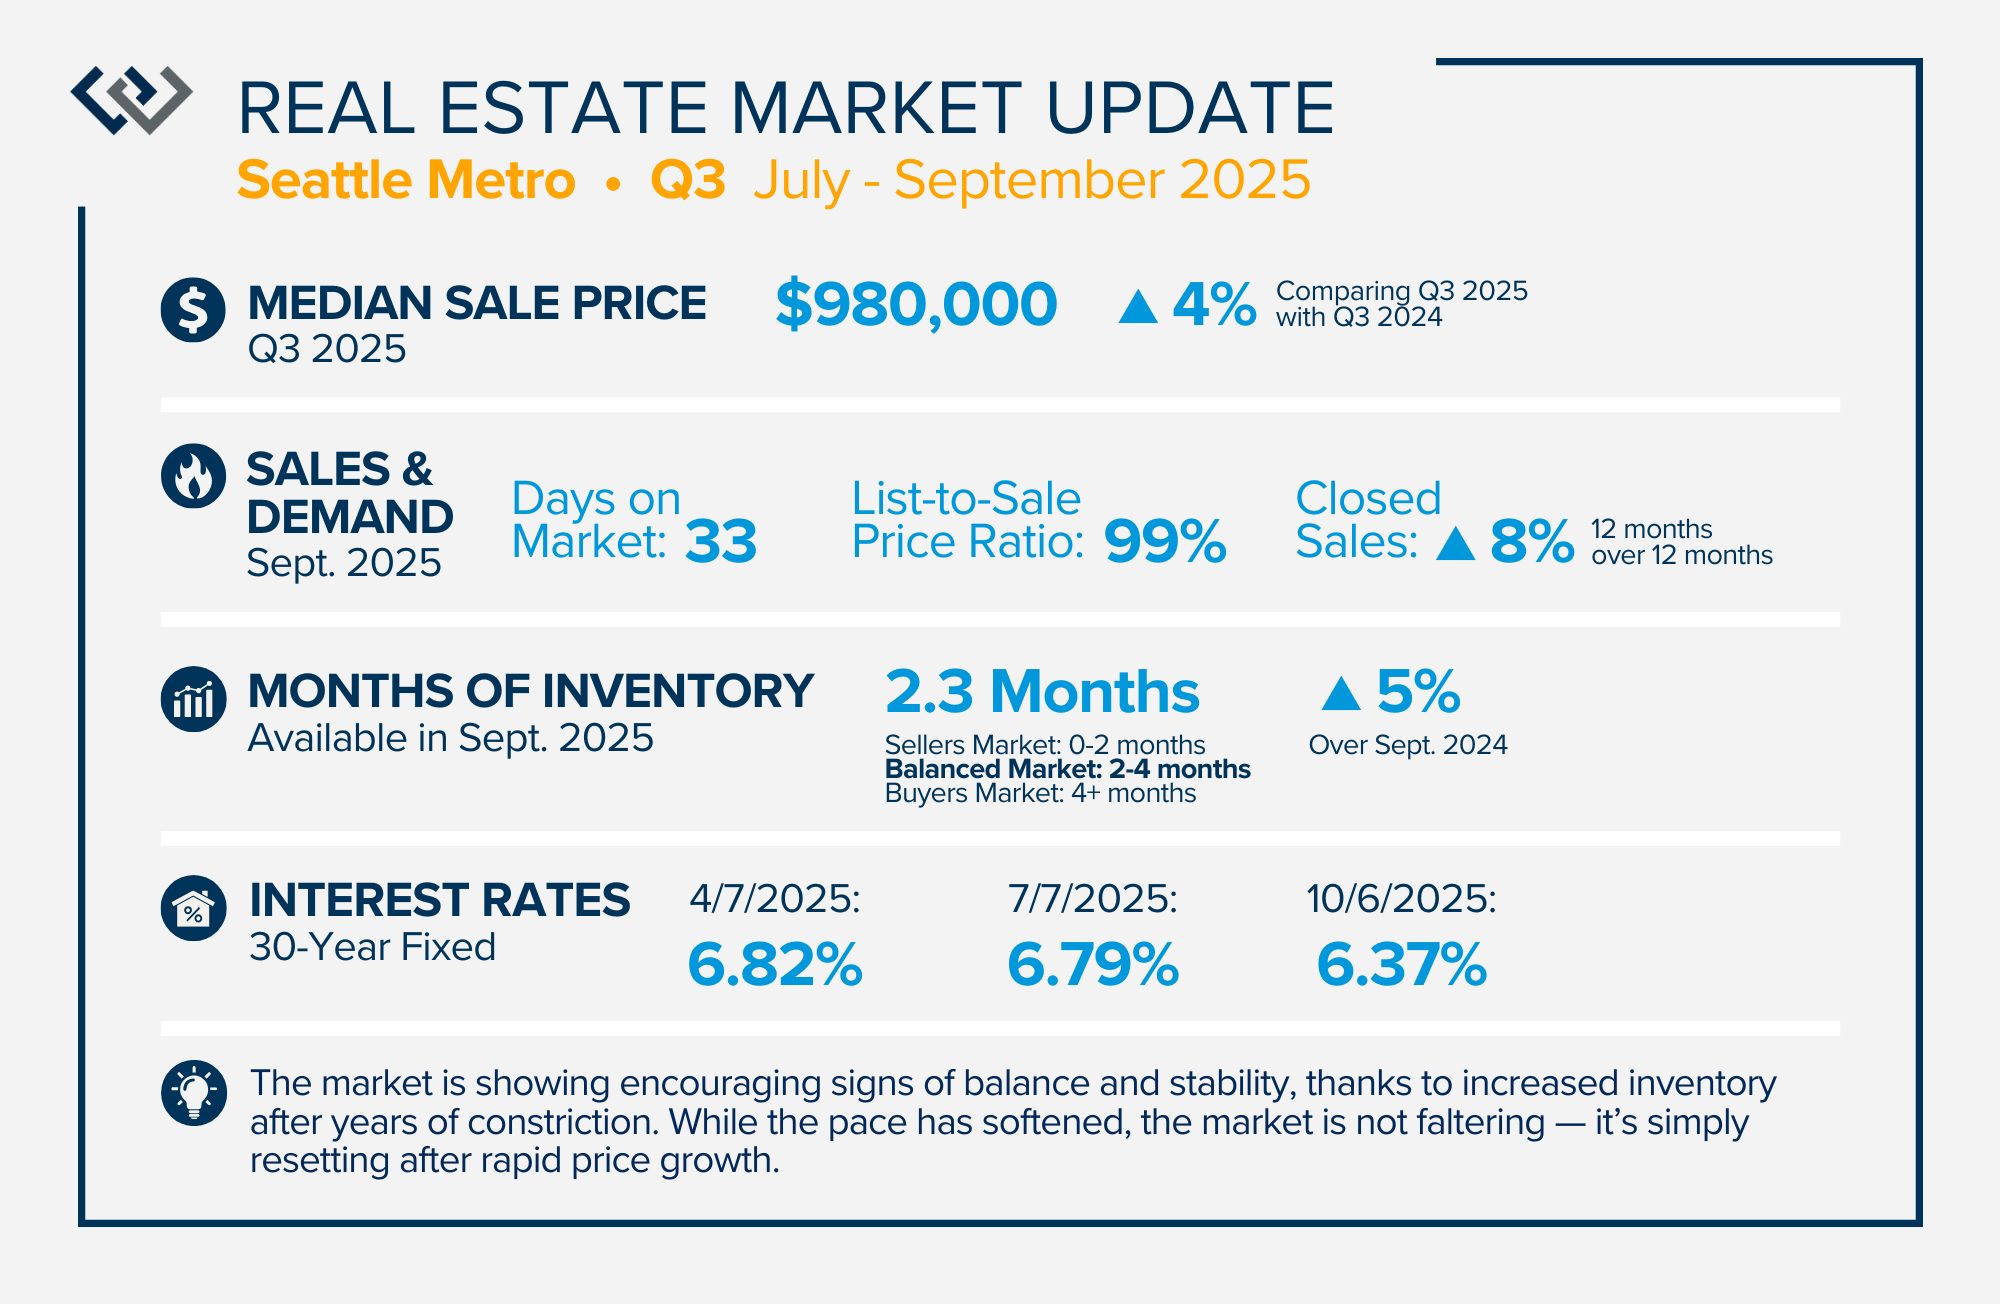
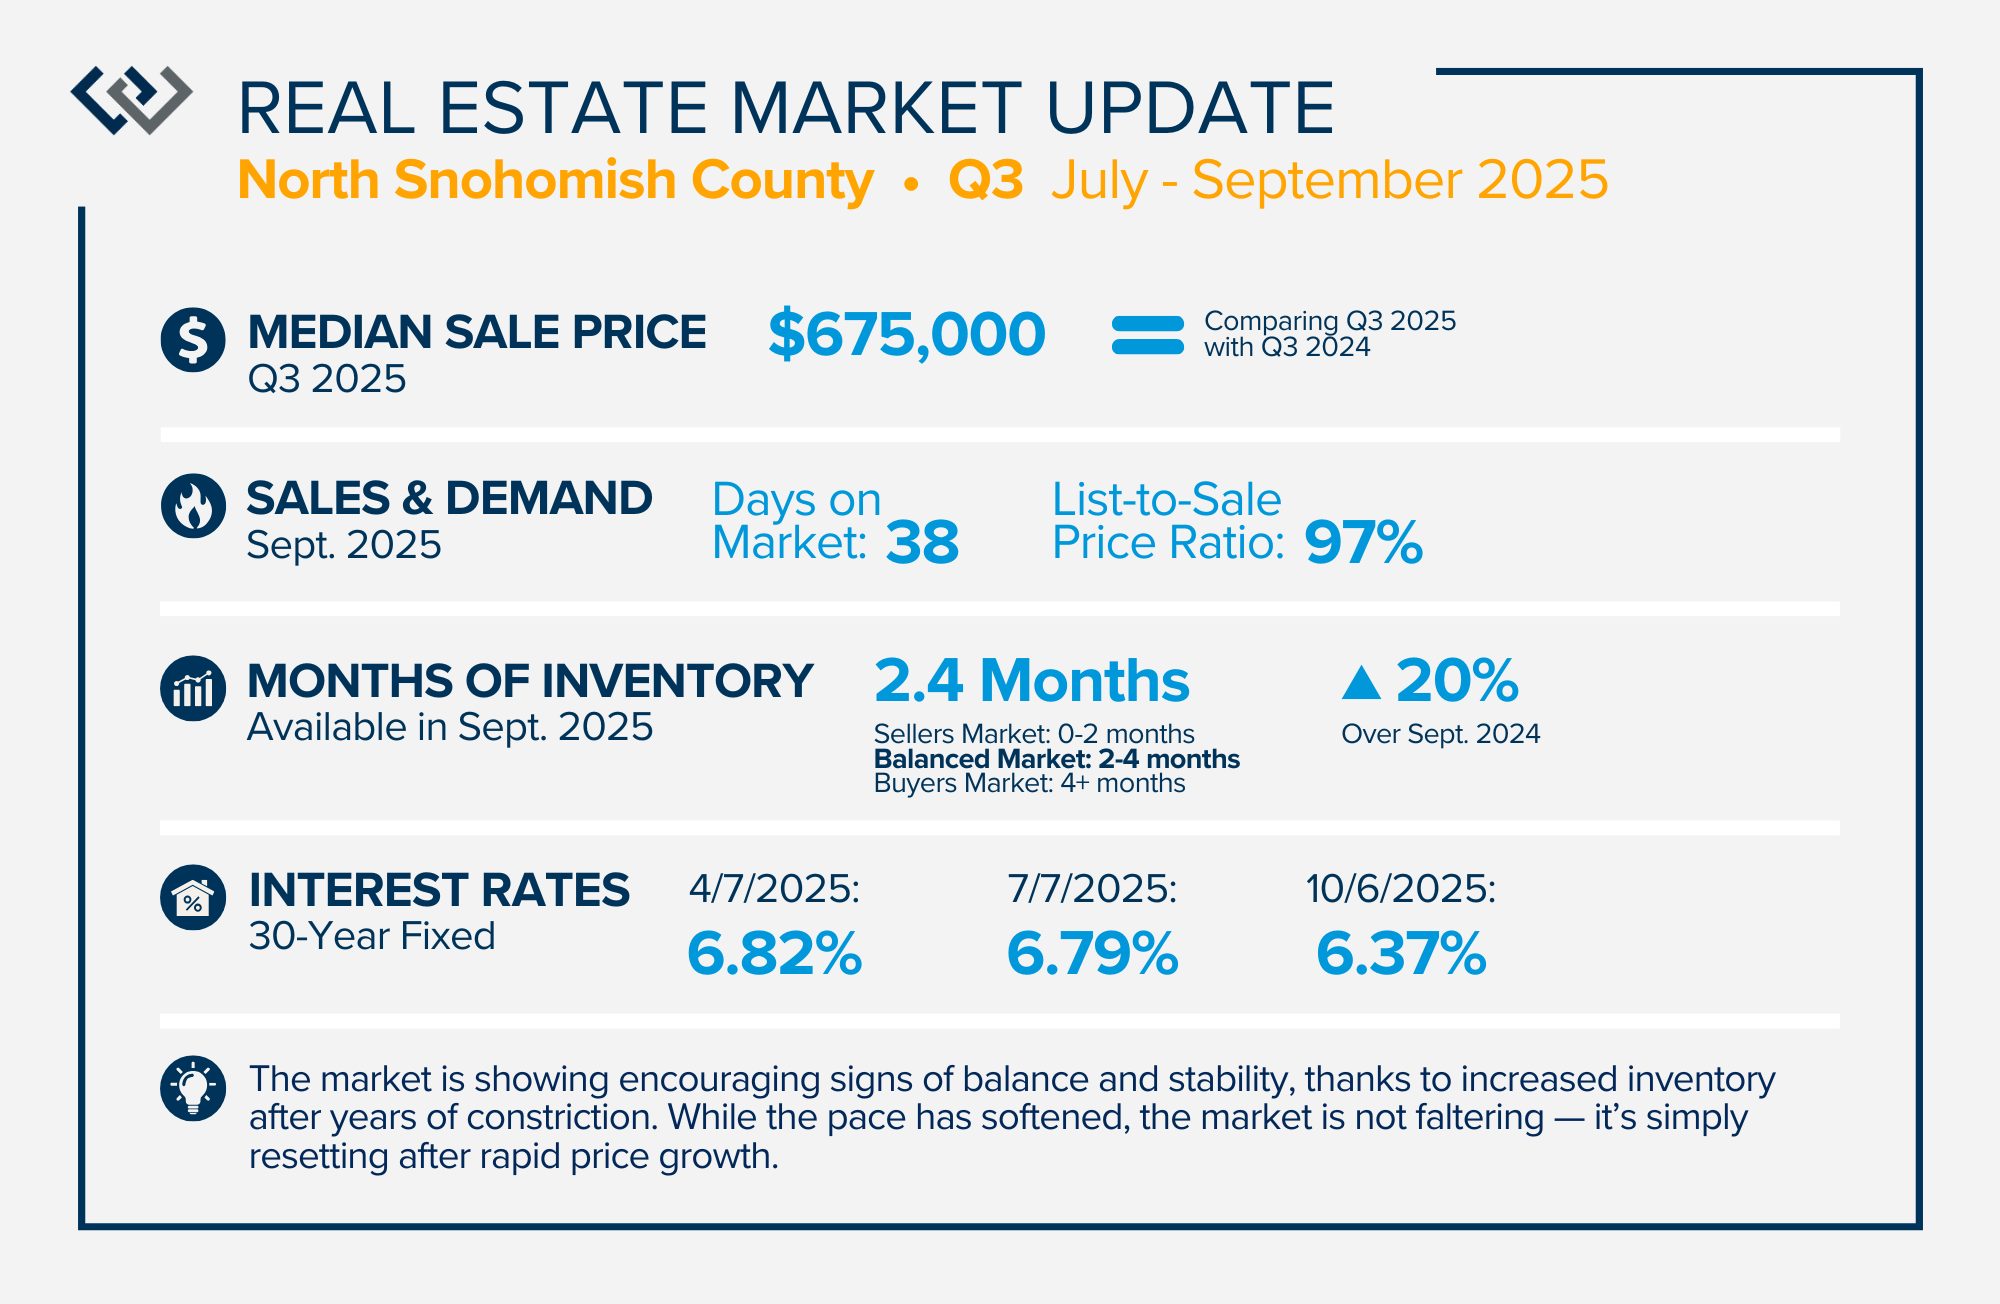
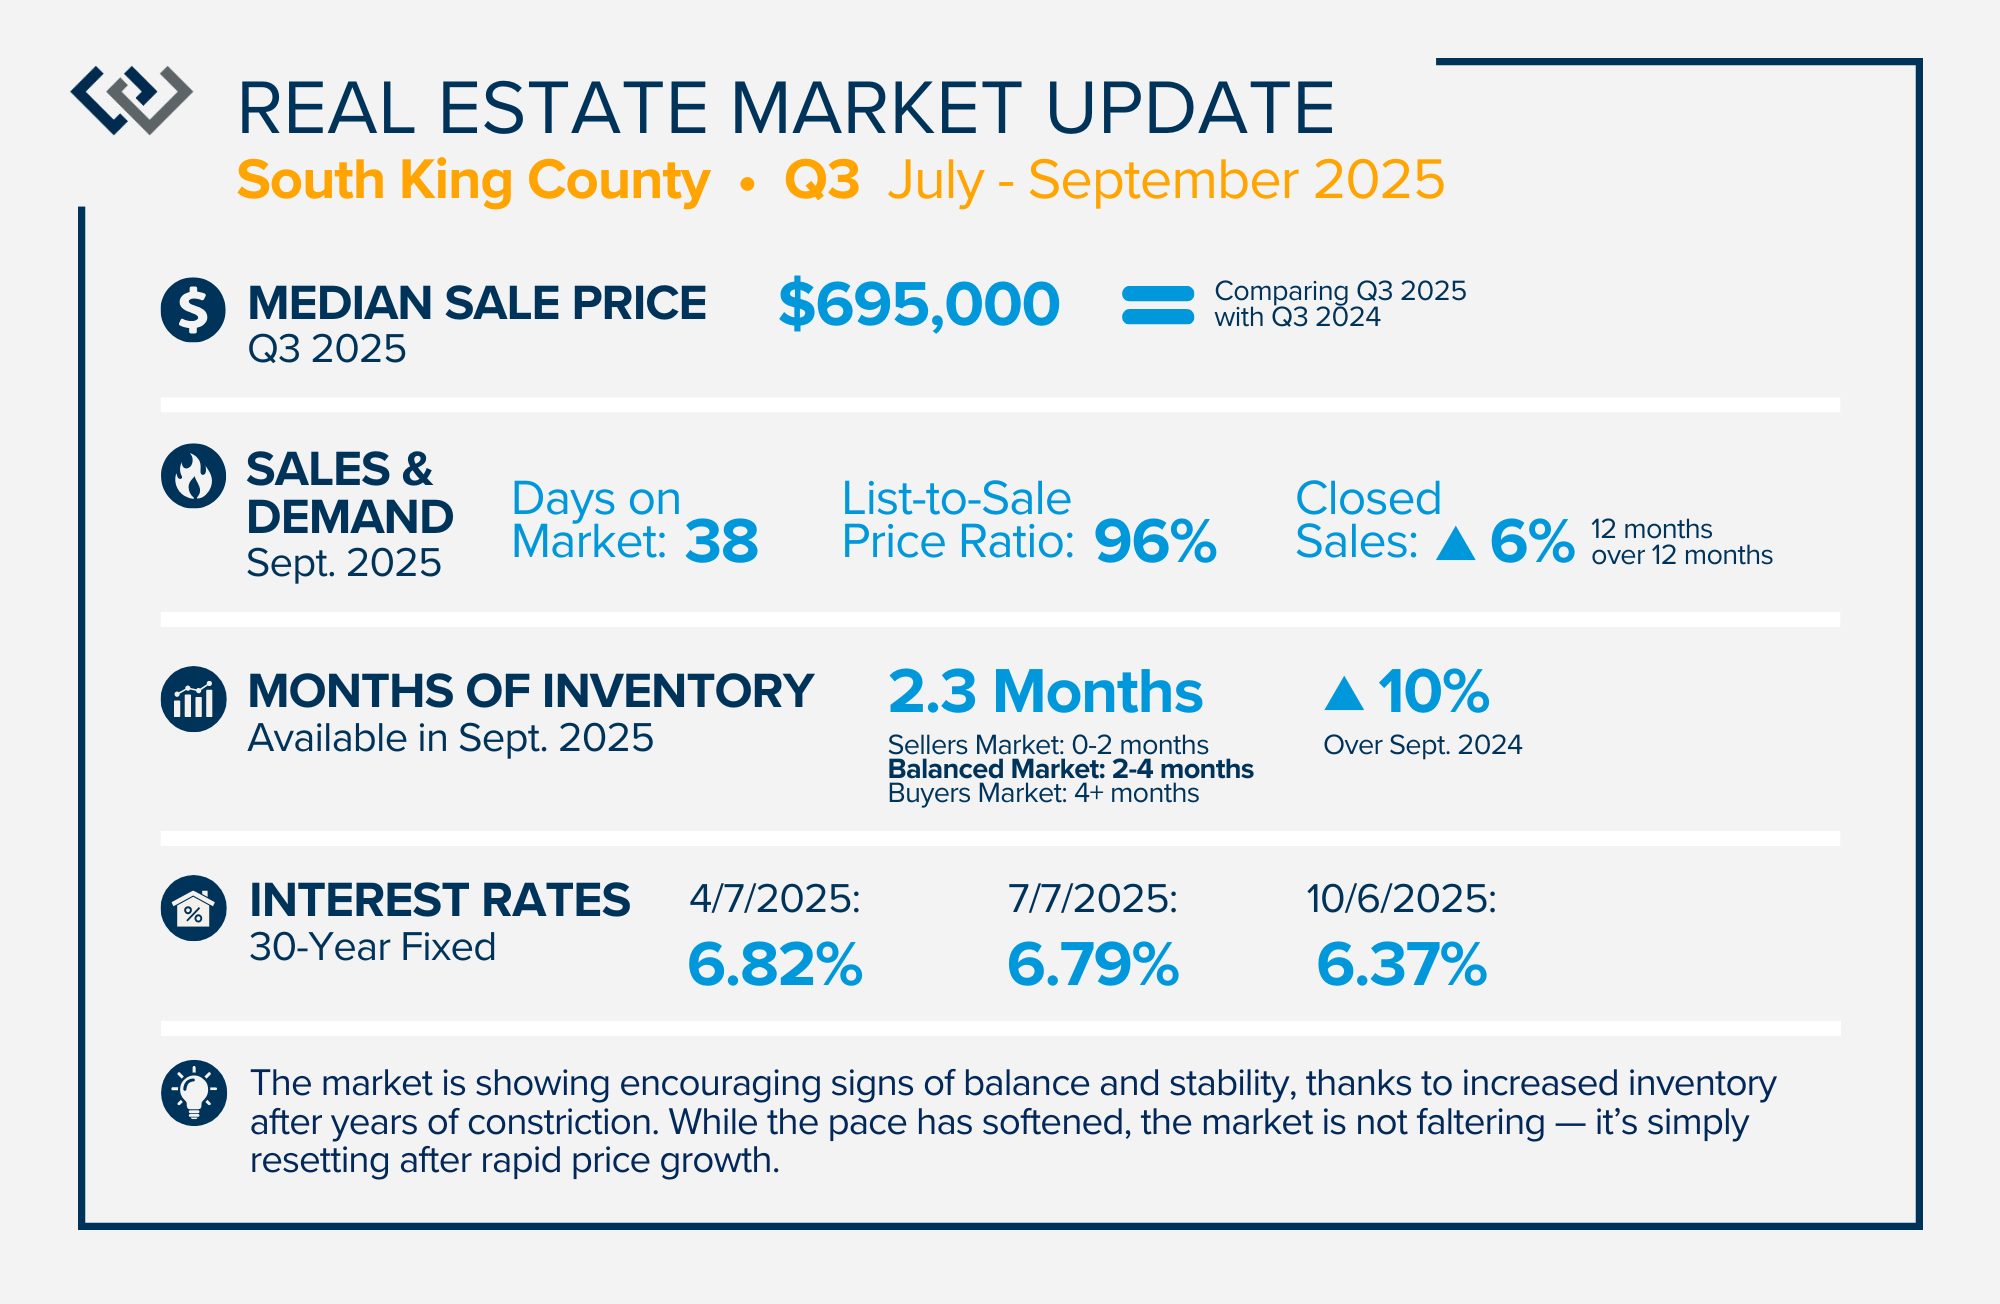
The market is showing encouraging signs of balance and stability, thanks to increased inventory after years of constriction. While the pace has softened, the market is not faltering; it’s simply resetting after rapid price growth. Even with more homes to choose from, the median sale price remains steady year-over-year, and homeowner equity levels are at record highs.
More selection means sellers need to be intentional about property condition and pricing. Now, buyers have breathing room to make thoughtful decisions without frantic competition and are benefiting from easing interest rates and slower price growth.
For both sides of the market, the advantage now lies in strategy over speed. If you’re curious what this balanced environment means for your goals — whether buying, selling, or simply planning ahead — we’d love to talk through your options.
QUARTERLY REPORTS Q2 2025


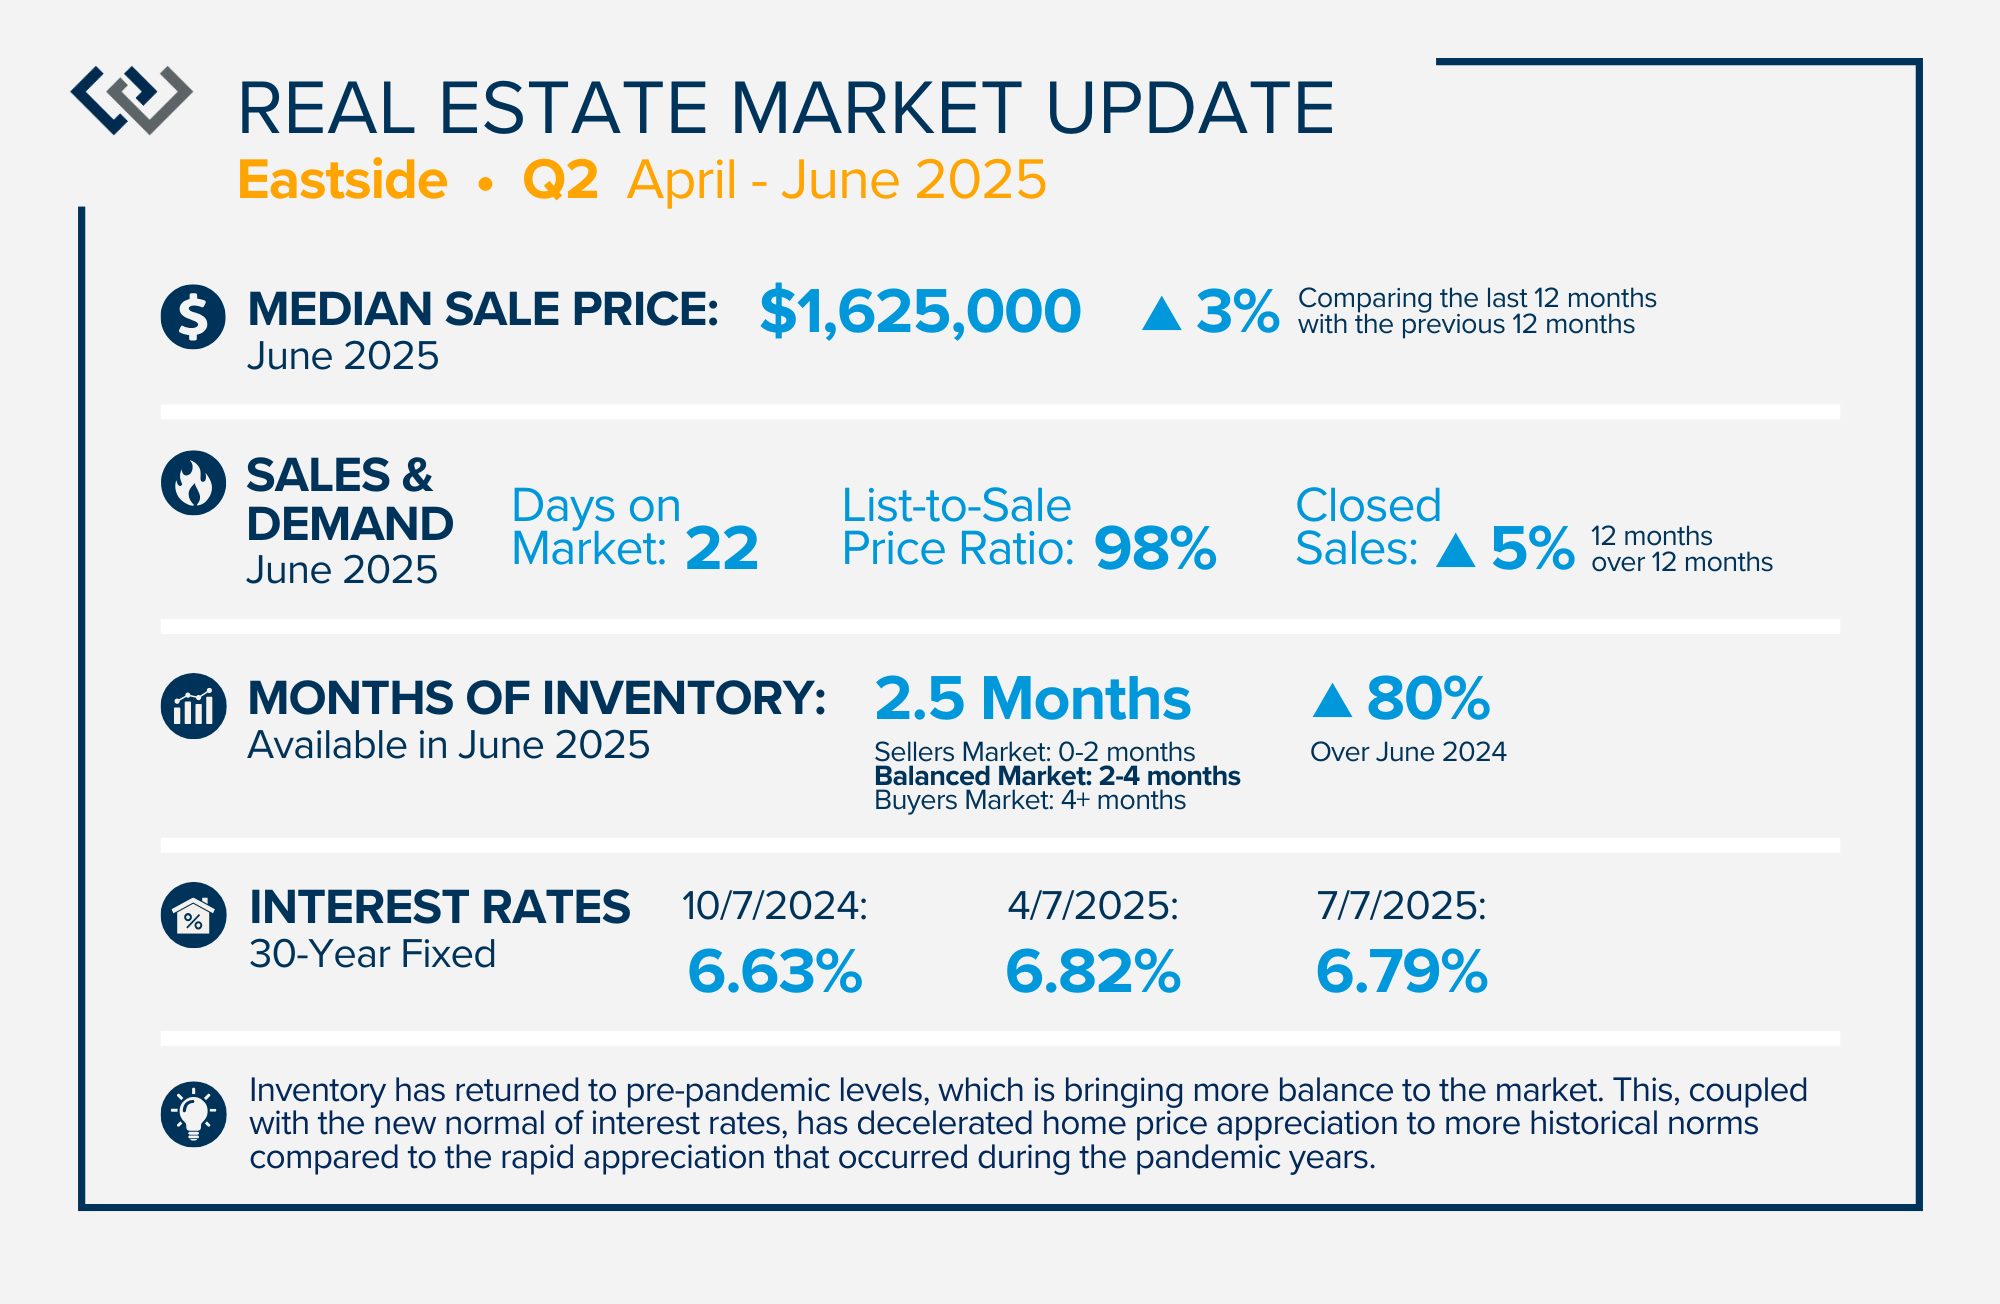
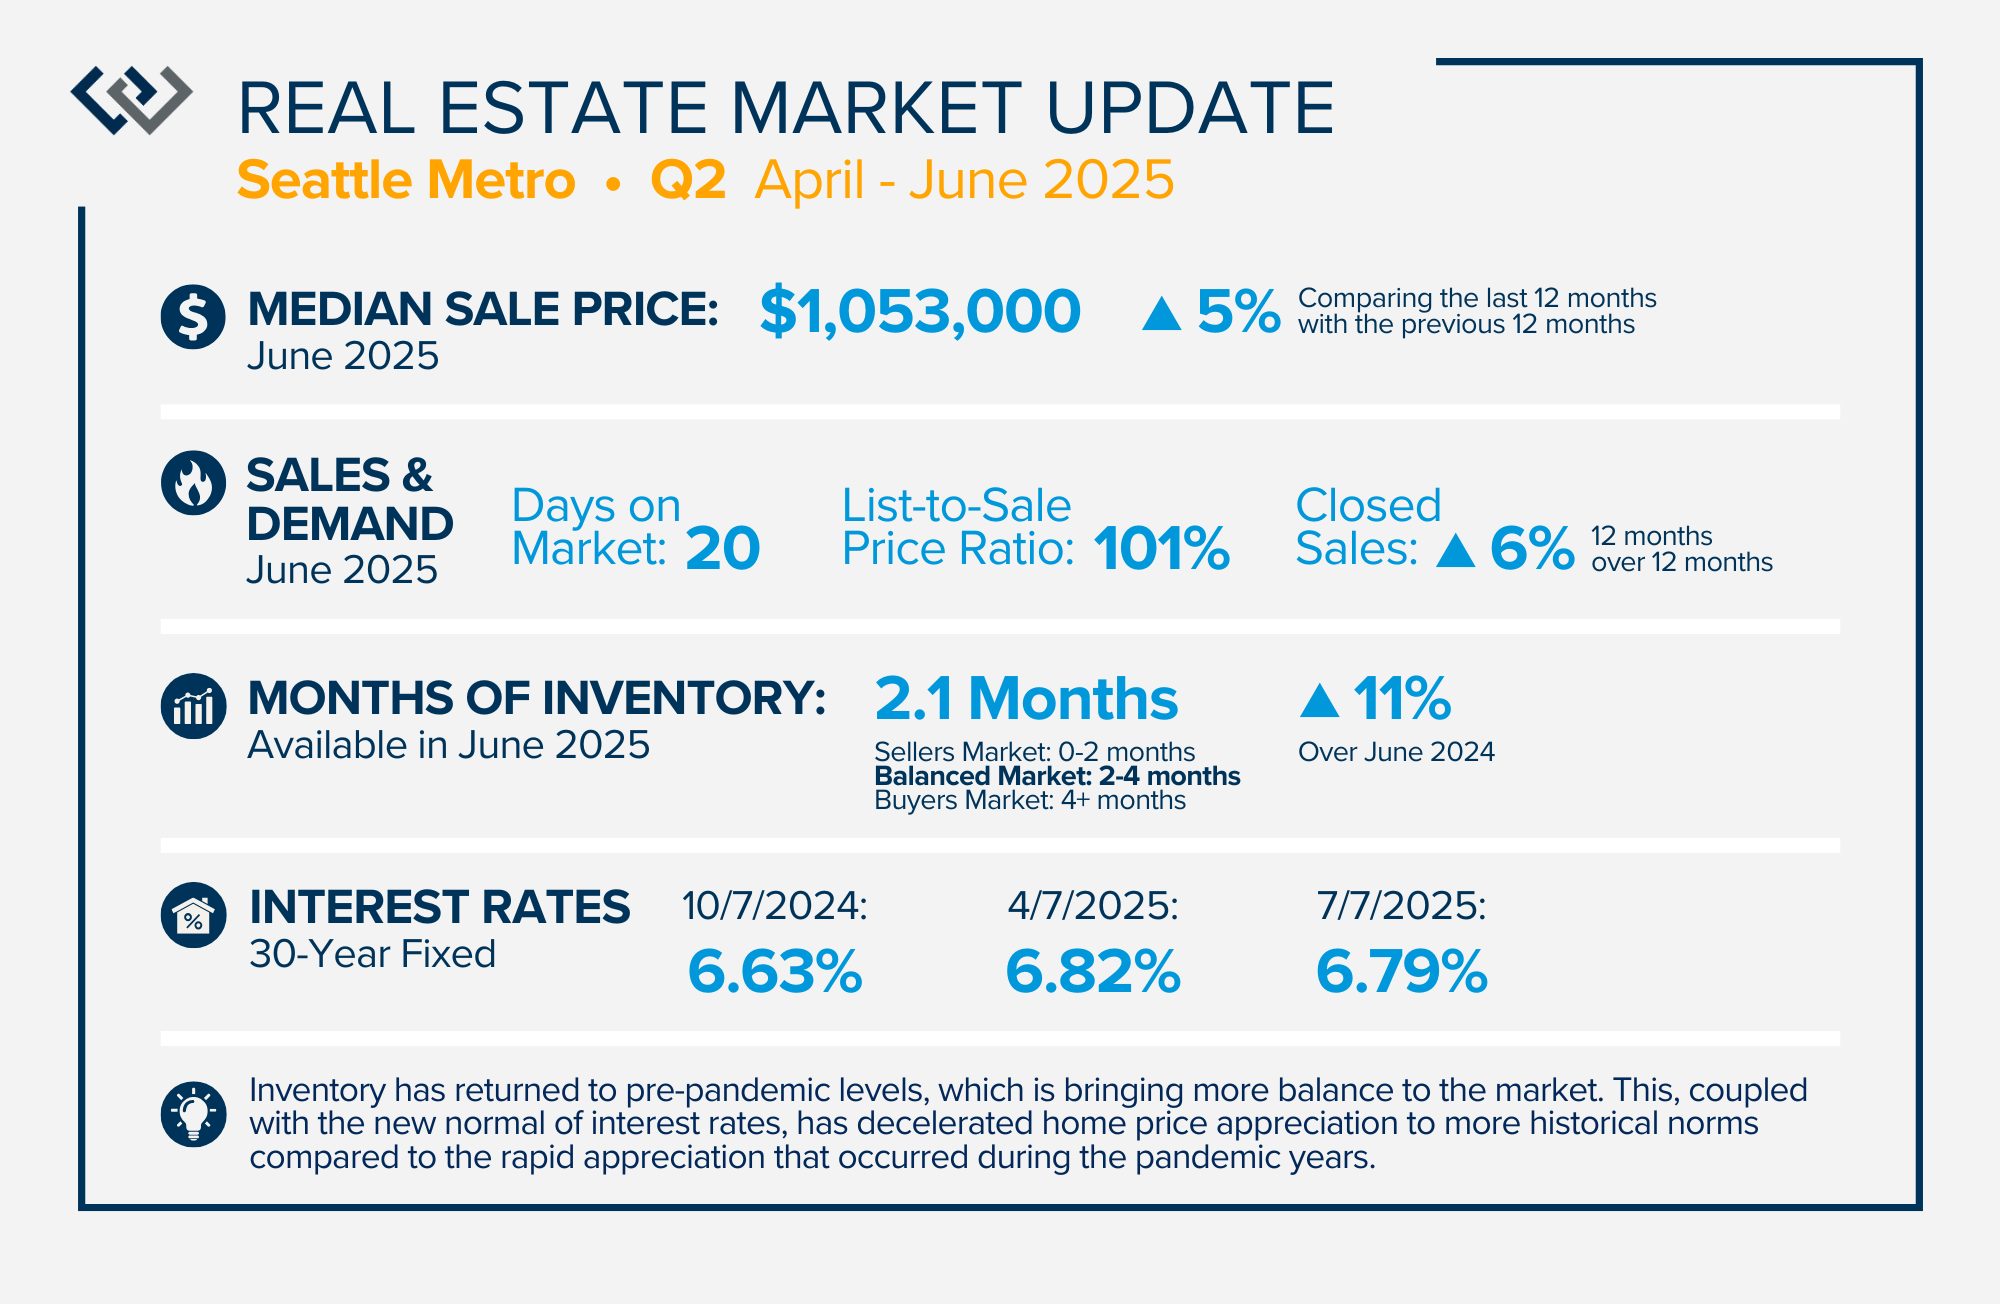
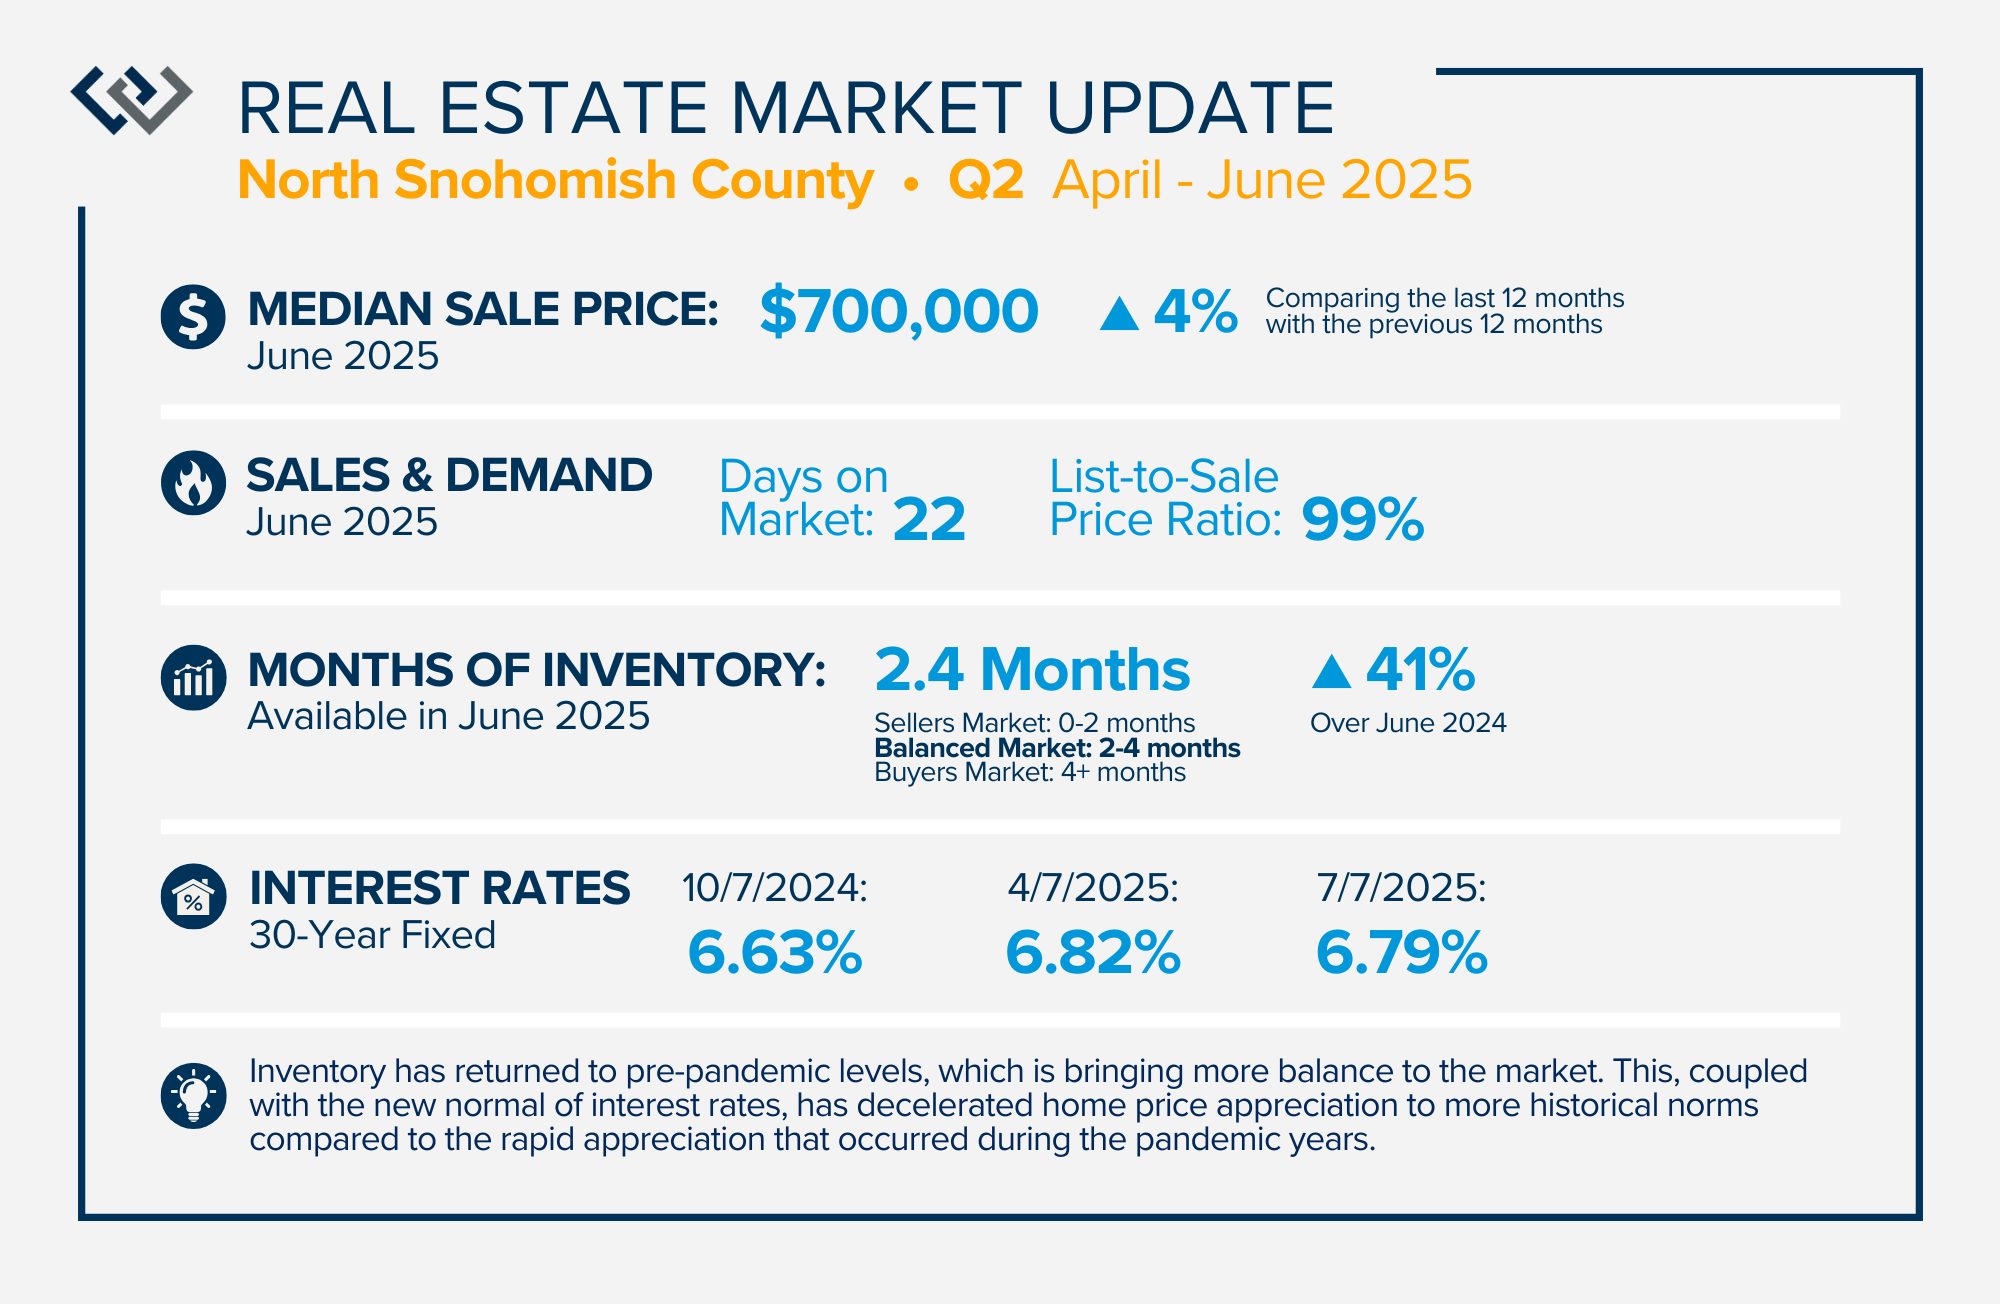
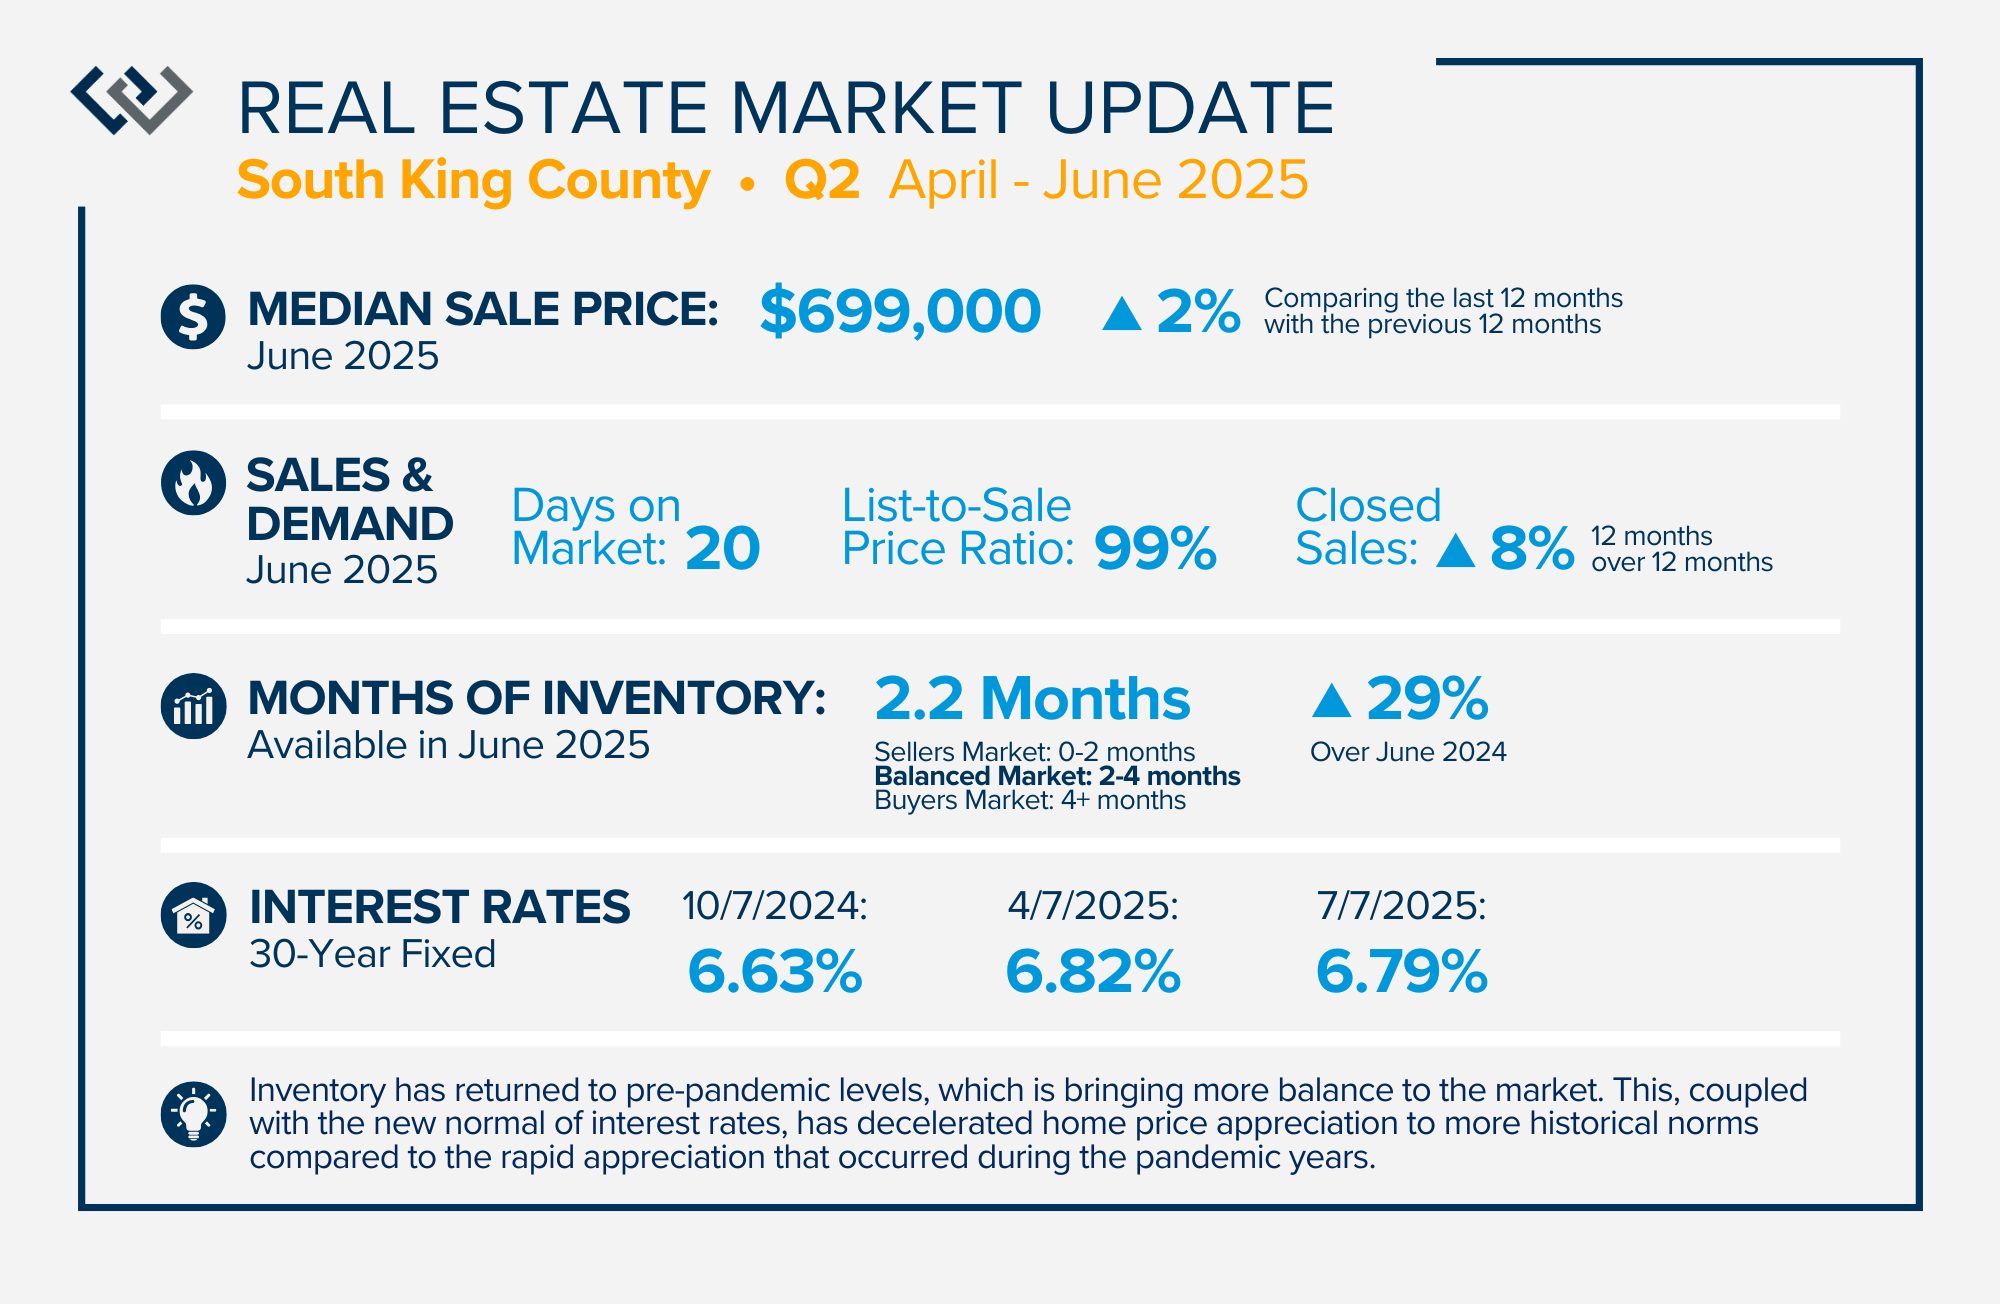
The second quarter of 2025 had a significant increase in the number of available homes for sale. Inventory has returned to pre-pandemic levels, which is bringing more balance to the market. This, coupled with the new normal of interest rates, has decelerated home price appreciation to more historical norms compared to the rapid appreciation that occurred during the pandemic years.
Overall, equity levels are high, and sellers who have owned their homes for five years or more are making substantial returns. With more balance in the market, buyers are experiencing relief and new opportunities. Movement in this market is much more fluid than in the restricted inventory market. If you or someone you know is interested in learning more about how the current trends relate to your goals, please reach out.
QUARTERLY REPORTS Q1 2025


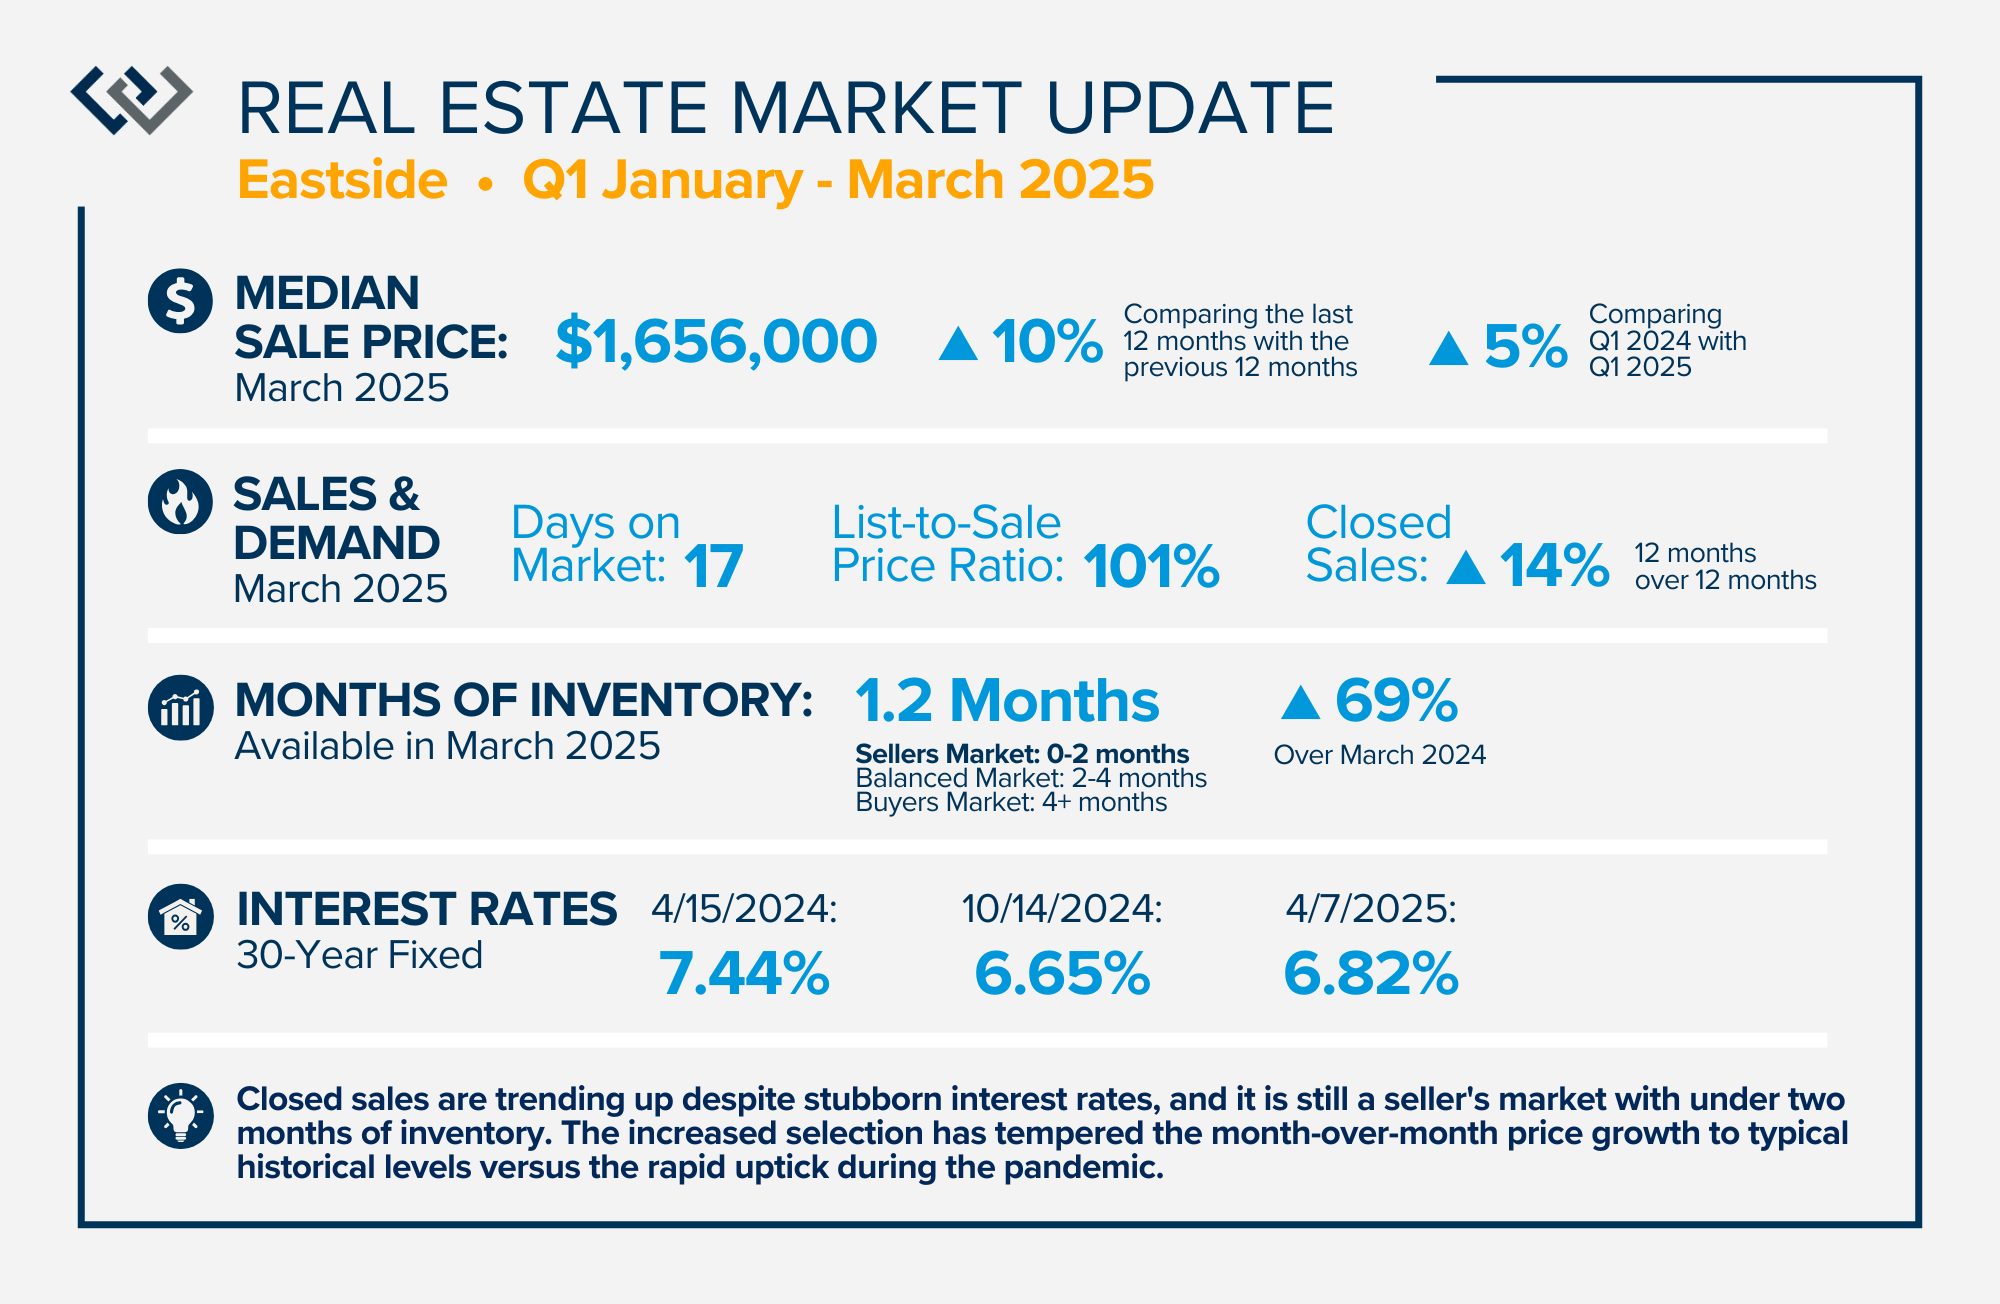
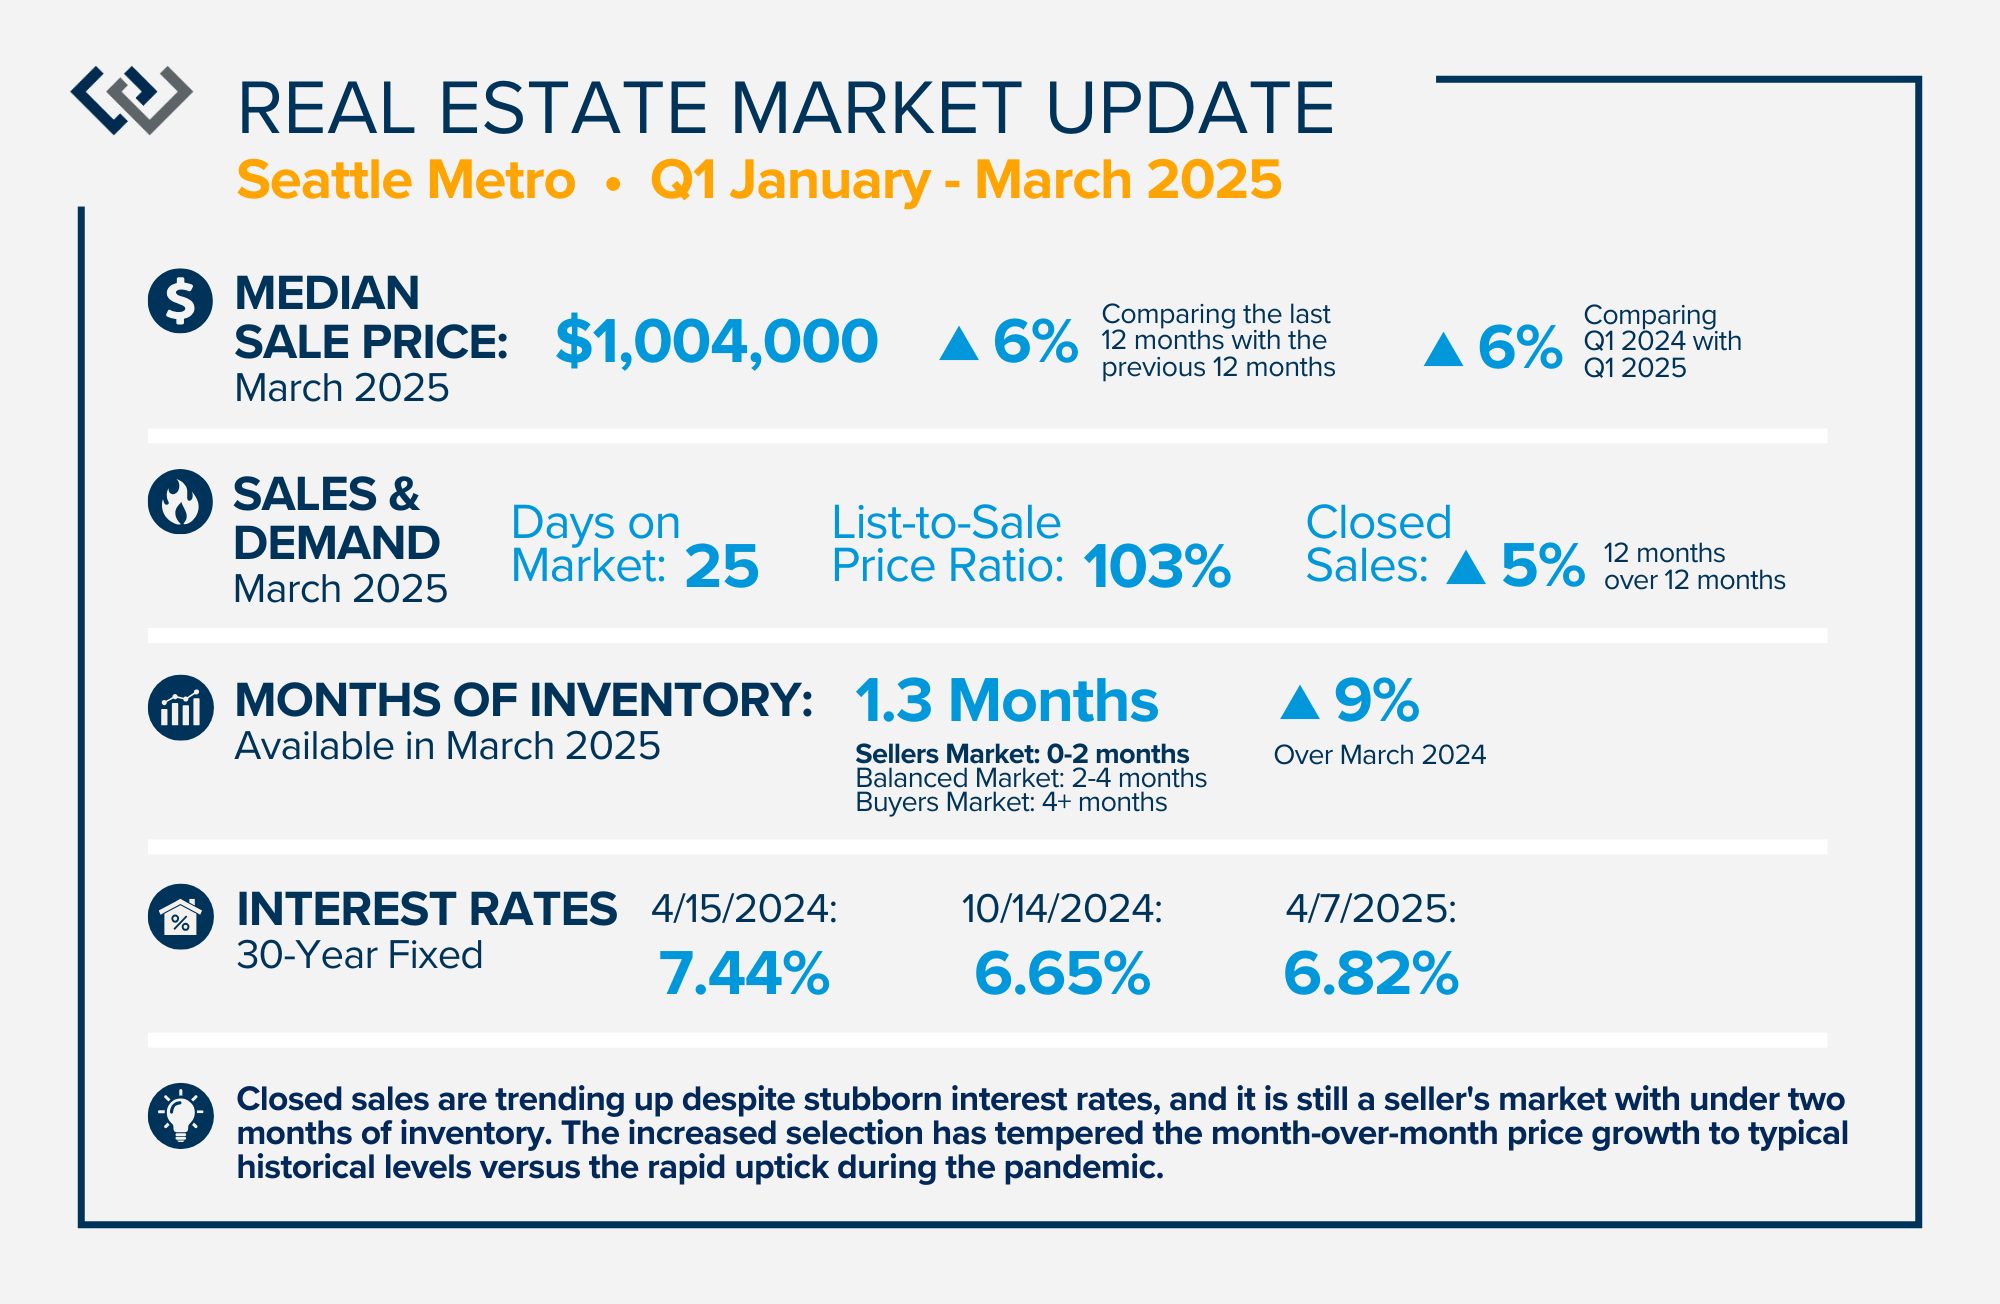
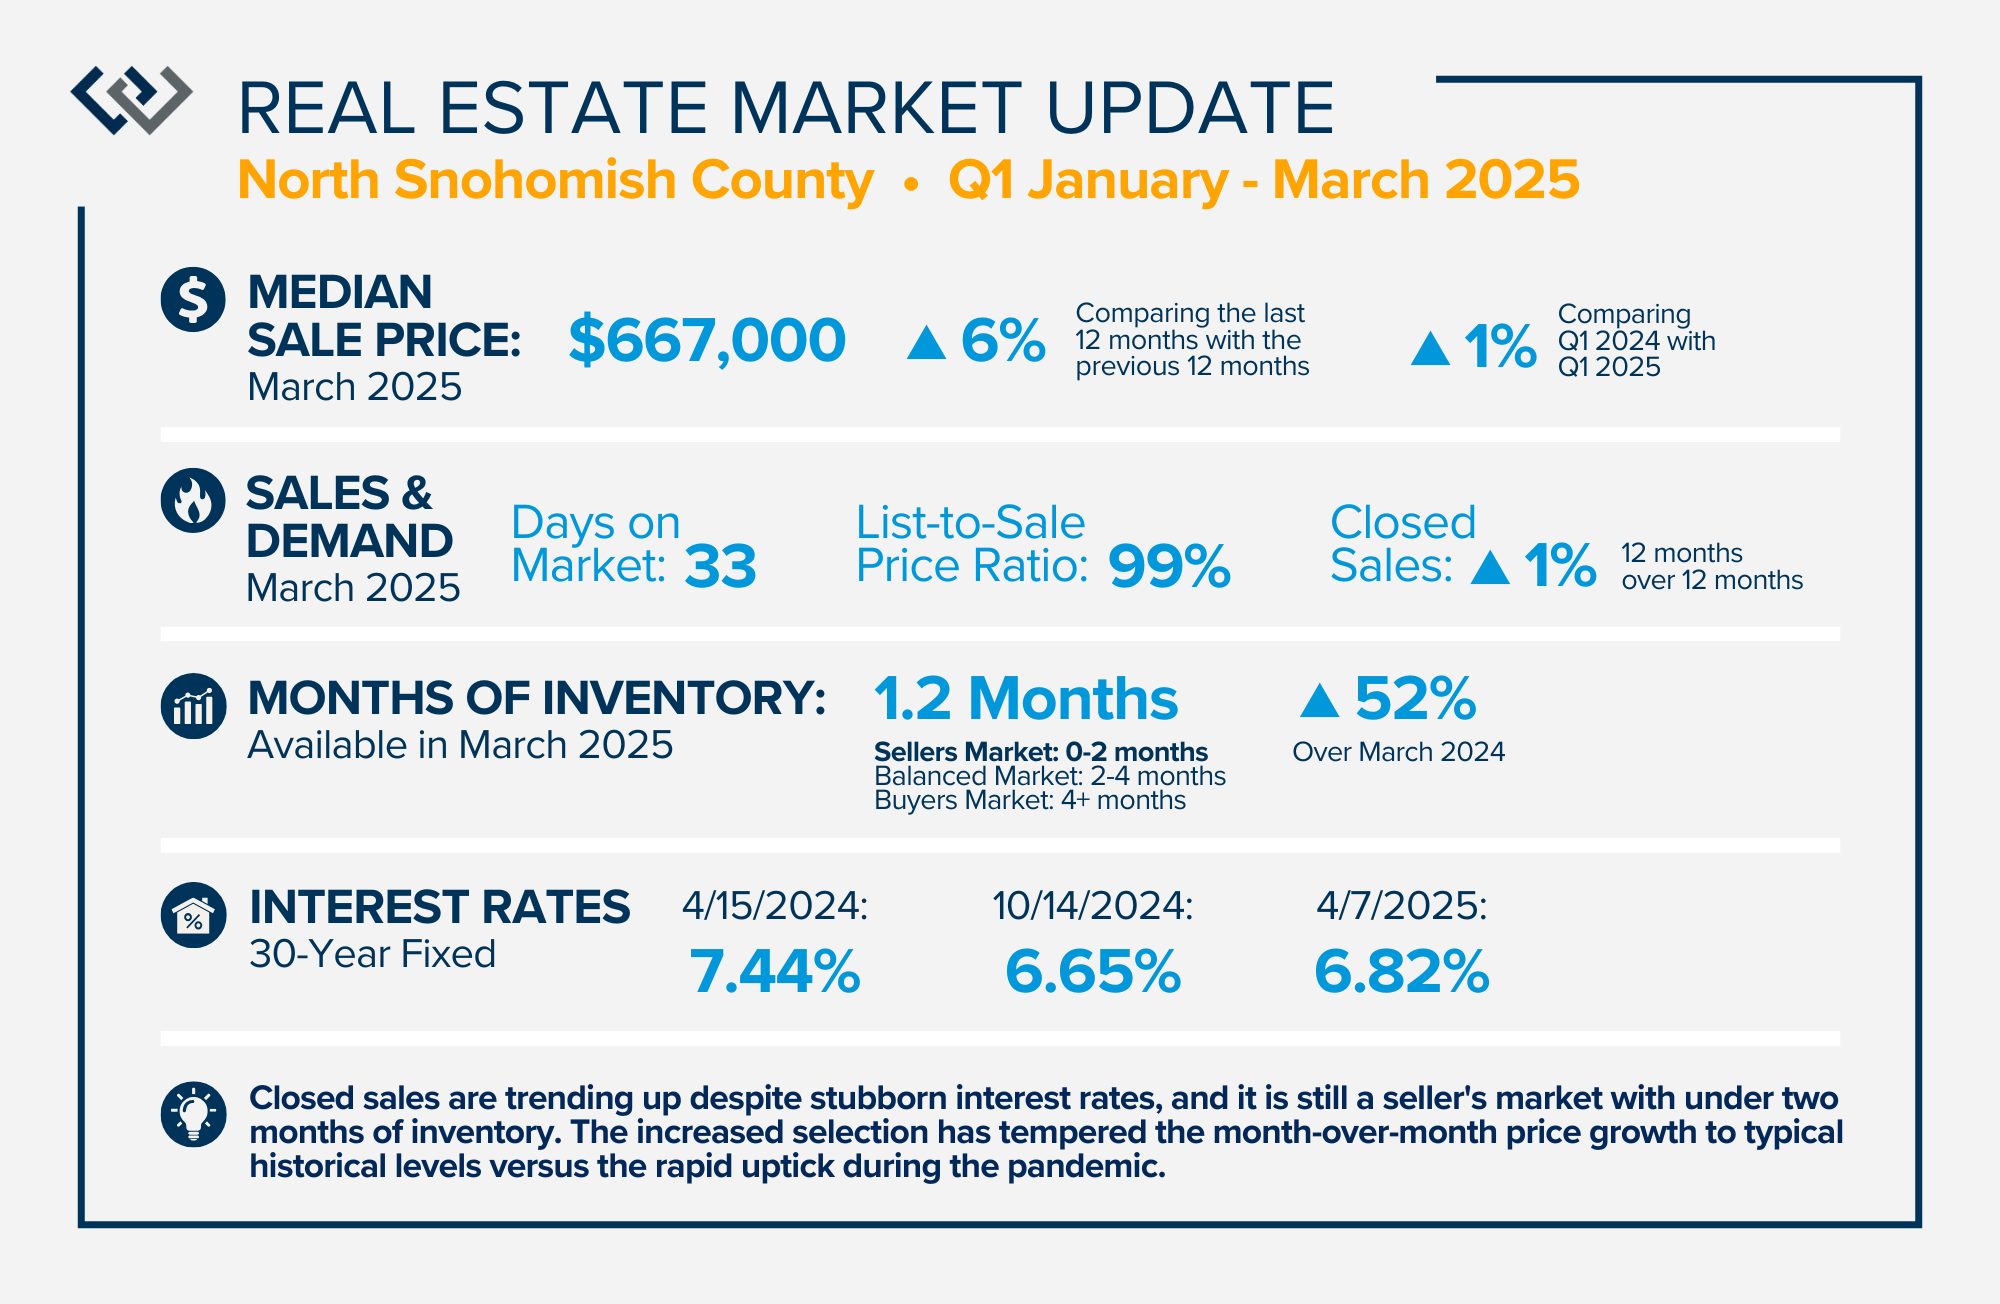
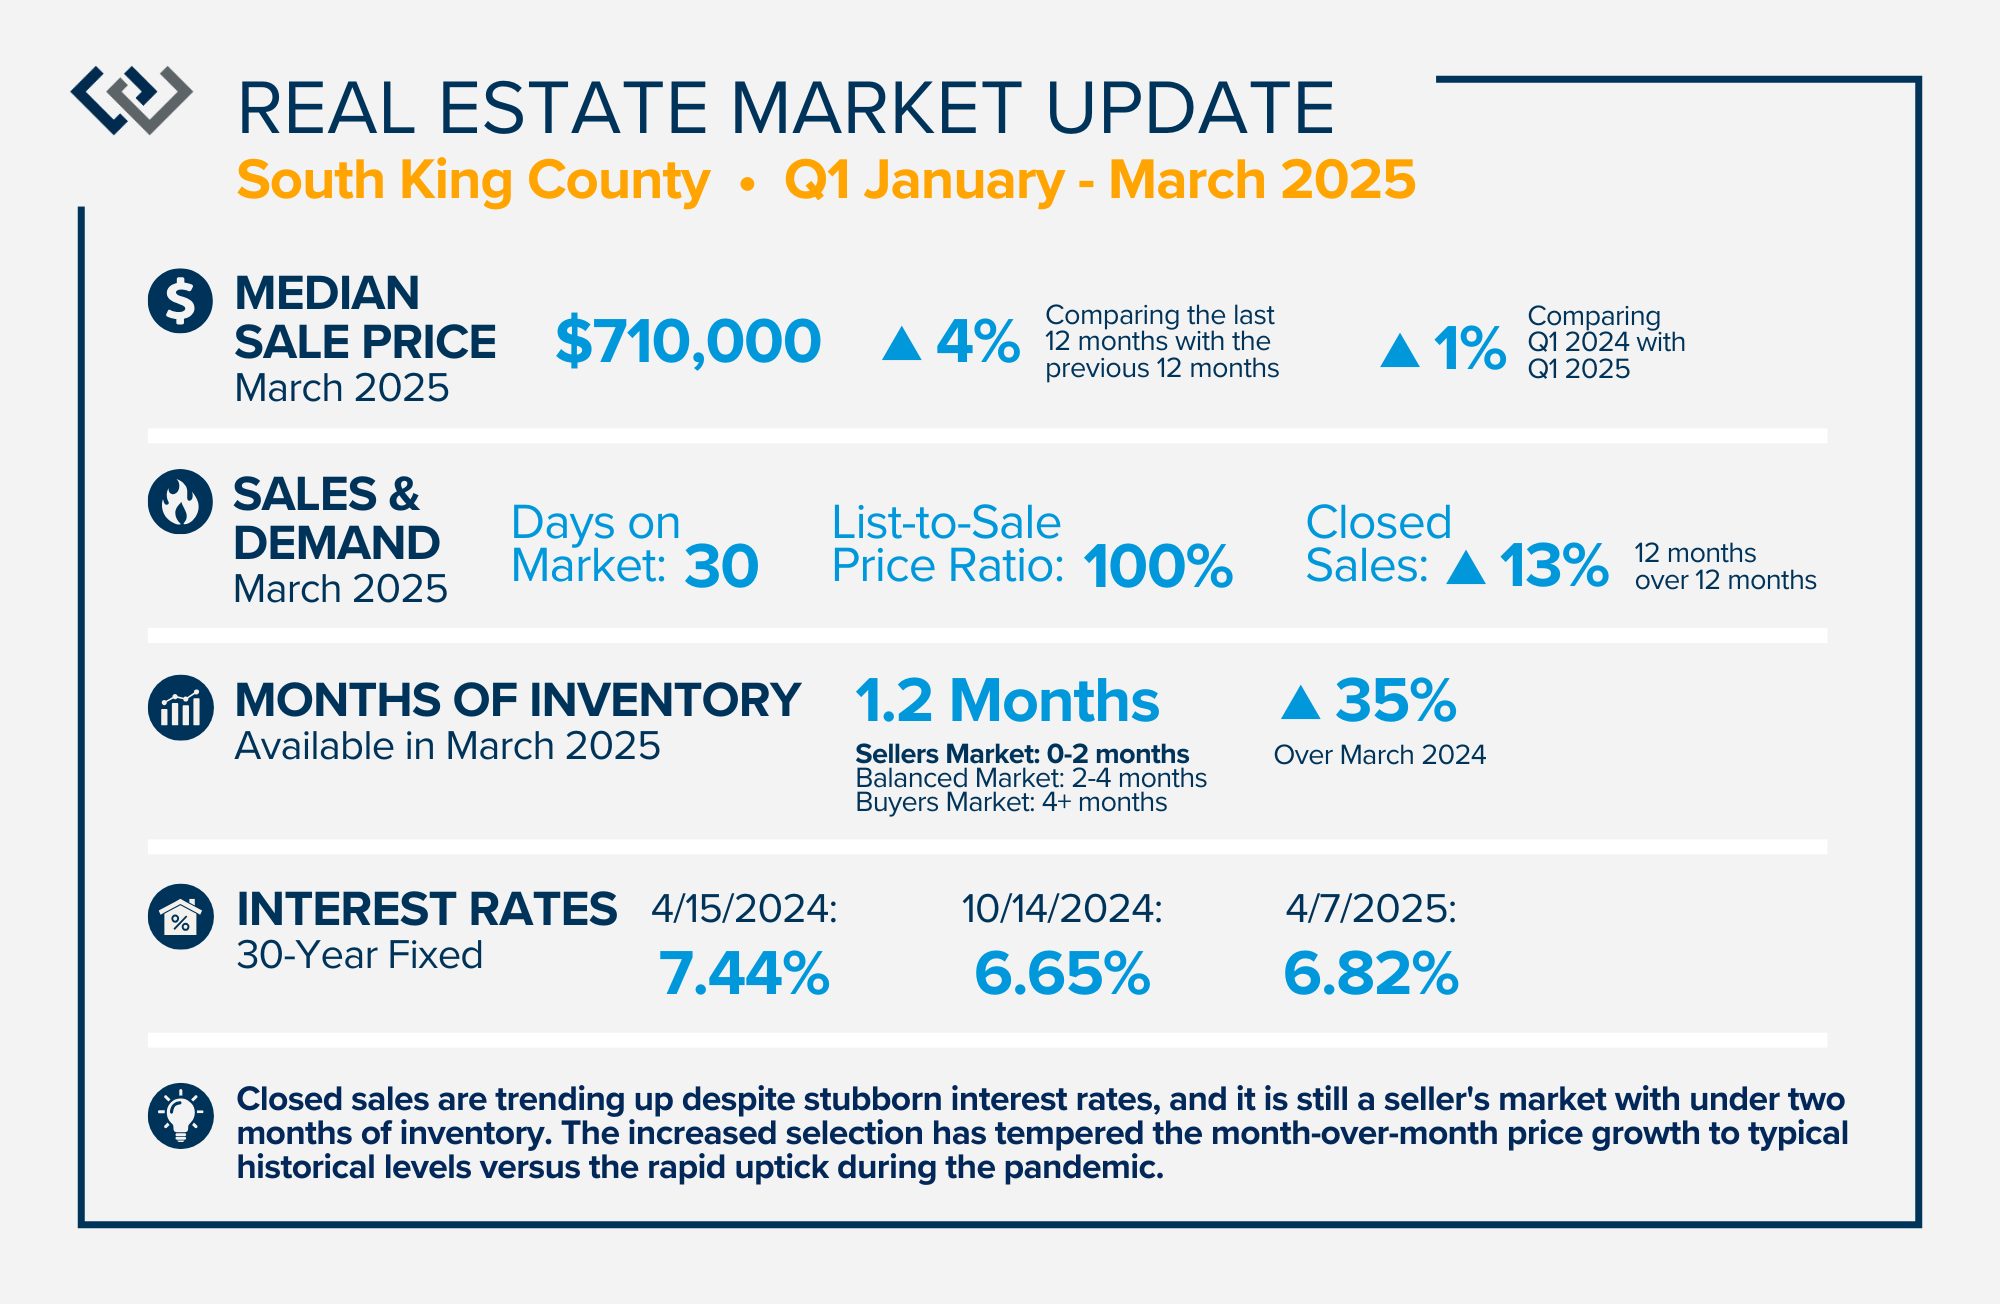
Year-to-date 2025, there have been more new listings than in 2024. After two years of tightly constricted inventory, this has been a welcome relief for buyers. Closed sales are trending up despite stubborn interest rates, and it is still a seller’s market with under two months of inventory. The increased selection has tempered the month-over-month price growth to typical historical levels versus the rapid uptick during the pandemic. Interest rates have decreased since last year and are expected to recede slowly throughout the year.
Delayed seller demand is starting to mount as some people are giving up their low rate to pivot to a home that better fits their lifestyle. With this increase, we anticipate more sustainable and stable price growth, which will rest on the shoulders of strong equity levels built over the last decade plus. Evaluating and applying the trends to your options will help you make informed and powerful decisions. Please don’t hesitate to reach out if you or someone you know would like to learn more, discuss goals, and create a winning plan.
QUARTERLY REPORTS Q3 2024

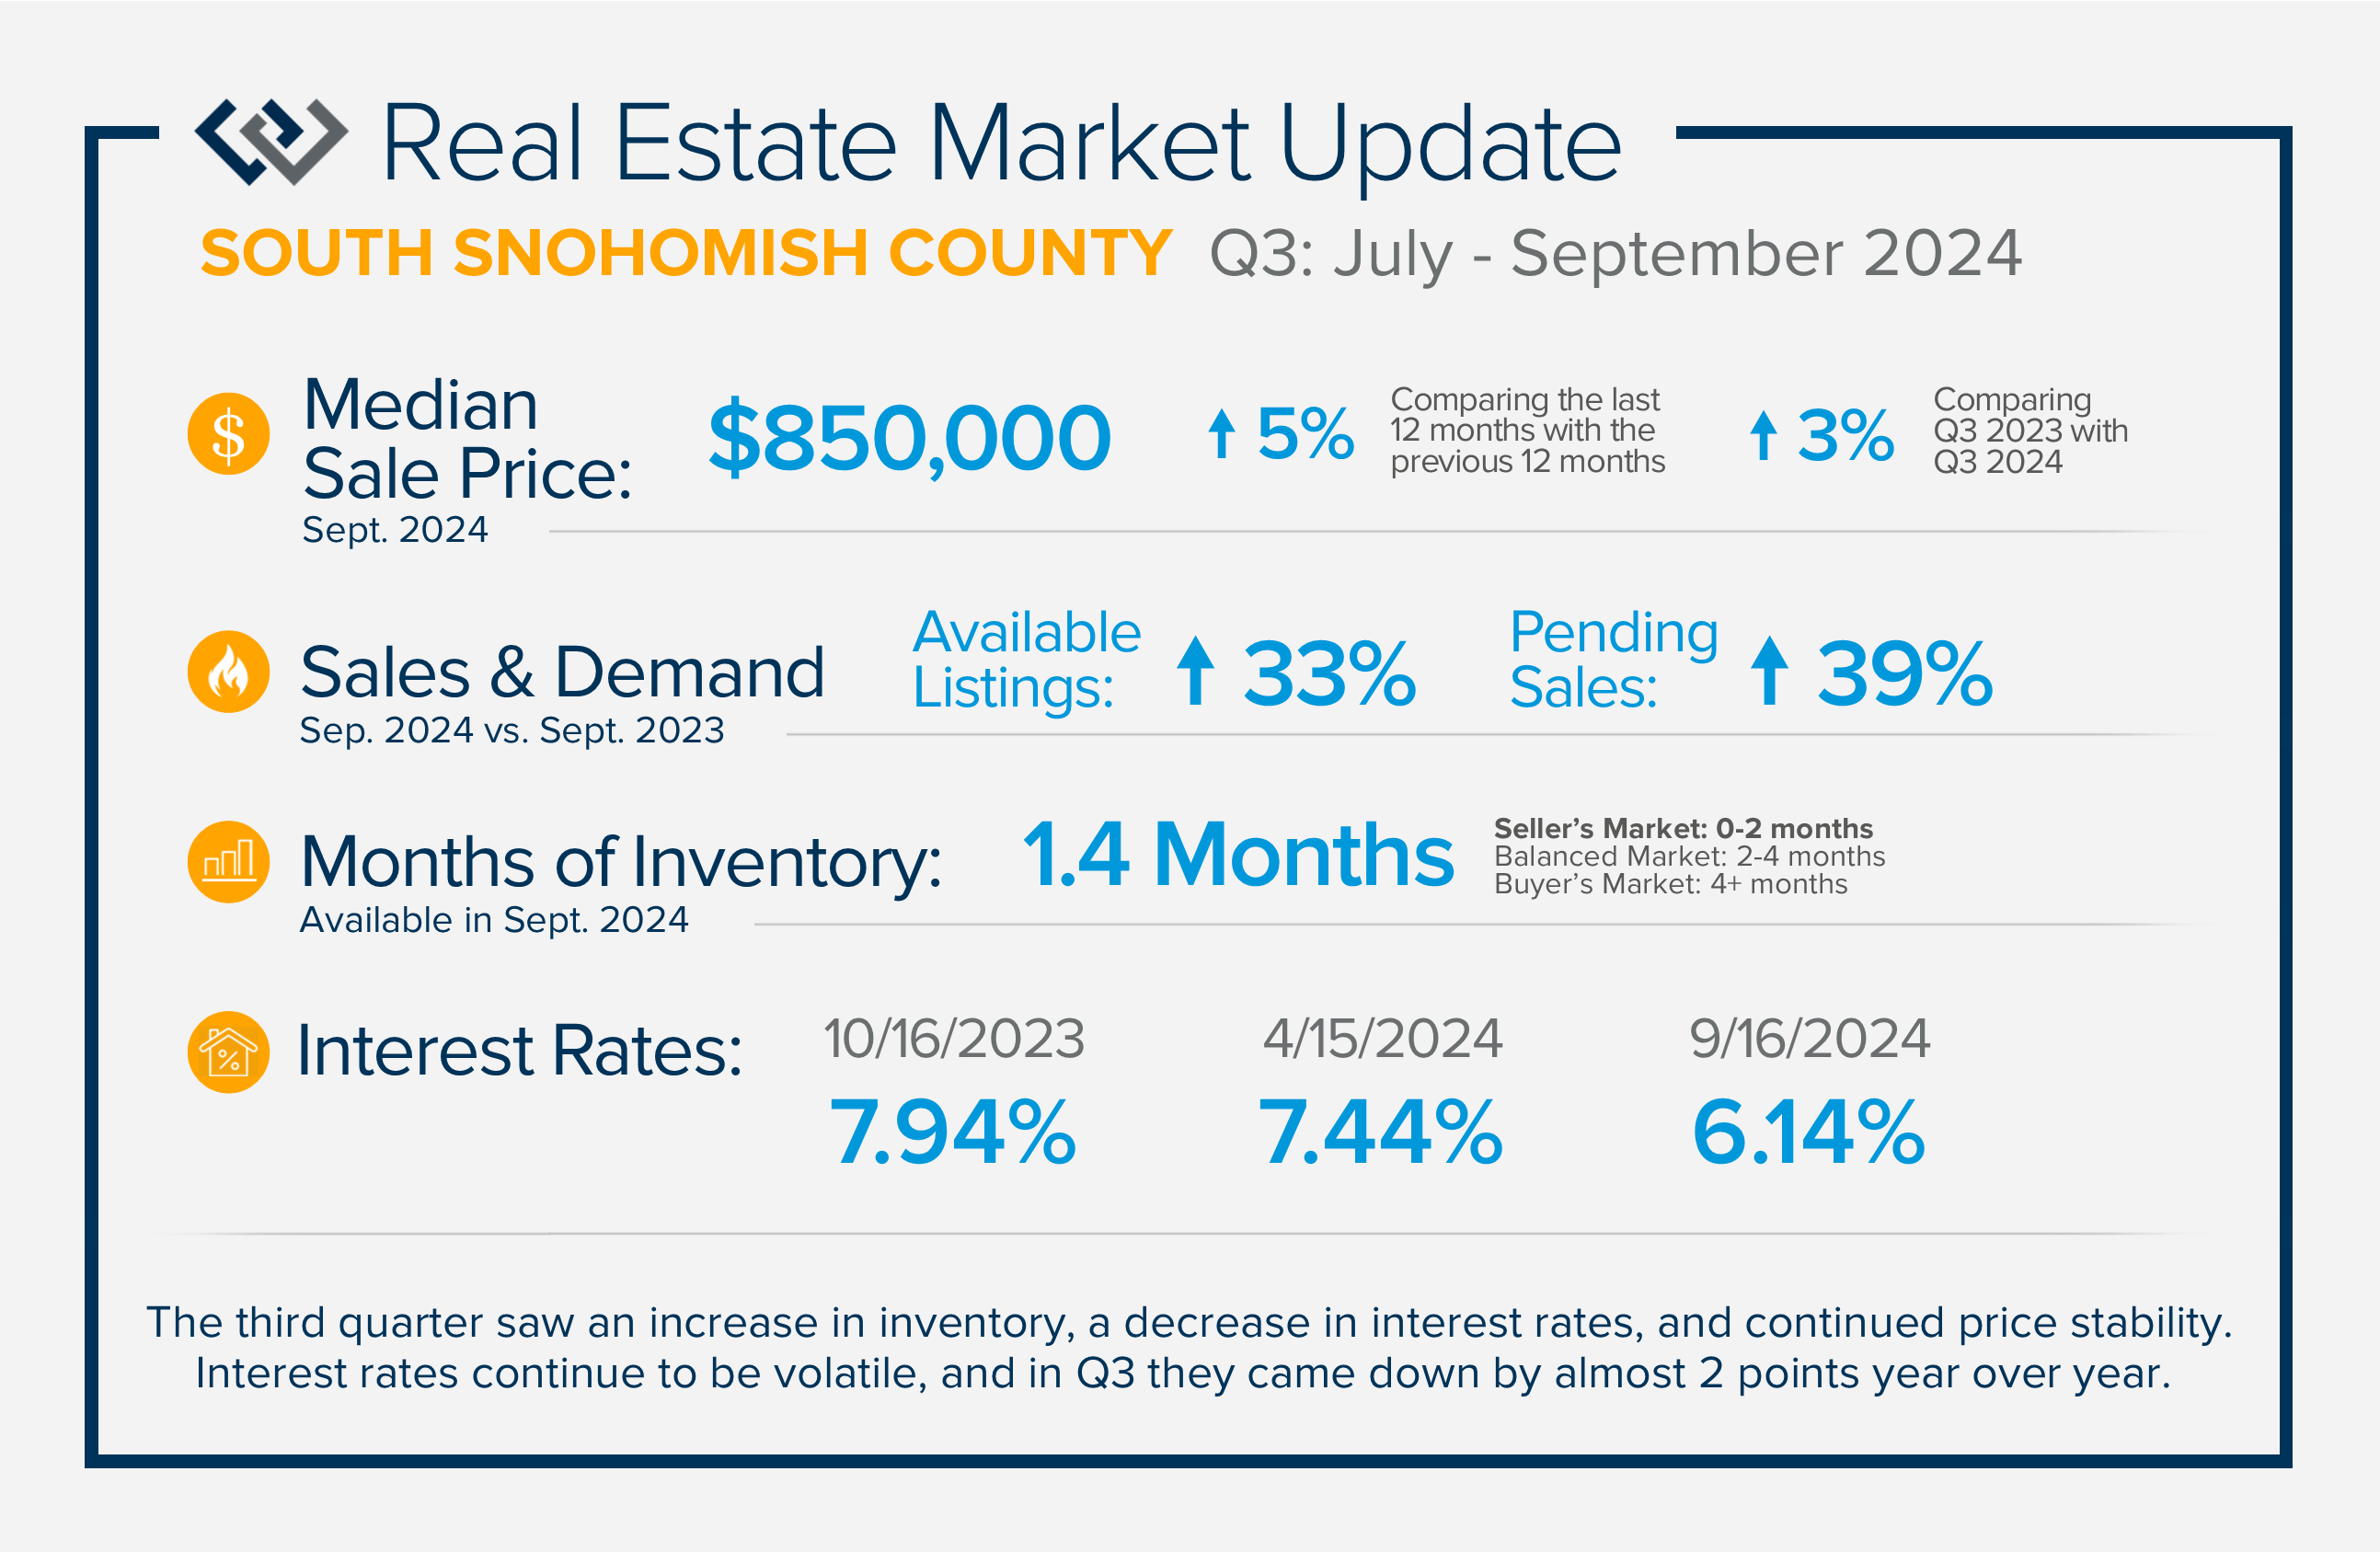
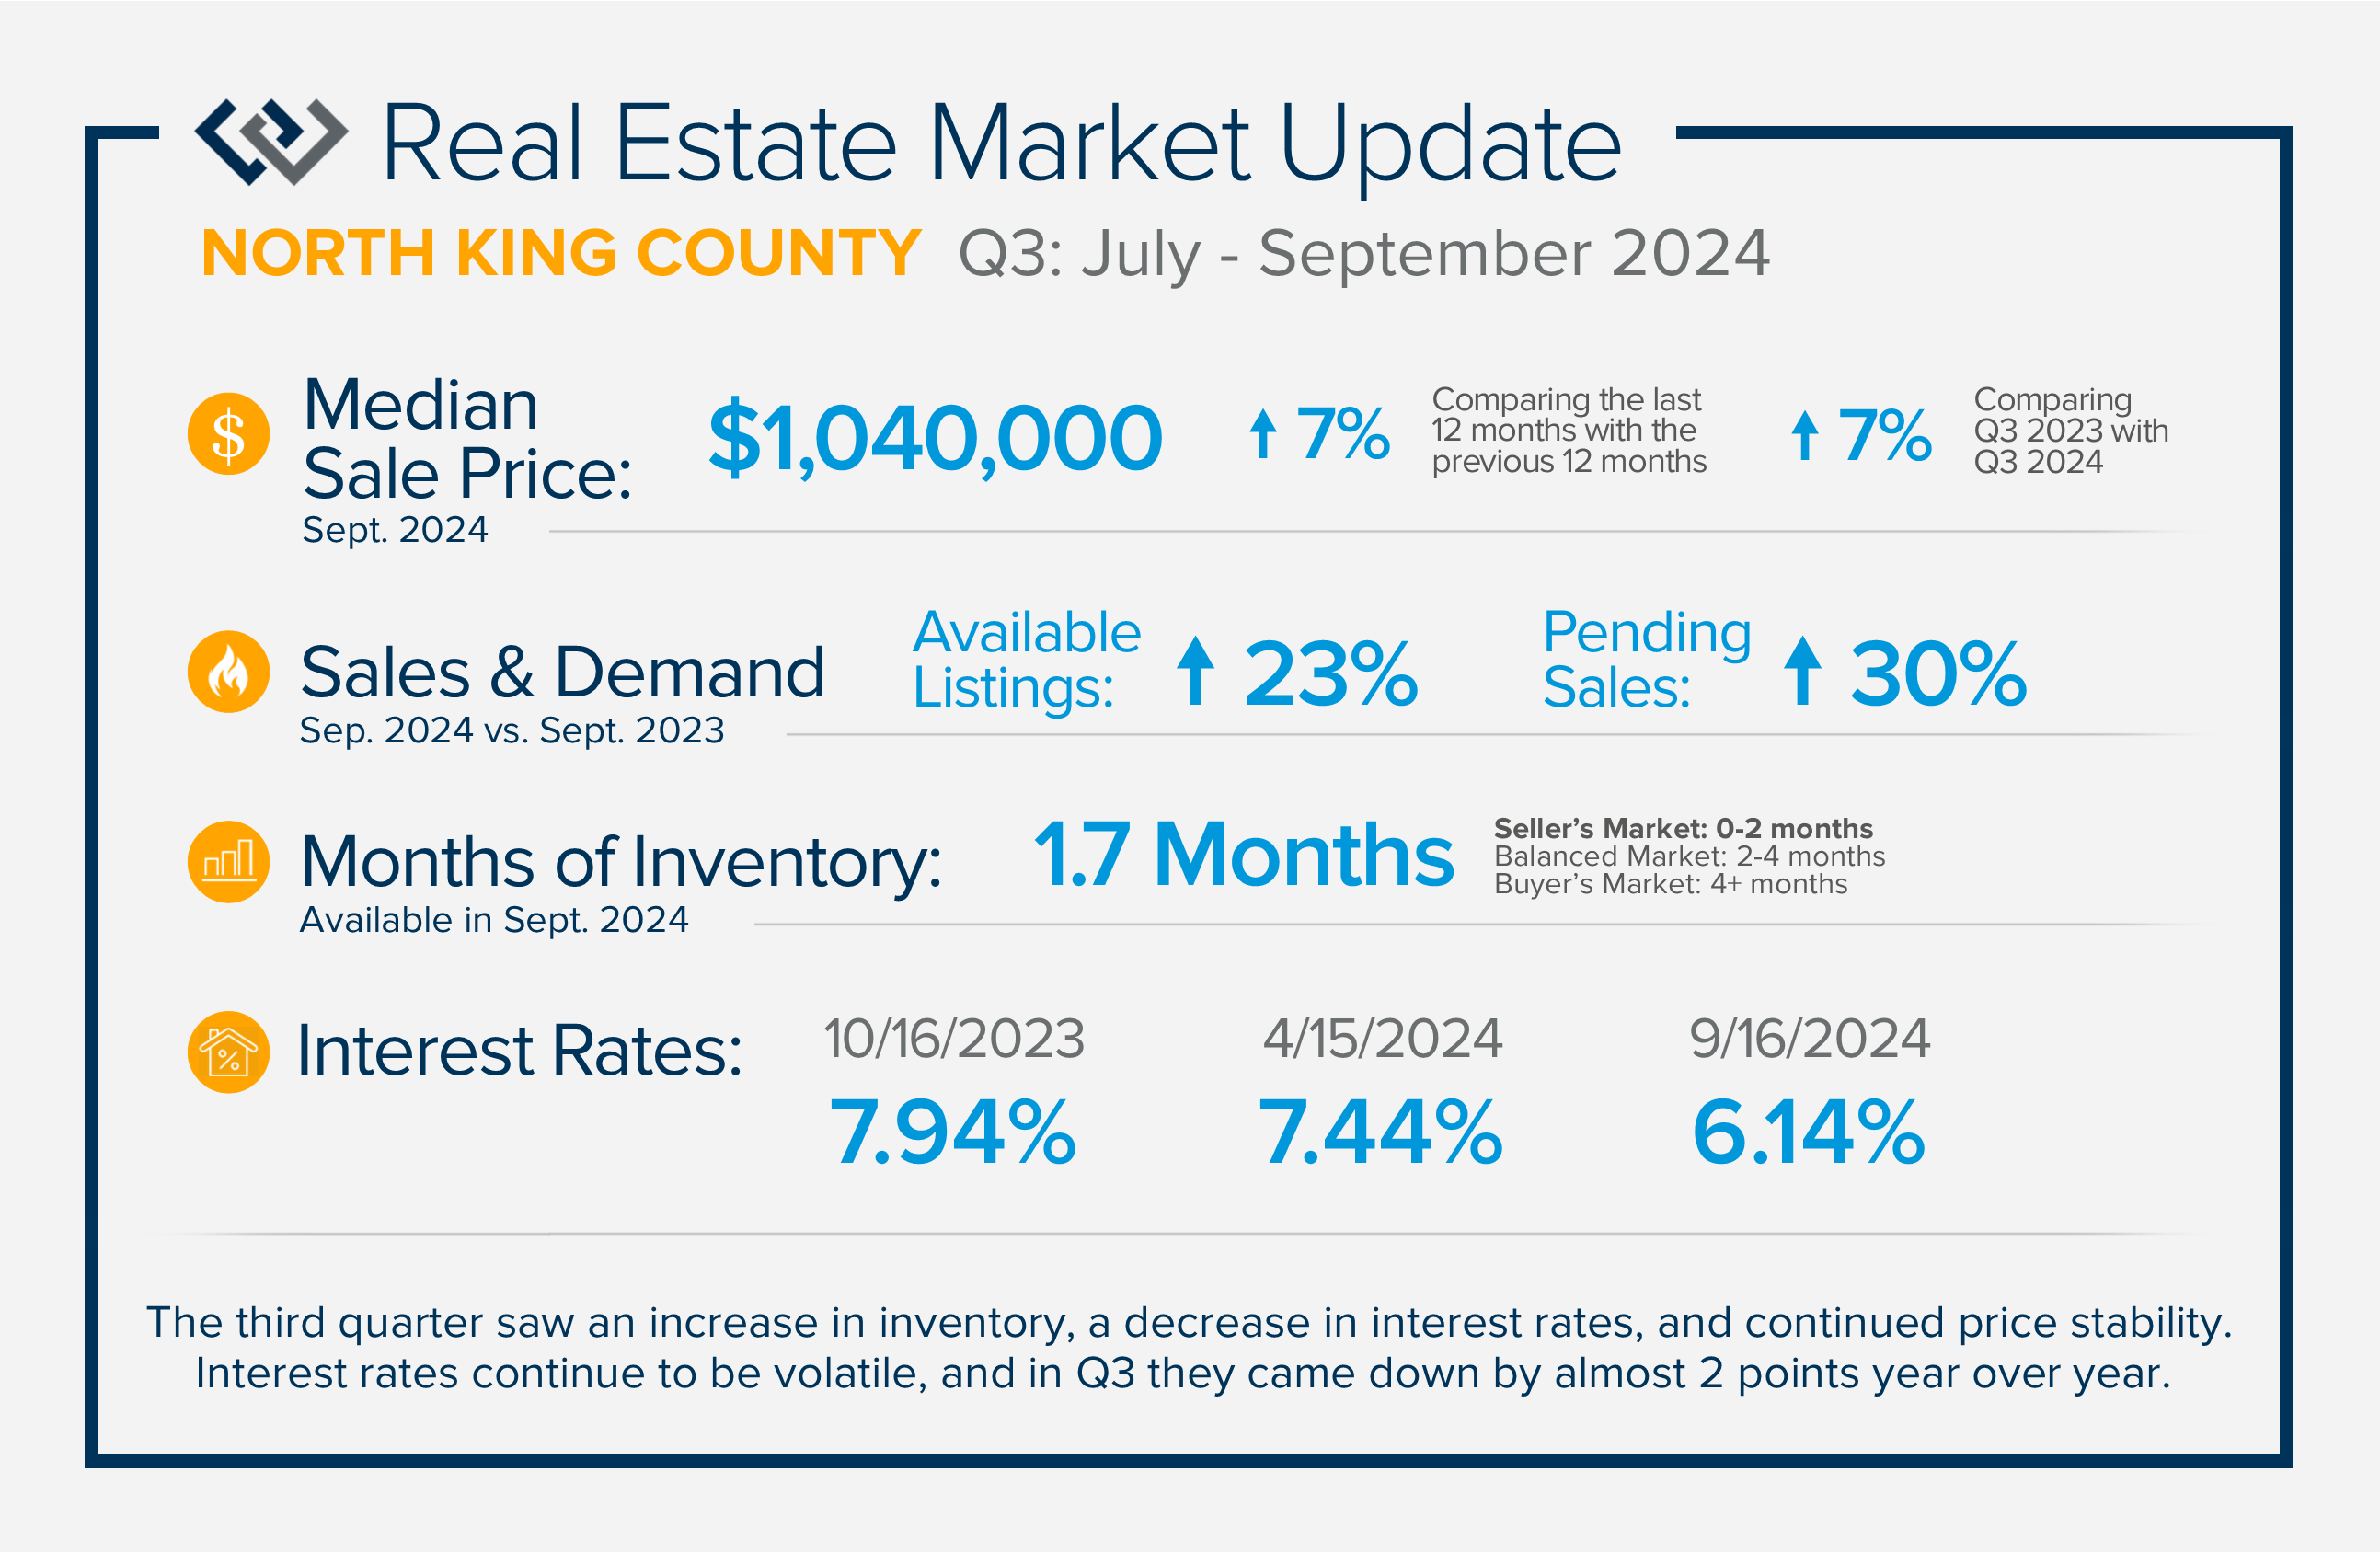
The third quarter saw an increase in inventory, a decrease in interest rates, and continued price stability. Interest rates continue to be volatile, and in Q3 they came down by almost 2 points year over year. This caused more buyers to enter the market and pending sales to rise. The number of available listings has improved after a very tight start to the year. Some sellers have been willing to forego their previous low rates for a new house, creating more movement in the market. The combination of lower rates and more selection should have buyers excited to make a move. Equity levels remain strong in our region as prices have remained steady and appreciated year over year.
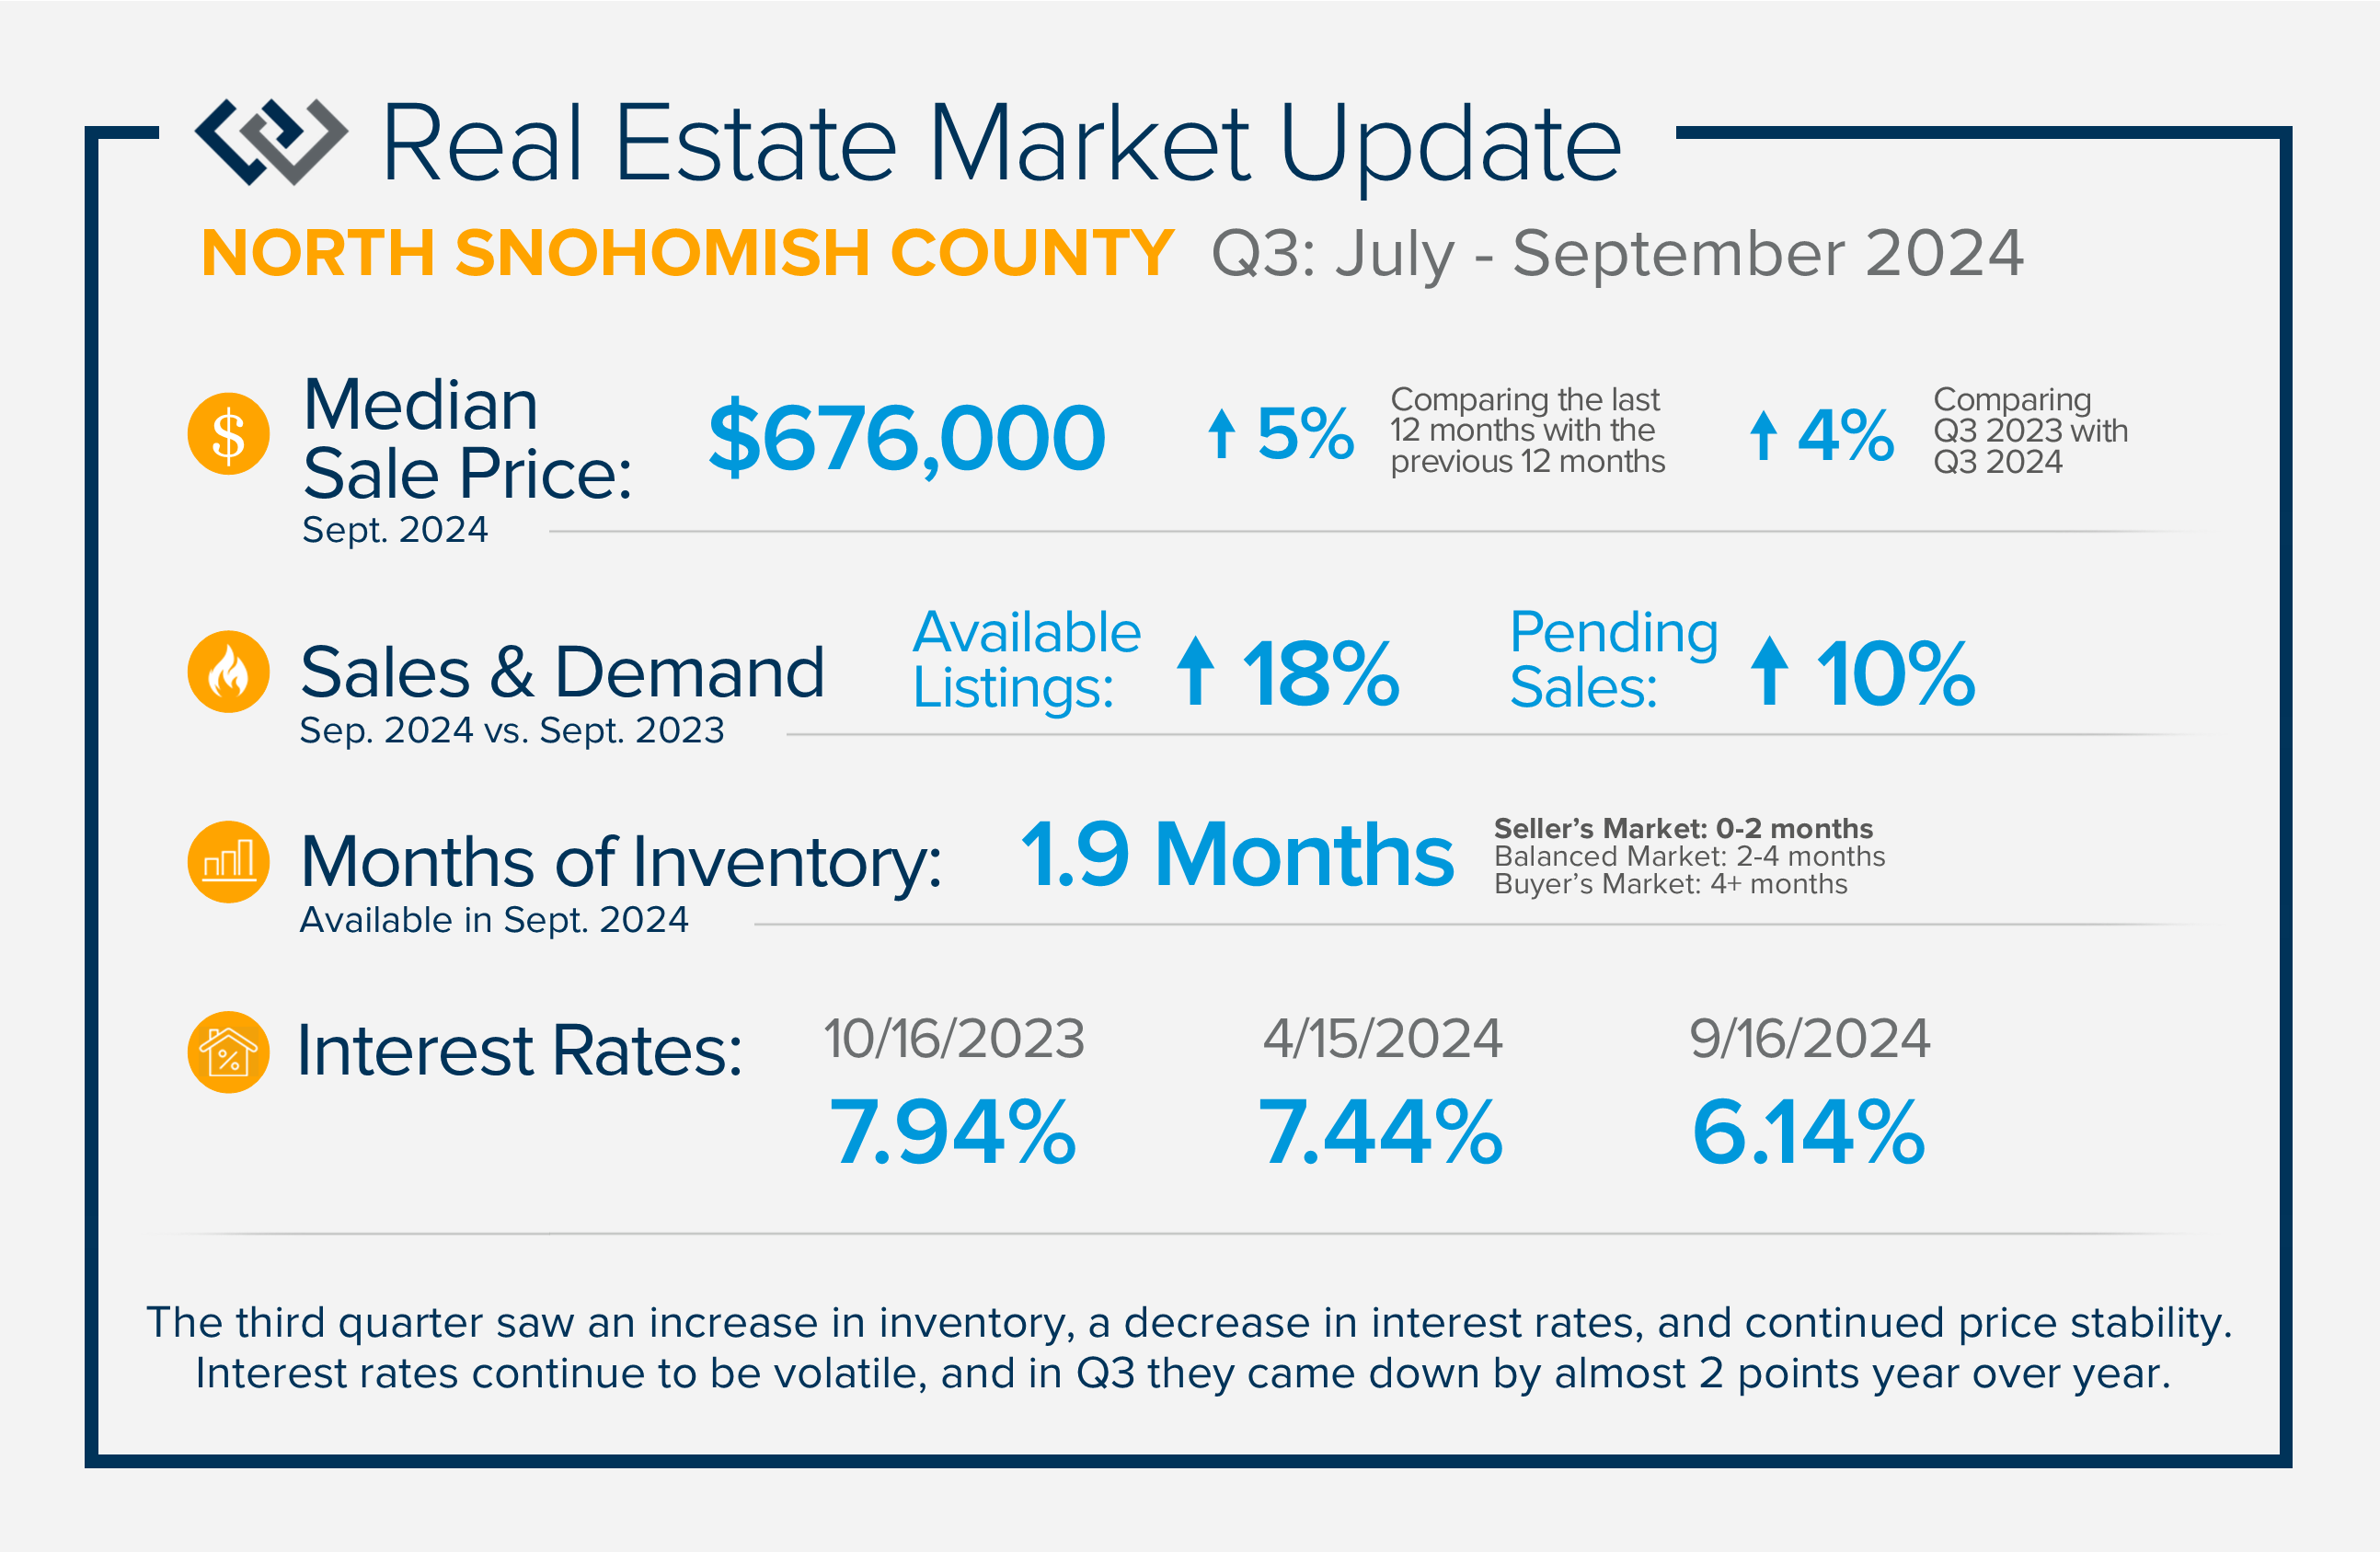
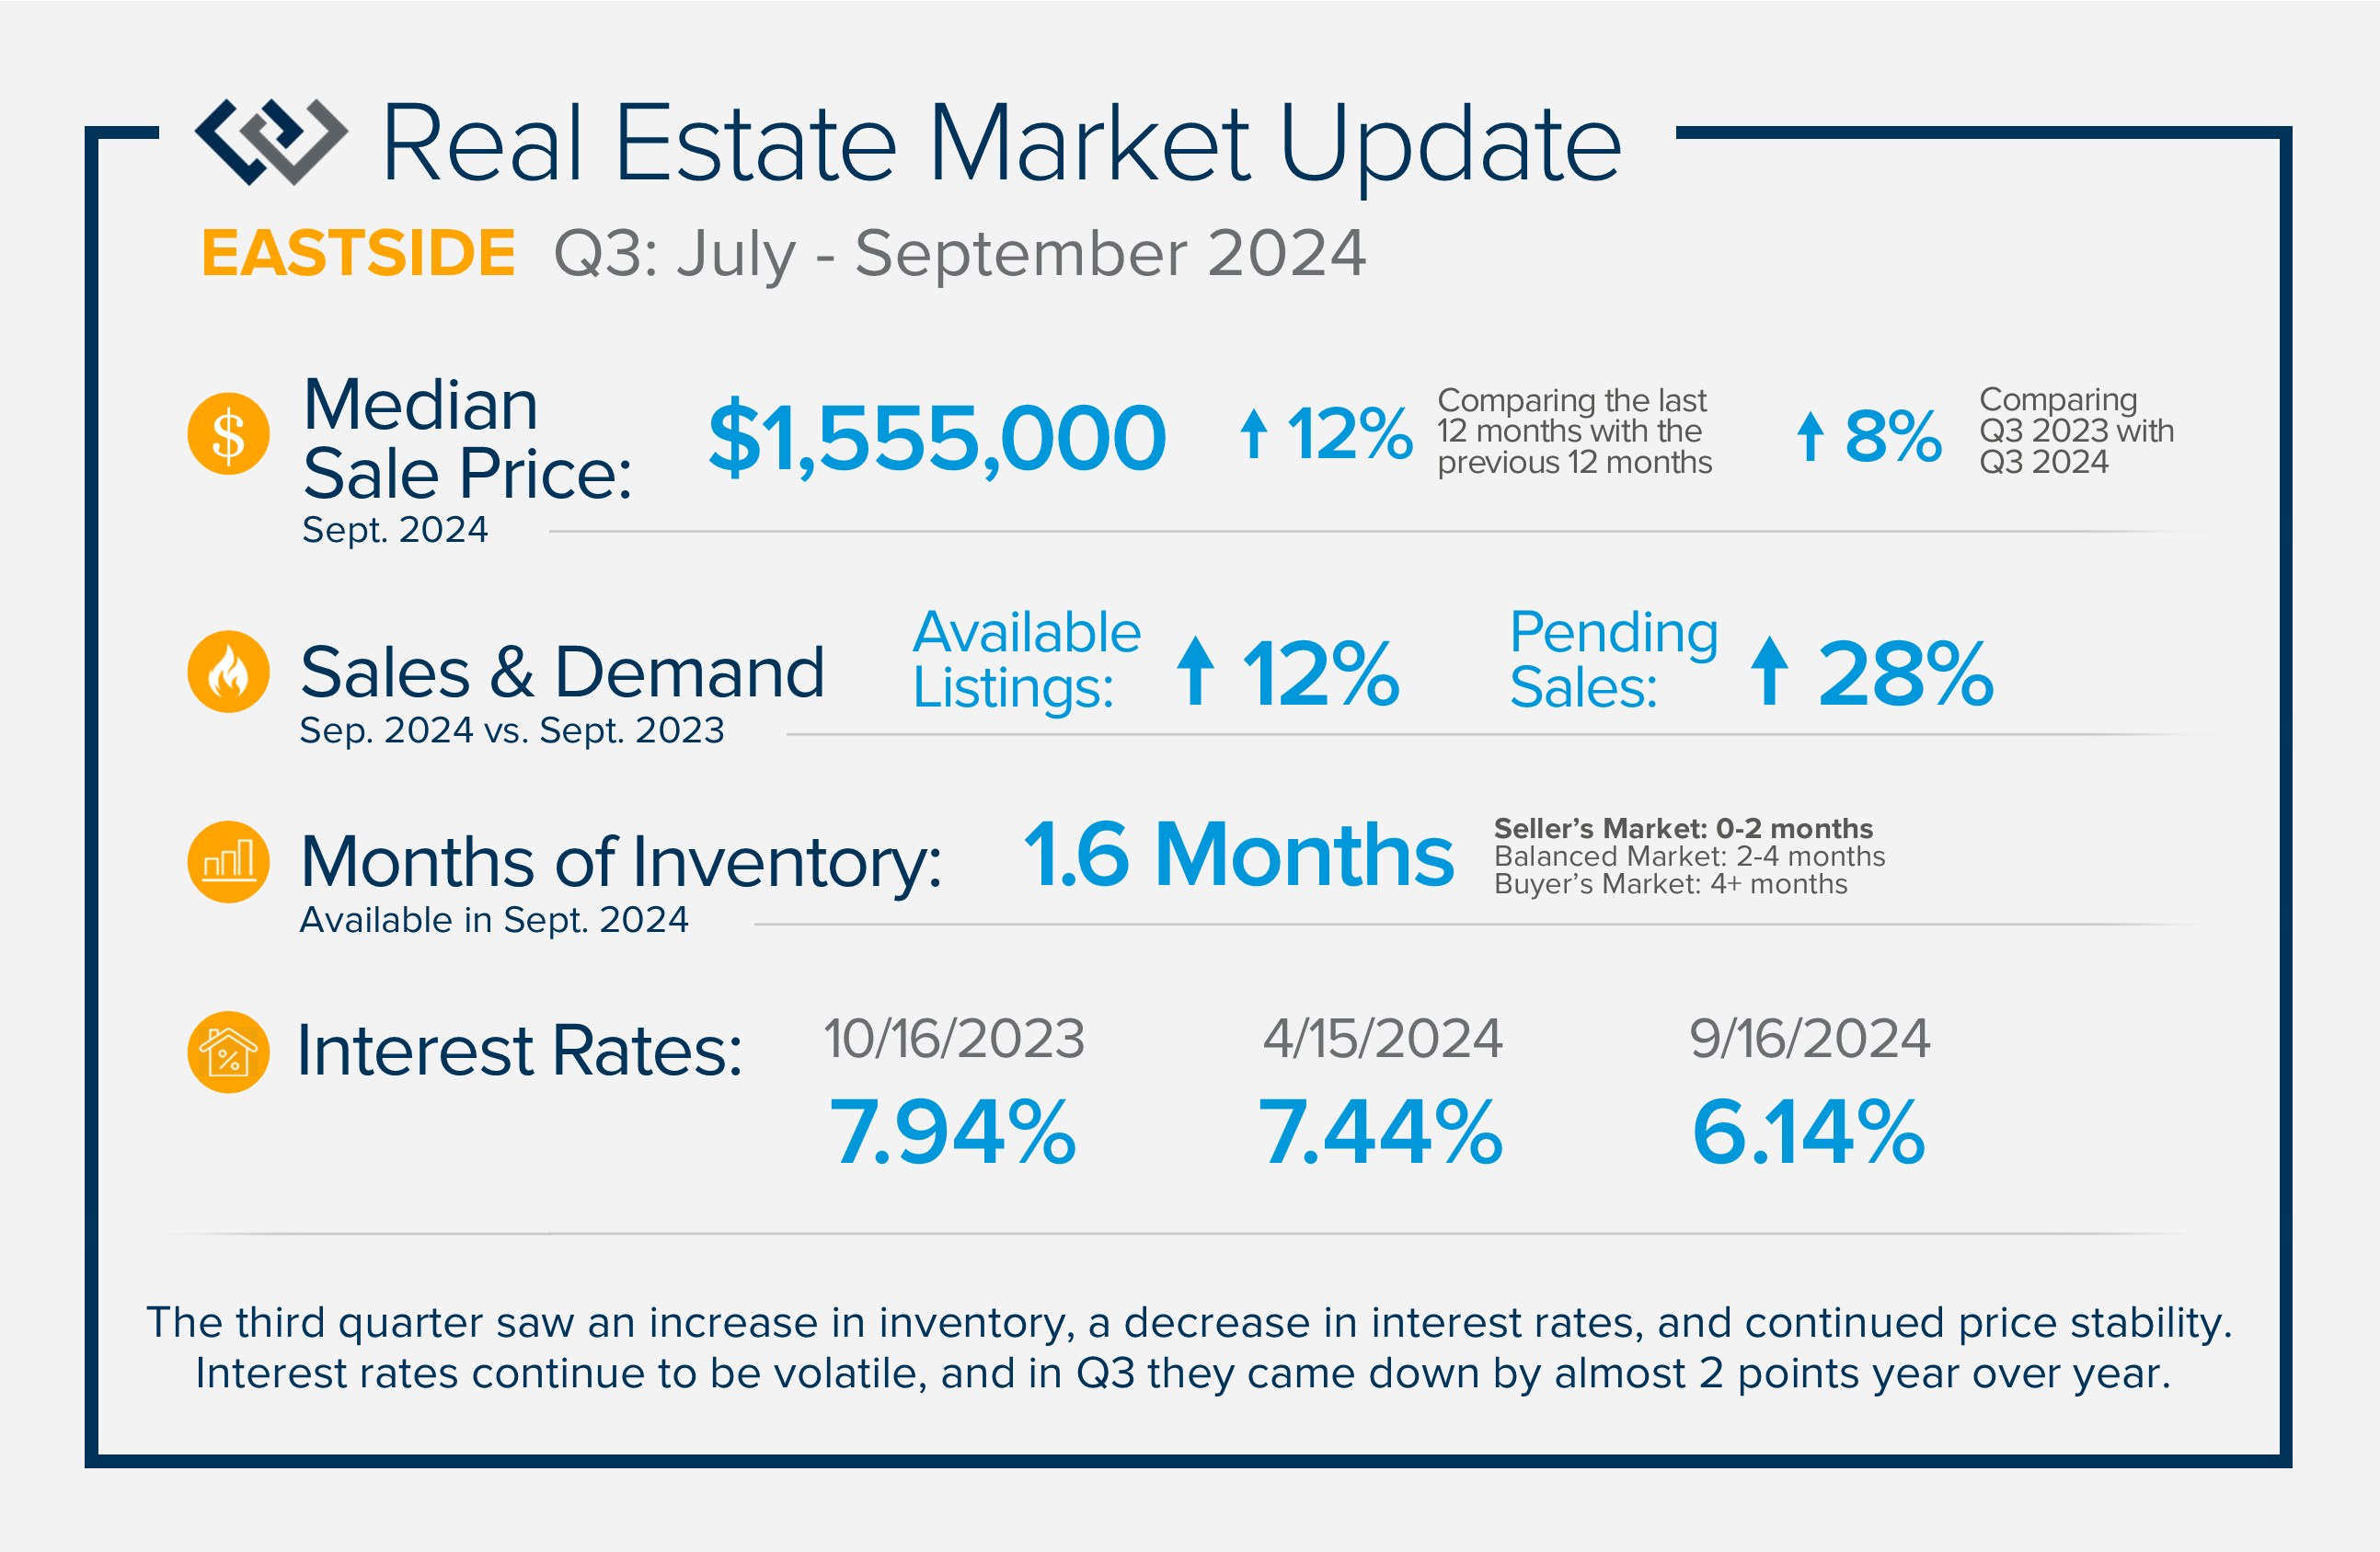
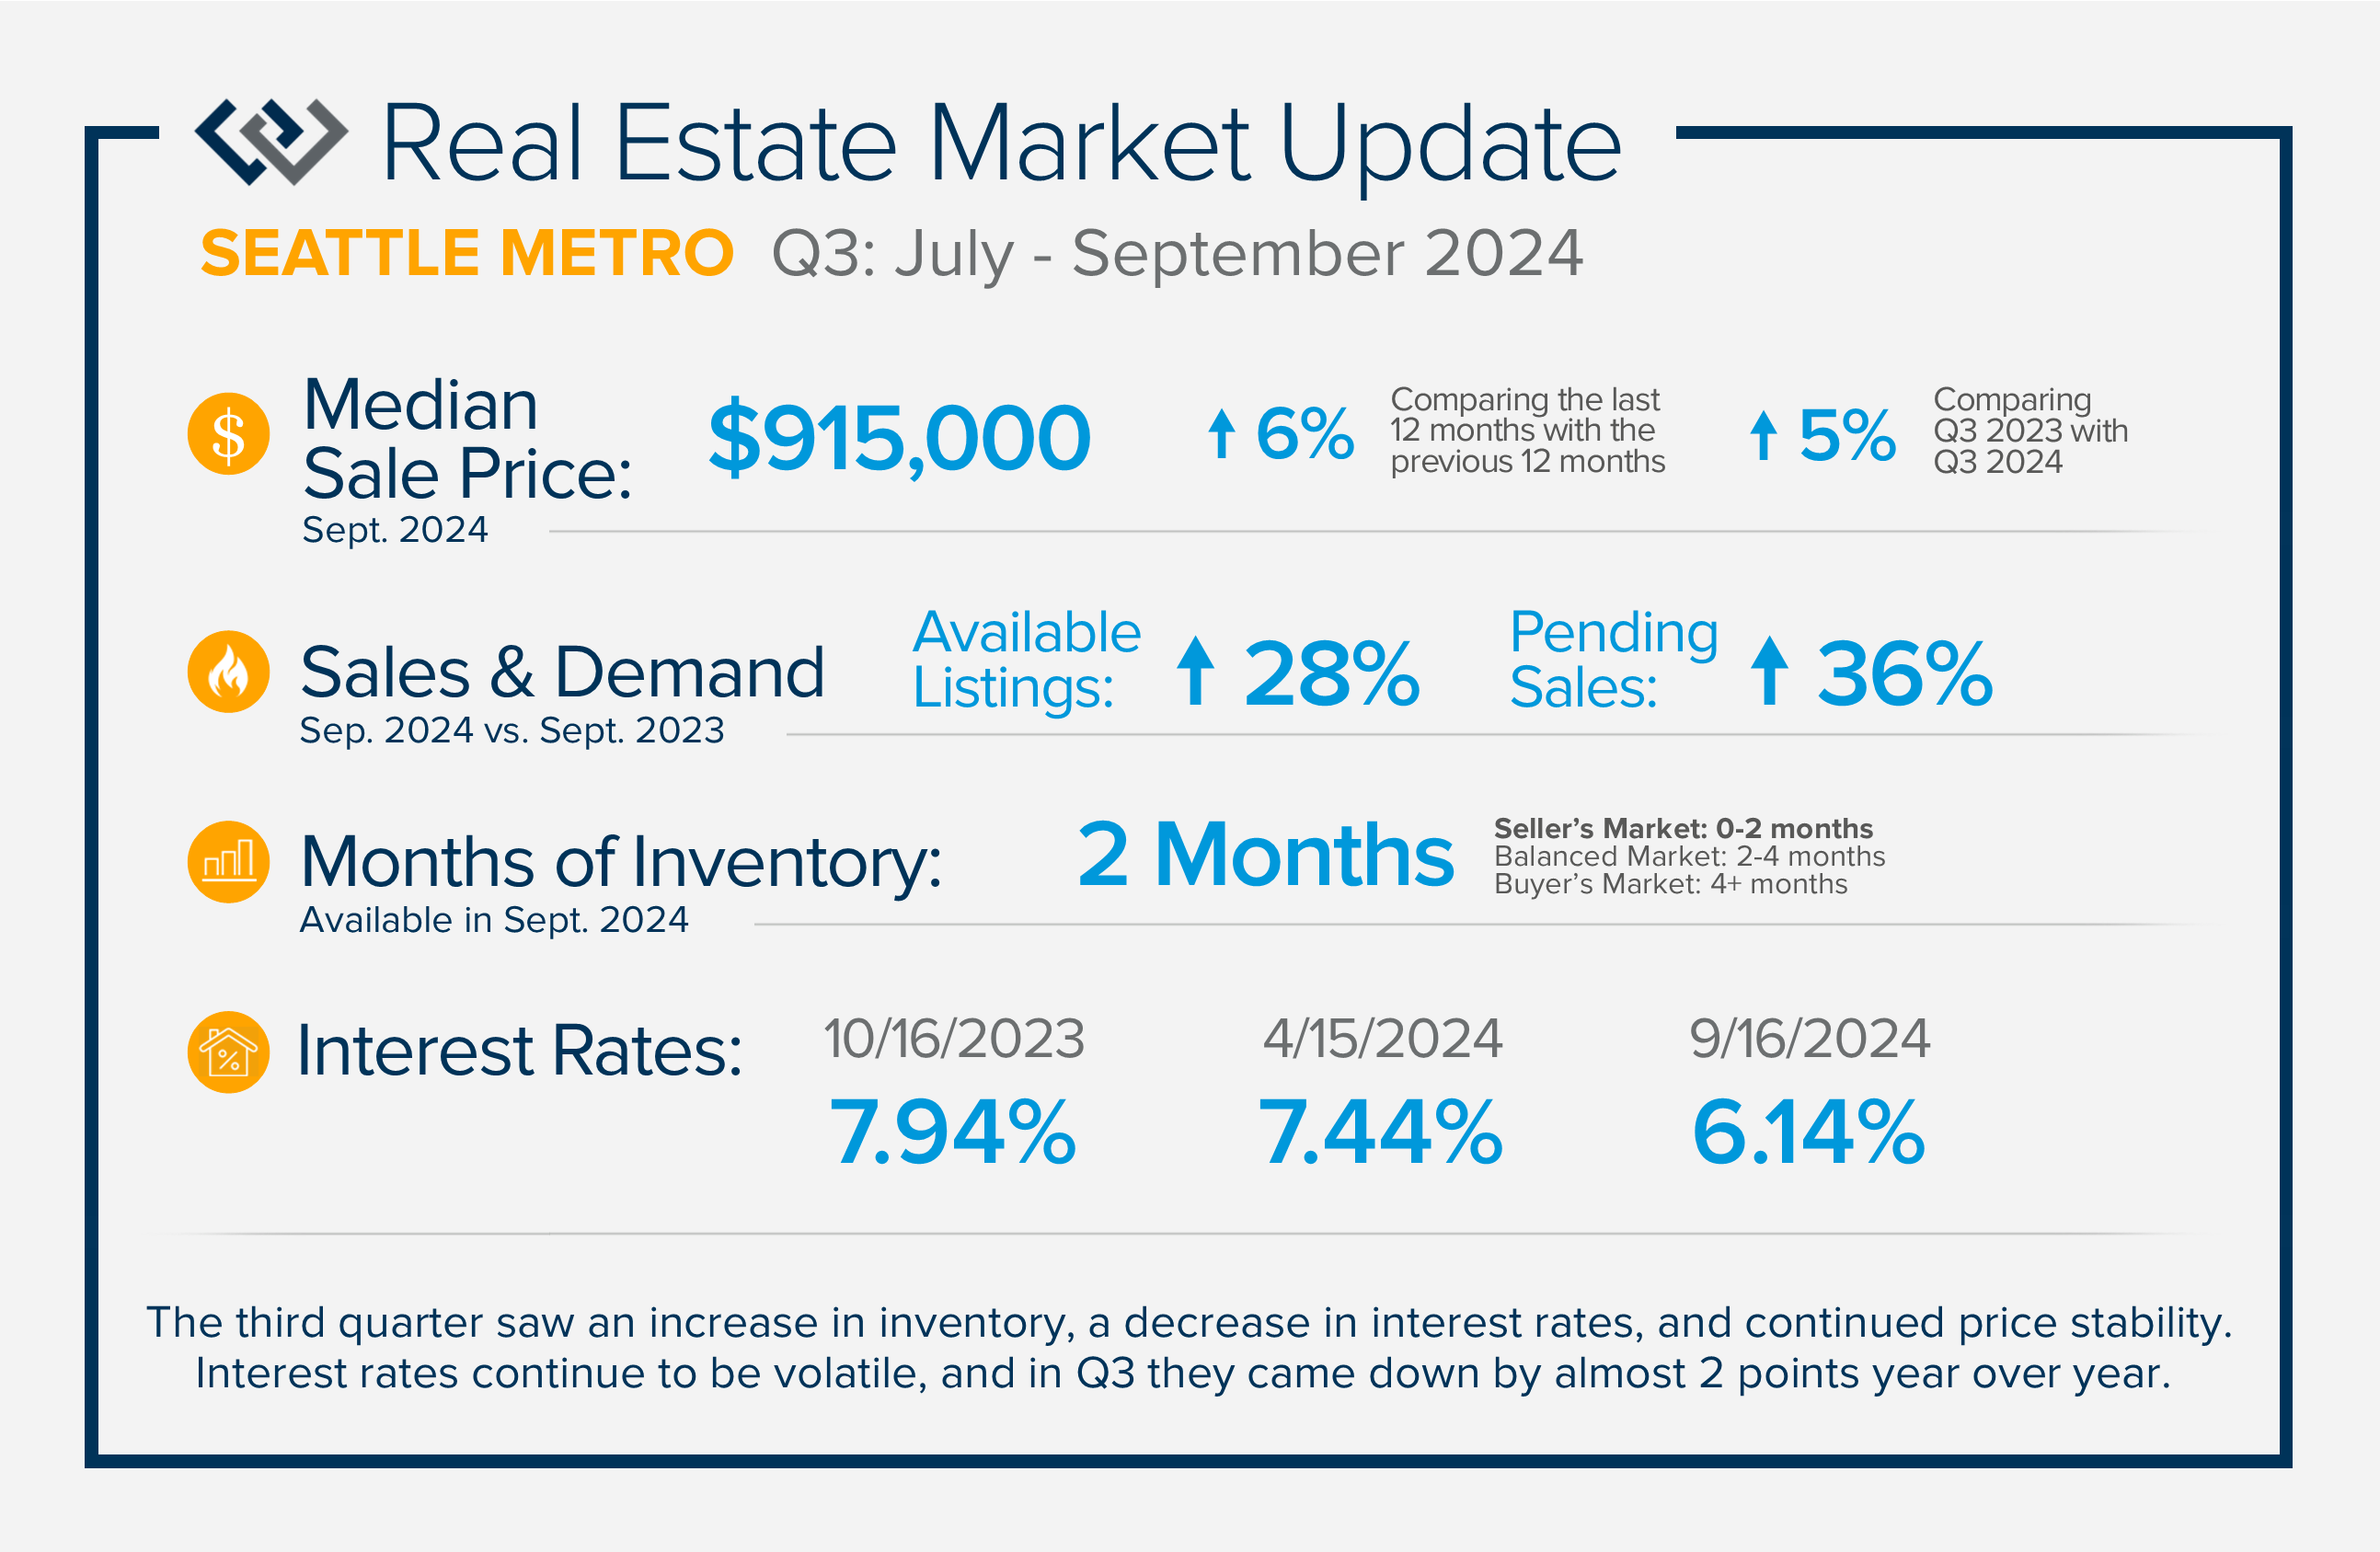
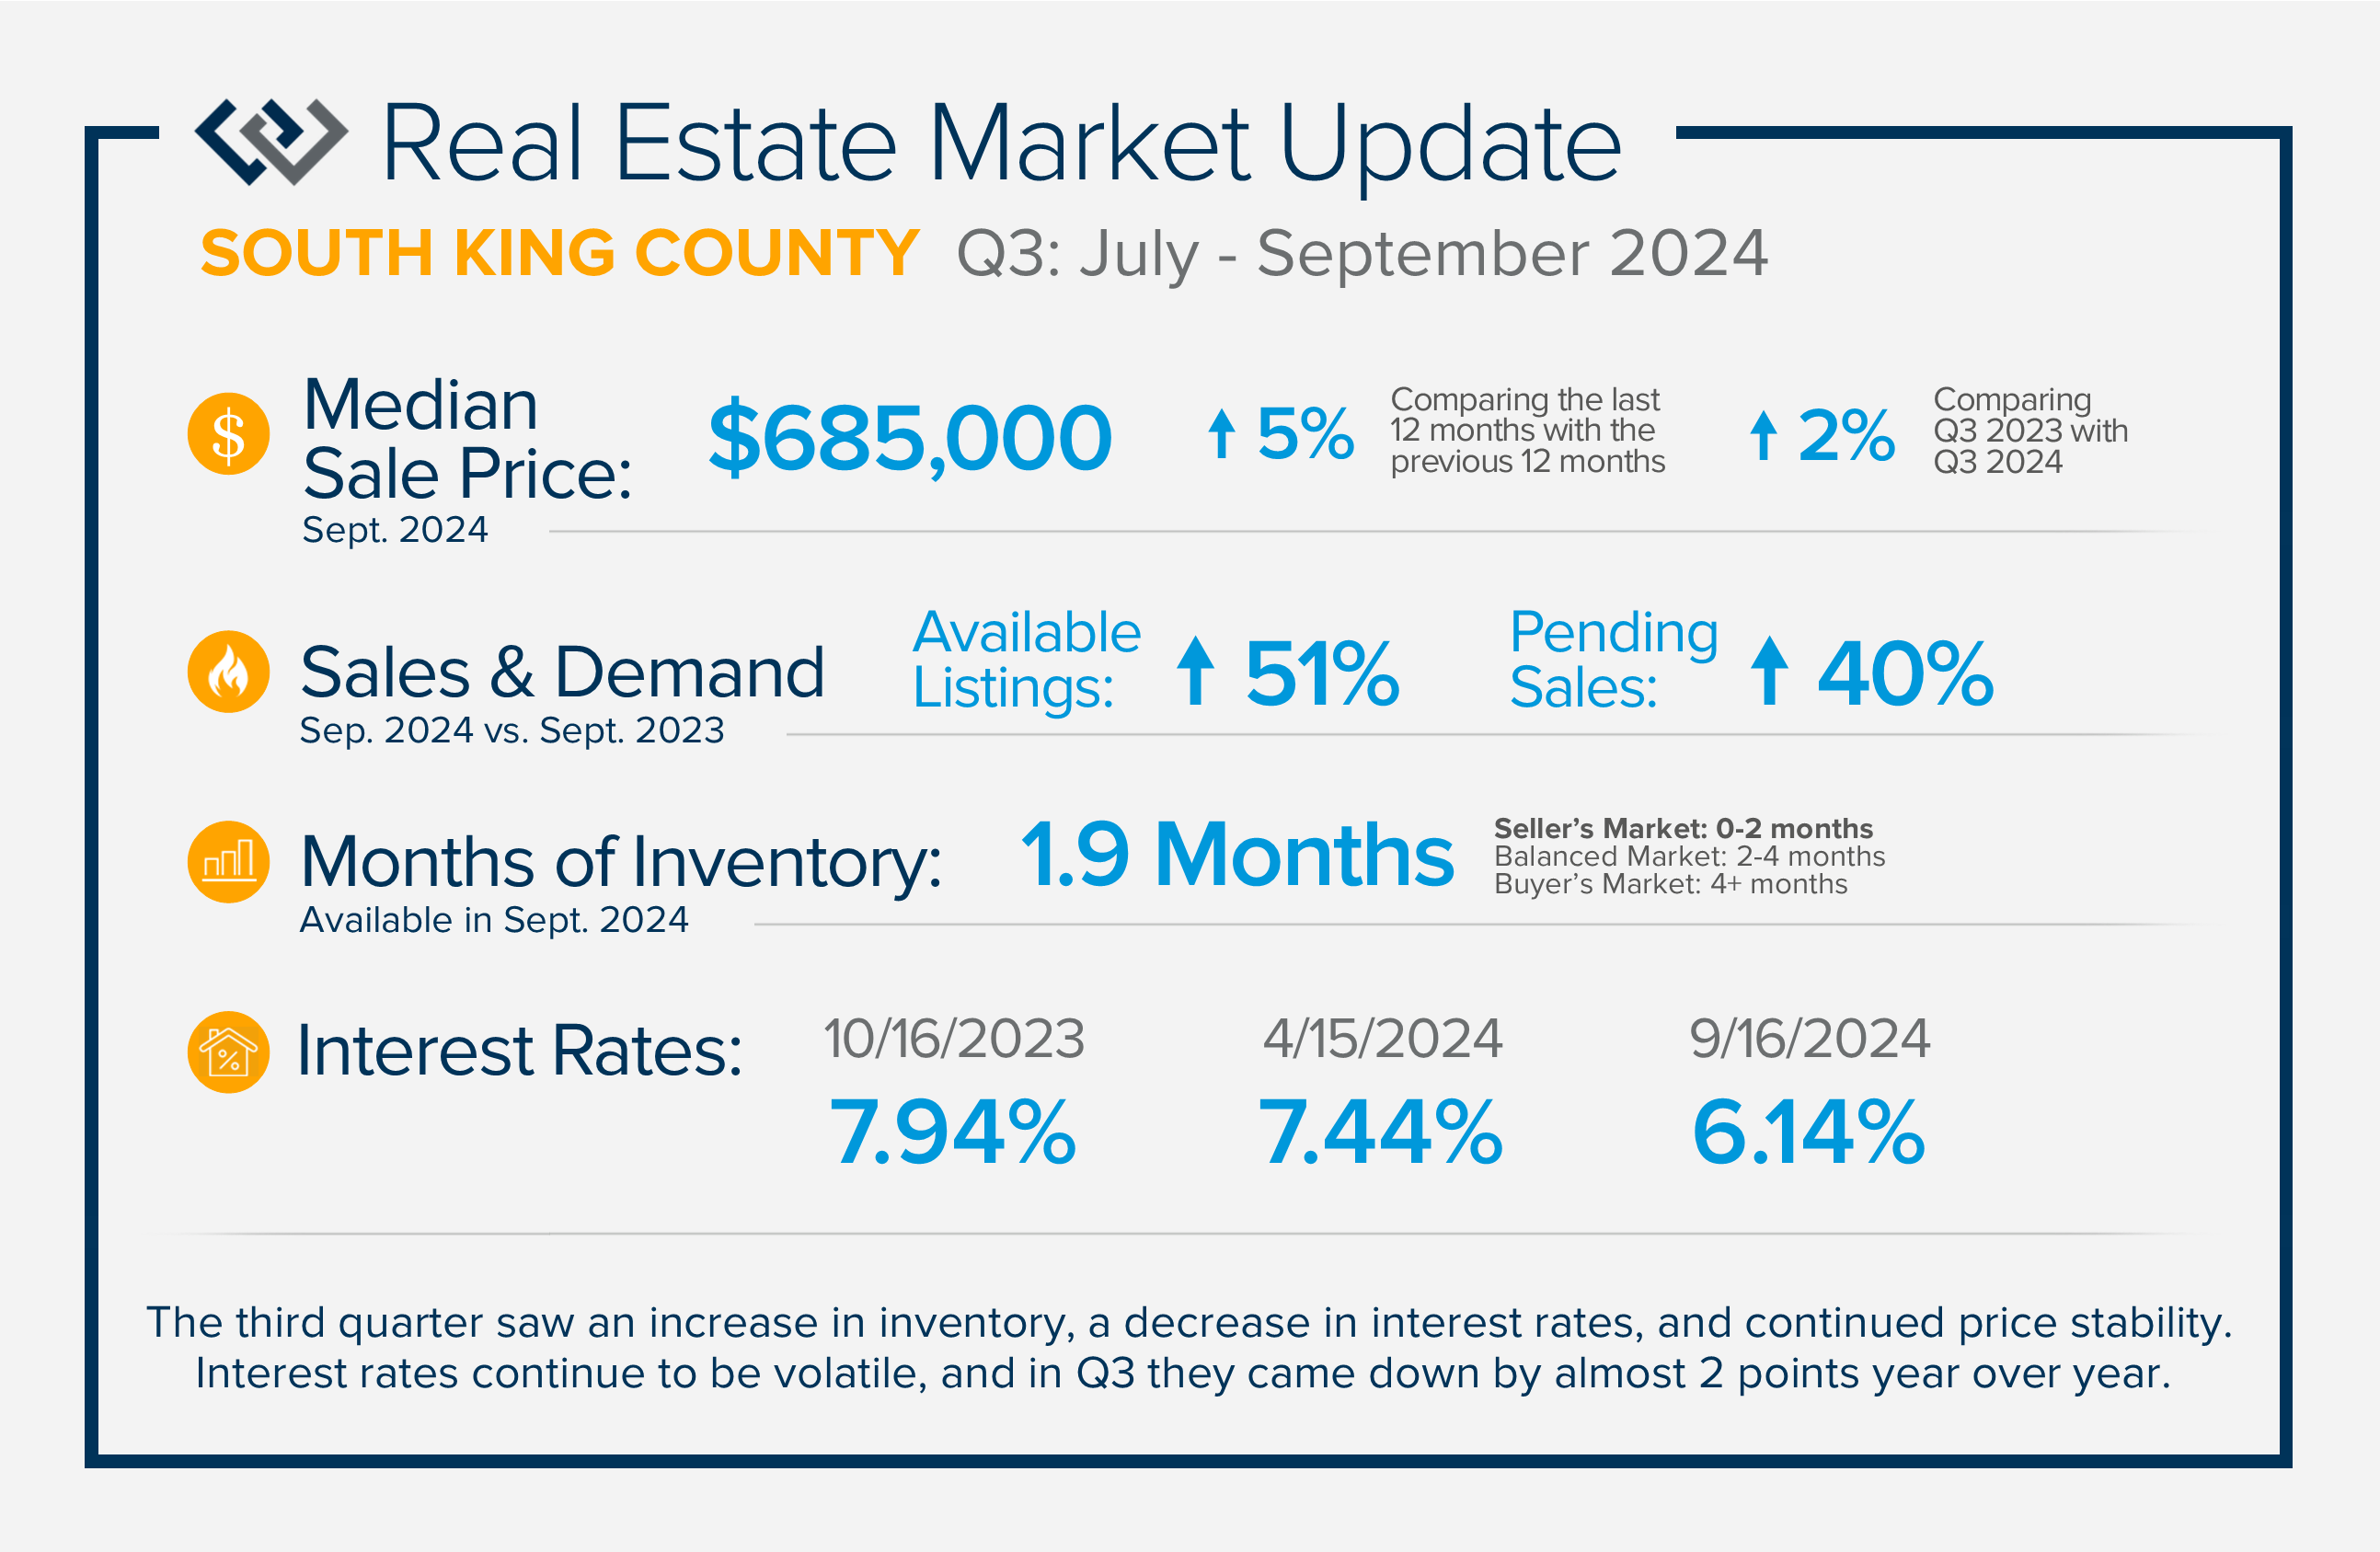
If you are curious about how market conditions affect you, please reach out. We aim to educate our clients to empower strong decisions.
QUARTERLY REPORTS Q2 2024

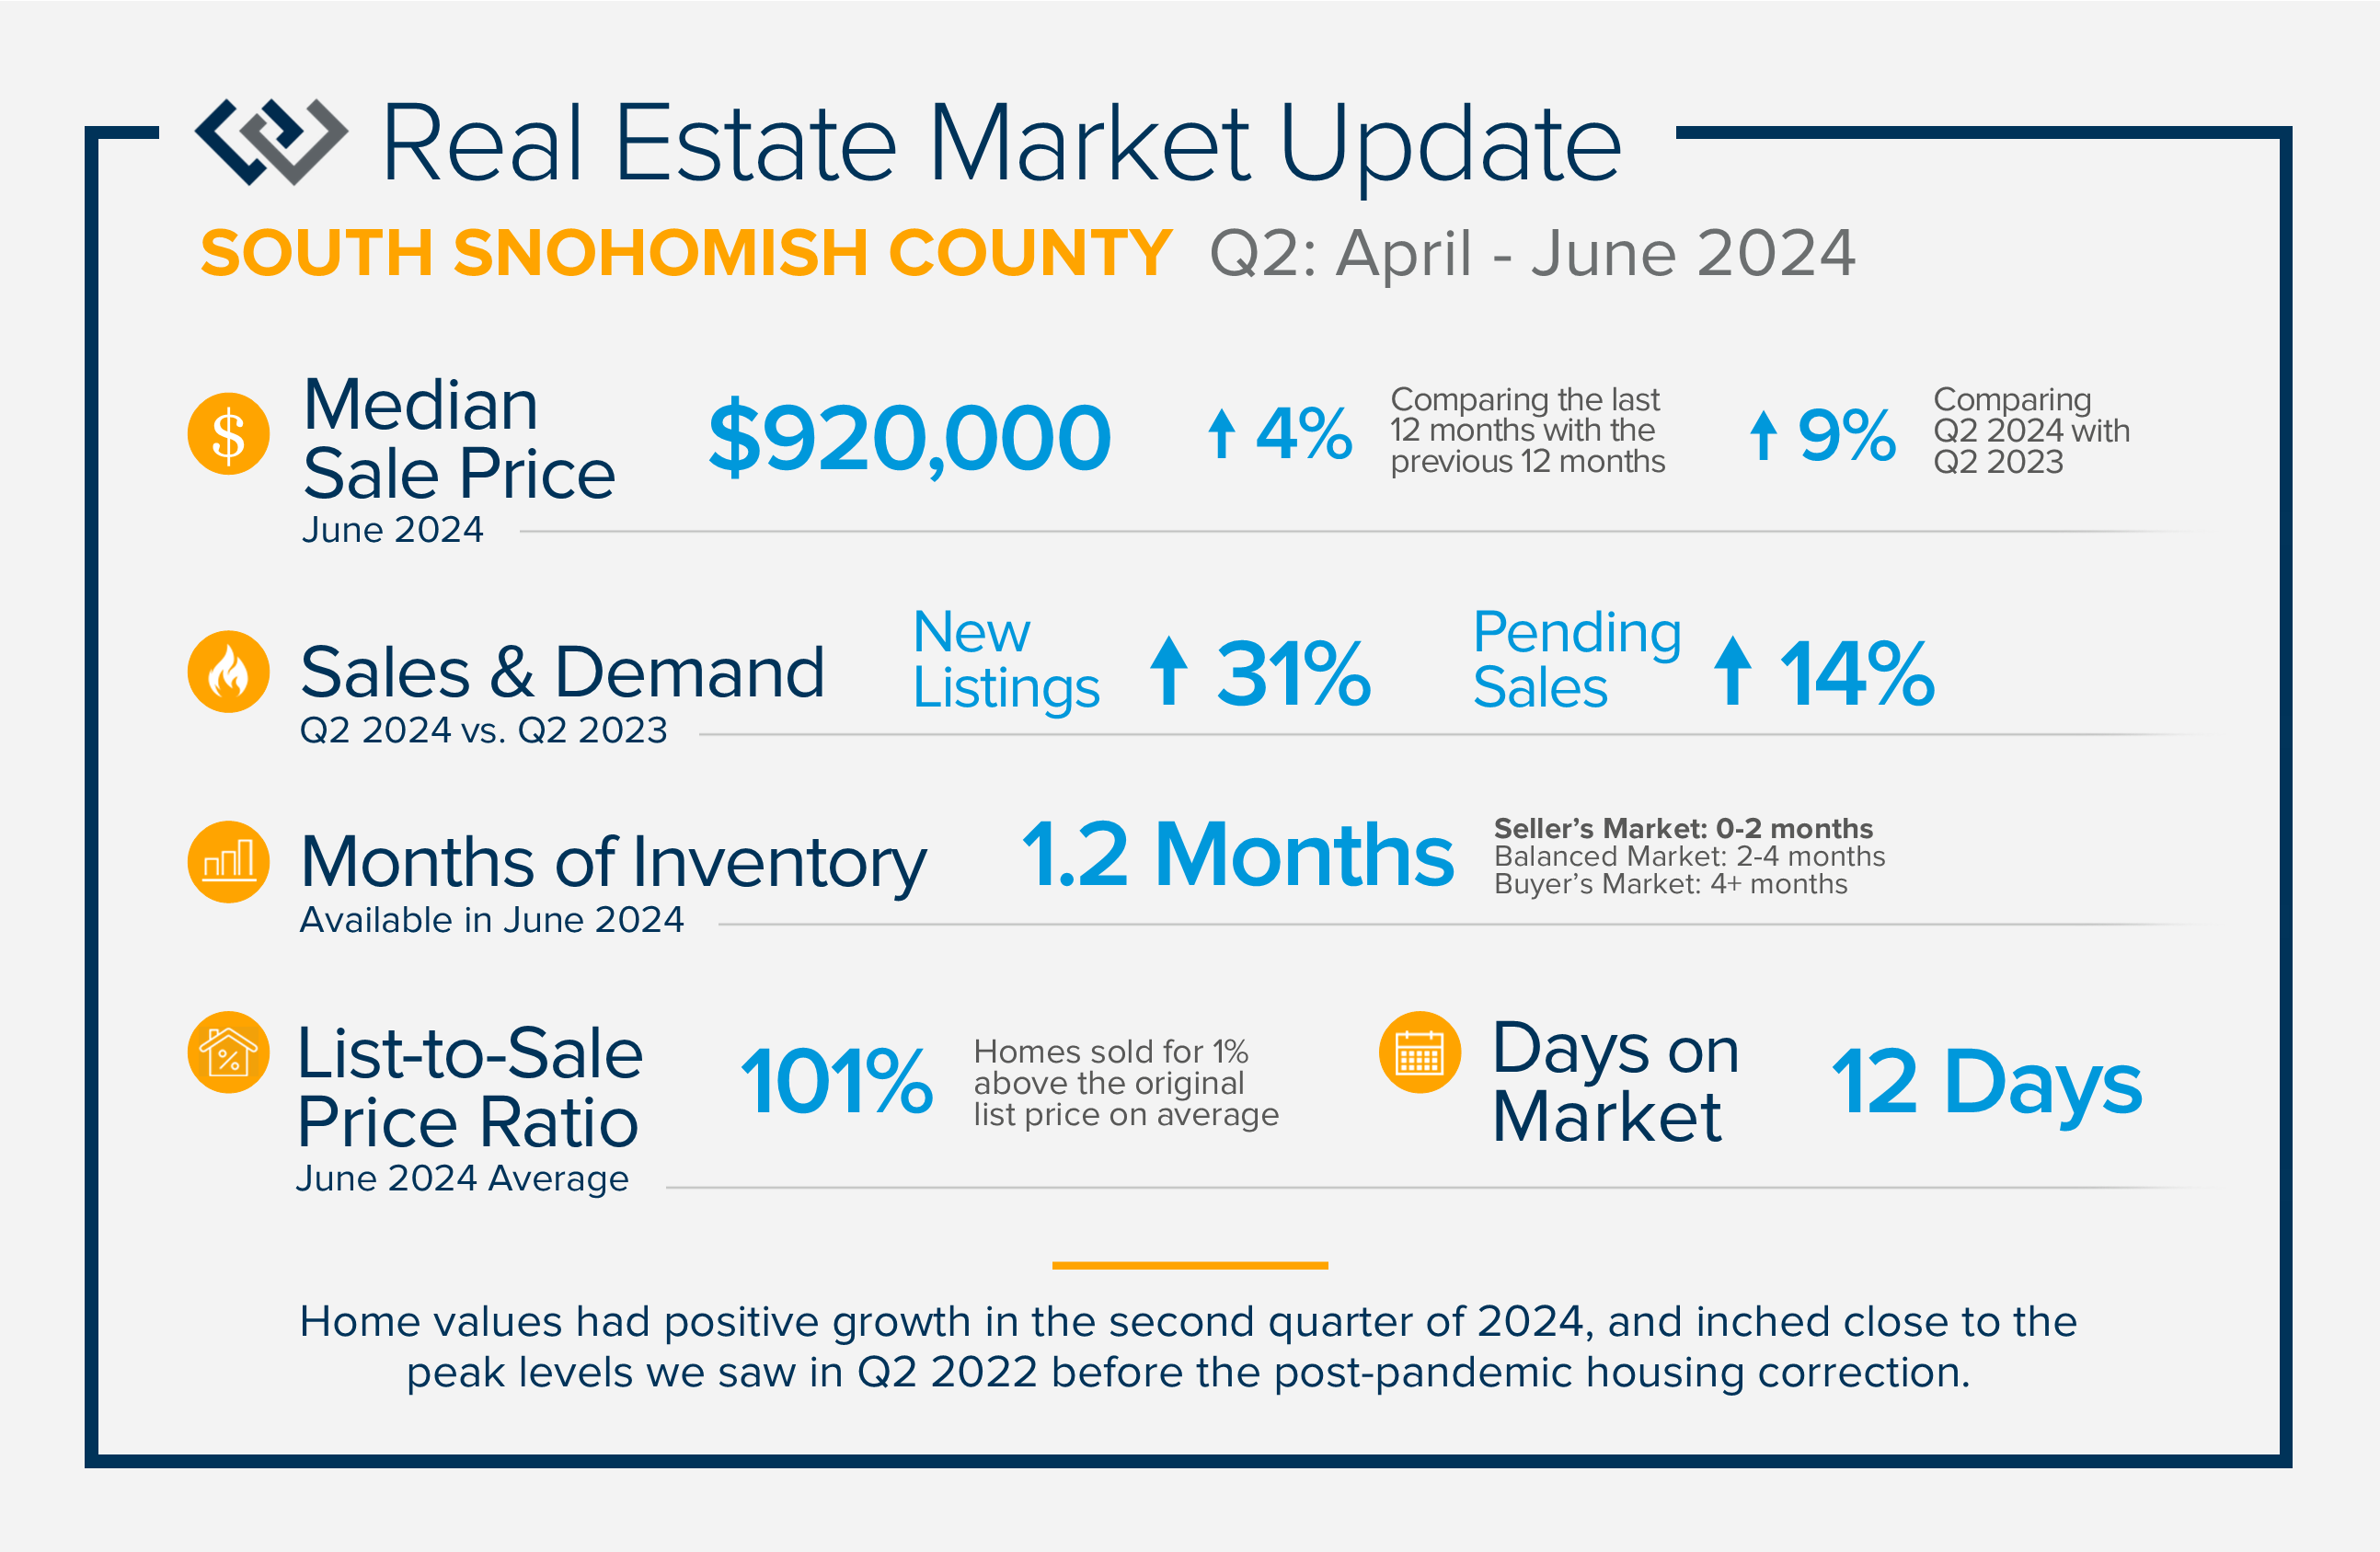
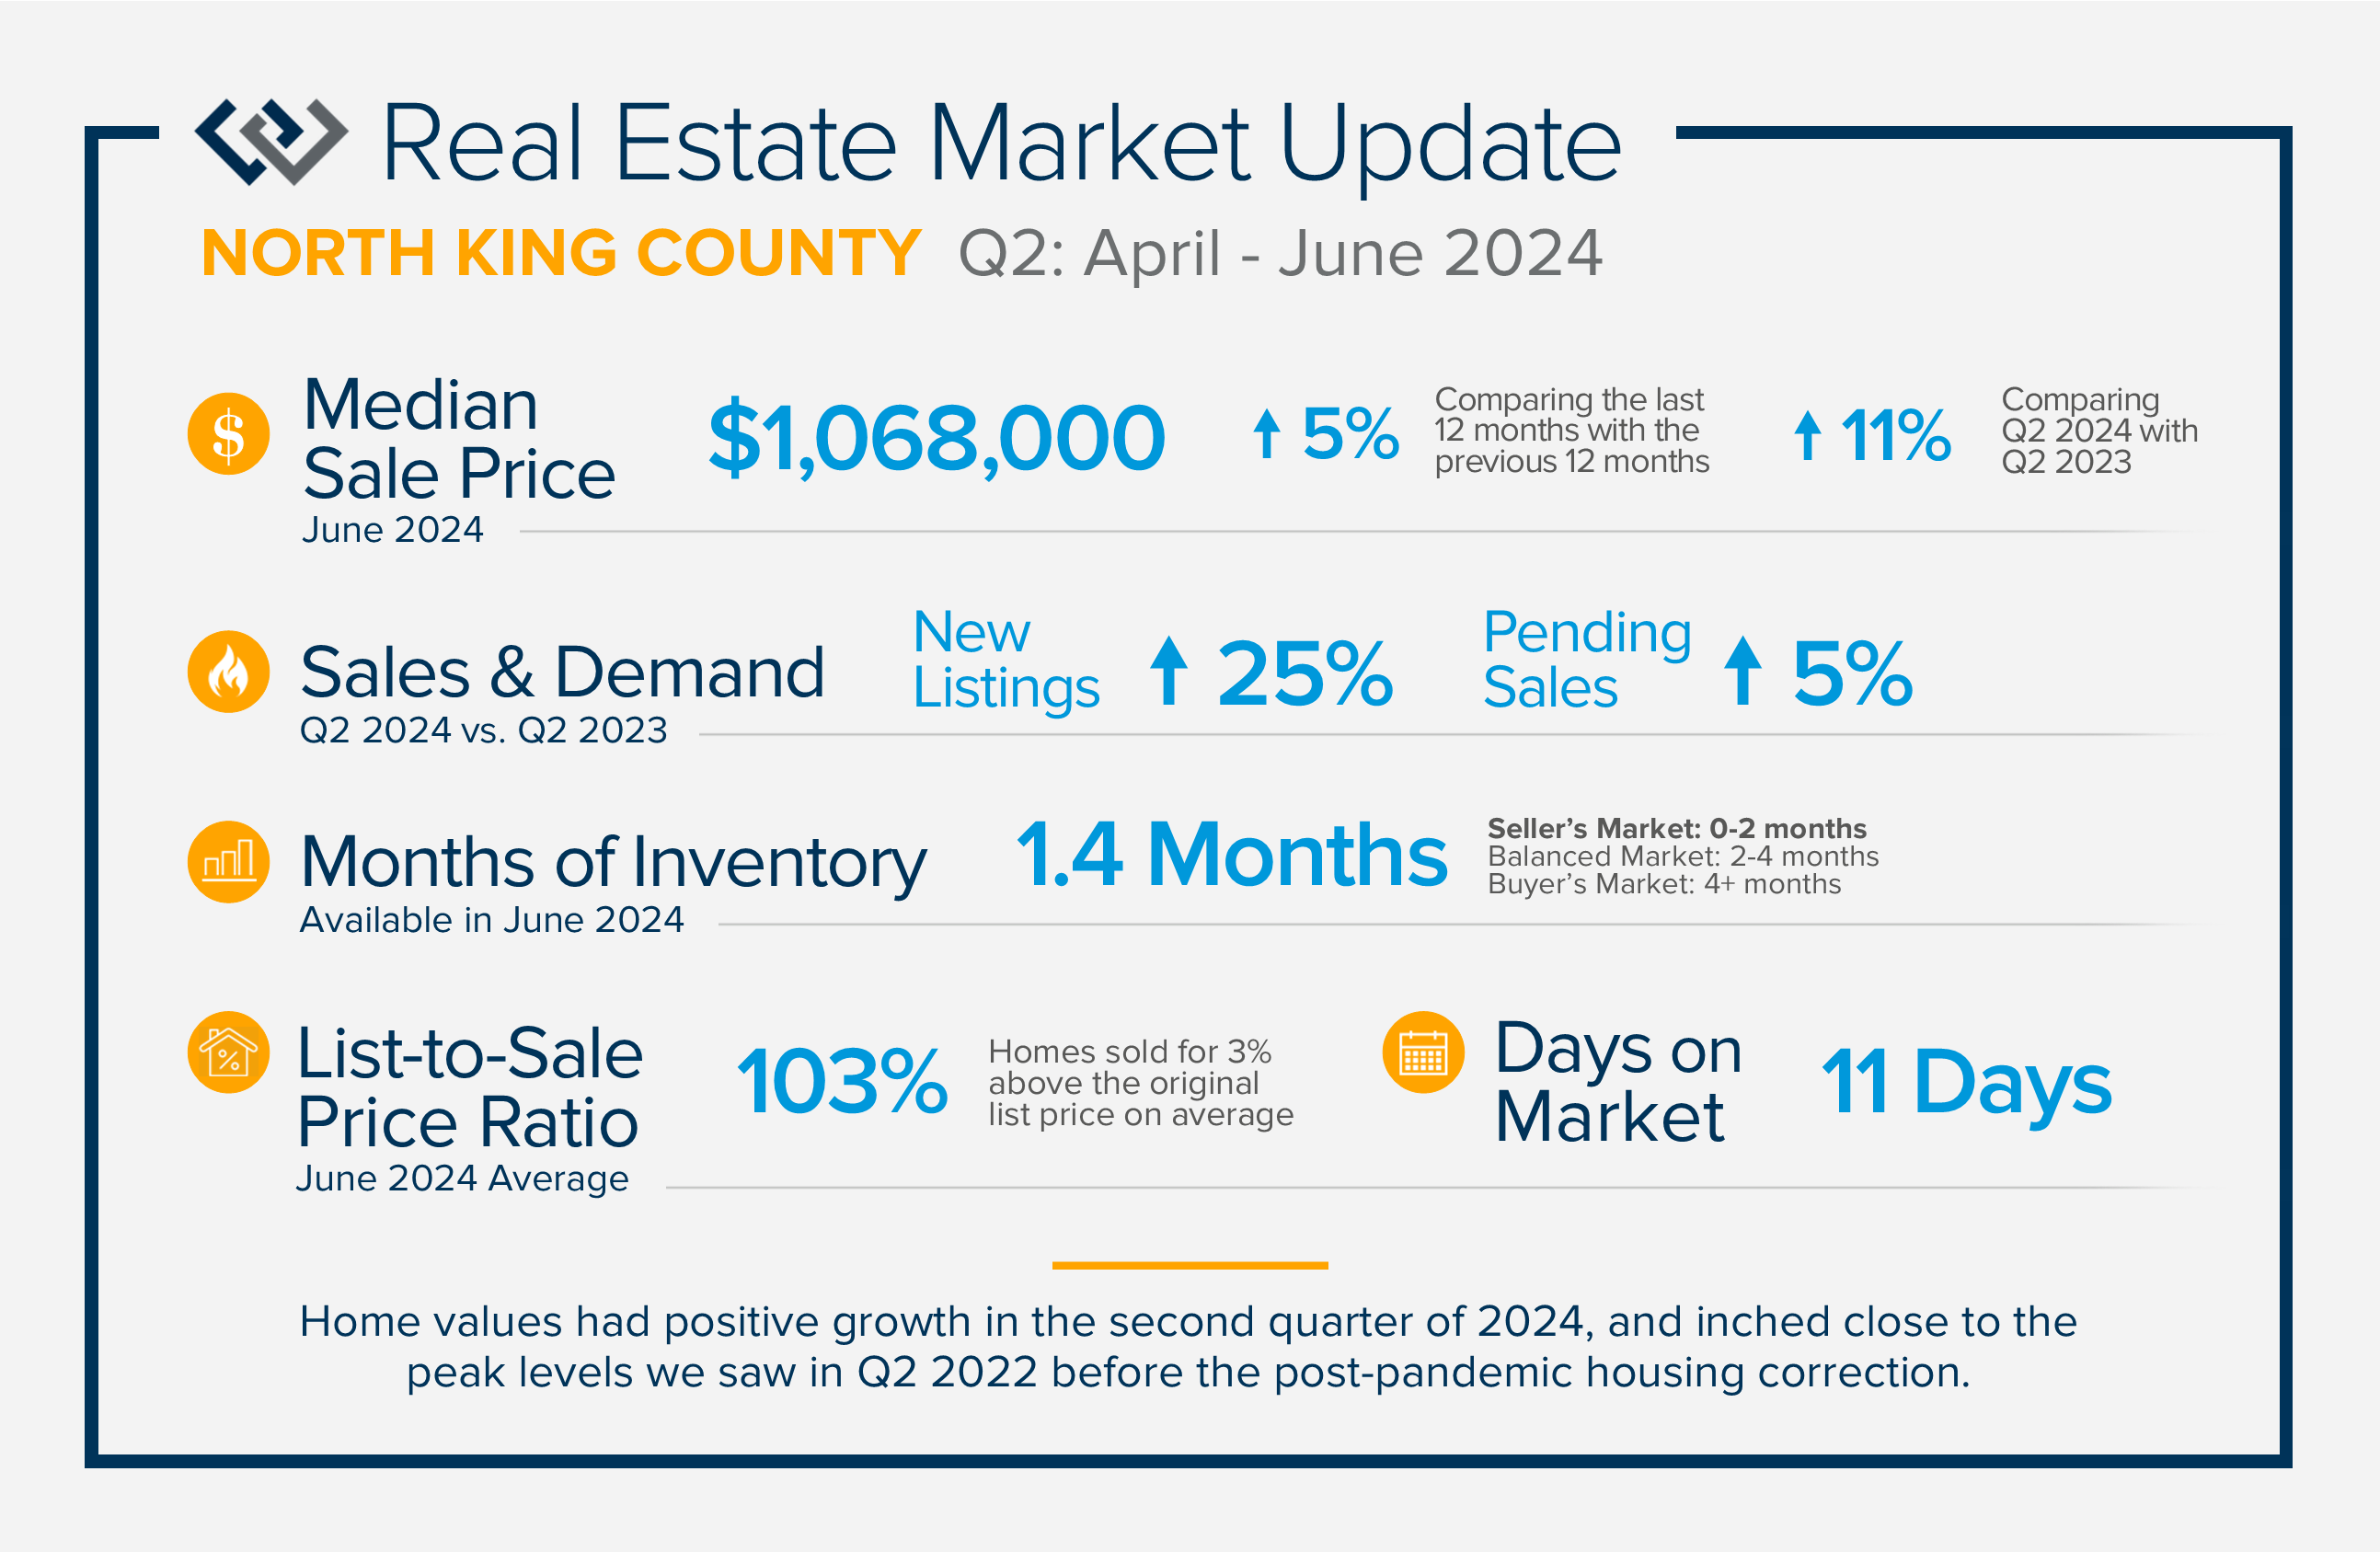
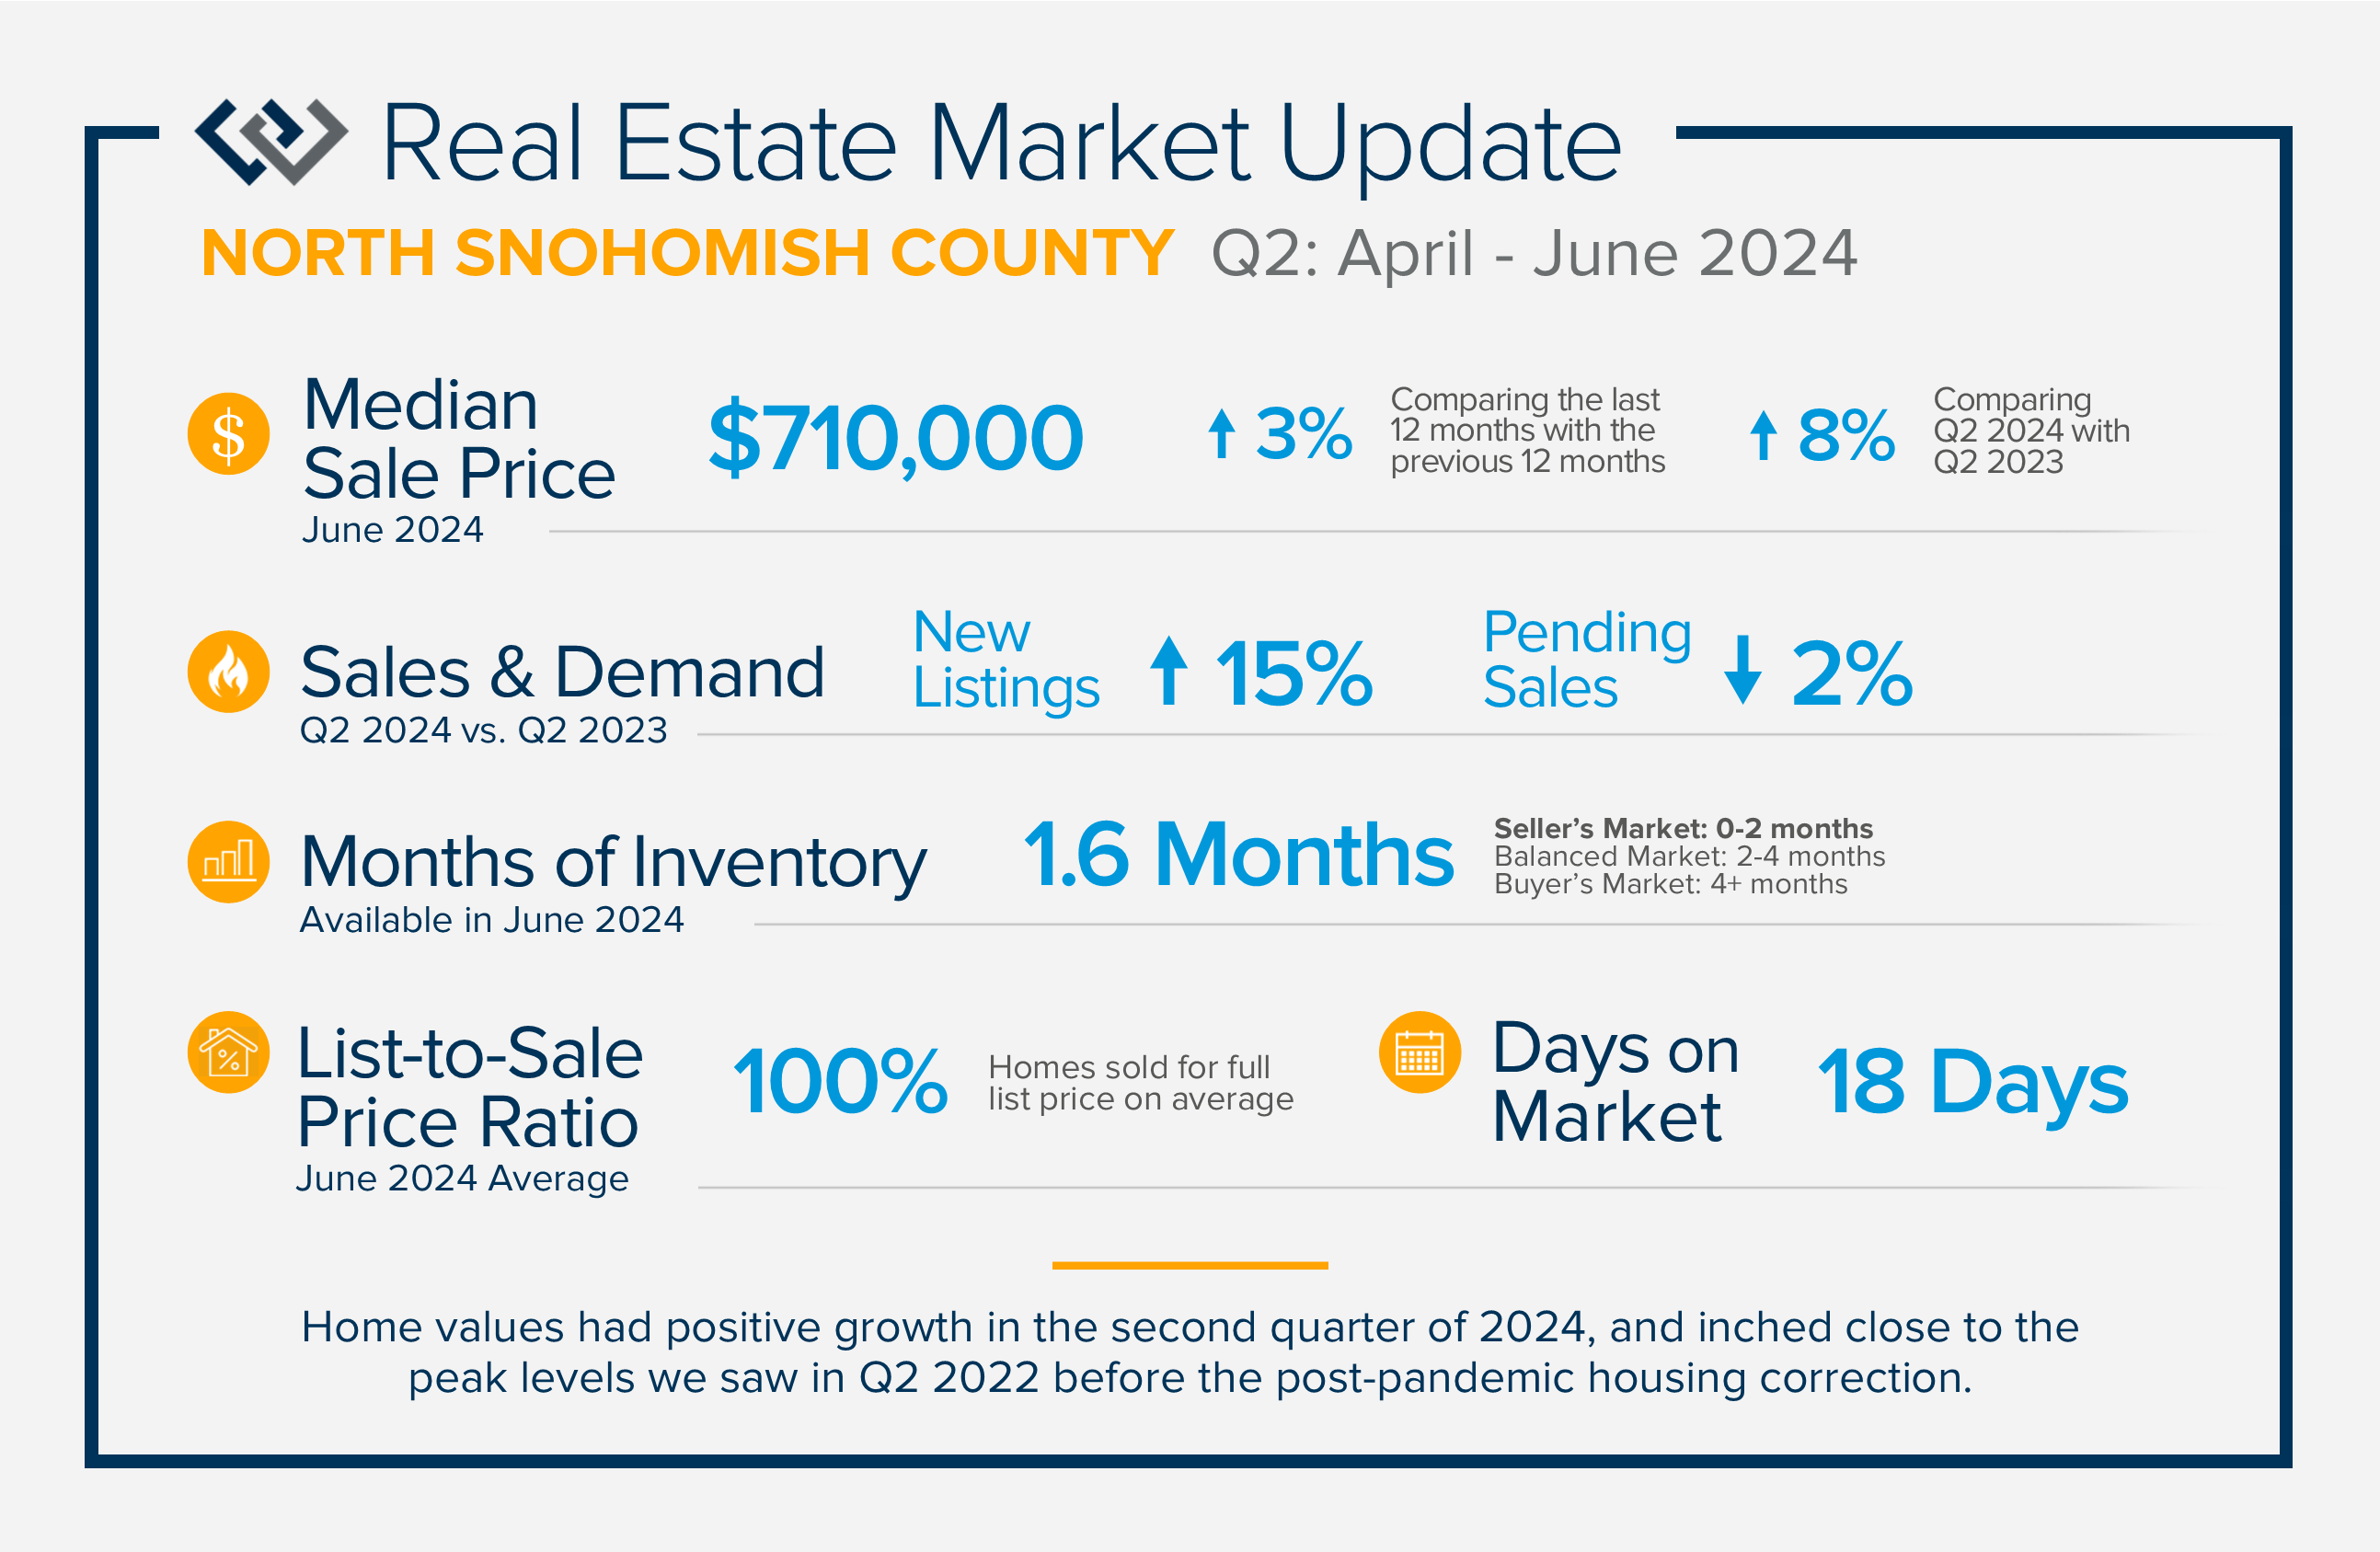
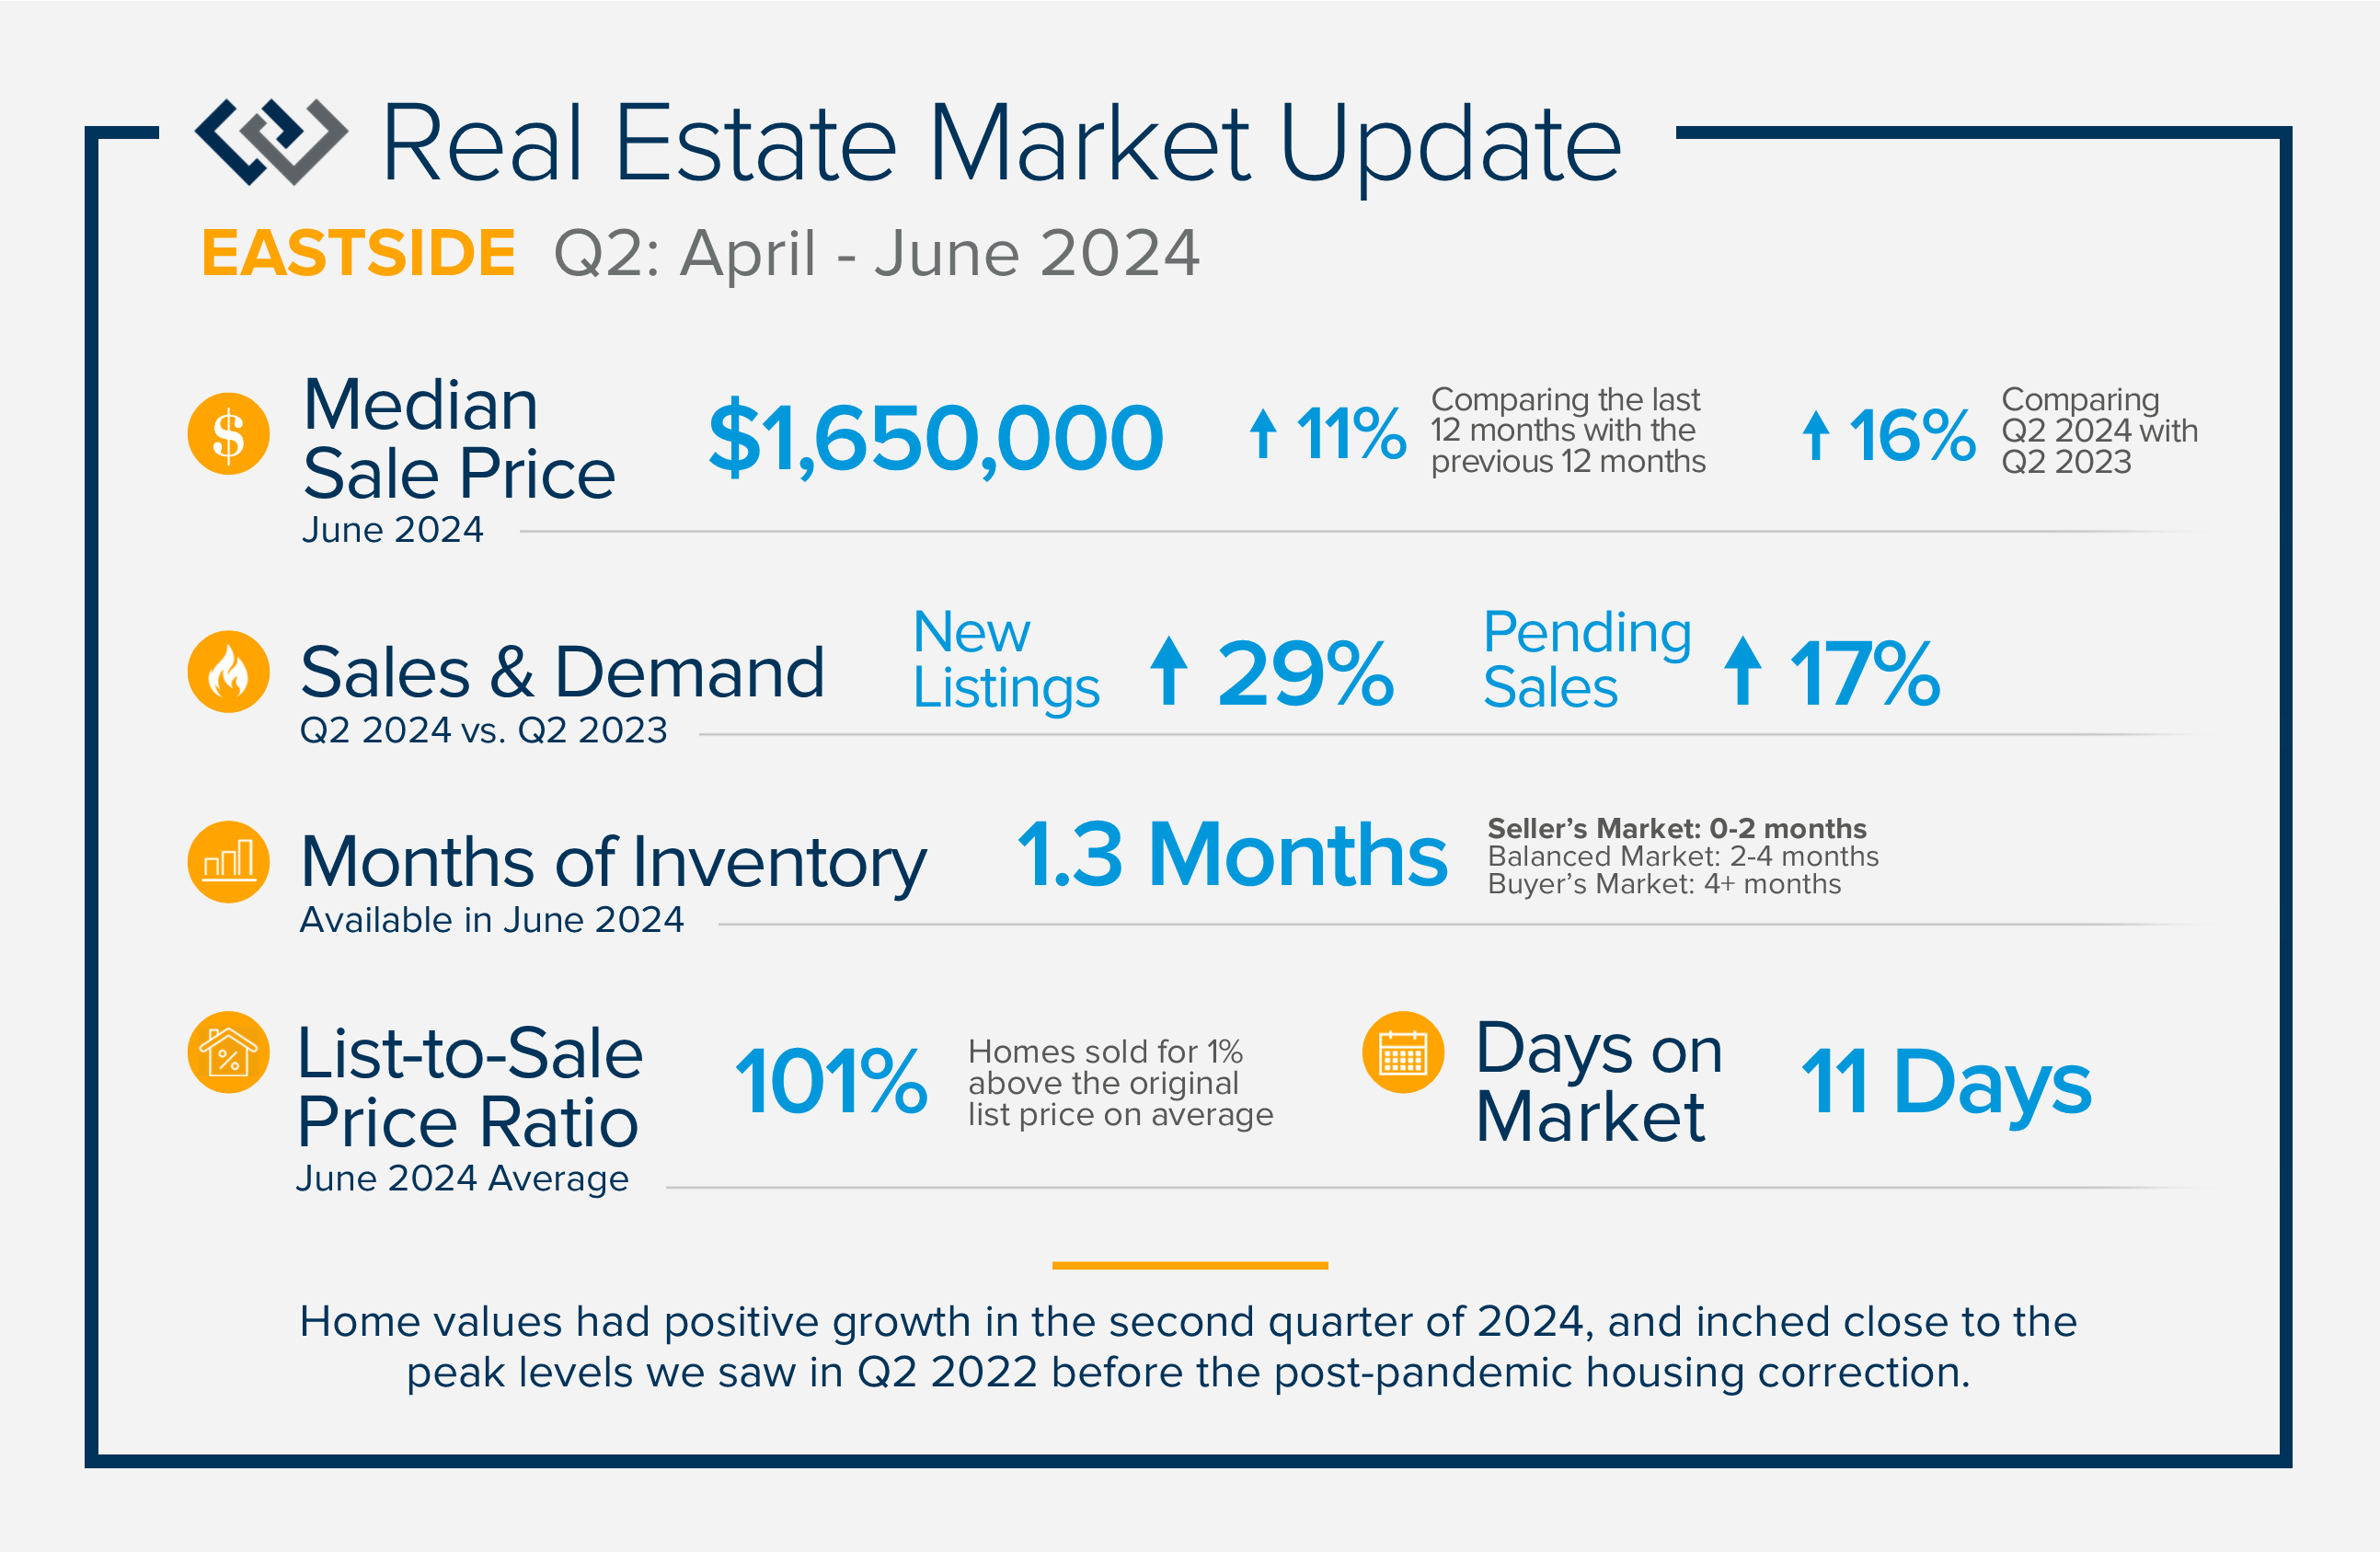
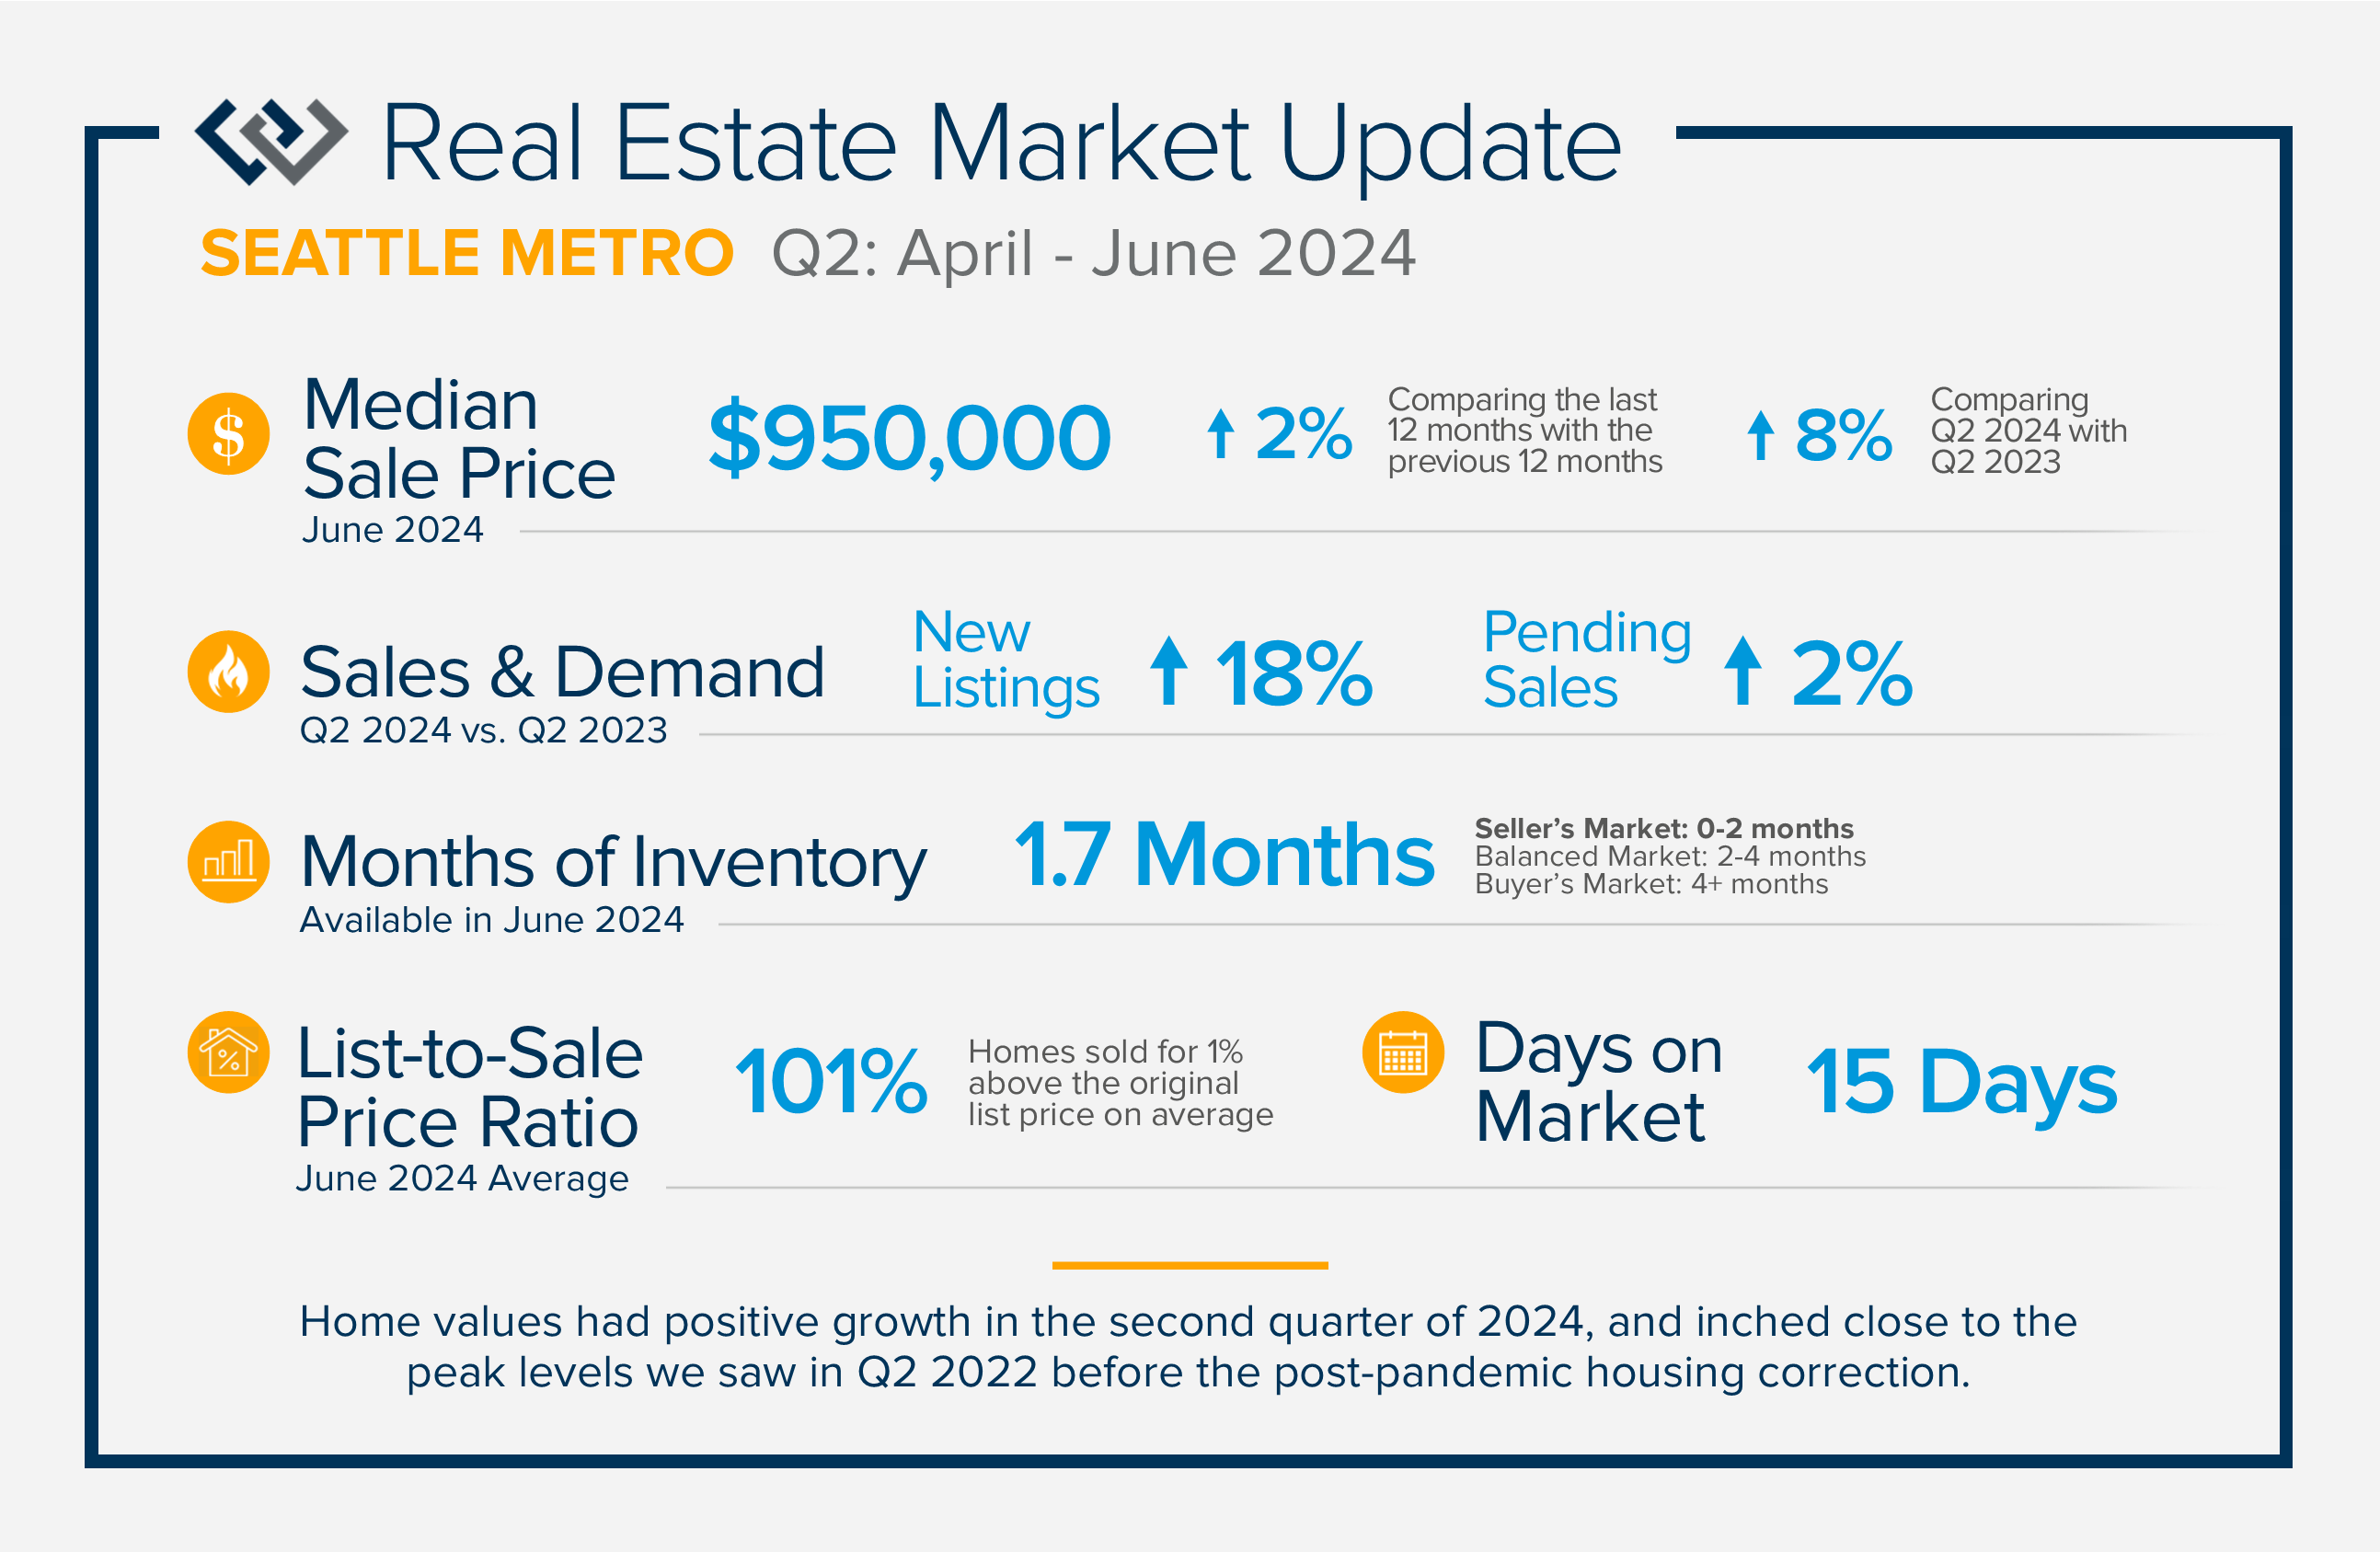
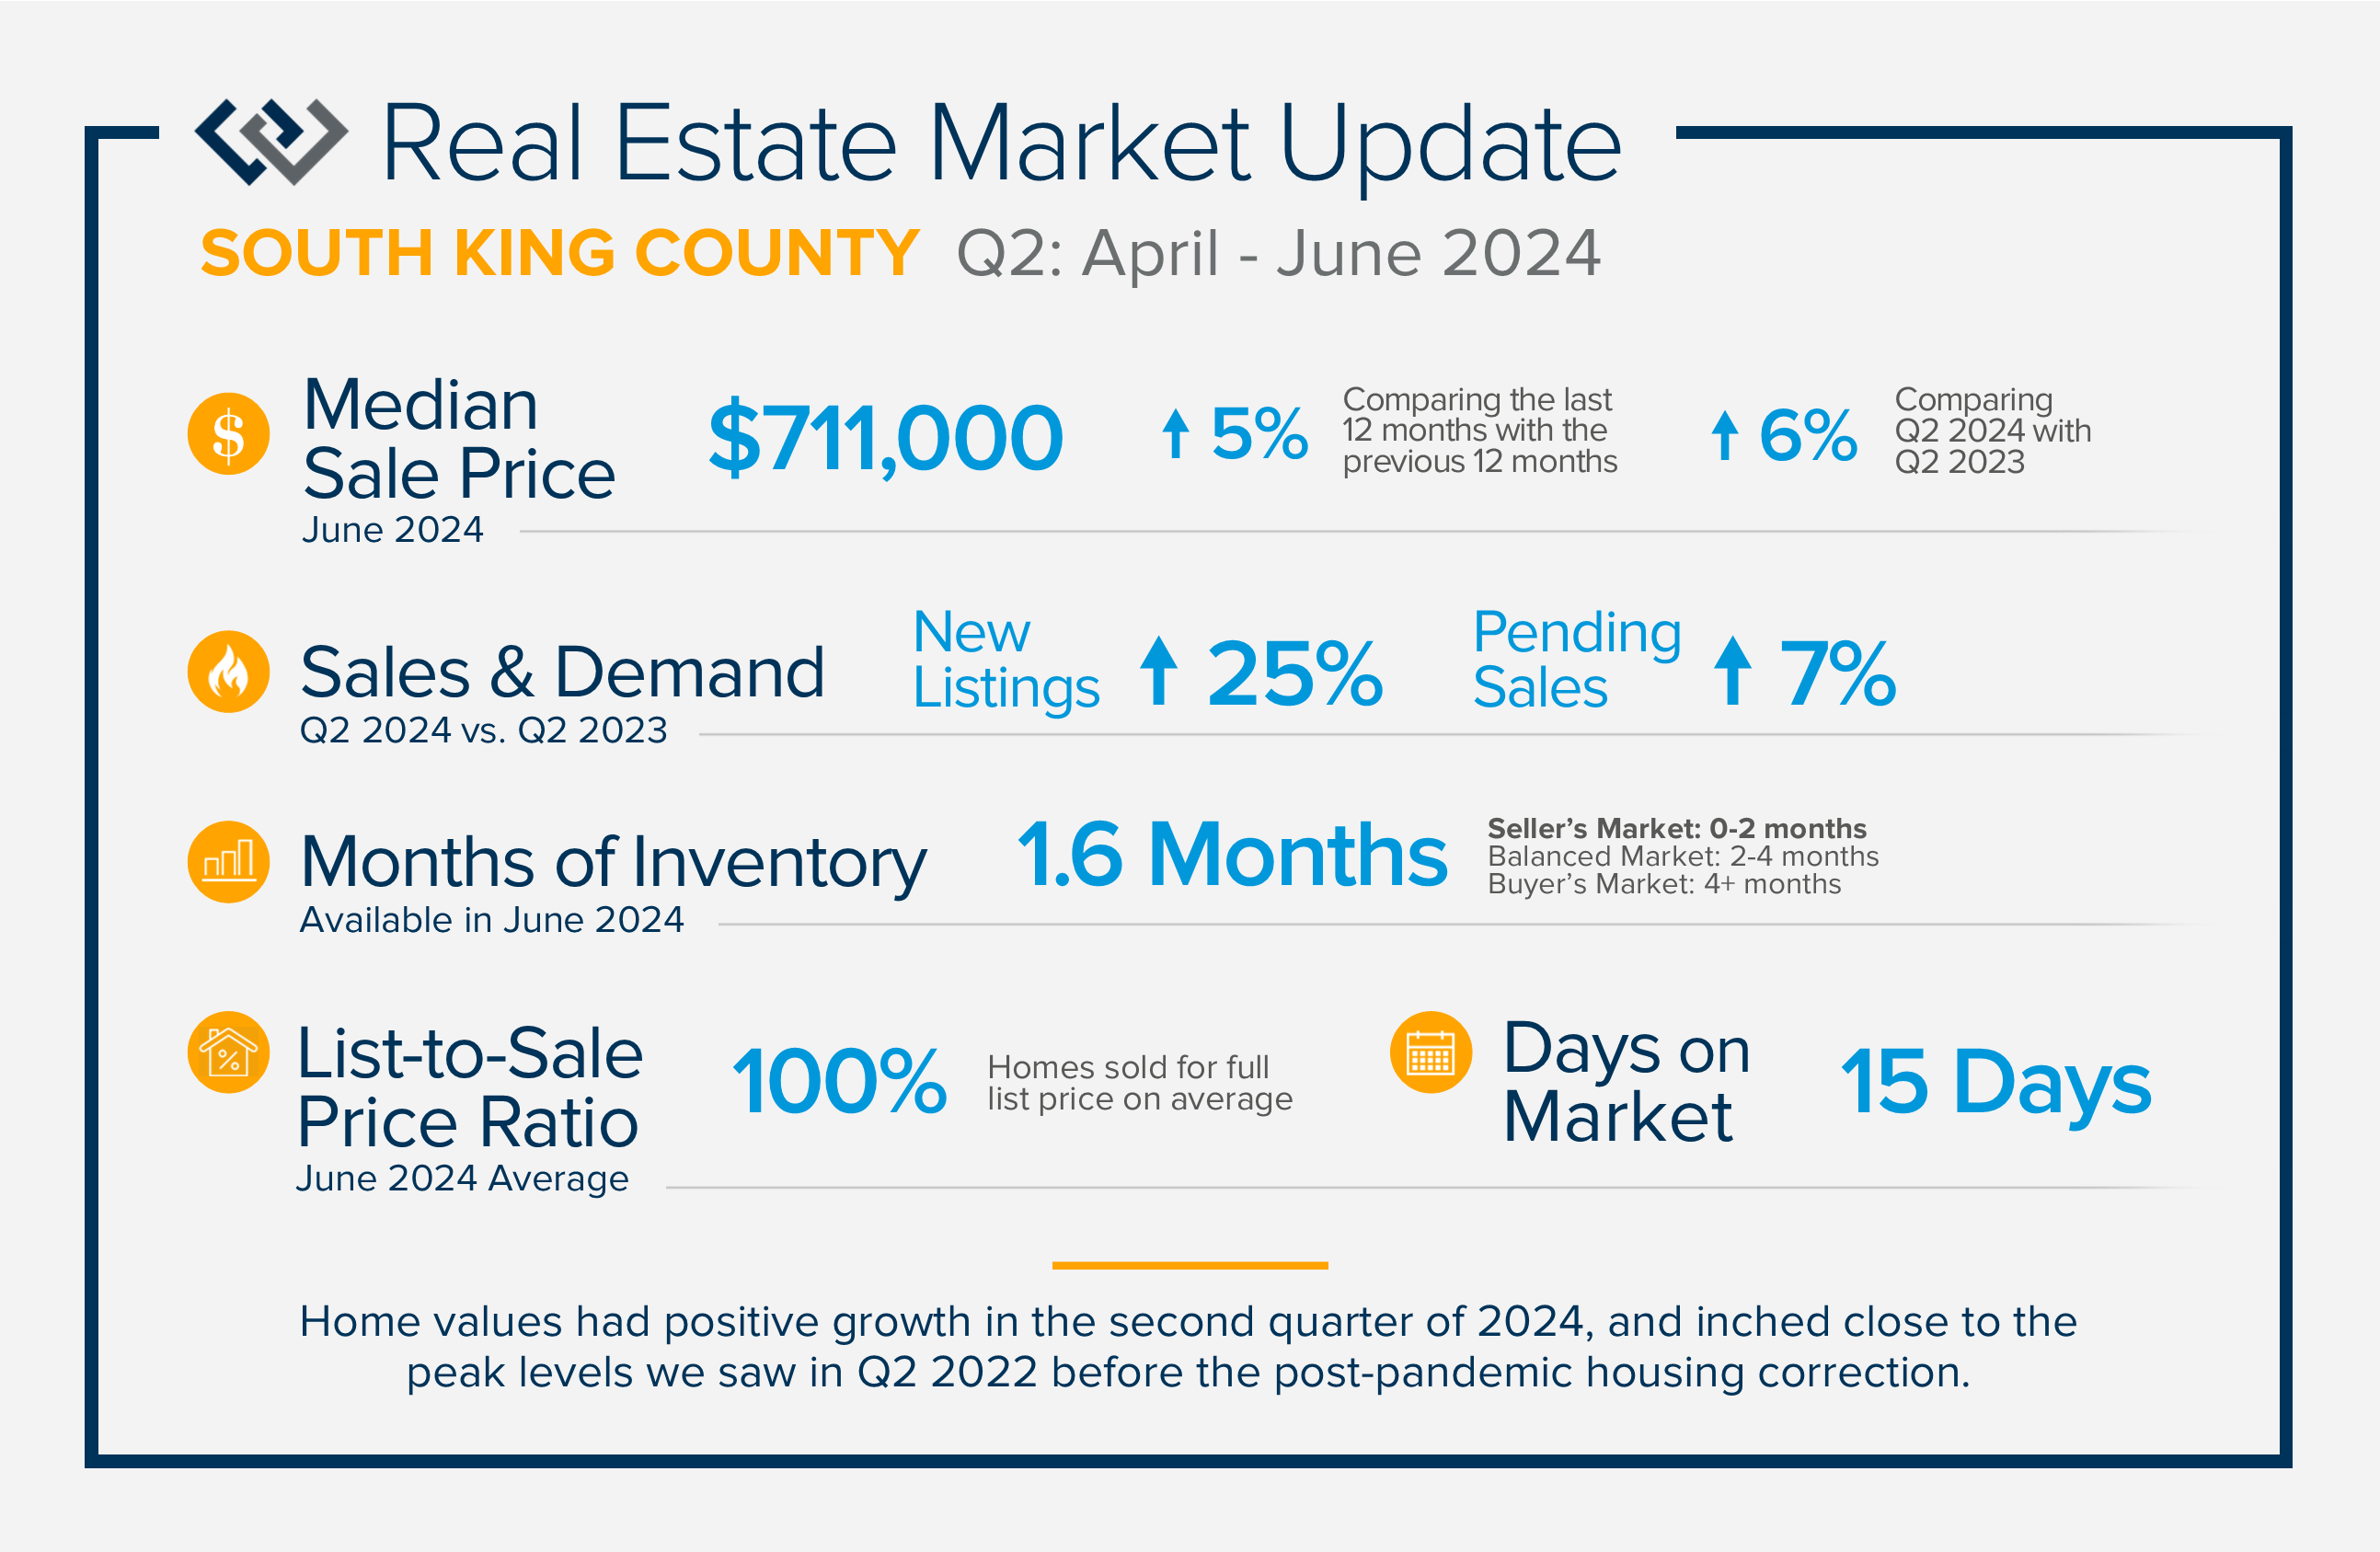
Home values had positive growth in the second quarter of 2024, and inched close to the peak levels we saw in Q2 2022 before the post-pandemic housing correction. Despite inflation and interest rates remaining stubborn, demand has continued to be strong, resulting in a seller’s market.
A bright light for buyers is the recent uptick in new listings, which has opened up more opportunities after starting the year with minimal selection. Additional inventory will cause home prices to stabilize after rapid growth over the last six months. The average homeowner has close to 60% in home equity resulting in great returns when making a sale.
If you are curious about how today’s market relates to your real estate goals, please reach out. It is our goal to educate, inform, and empower strong decisions.
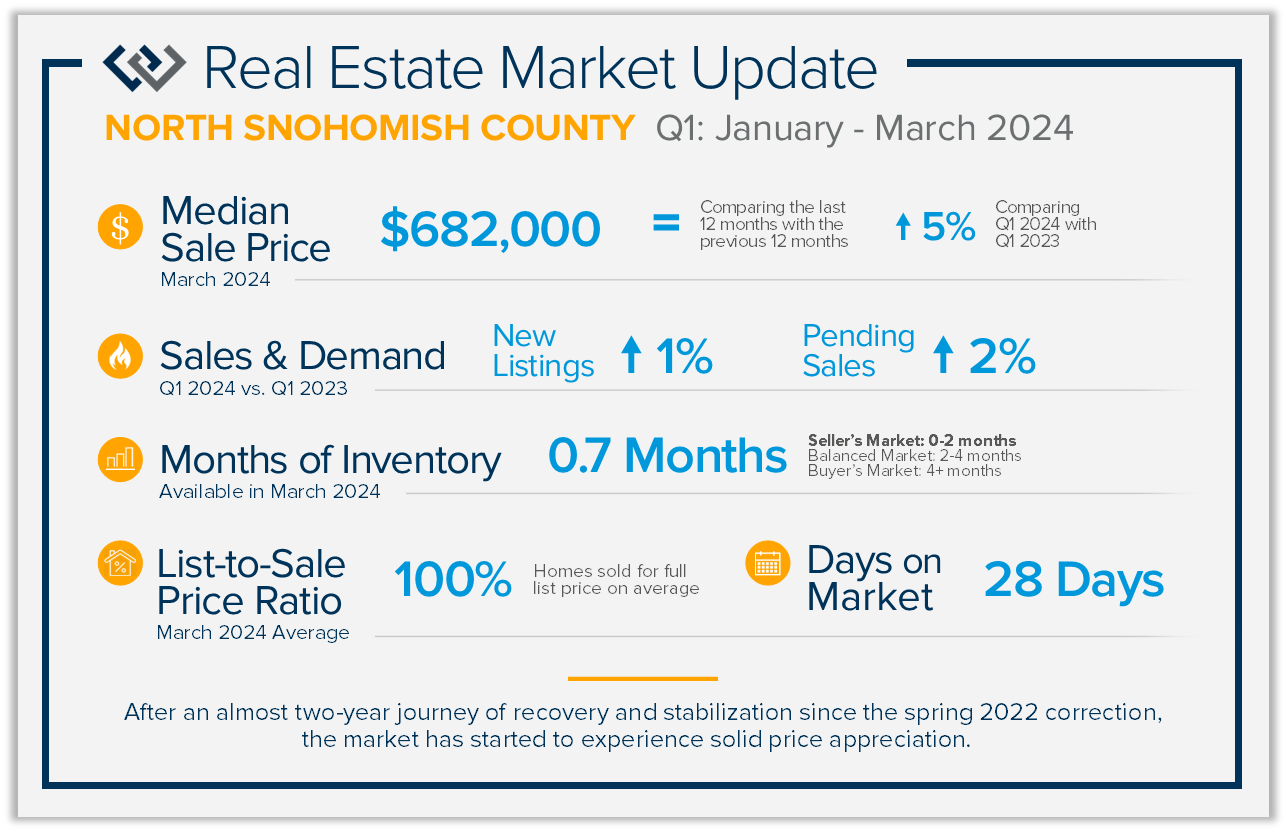
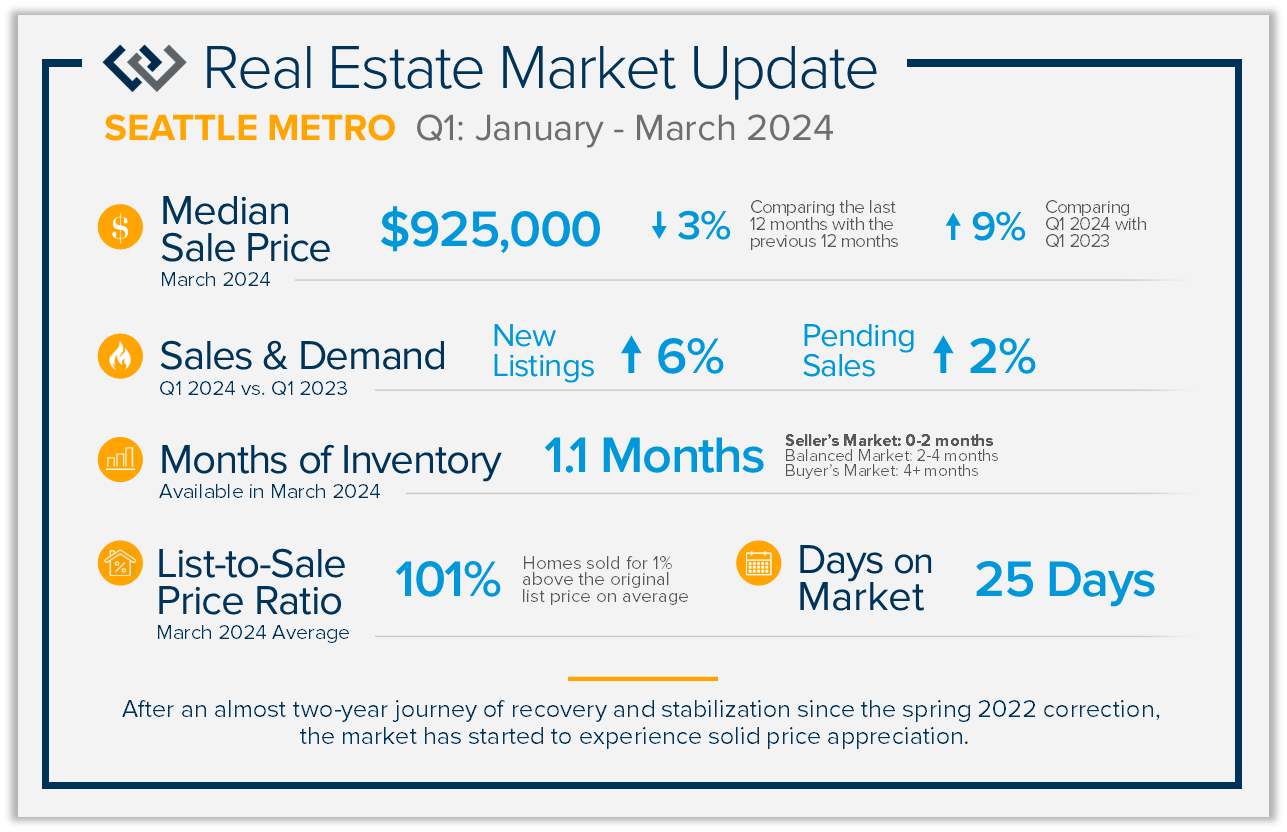
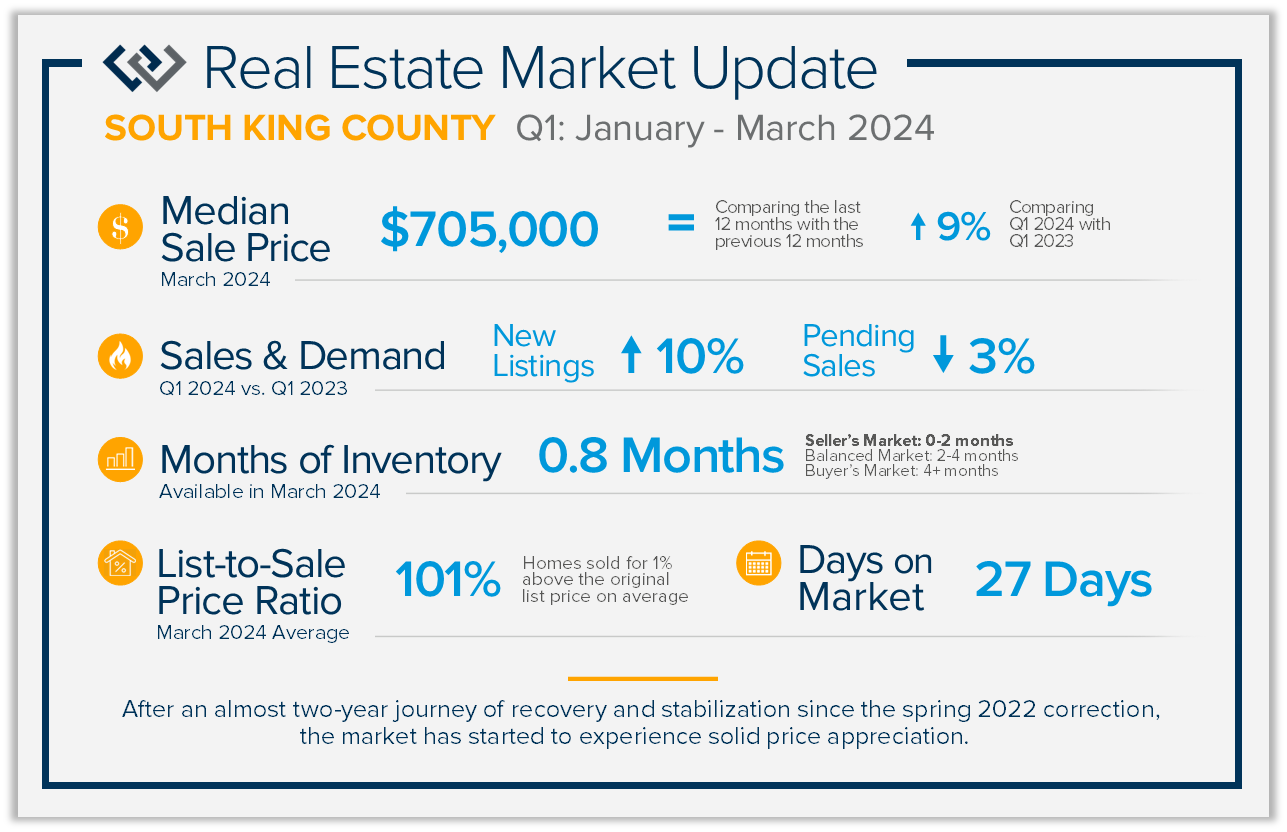
QUARTERLY REPORTS Q1 2024

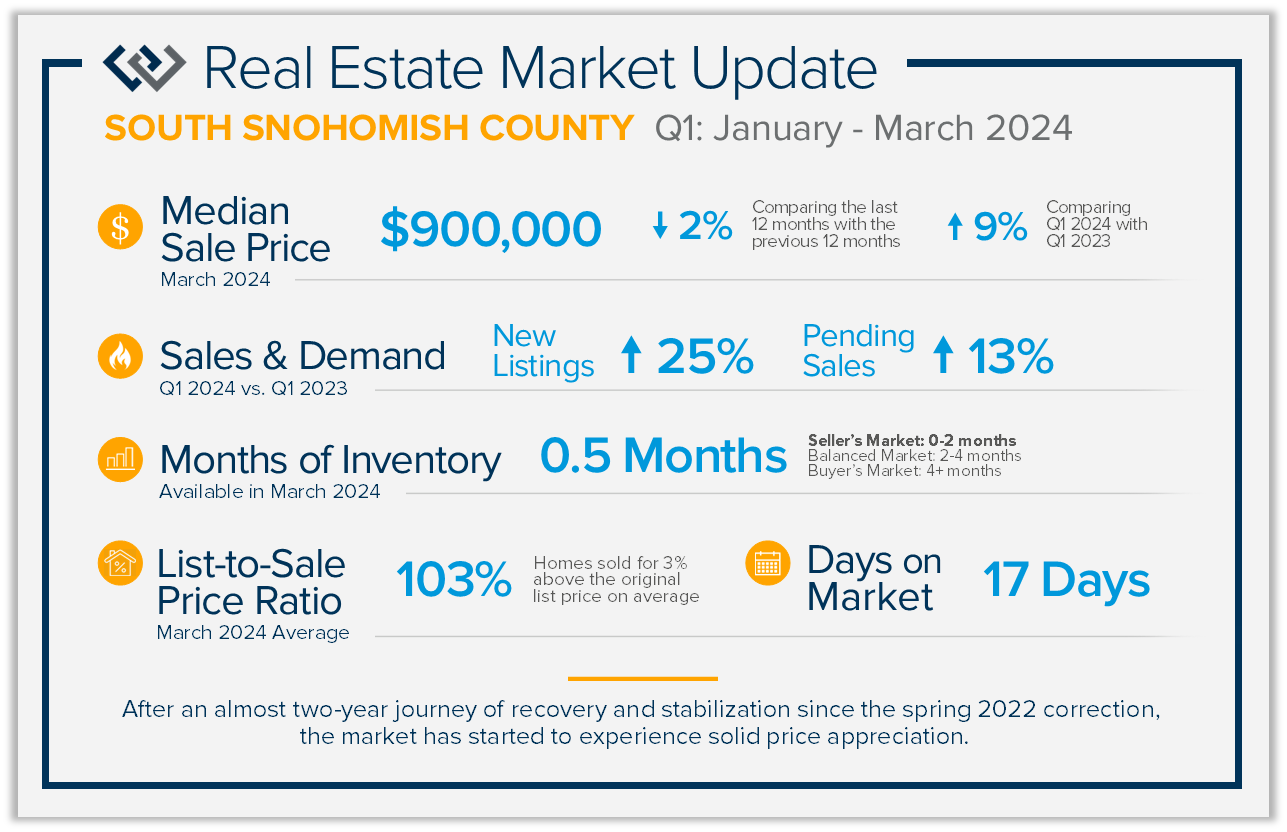
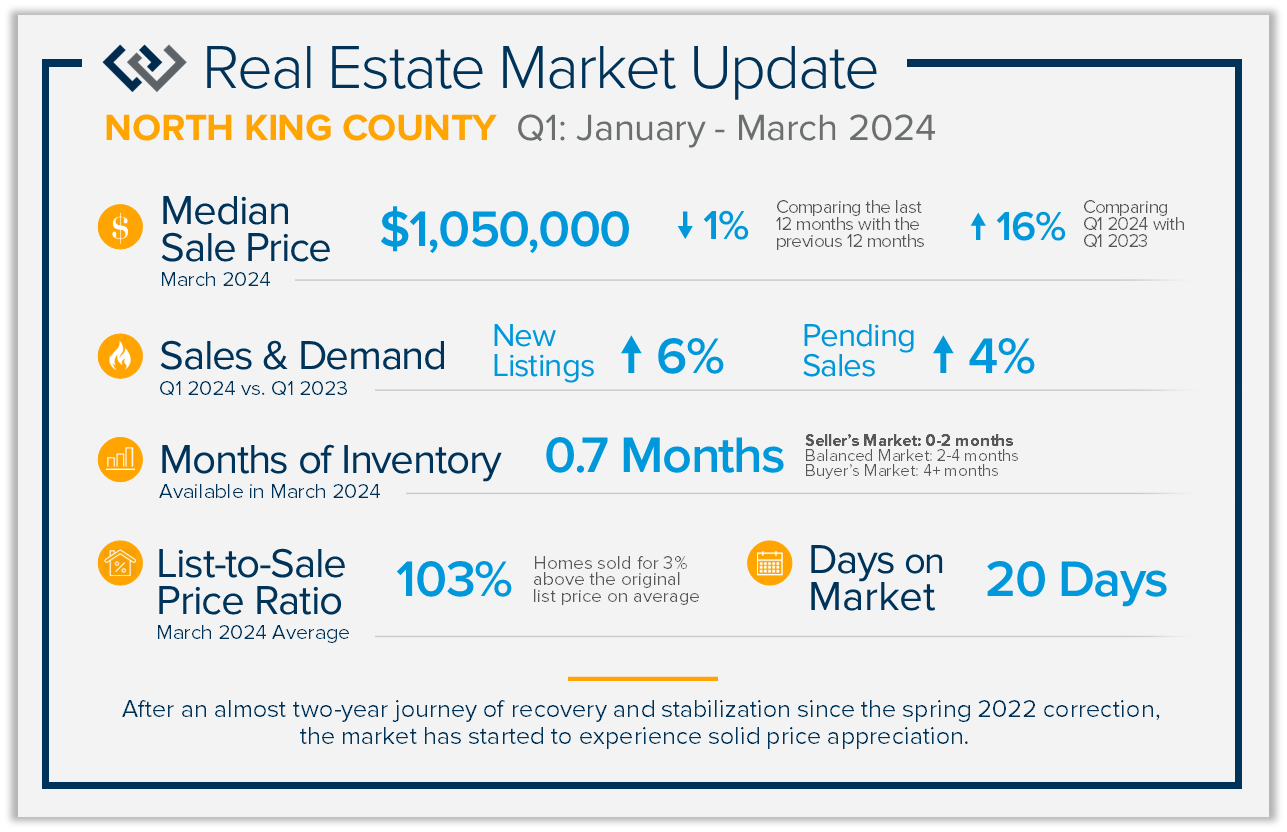
After an almost two-year journey of recovery and stabilization since the spring 2022 correction, the market has started to experience solid price appreciation. The median price in Q1 2024 vs. Q1 2023 shows that despite interest rates remaining stubborn, buyer demand is returning to the market. Improved consumer confidence and acclimation to lending costs have caused price growth, especially amongst tight inventory levels.
New listings are slowly increasing over 2023 as pent-up seller demand meets the market. Equity levels across our region are strong, providing favorable returns for home sellers. Many experts predict interest rates to gradually fall in 2024, estimating they will reach the mid to lower 6% range later this year. While the cost of lending still has some buyers sidelined, many are forging ahead now.
Life changes often determine a move. It is our goal to help empower strong decisions by assessing our client’s lifestyle and financial goals amidst real-time market trends and conditions. Whether you have considered selling, buying, or both, or you’re just curious about the market, please reach out.

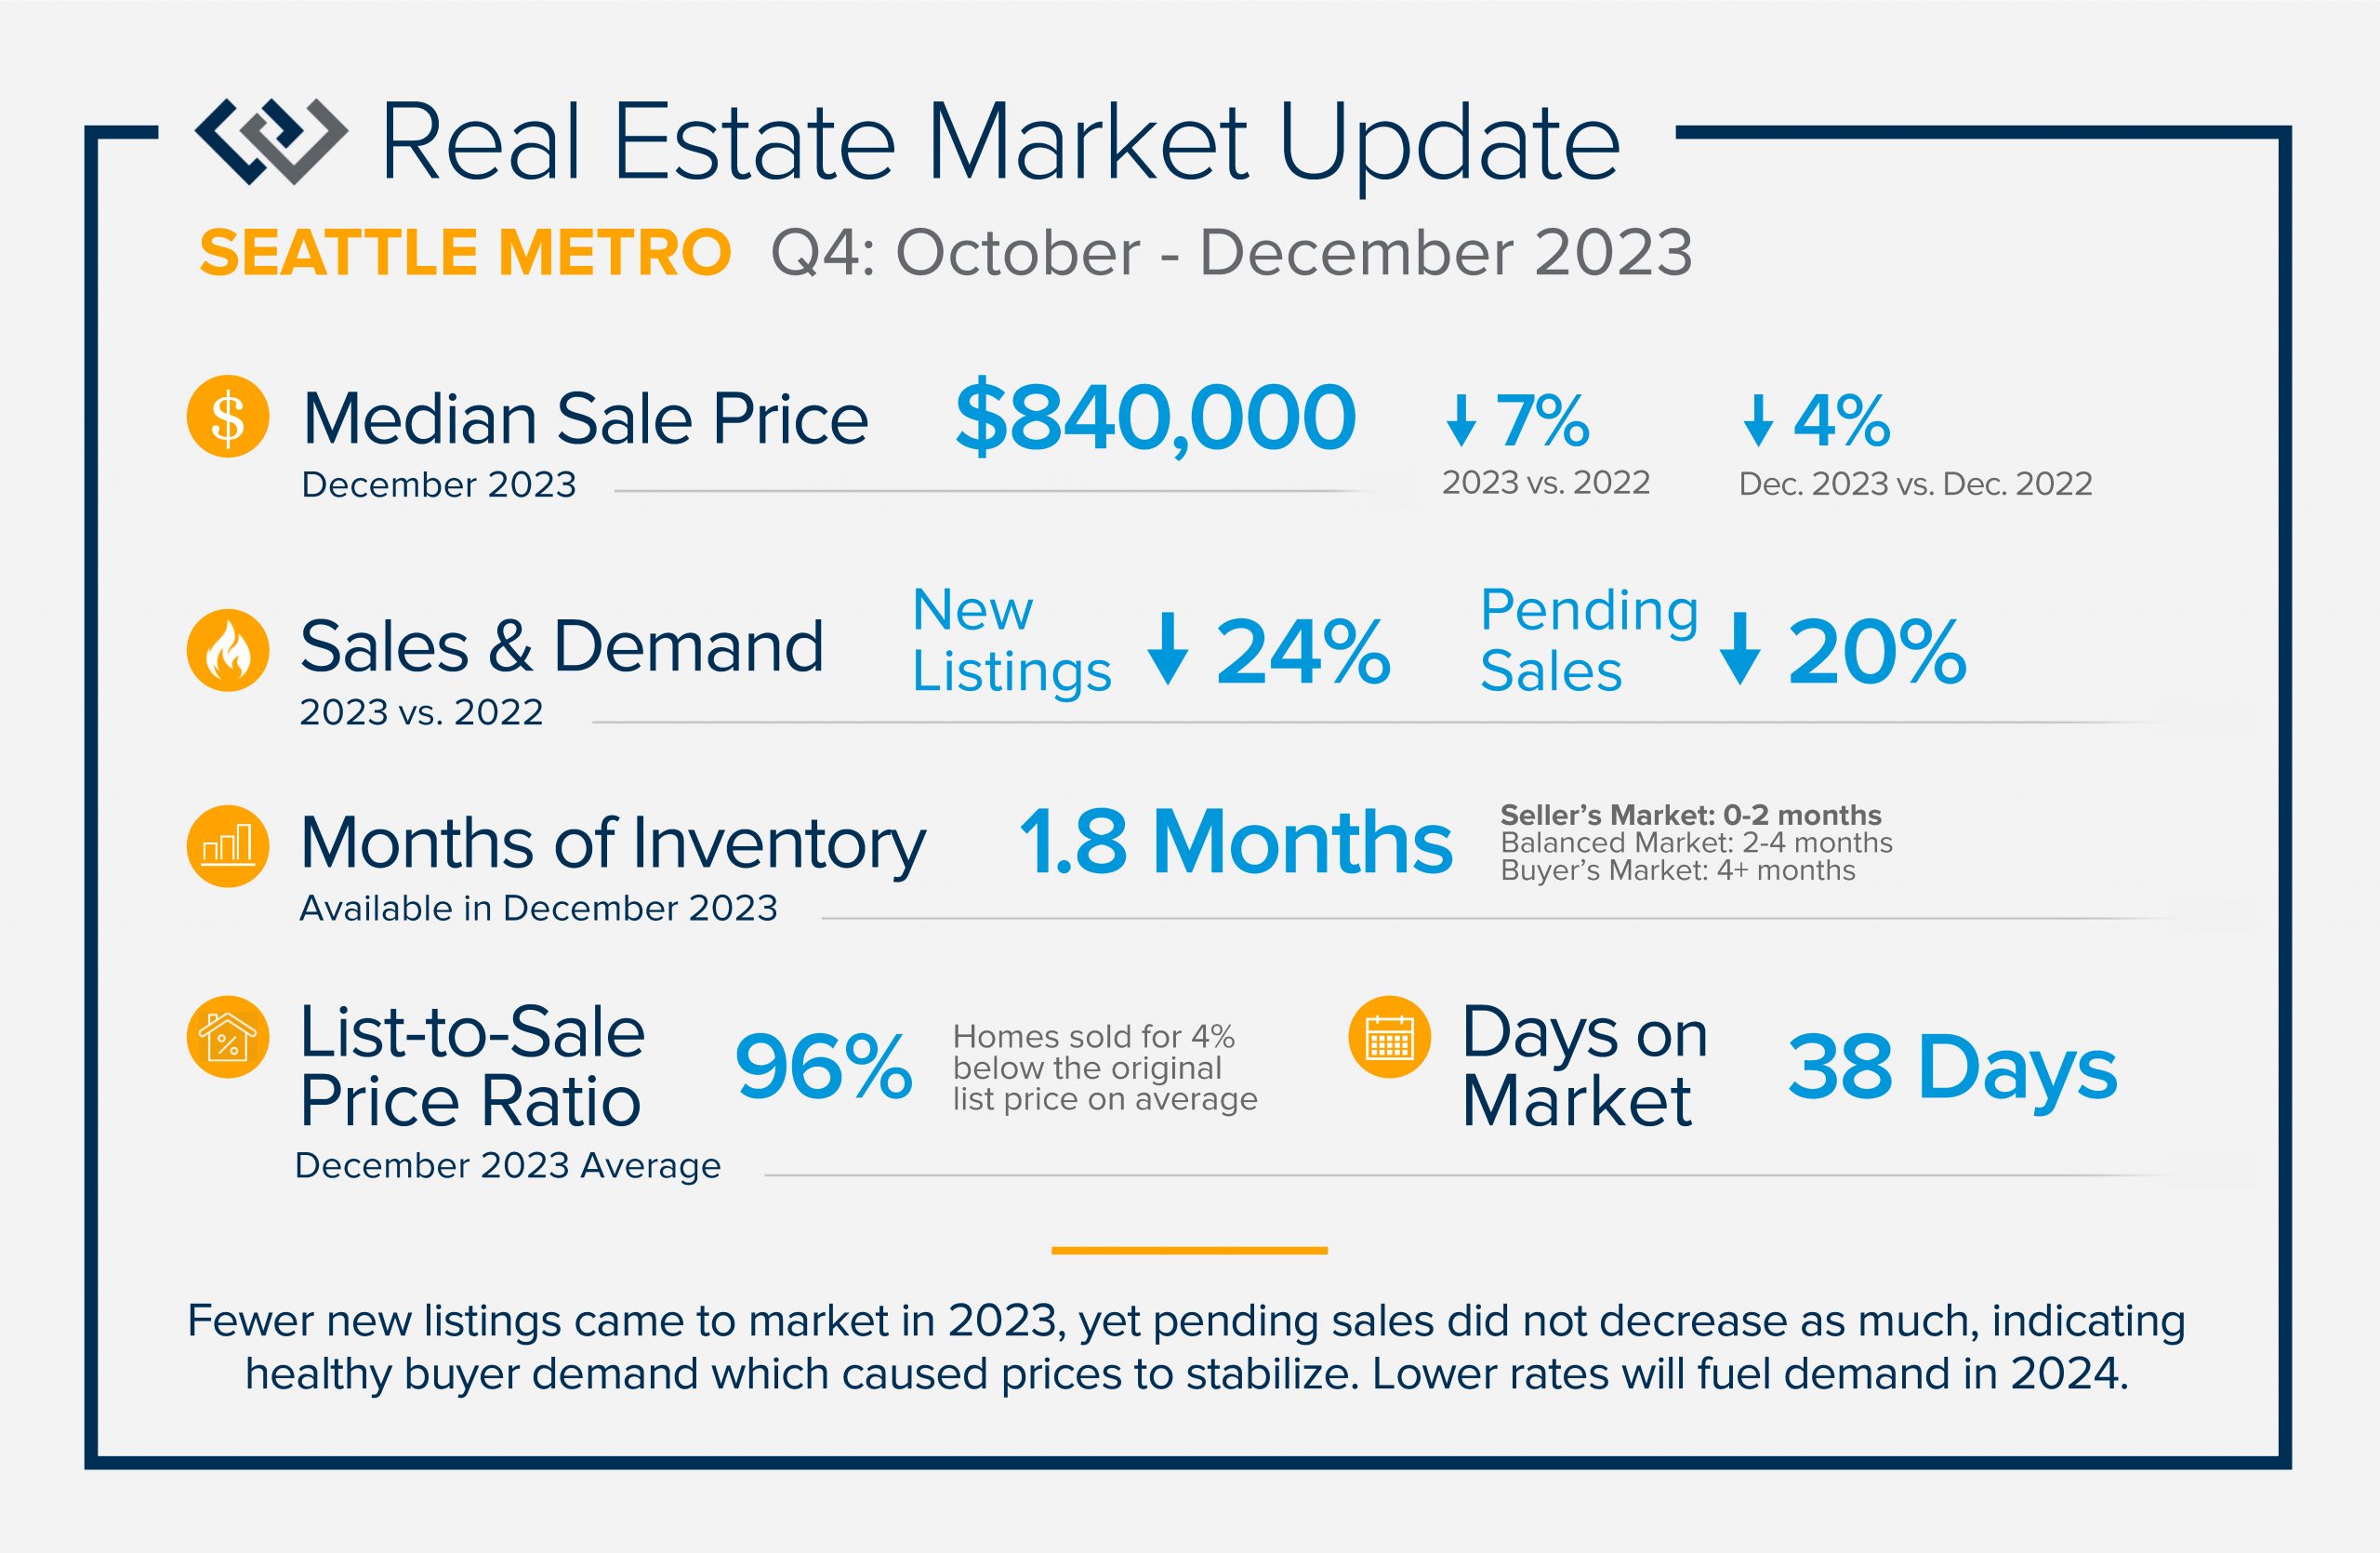
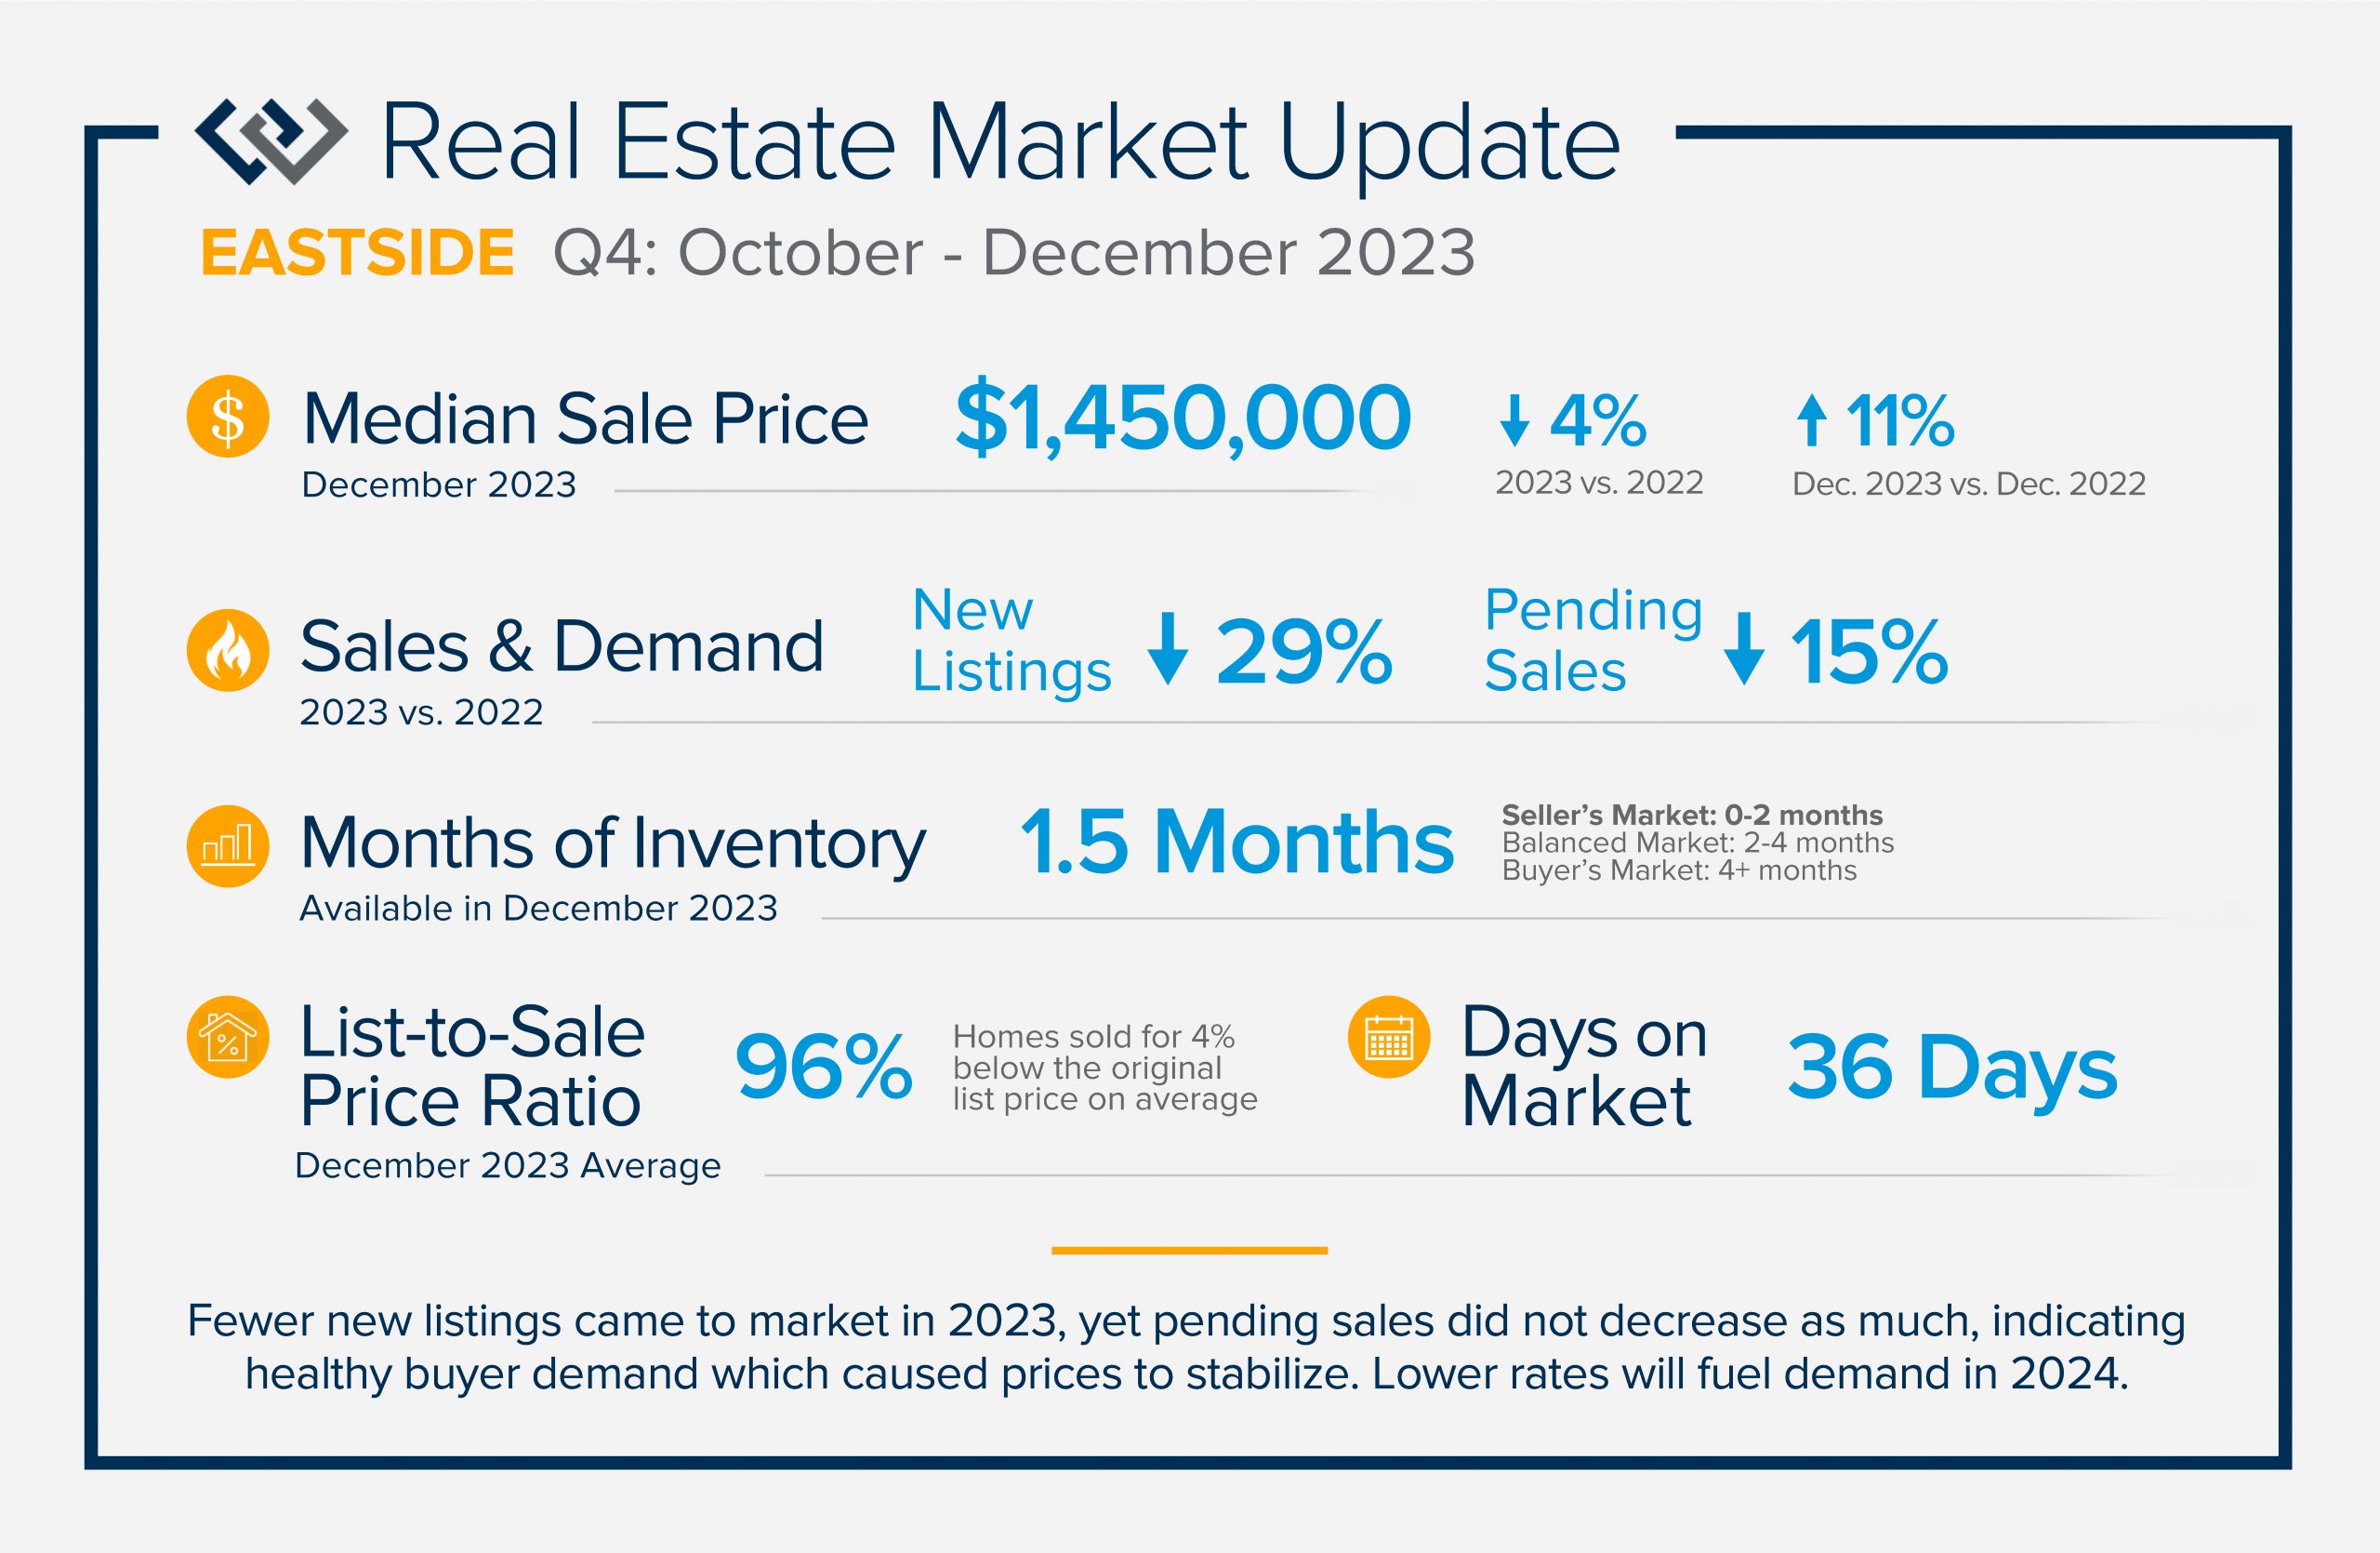
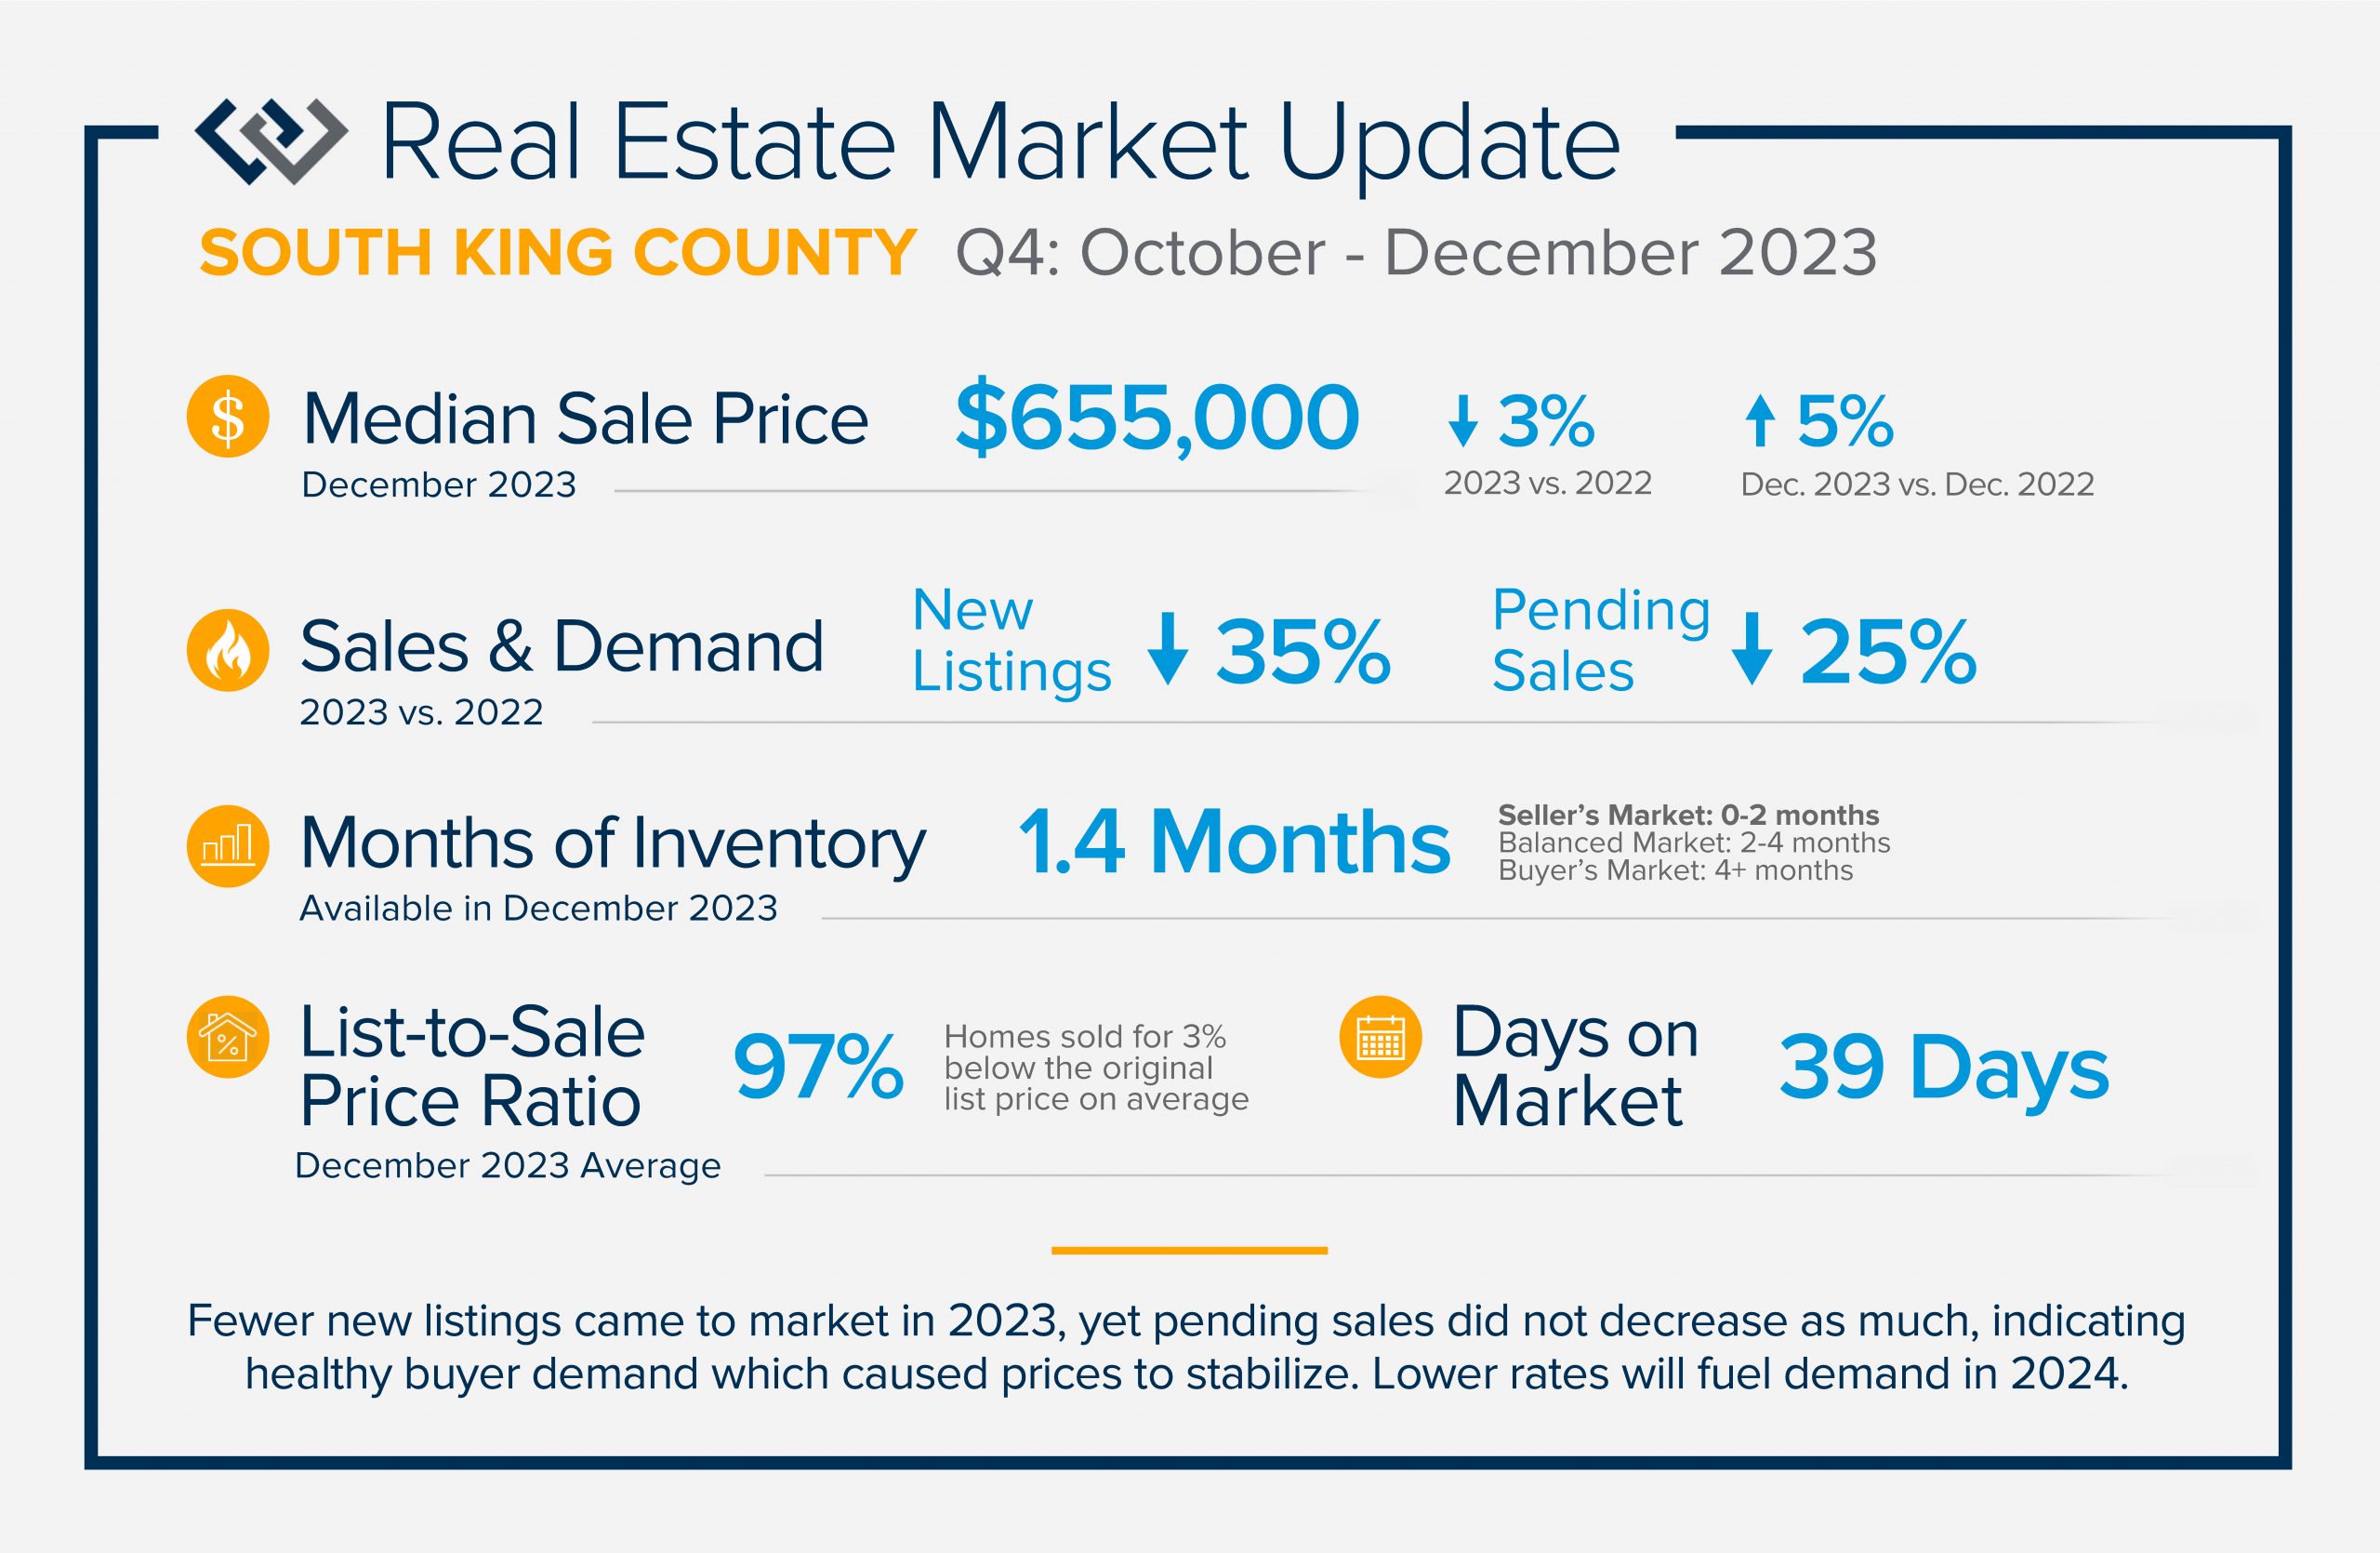
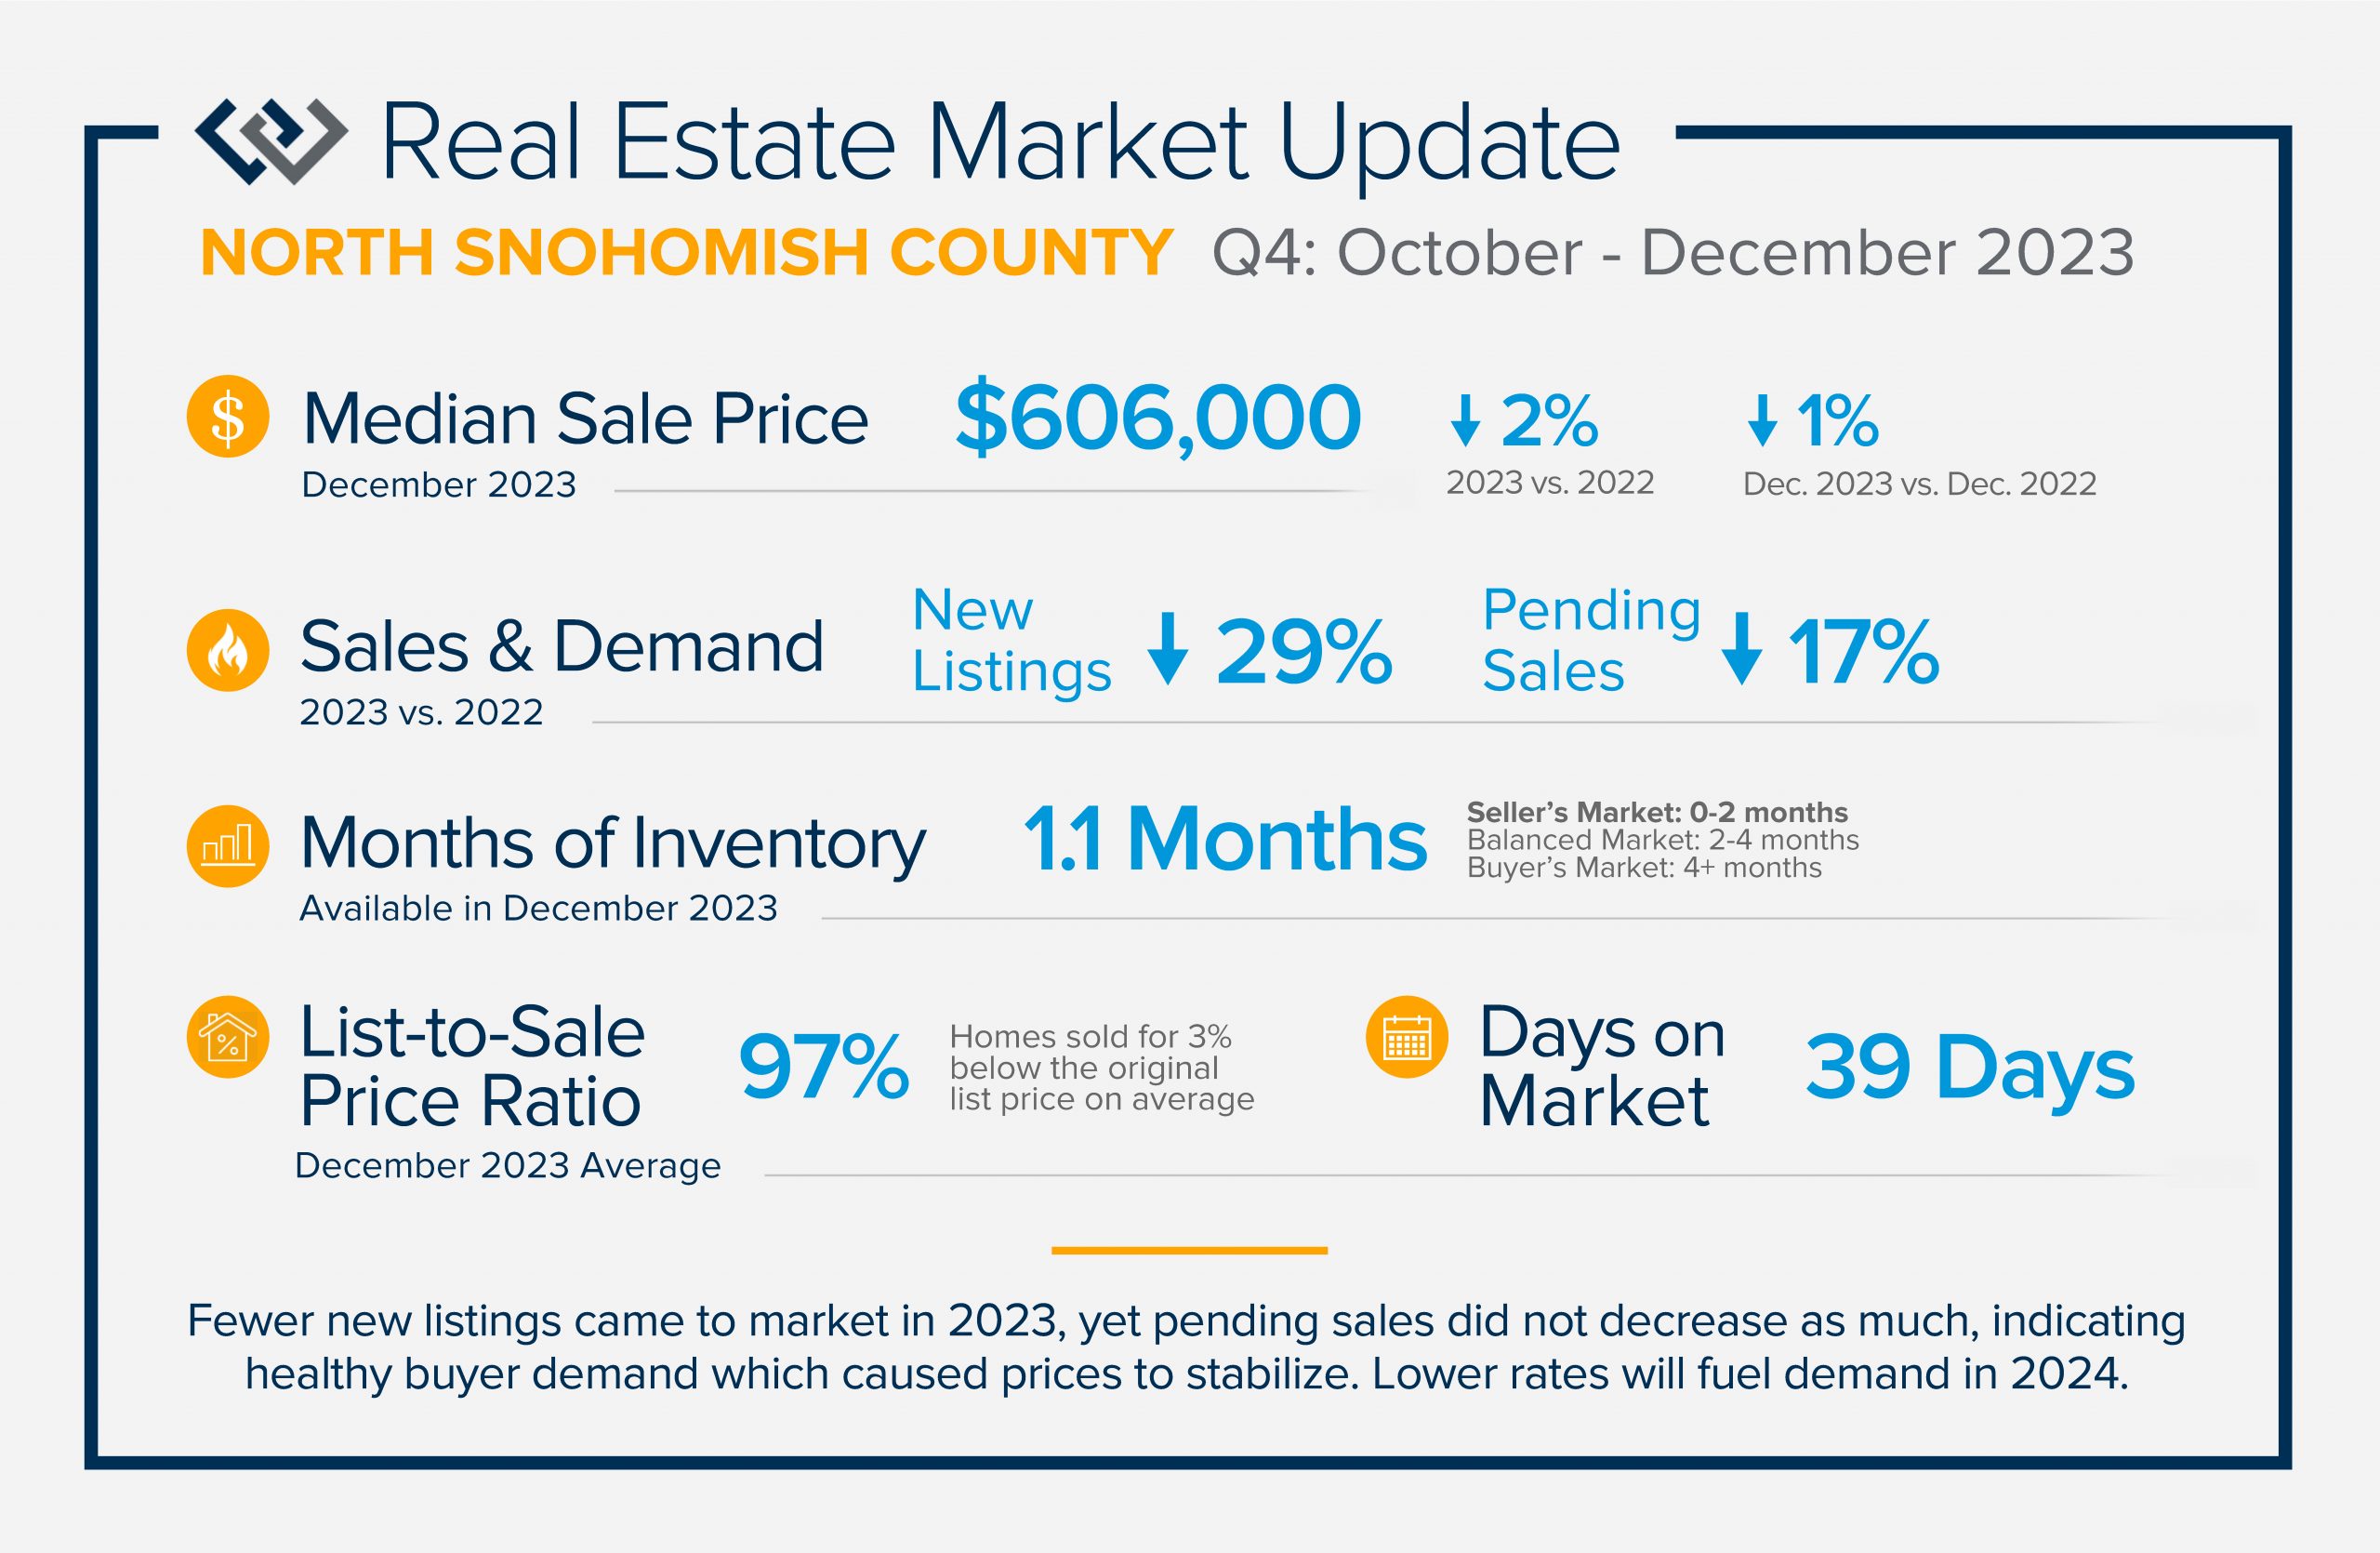
QUARTERLY REPORTS Q4 2023

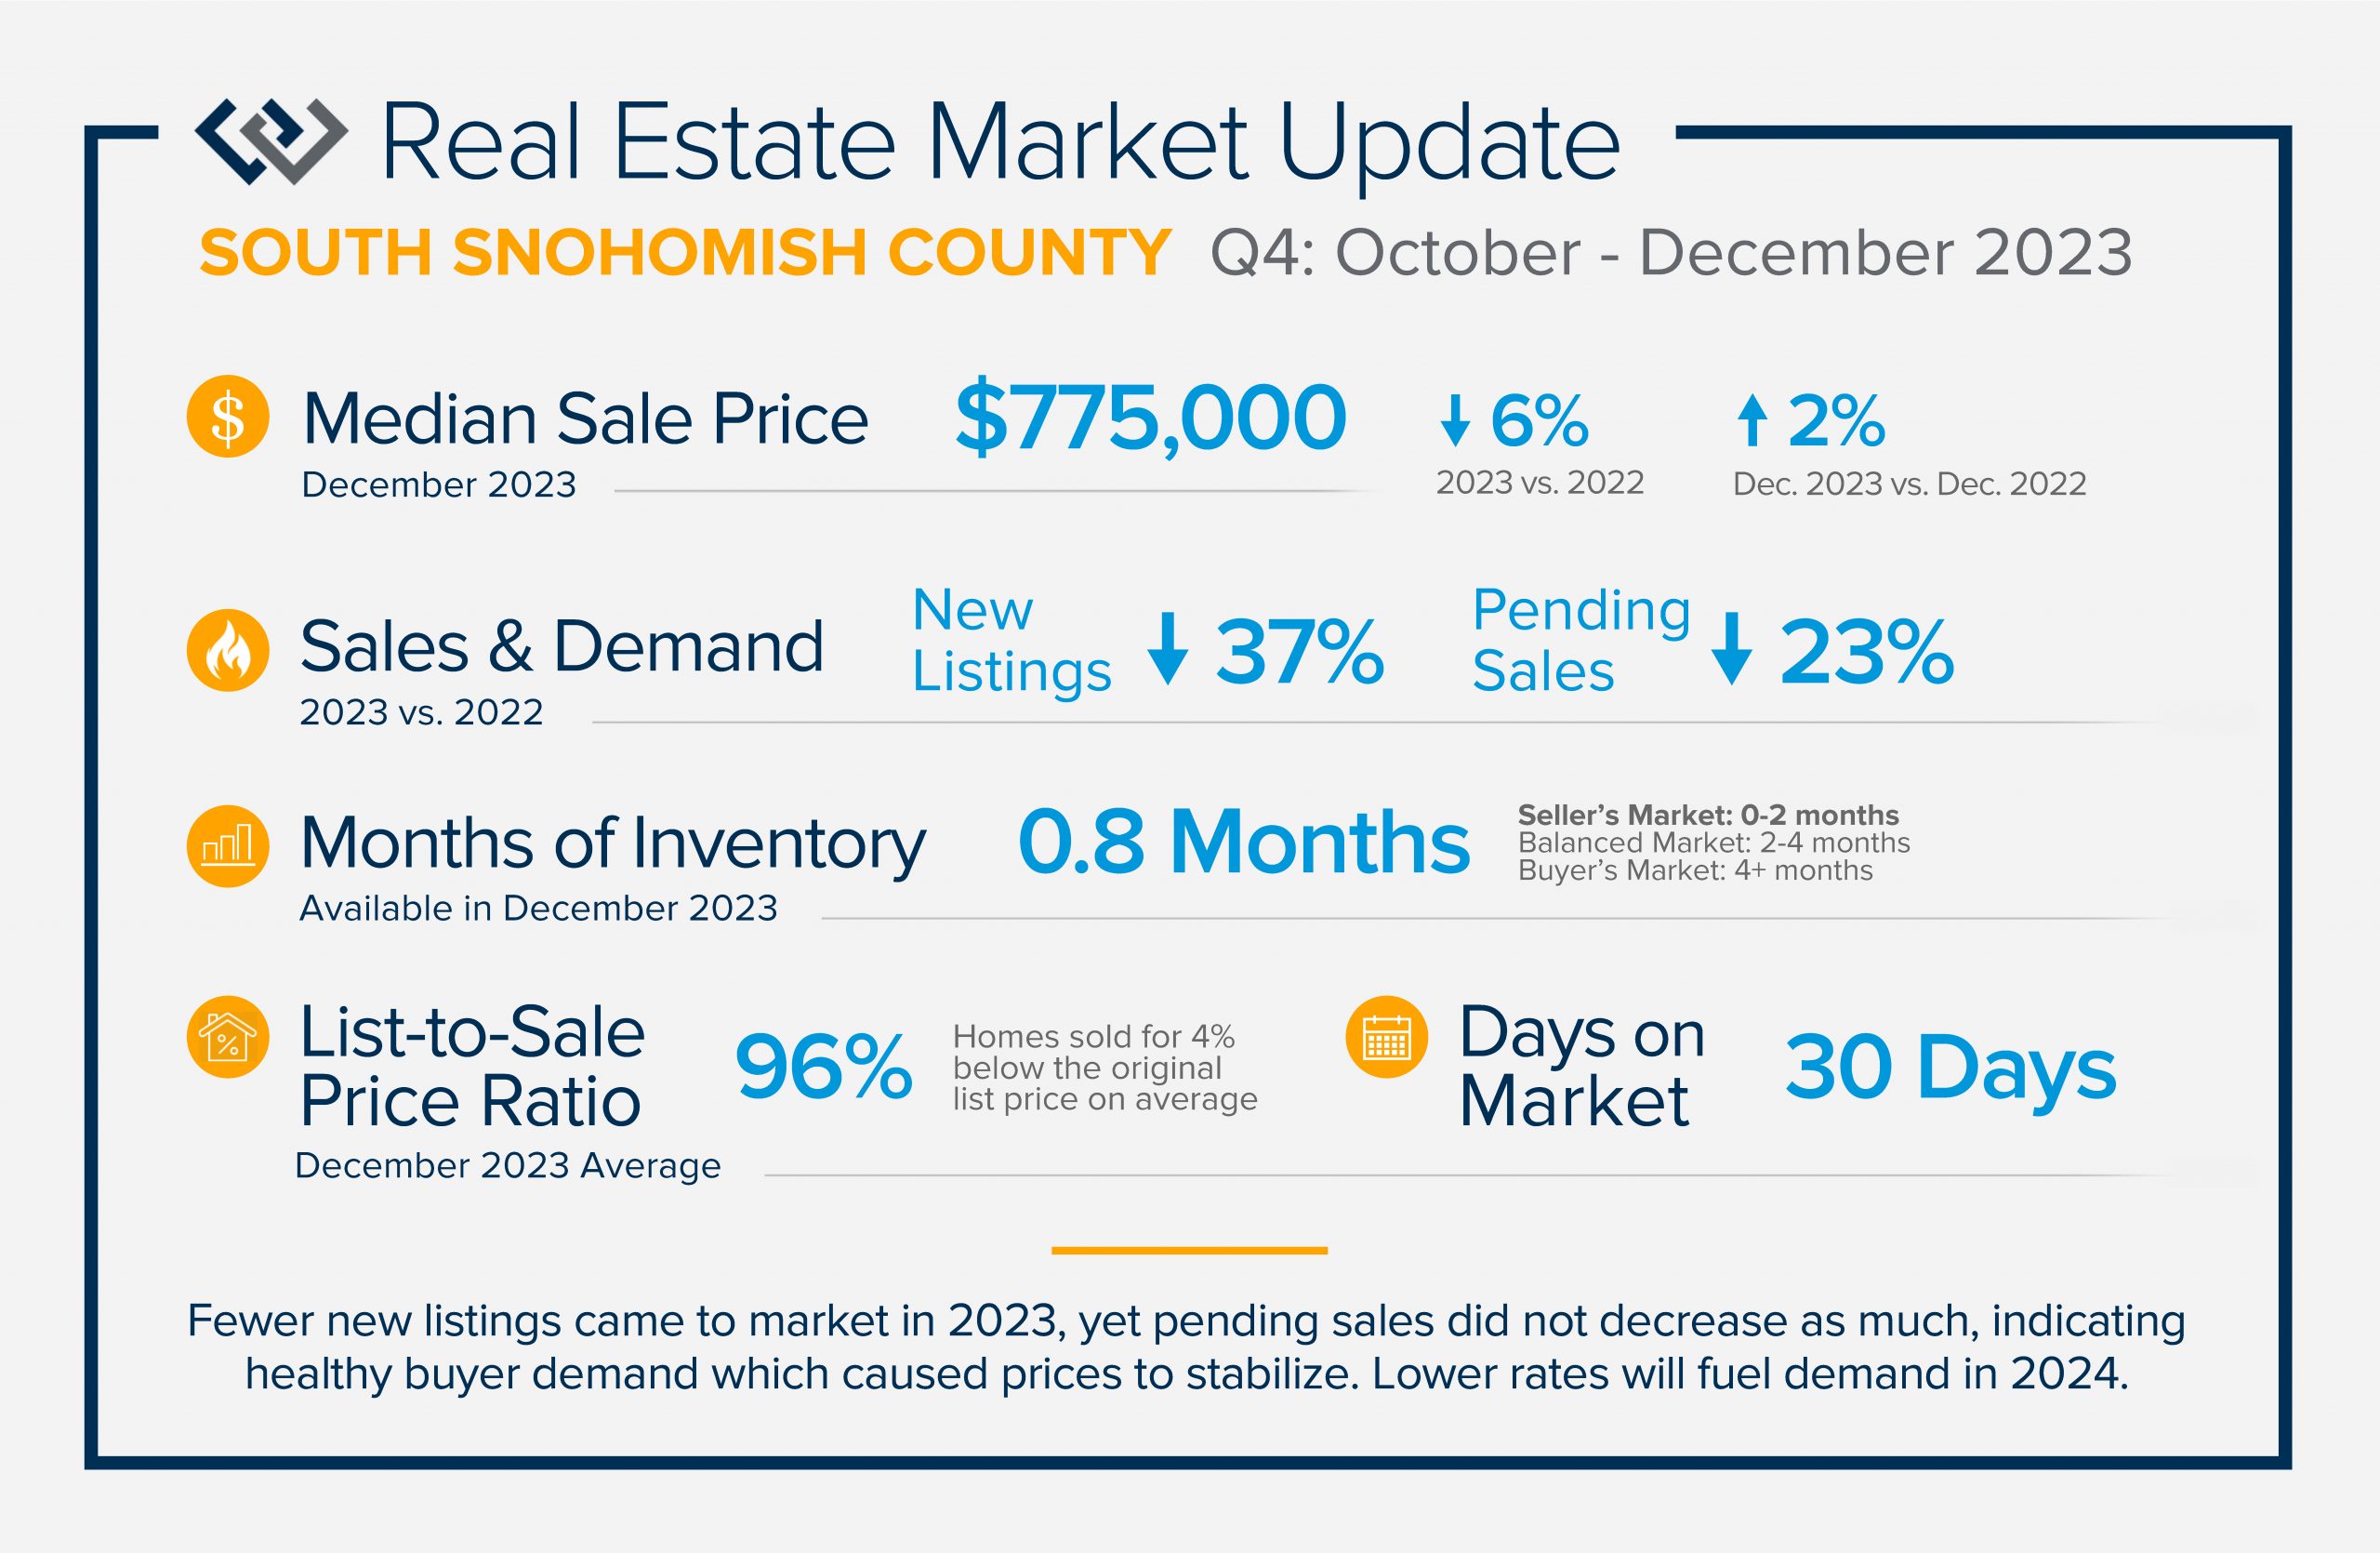

The story of 2023 was balancing interest rates with home purchases and even home sales. The average weekly rate in 2023 was 6.8% and peaked in October at 7.94%. This caused some buyers to pause due to cost. Many sellers were reluctant to move and give up their low payments based on historically low rates, hence the large decrease in new listings in 2023.
Despite the highest rates we’ve seen in two decades, pending sales did not falter like new listings, indicating continued demand and resulting in a seller’s market. Inventory remained tight throughout 2023 and prices stable over 2022 (the peak) when the average rate was 5.34%. Since October, rates have come down by over 1%, bringing more buyers to the market. The Fed plans to continue this trend in 2024 which will increase buyer activity and new listings. 2024 will provide improved opportunities for all with a less stringent lending environment.
If you are curious about how the trends relate to your goals, please reach out. I strive to keep my clients well-informed and empower strong decisions.
QUARTERLY REPORTS Q3 2023

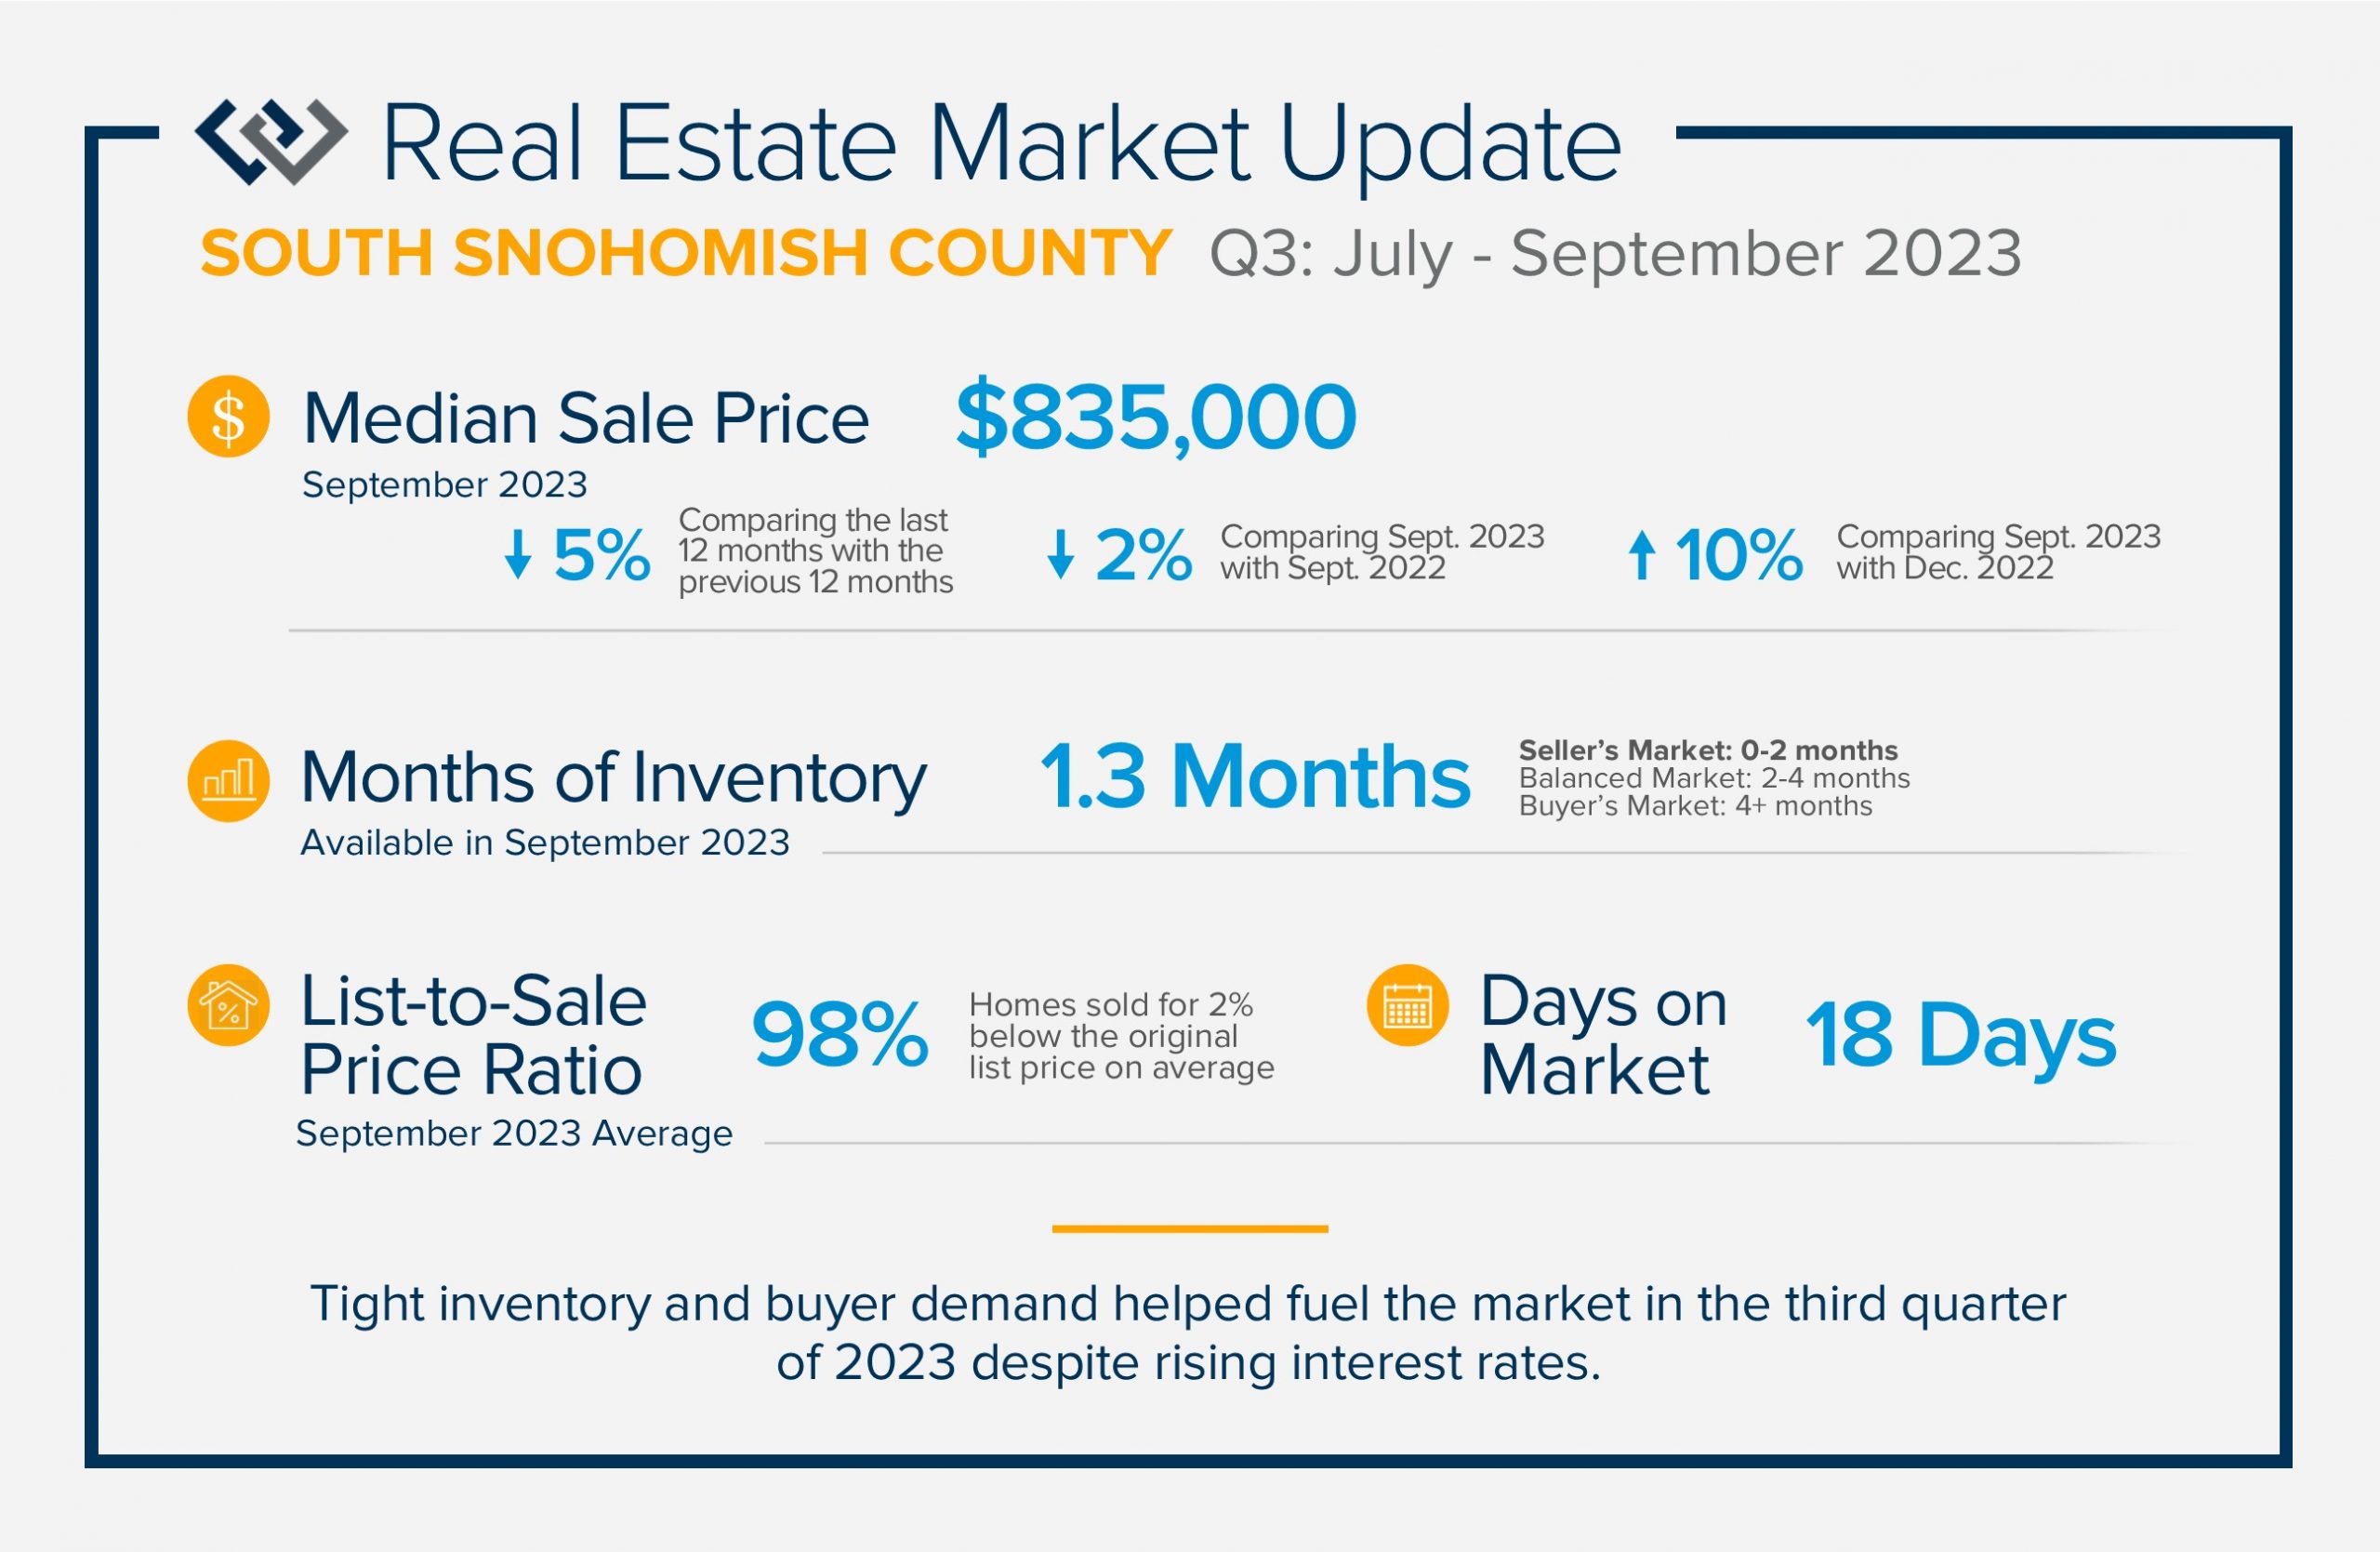
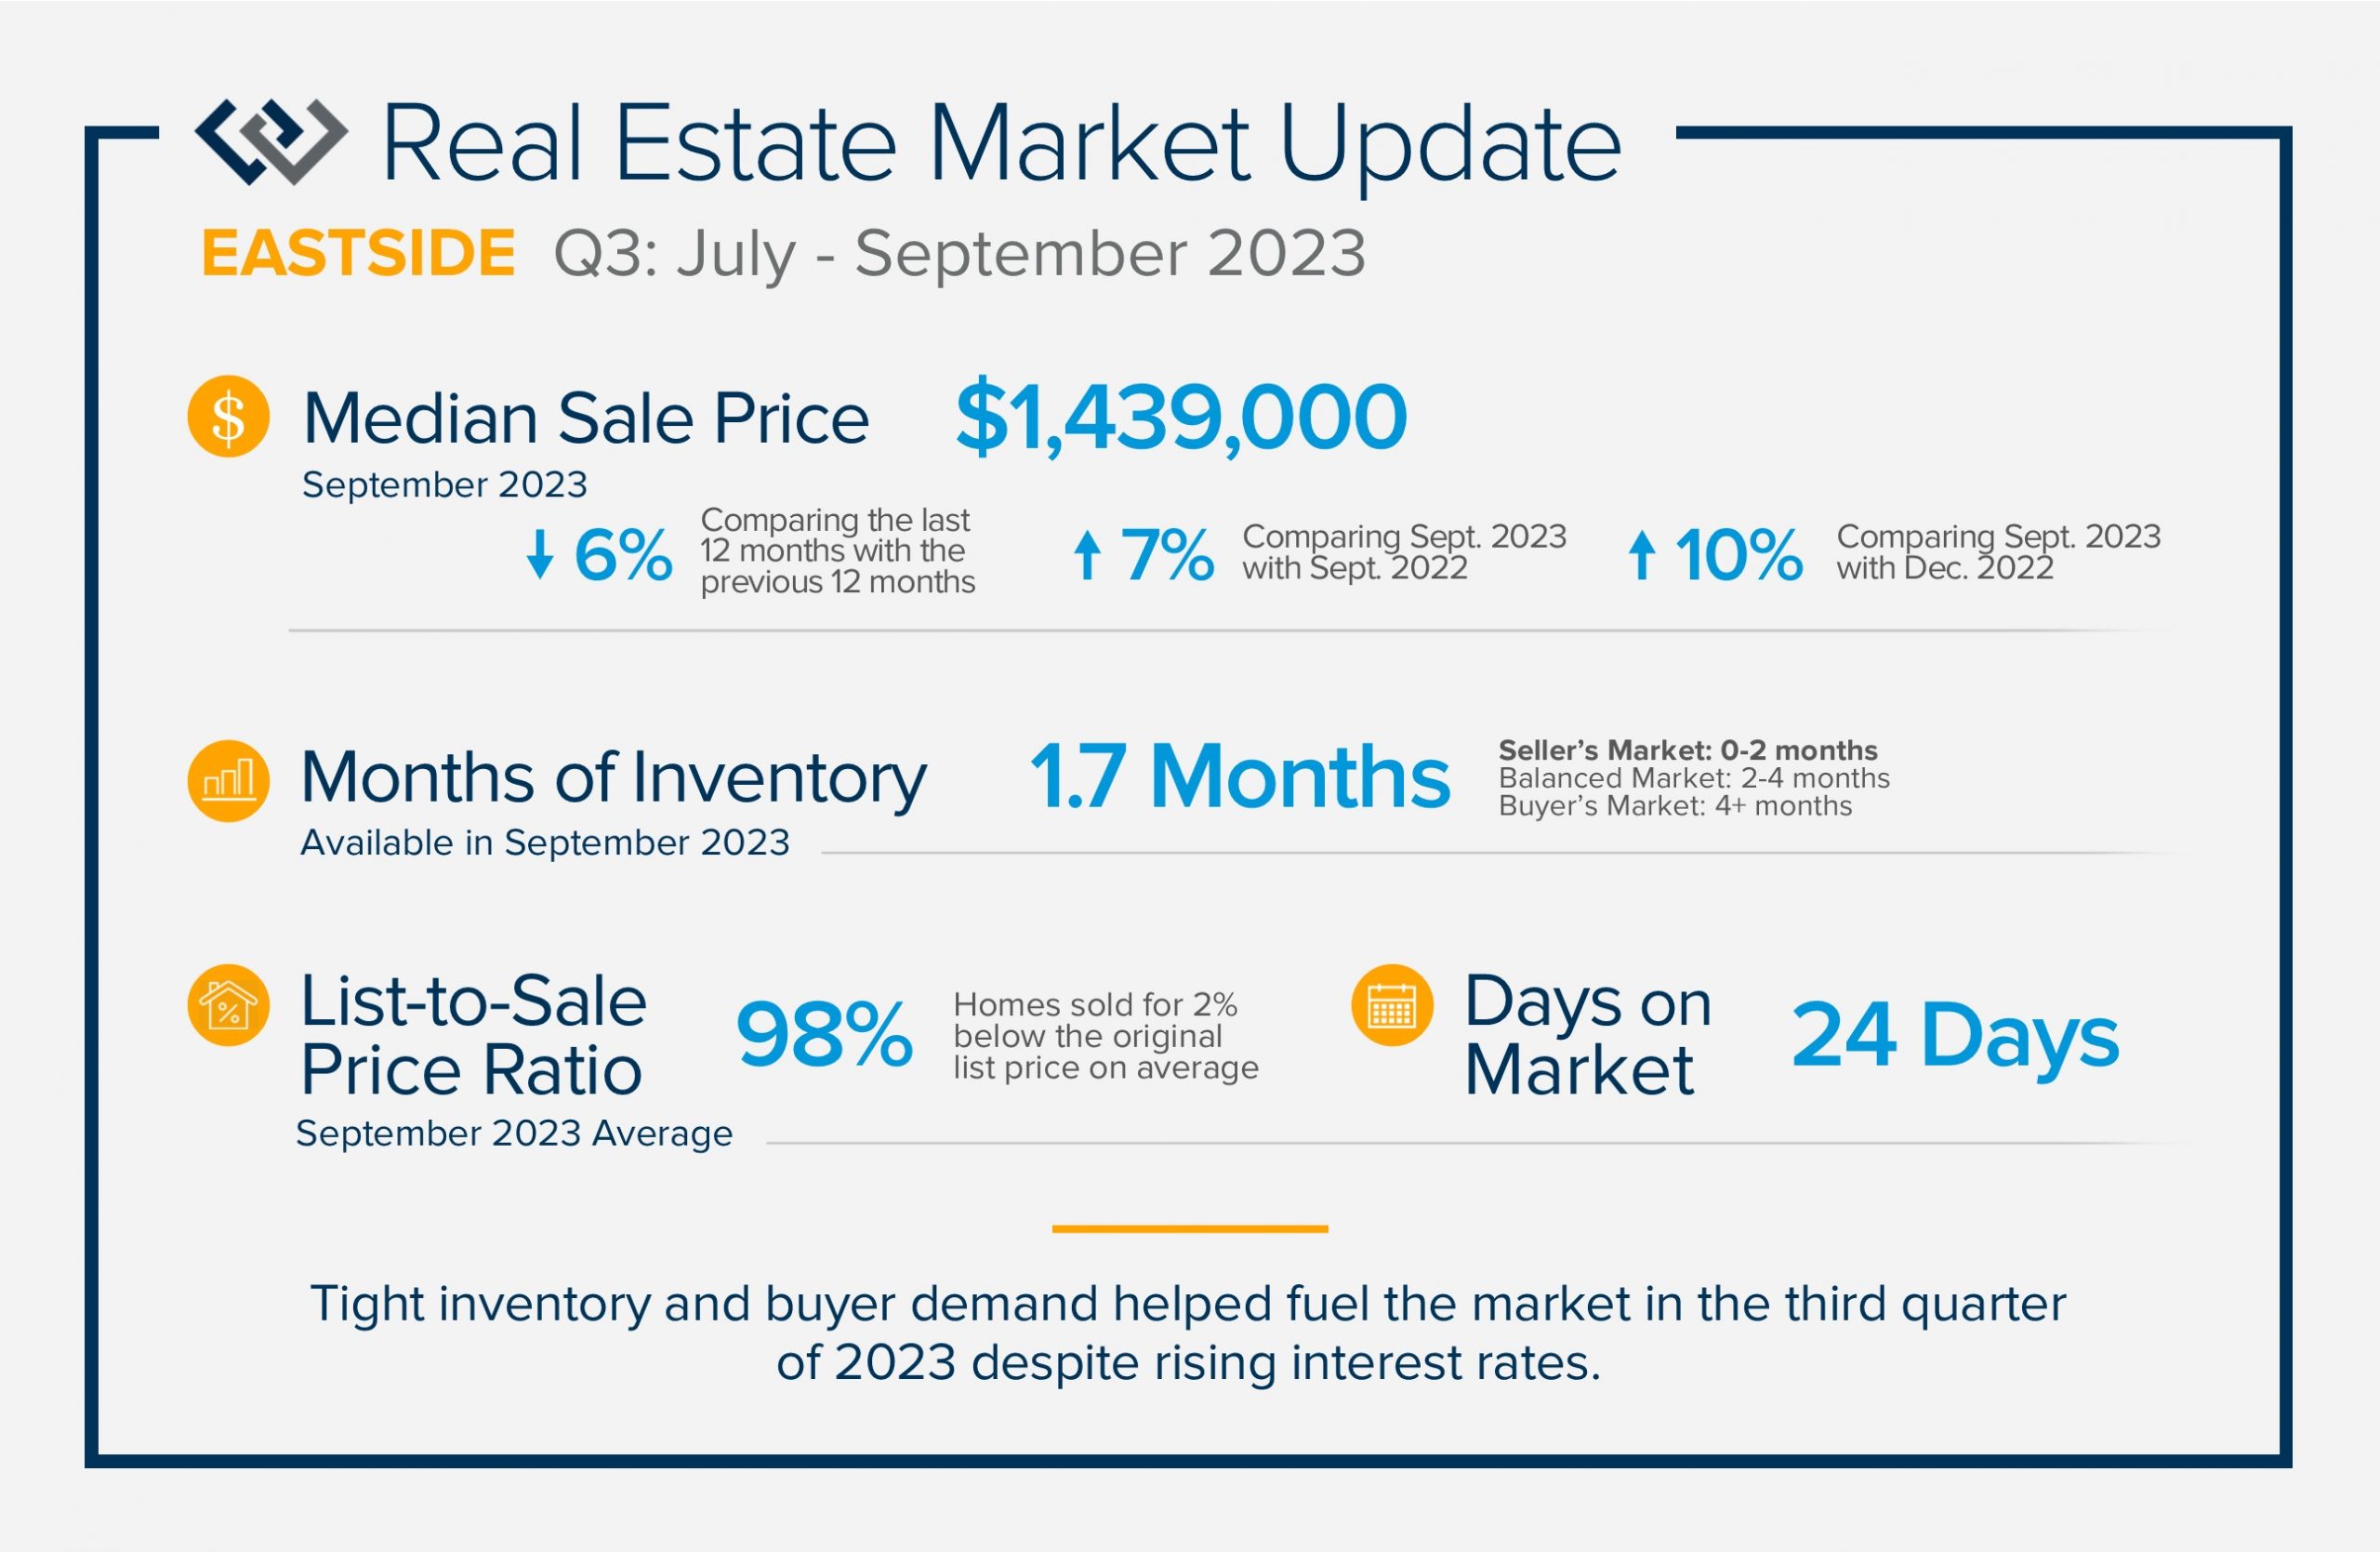
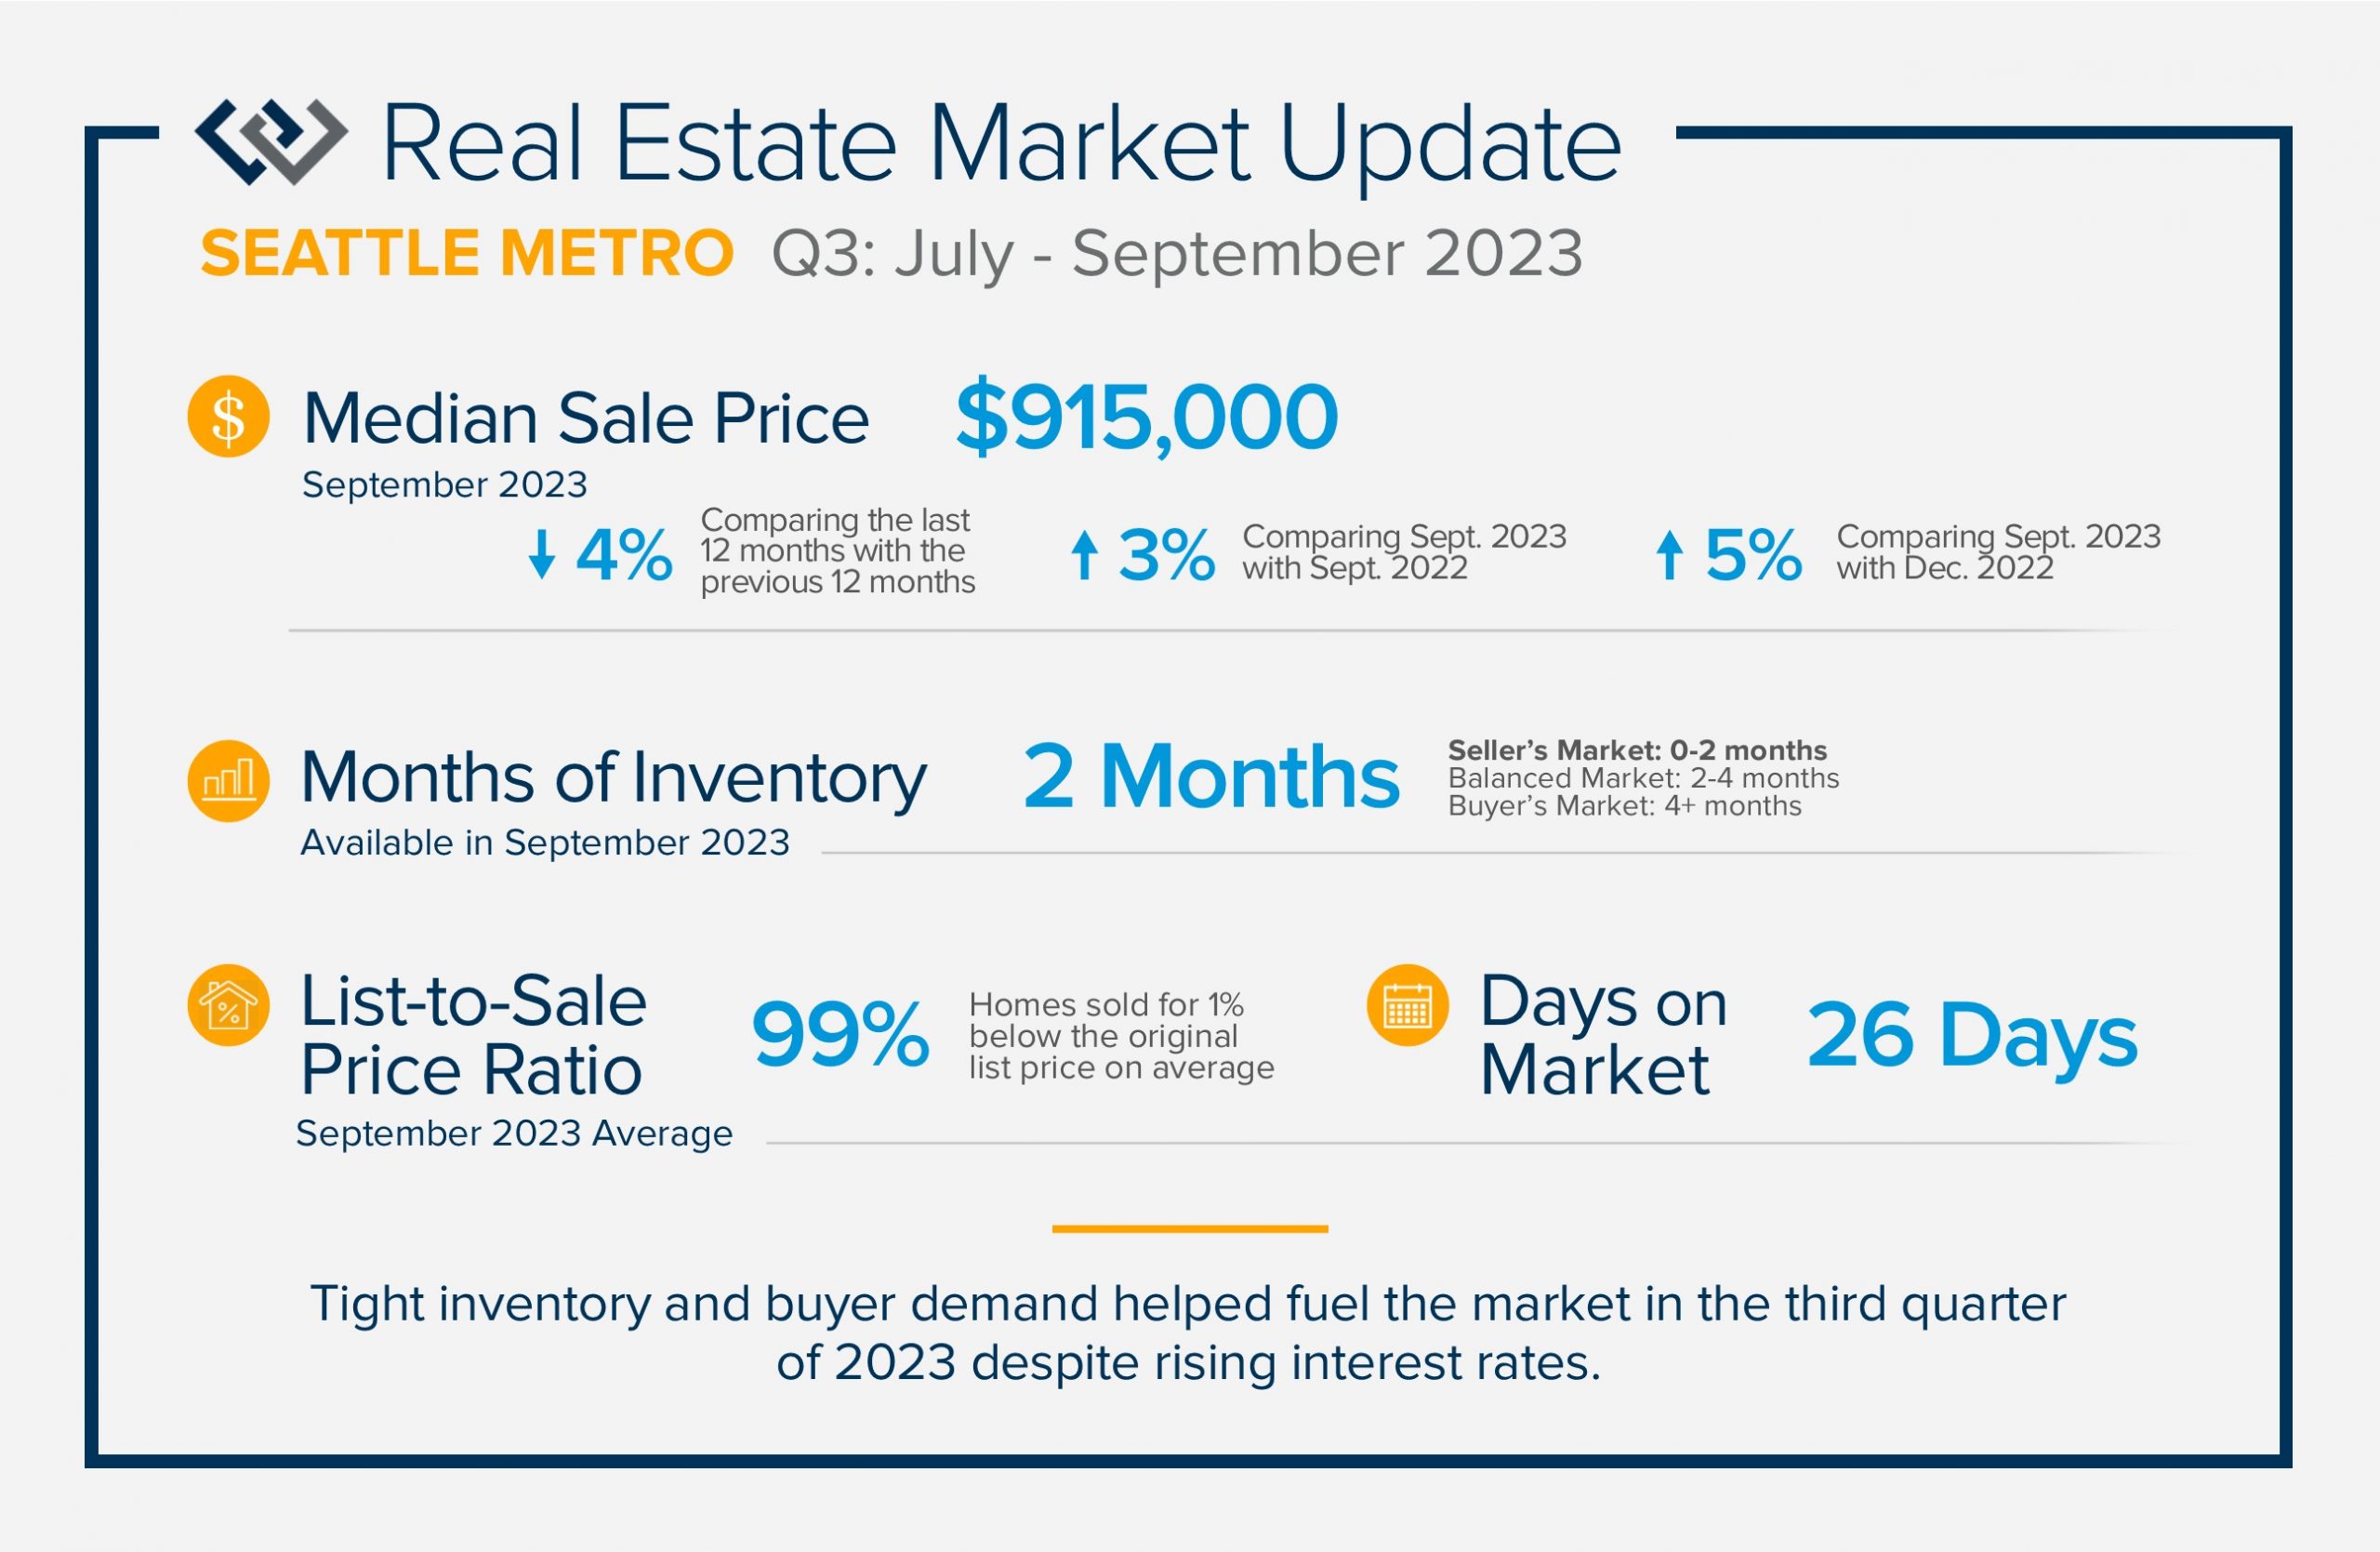
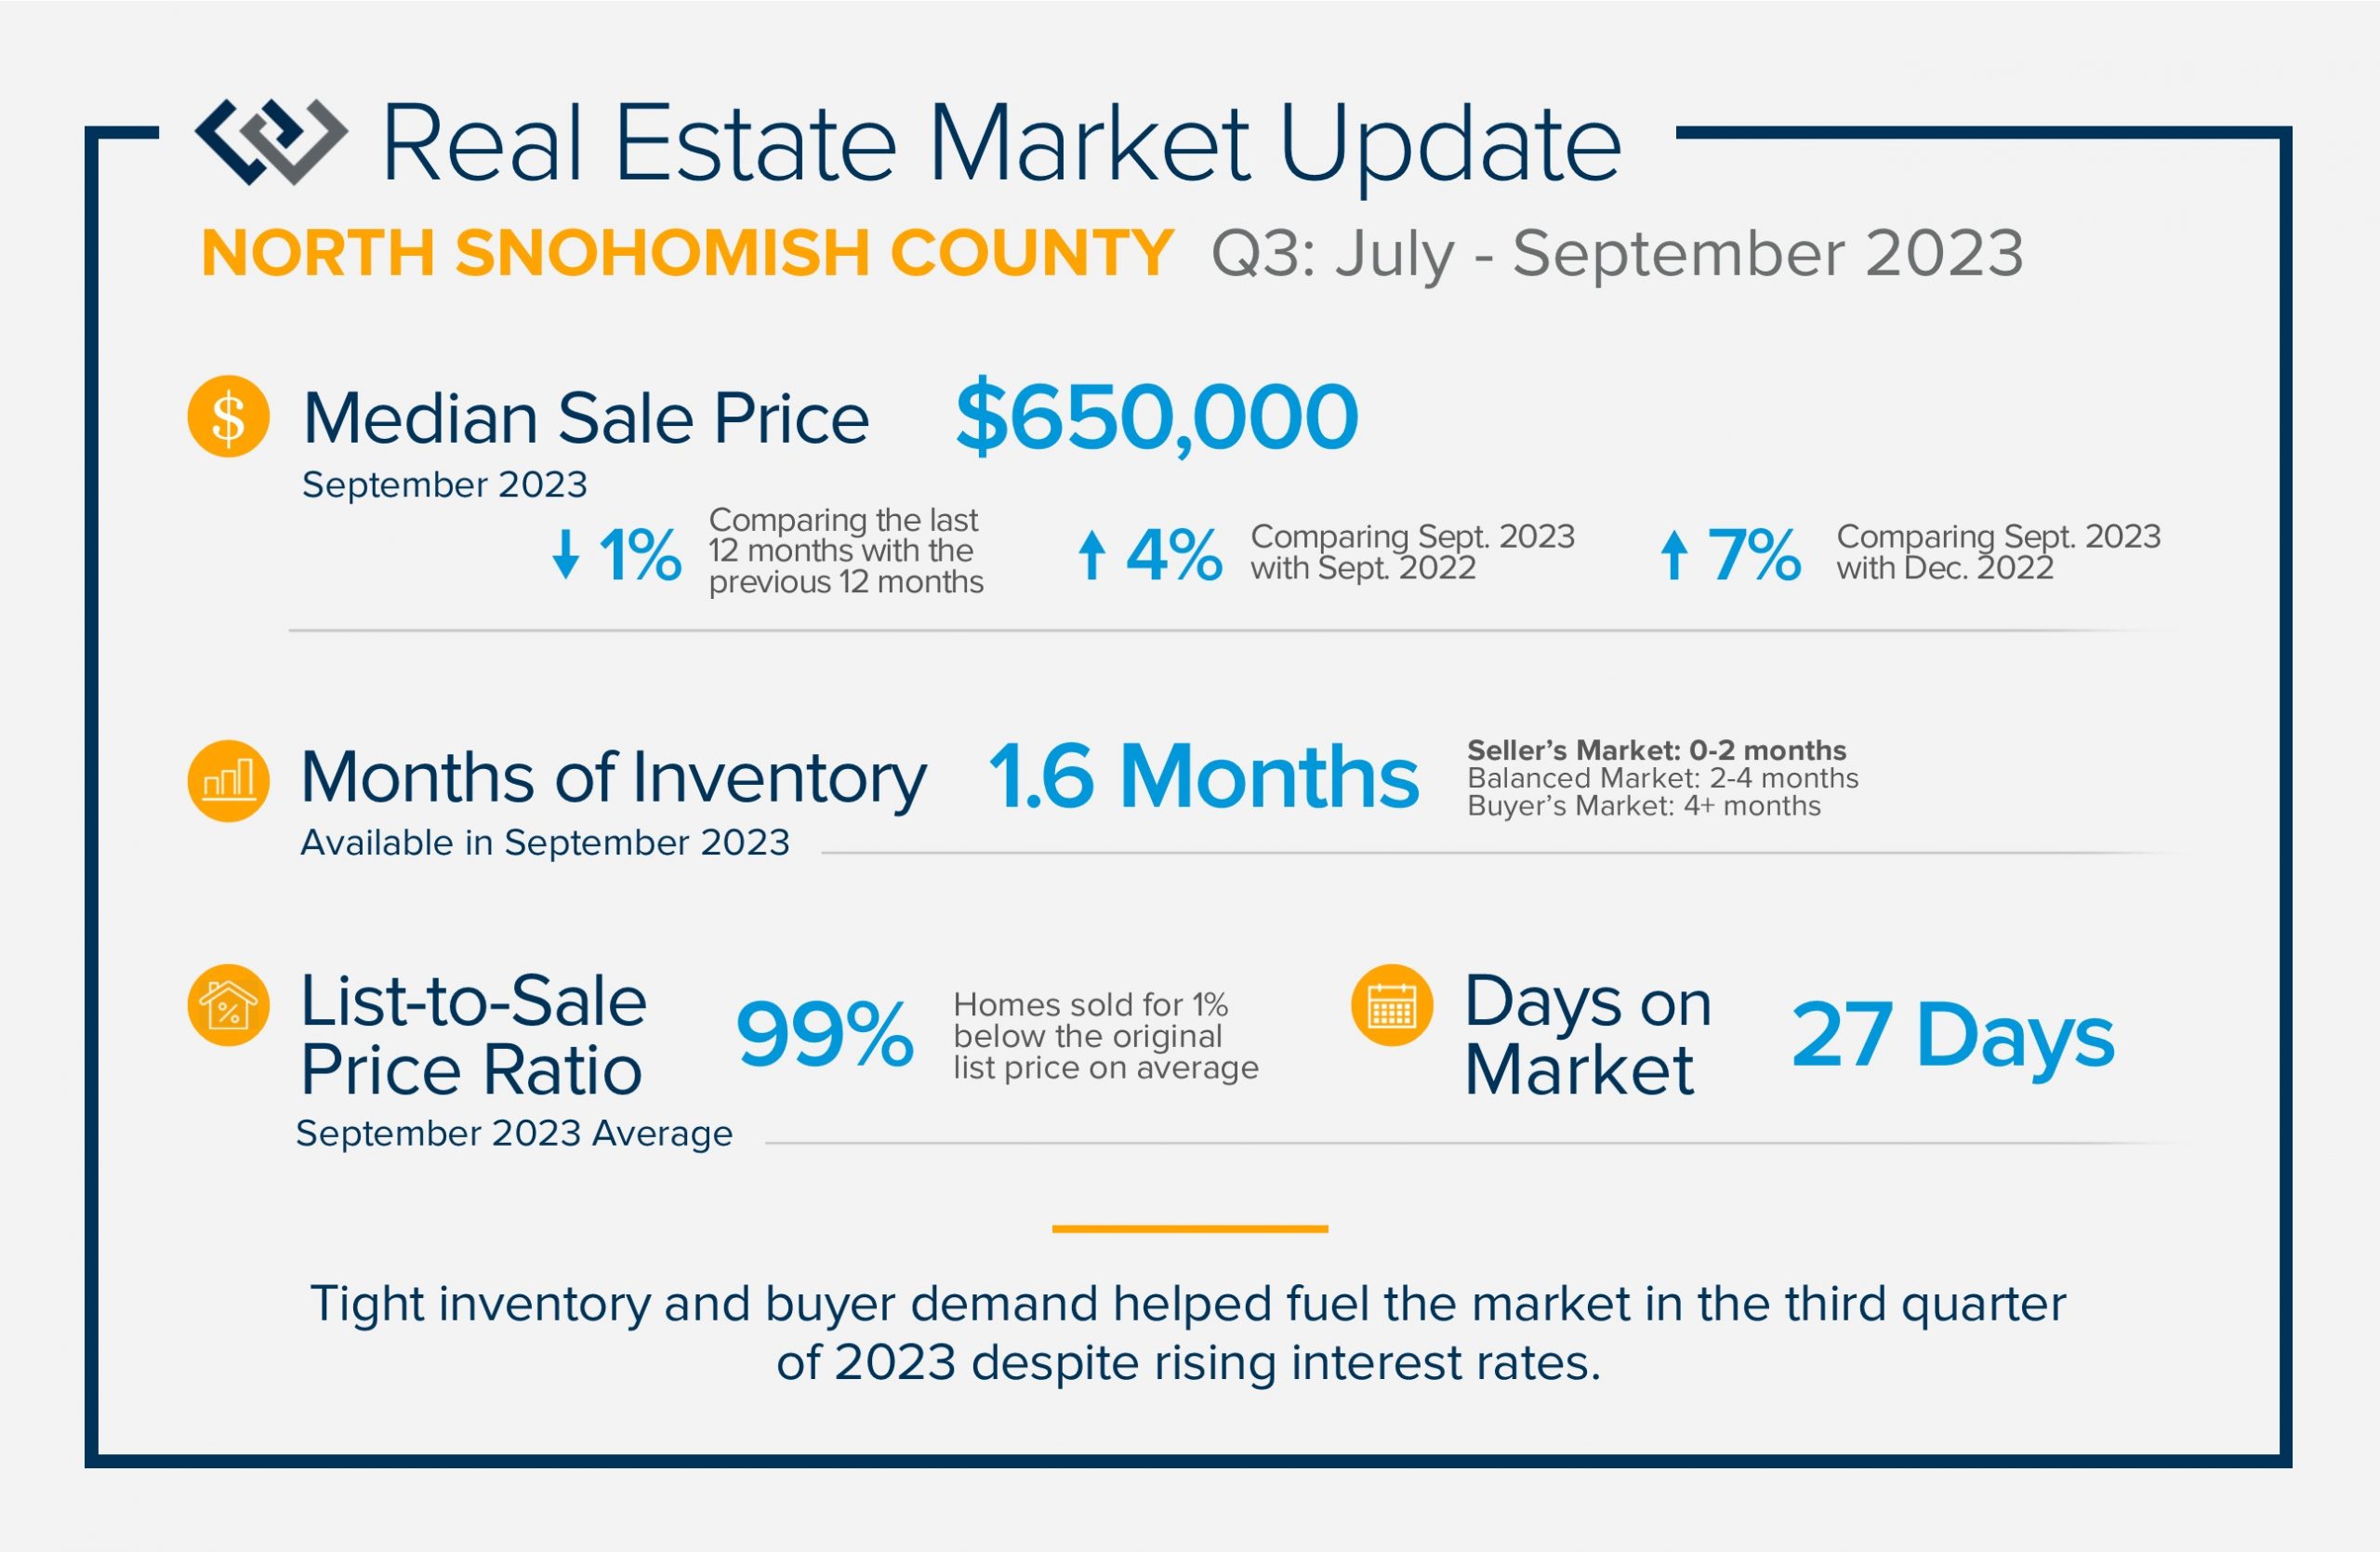
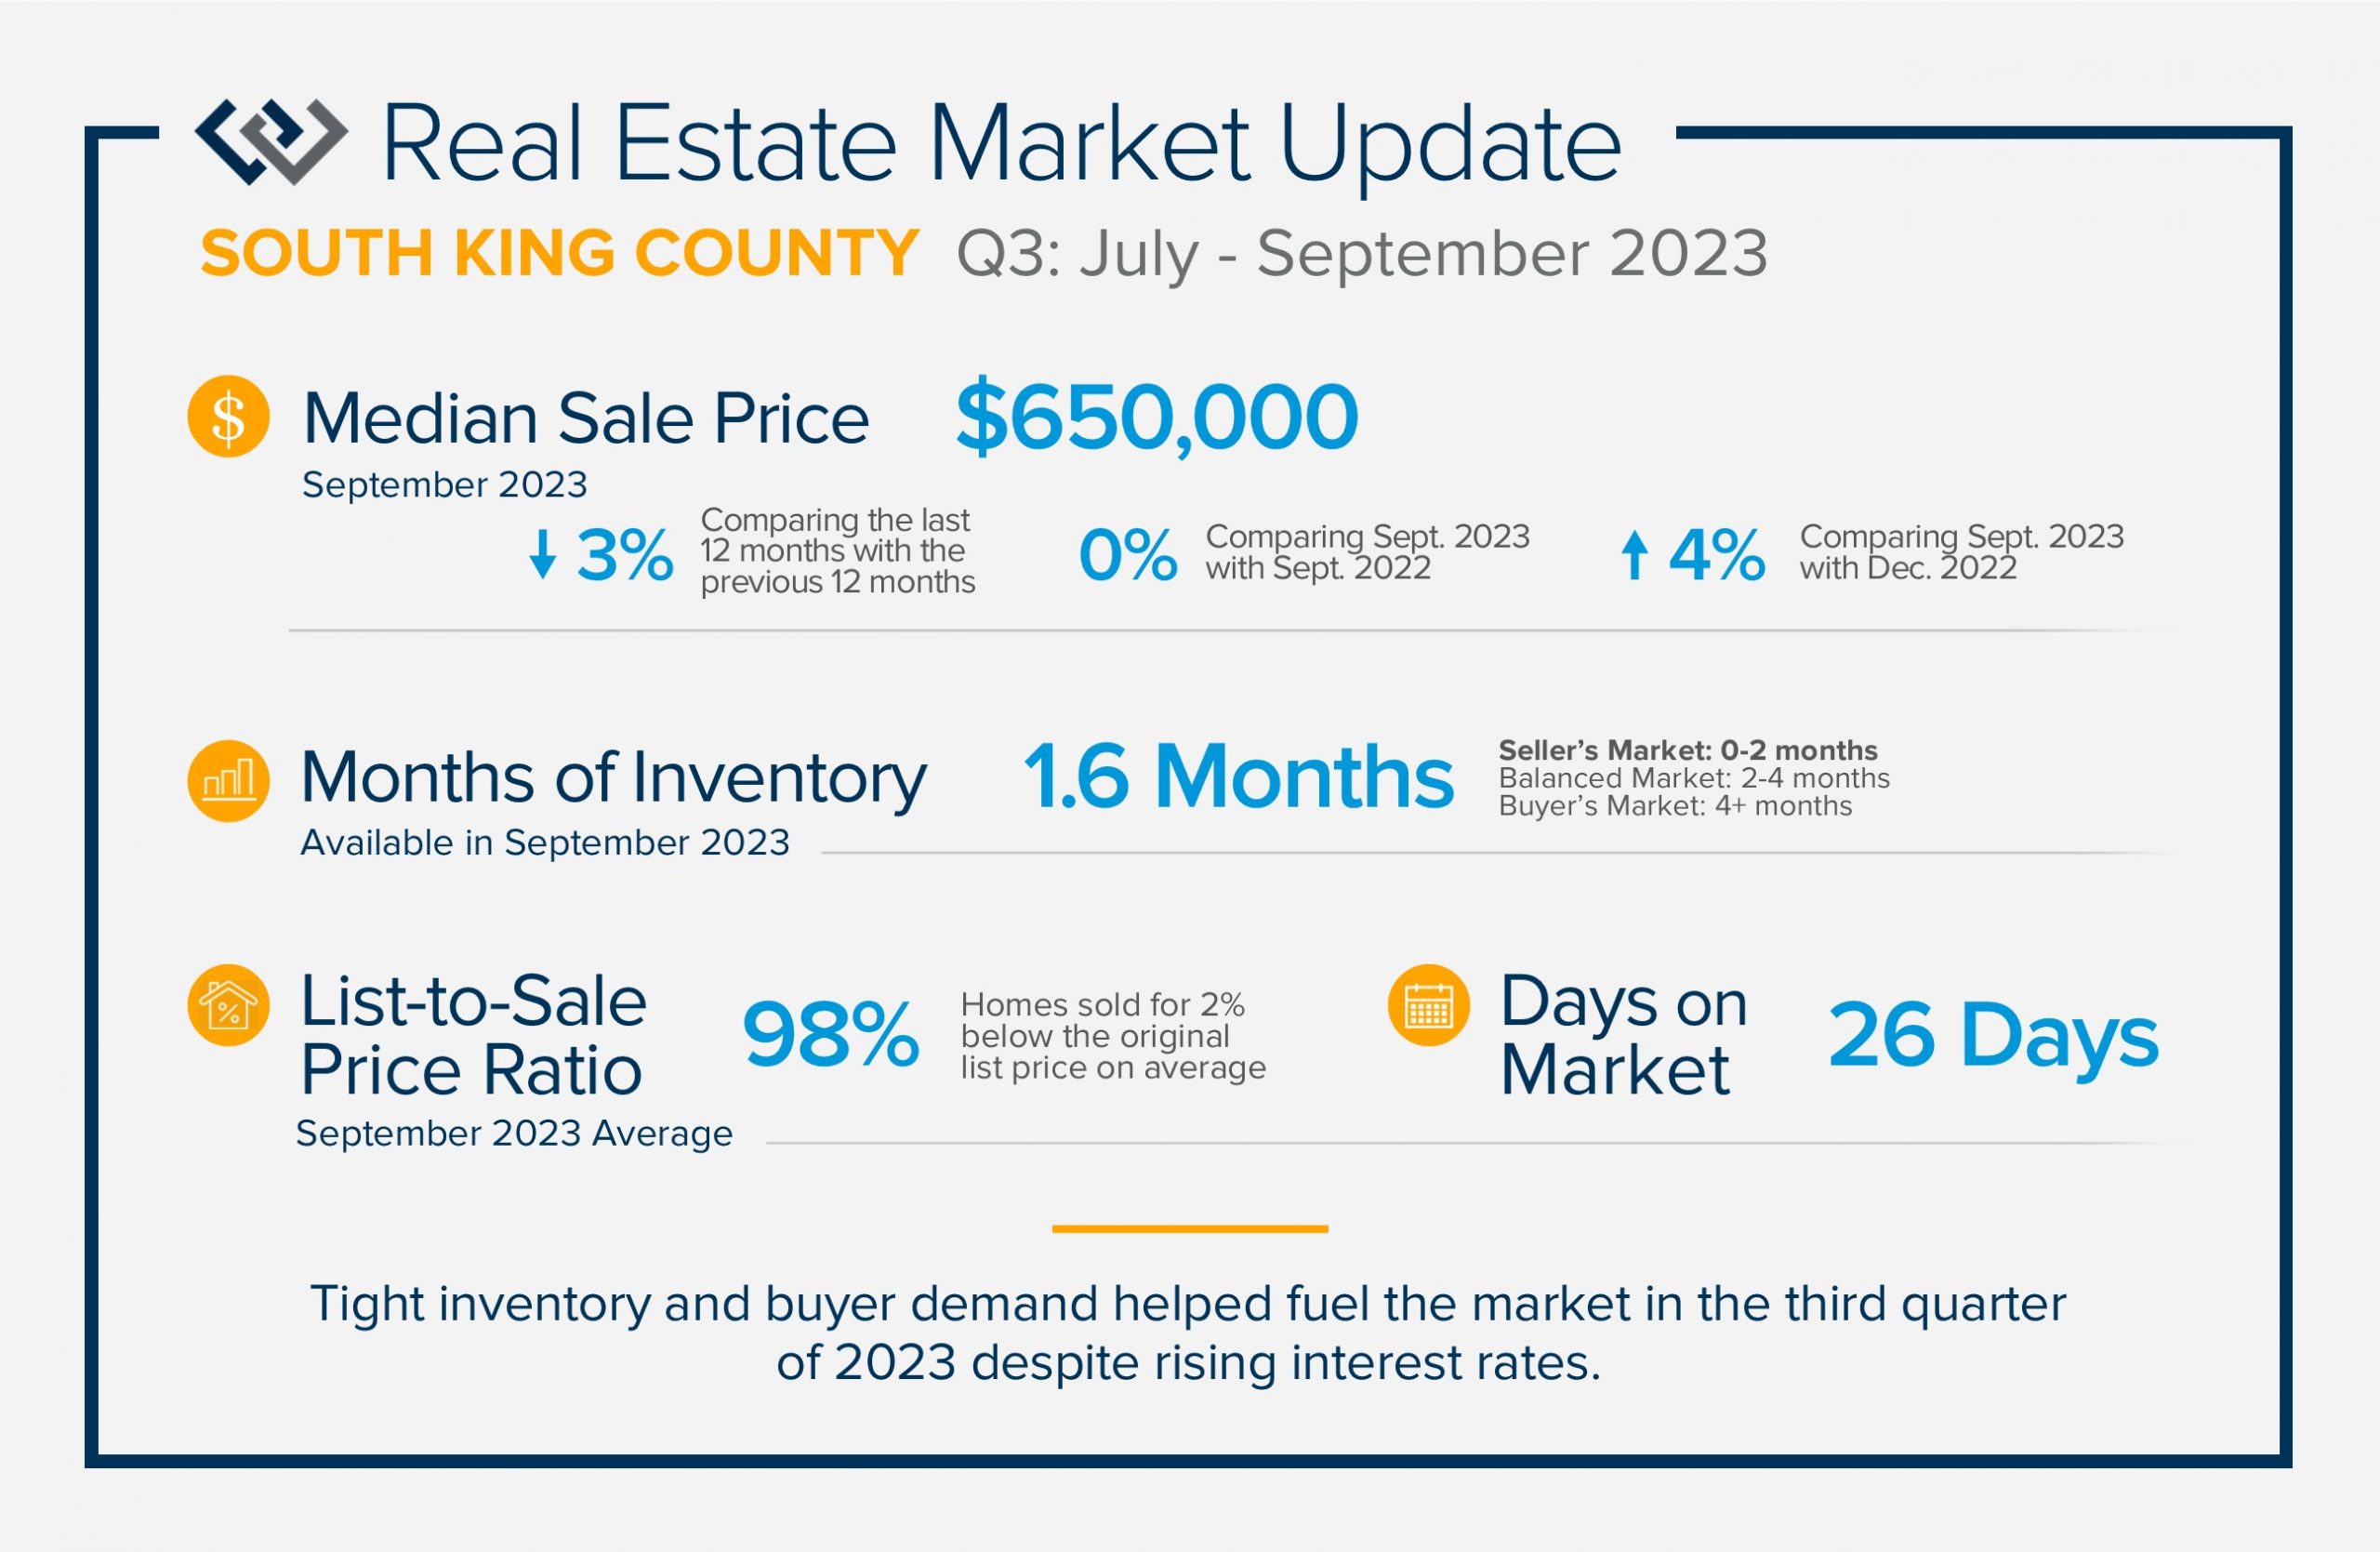
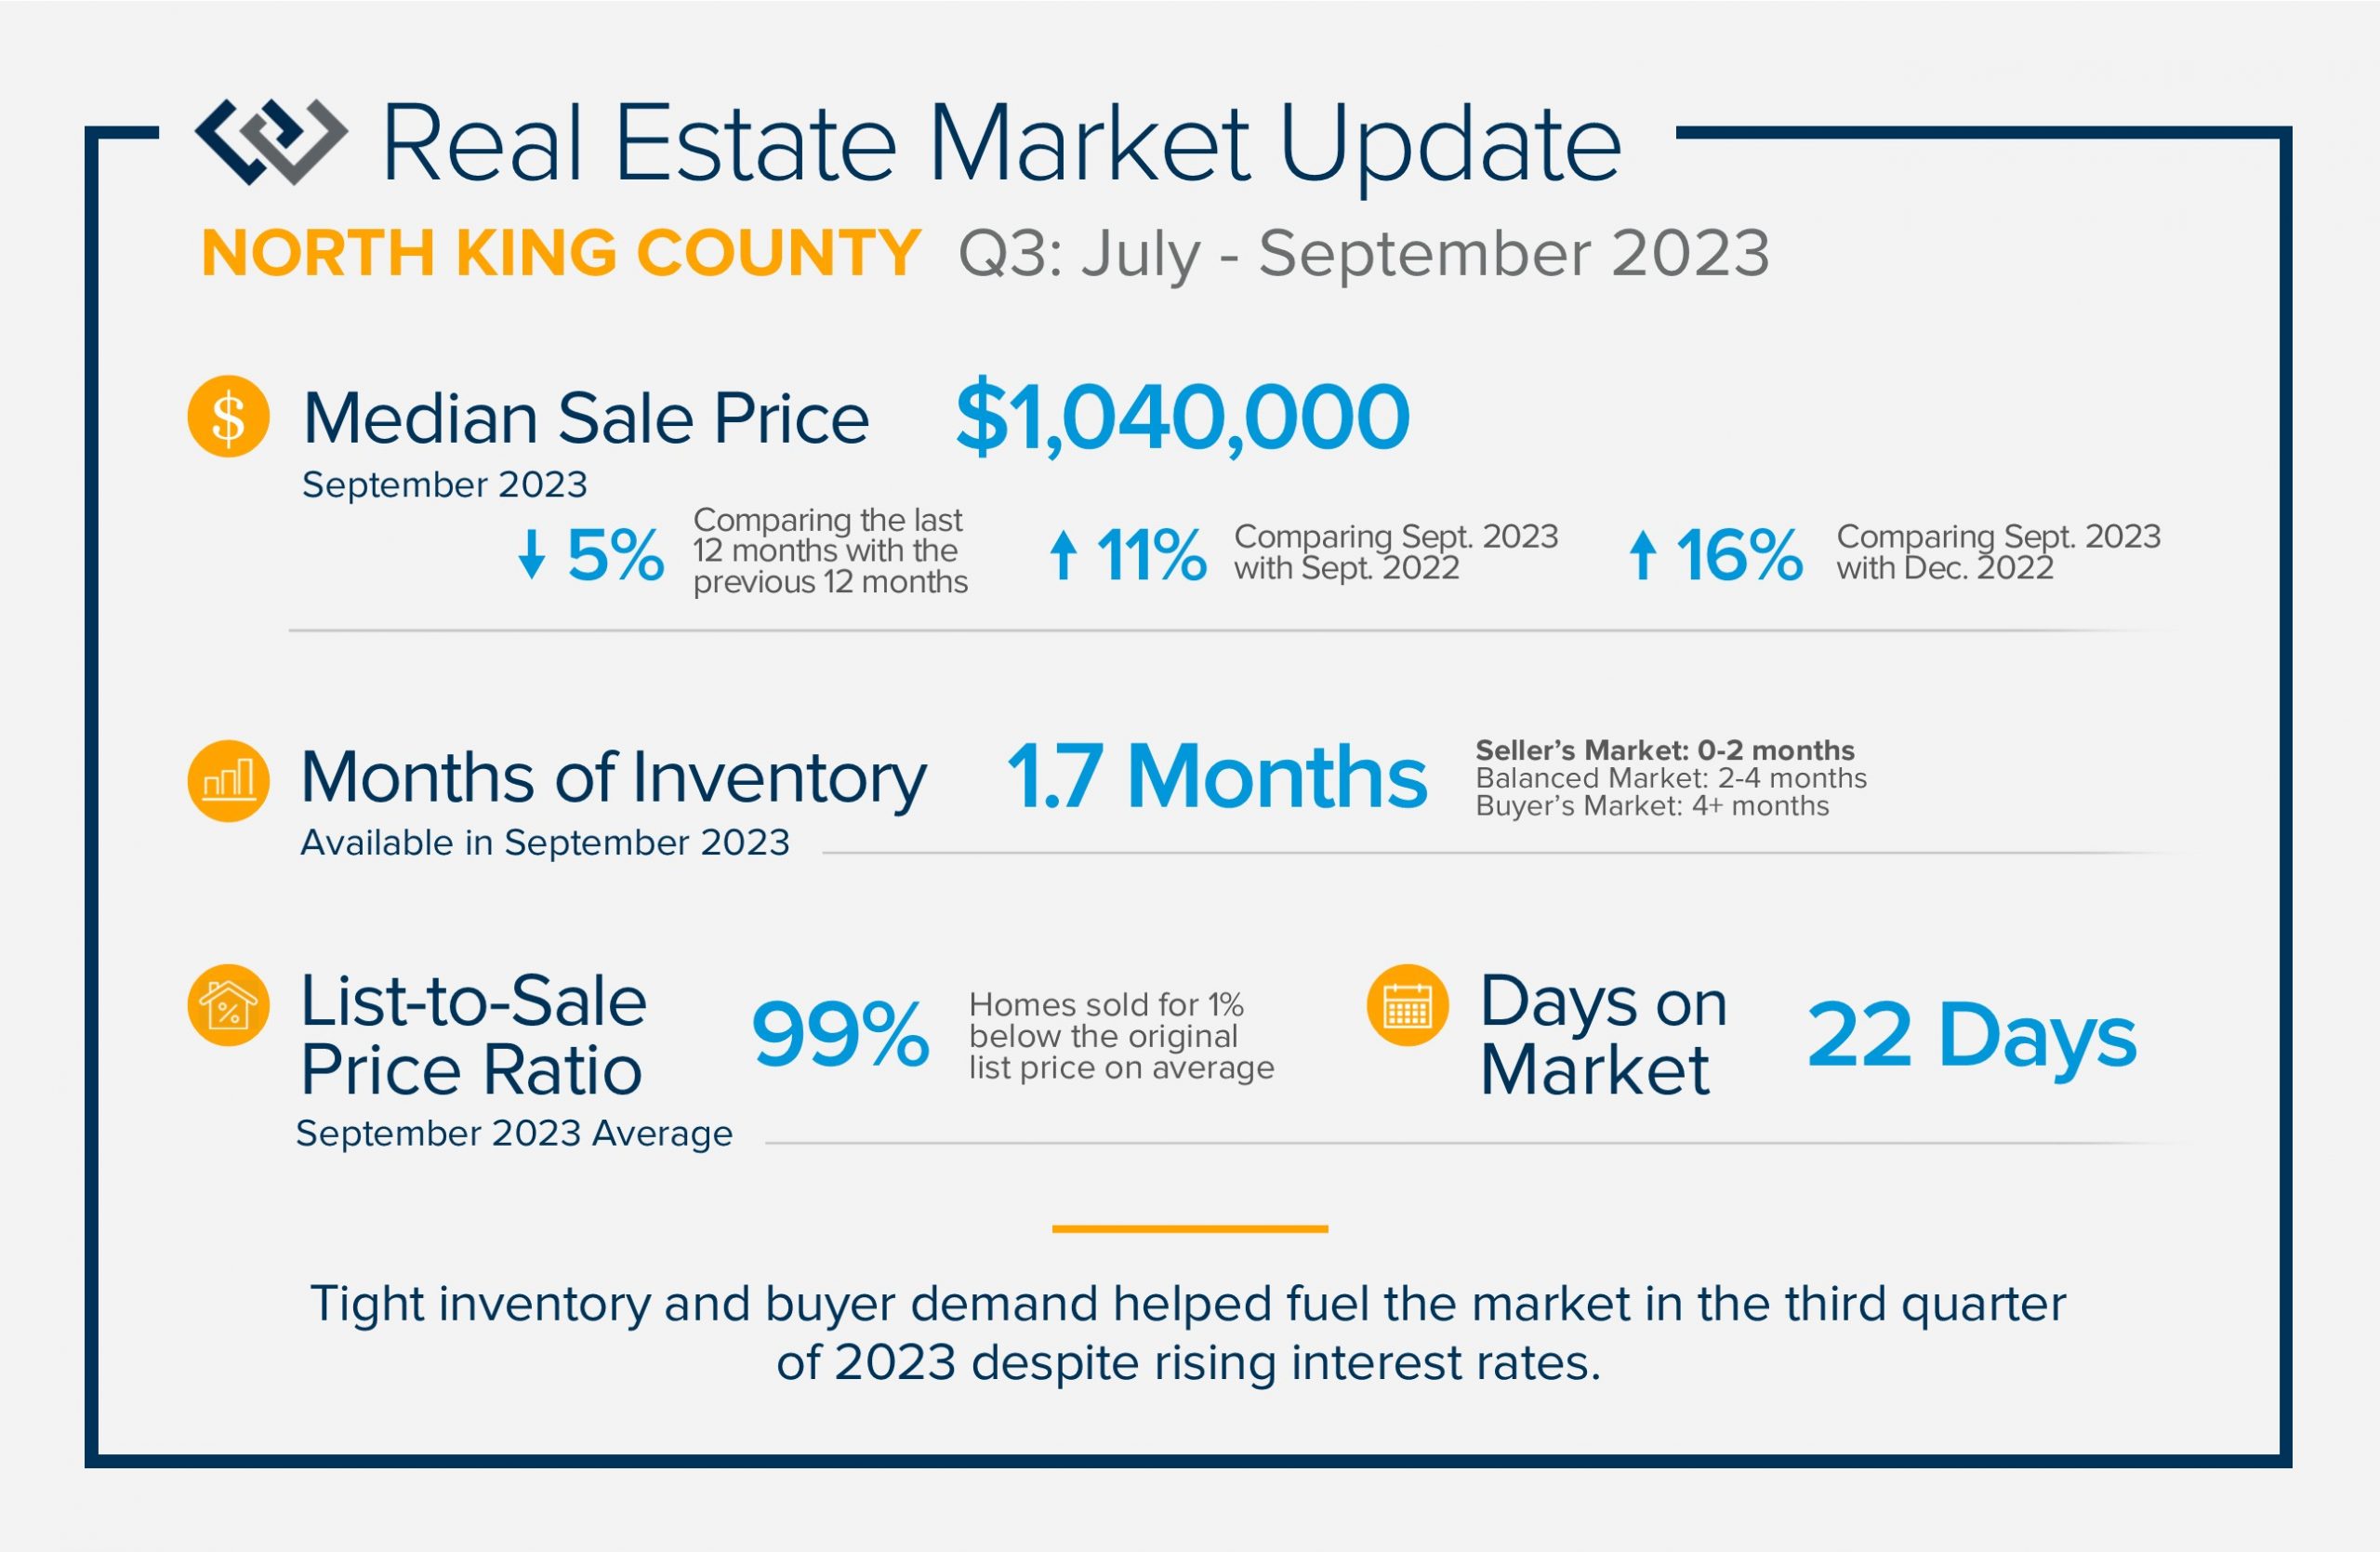 Tight inventory and buyer demand helped fuel the market in the third quarter of 2023 despite rising interest rates. There have been fewer listings in 2023 than in 2022 which has created price growth since the first of the year. Prices peaked in spring 2022, corrected in the second half of 2022, and then they started to rise again in 2023. Home equity is high with over 50% of all homeowners having 50% or more equity in their homes.
Higher interest rates have been a factor that buyers are having to manage. Some buyers are getting creative with interest rate buy-downs to help ease their monthly payments. Experts predict that rates will decrease over the next 18 months making temporary rate buy-downs attractive.
As we finish out 2023, we anticipate inventory to remain tight and buyer demand to continue. Sellers who are deciding to cash in their equity now are finding success. If you are curious about how the real estate market relates to your goals, please reach out. It is my goal to help keep my clients informed and empower strong decisions.