Does it make more sense to rent or own?

The current break-even horizon* in the Seattle metro area is 1.6 years!
*The amount of time you need to own your home in order for owning to be a superior financial decision.

With rising rental rates, historically low interest rates, and home prices on the rise, the advantage of buying vs. renting is becoming clearer each month.
In fact, Seattle has seen some of the sharpest rent hikes in the country over the last year! Snohomish County has seen a huge increase in apartment growth and rising rental rates as well. There are several factors to consider that will lead you to make the best decision for your lifestyle and your financial bottom line. Zillow Research has determined the break-even point for renting vs. buying in our metro area. In other words, the amount of time you need to own your home in order for owning to be a superior financial decision. Currently in Seattle the break-even point is 1.6 years – that is quick! What is so great about every month that ticks away thereafter is that your nest egg is building in value.
We are happy to help you or someone you know assess your options; please contact us anytime.
These assumptions are based on a home buyer purchasing a home with a 30-year, fixed-rate mortgage and a 20 percent down payment; and a renter earning five percent annually on investments in the stock market.
Quarterly Market Trends: Eastside
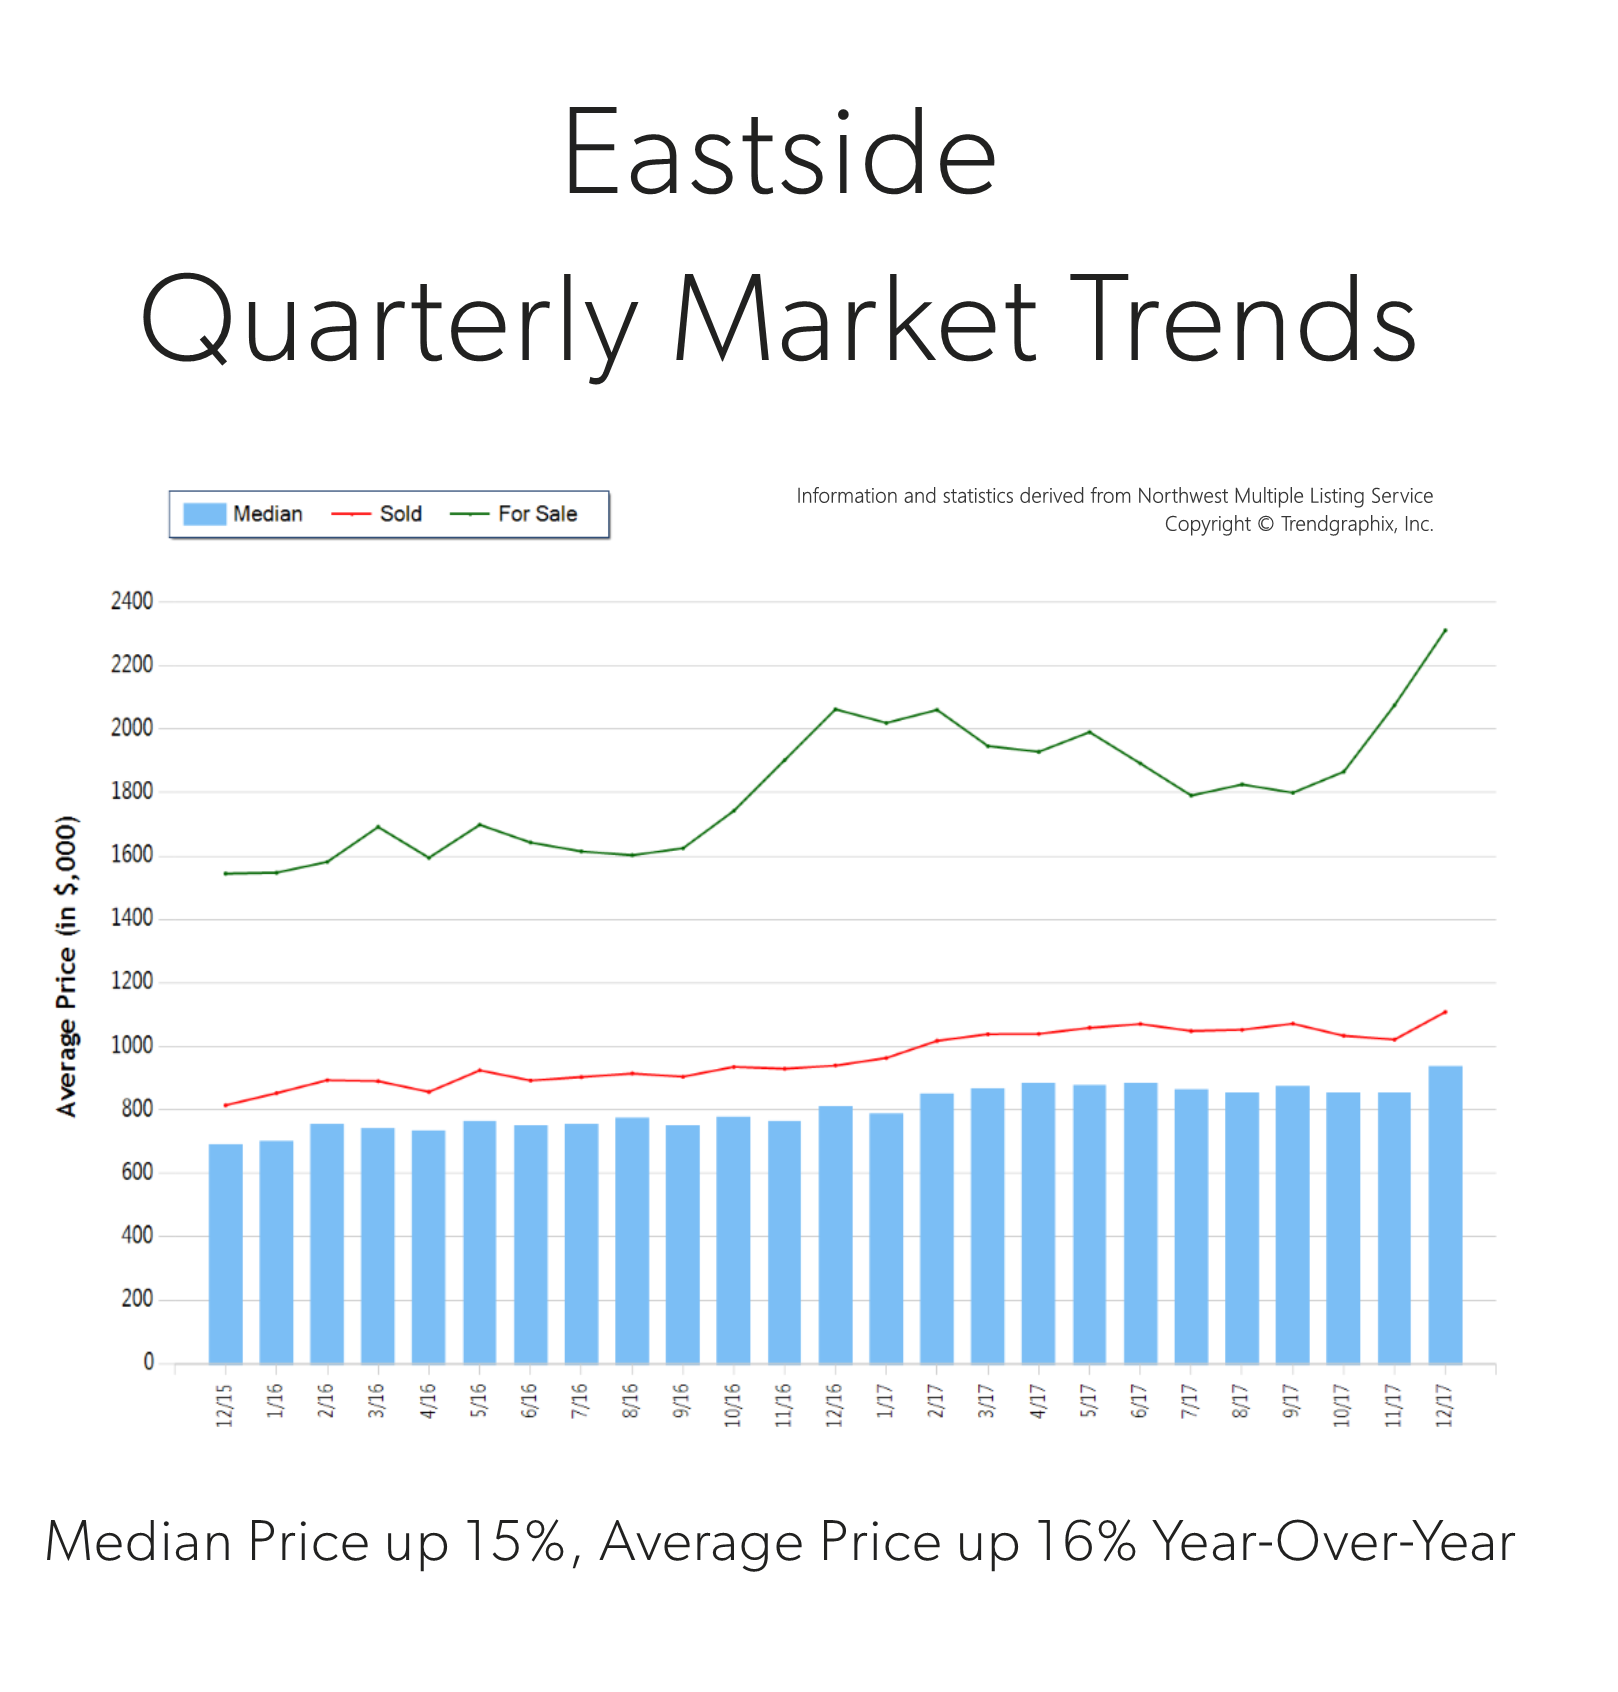
Q4 2017
 Price growth was particularly strong in 2017! Median was up 15% and average price up 16% over 2016. Median price in 2017 landed at $865,000 and the average at $1,049,000. The average amount of days it took to sell a house in 2017 was 24 days, which is 17% faster than 2016. The average list-to-sale price ratio over the last year was 101%, with the spring months as high as 103%! In 2017, inventory growth continued to be a challenge, with a 4% decrease in new listings compared to 2016. Even with inventory limitations there were a near equal amount of sales! This phenomenon illustrates strong buyer demand and a need for more listings.
Demand for Eastside real estate has grown due to close proximity to job centers, great schools and quality of life. Over the last year, the Eastside was 70% more expensive than south Snohomish County and 22% over Seattle Metro. Historically low interest rates continue to drive the market as well, they have helped offset the increase in prices. Sellers are enjoying great returns due to this phenomenon and buyers are securing mortgages with minor debt service.
This is only a snapshot of the trends on the Eastside area; please contact us if you would like further explanation of how the latest trends relate to you.
Quarterly Market Trends: North King County

Q4 2017
 Price growth was particularly strong in 2017! Median and average prices were up 14% over 2016. Median price in 2017 landed at $715,000 and the average at $787,000. The average amount of days it took to sell a house in 2017 was 17 days, which is 19% faster than 2016. The average list-to-sale price ratio over the last year was 104%, with the spring months as high as 107%! In 2017, inventory growth continued to be a challenge, with a 4% decrease in new listings compared to 2016. Even with inventory limitations there were a near equal amount sales! This phenomenon illustrates strong buyer demand and a need for more listings.
Demand for north King County real estate has grown due to close proximity to job centers while maintaining a neighborhood feel. Over the last year, north King County was 41% more expensive than south Snohomish County and 77% over south King County. Historically low interest rates continue to drive the market as well, they have helped offset the increase in prices. Sellers are enjoying great returns due to this phenomenon and buyers are securing mortgages with minor debt service.
This is only a snapshot of the trends in north King County; please contact us if you would like further explanation of how the latest trends relate to you.
Quarterly Market Trends: South Snohomish County
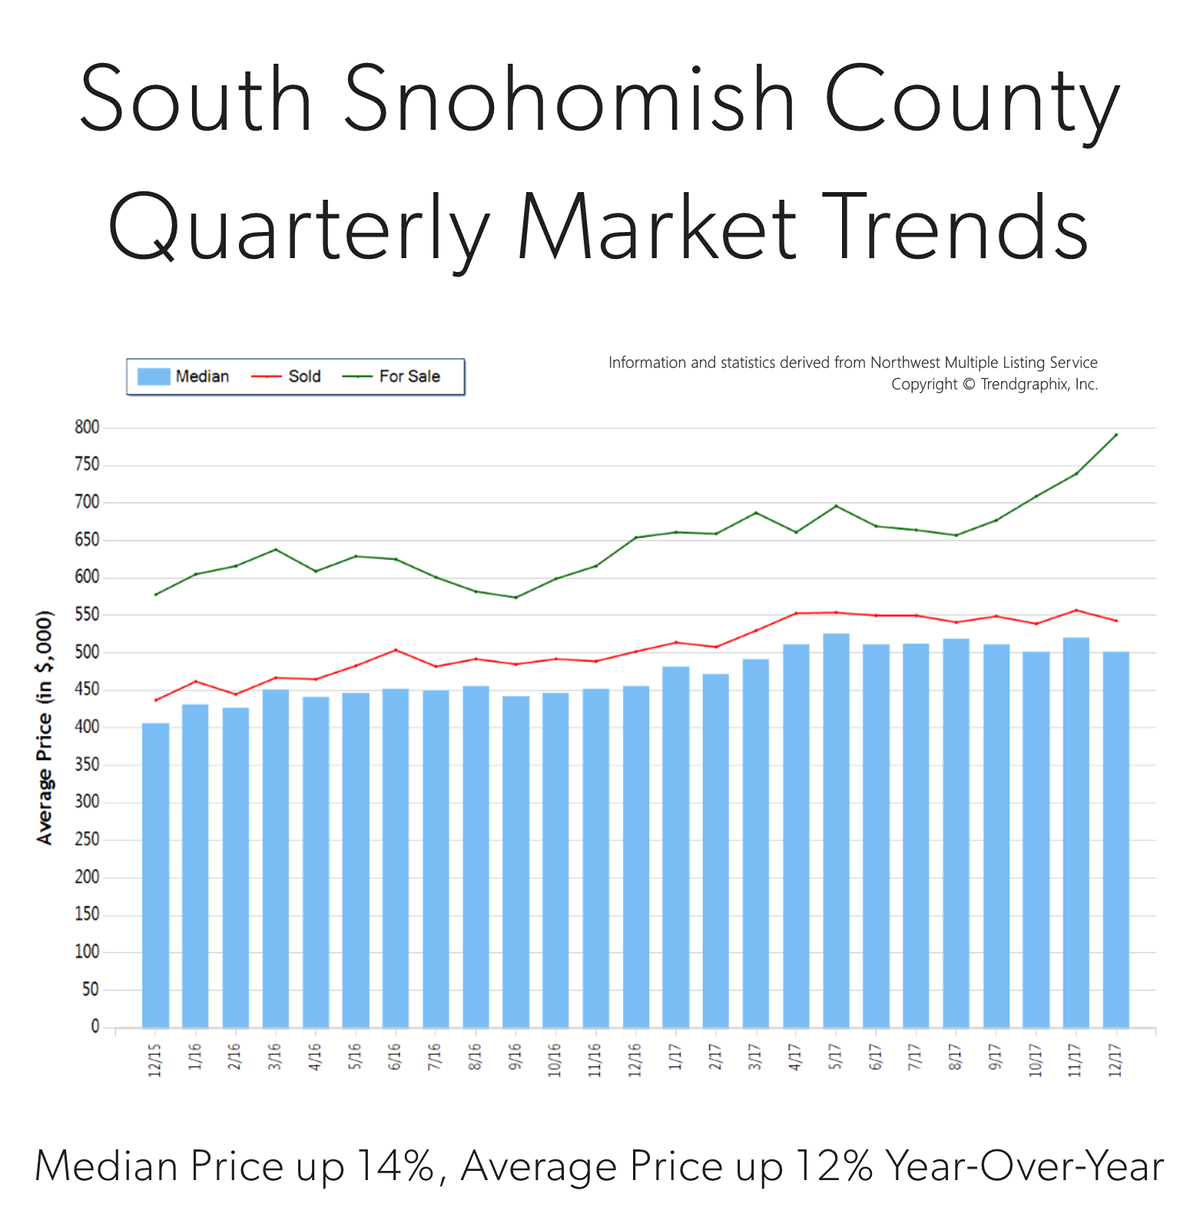
Q4 2017
 Price growth was particularly strong in 2017! Median was up 14% and average price up 12% over 2016. Median price in 2017 landed at $508,000 and the average at $543,000. The average amount of days it took to sell a house in 2017 was 24 days, which is 17% faster than 2016. The average list-to-sale price ratio over the last year was 101%, with the spring months as high as 103%! In 2017, inventory growth continued to be a challenge, with a 1% decrease in new listings compared to 2016. Even with inventory limitations there were 4% more sales! This phenomenon illustrates strong buyer demand and a need for more listings.
South Snohomish County real estate has seen a steady stream of buyers come our way due to affordability, reasonable commute times to job centers and quality of life. In fact, the median price in 2017 was 41% higher in north King County. Historically low interest rates continue to drive the market as well, they have helped offset the increase in prices. Sellers are enjoying great returns due to this phenomenon and buyers are securing mortgages with minor debt service.
This is only a snapshot of the trends in south Snohomish County; please contact us if you would like further explanation of how the latest trends relate to you.
 Facebook
 X
X
 Pinterest
 Copy Link




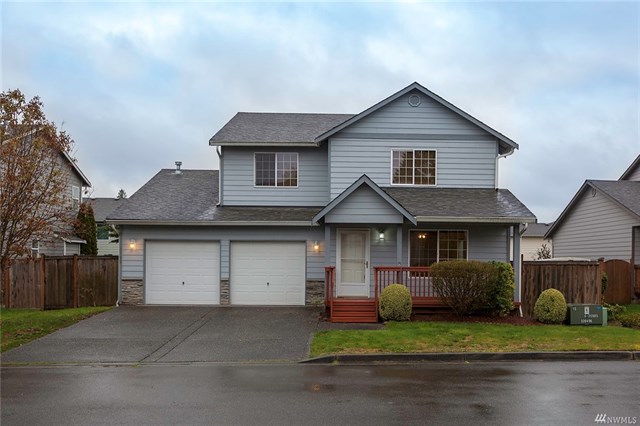 A happy family of five just moved in to this house in mid-May. Two hard working parents, Brandy and Juan, with three teenagers were renting a 3-bedroom, 1-bath rambler in Edmonds and needed more space. It was time to make a move, and they had saved up a 3% down payment for a new home. Their budget was $400,000.
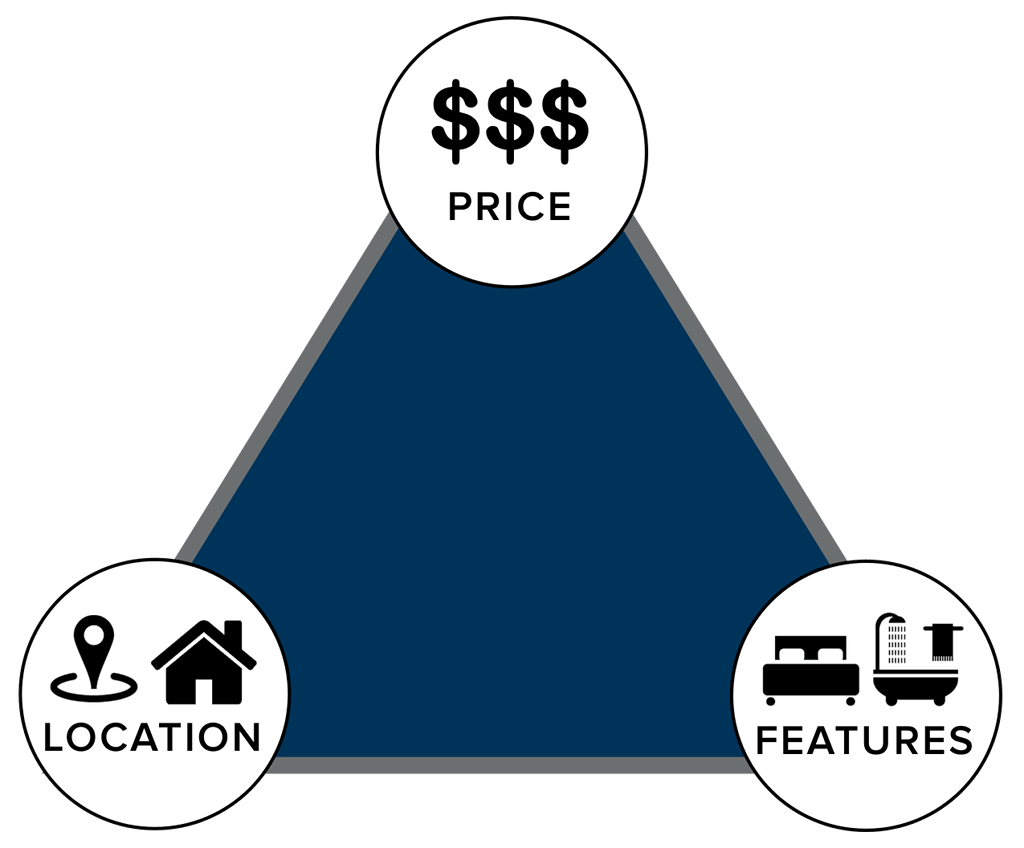 The first step in the home buying process was sitting down with their agent for the initial buyer consultation. This is where they discussed market conditions, desired features such as bedrooms, bathrooms and garage, and their budget. This lead them to explore which locations had the inventory that met their needs in order to stay within their budget. They had to marry these three key points – we like to call this the Triangle of Buyer Clarity. They then identified a few workable locations that had inventory which supported their desired features and their budget and went for it. This upfront research and partnership with their agent lead to Brandy and Juan finding success rather quickly, saving them money in an appreciating market, and a whole lot of strife.
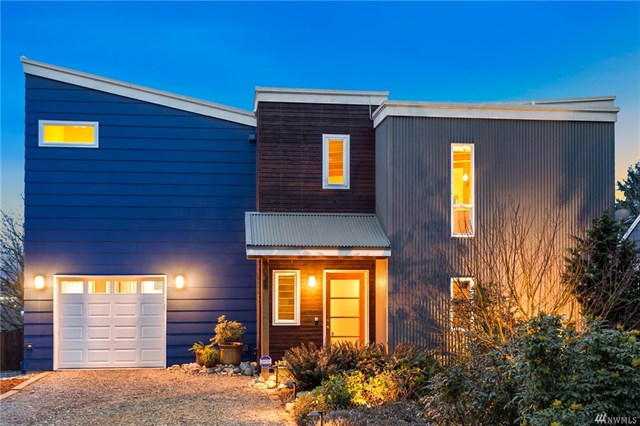 First, how cool is this house? Super cool! That’s just how Paul and Ange feel about their newly purchased home in the Highland Park neighborhood of West Seattle. They just closed in early April and have already attended two neighborhood BBQ’s, received gifts from their new neighbors, discovered new parks and restaurants and, wait for it…shortened their commute.
 The point of these two stories is to debunk the sentiment we hear from time to time, that first-time home buyers cannot find success in our market. With a well-laid-out plan strategically constructed by the agent and client, we are seeing many happy stories for first-timers. The end result is putting these new homeowners on the path to building wealth, growing thriving communities, and making their house their home.
 Double-digit price appreciation has taken place for over 3 years now, so prices are up. Way up. In fact, in just the last year we have seen prices rise 14% year-over-year. When talking with people about our real estate market, the conversation often involves the question, “are we headed toward a bubble?” We get asked this question often, and it is understandable. With the Great Recession not too far back in our rear-view mirror, the fear that surrounds the bottom dropping out in our home values is real. The large price gains might seem familiar to the gains of the previous up market of 2004-2007, but the environment is much different, and that is why we are not headed toward a housing collapse.
 Dear Greater Seattle Home Buyer,

 In 2017, the average sales price for a single-family residential home in the Seattle Metro area was $801,000, up 14% from the year prior! In south Snohomish County (Everett to the King County line) the average sales price for a single-family residential home in 2017 was $543,000, up 12% from the year prior, however 48% less expensive than Seattle Metro.
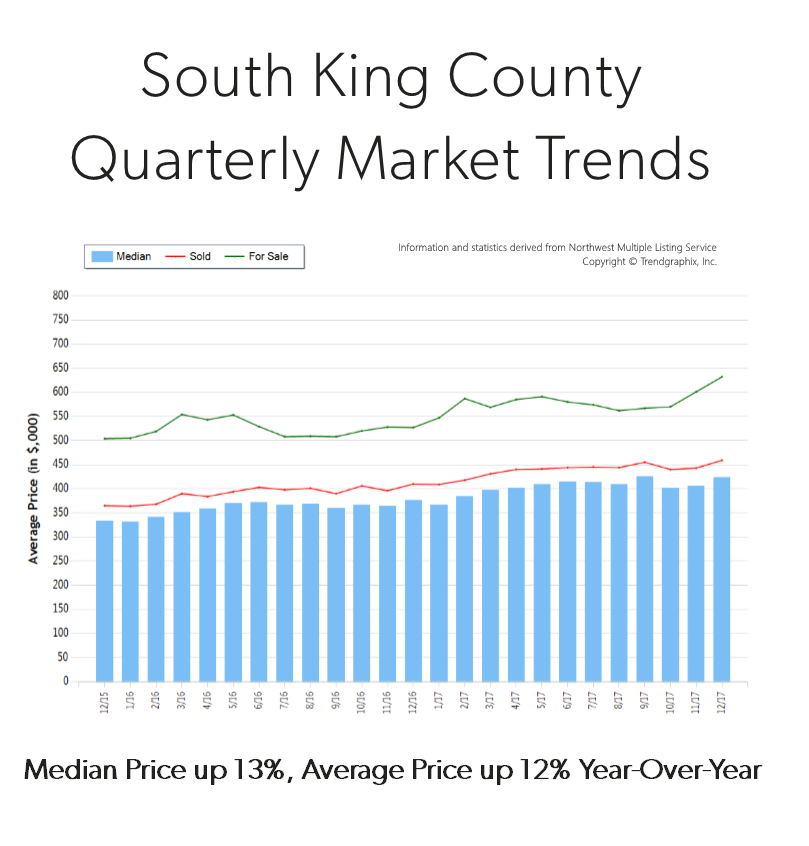
 Q4 2017