
 Facebook
 X
X
 Pinterest
 Copy Link
Quarterly Market Trends: North Snohomish County
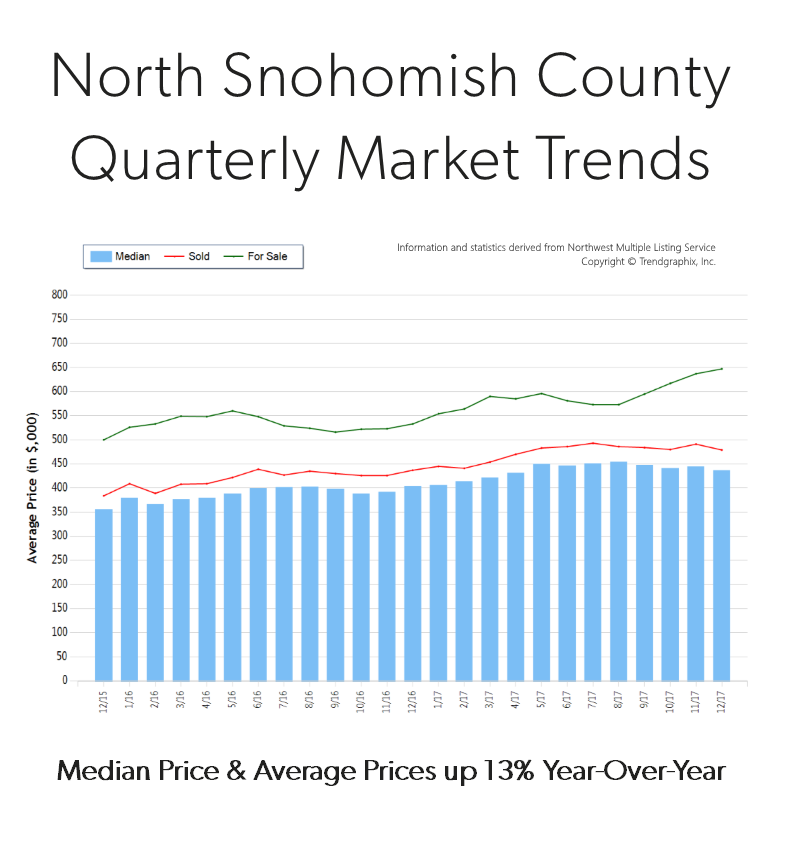
Q4 2017
 Price growth was particularly strong in 2017! Median and average prices were up 13% over 2016. Median price in 2017 landed at $371,000 and the average at $400,000. The average amount of days it took to sell a house in 2017 was 35 days, which is 10% faster than 2016. The average list-to-sale price ratio over the last year was 99%, with the spring months as high as 101%! In 2017, inventory growth continued to be a challenge, with an 8% decrease in new listings compared to 2016. Even with inventory limitations there were 3% more sales! This phenomenon illustrates strong buyer demand and a need for more listings.
North Snohomish County real estate has seen a steady stream of buyers come our way due to affordability and quality of life. In fact, the median price in 2017 was 37% higher in south Snohomish County. Historically low interest rates continue to drive the market as well, they have helped offset the increase in prices. Sellers are enjoying great returns due to this phenomenon and buyers are securing mortgages with minor debt service.
This is only a snapshot of the trends in north Snohomish County; please contact us if you would like further explanation of how the latest trends relate to you.
You’d Like to Sell Your Home, but Where to Next… and How?


Homeowners across our region are enjoying very healthy equity levels due to an upswing in the real estate market over the last five years. In fact, the median price in King County is up 50% over the last five years and up 47% in Snohomish County. This growth in equity has given homeowners the exciting option to sell their home for a high price and move on to their next chapter, such as a move-up, down-size or second home. This price growth is great news and provides many opportunities, however we have also faced some challenges in how to make these transitions.
Our biggest challenge in the marketplace right now is inventory levels; sometimes requiring a buyer to compete in multiple offers for their next home. Currently King County sits at 0.7 months of inventory and 0.8 in Snohomish. Historically, buyers that are also sellers would commonly secure a new home contingent on the sale of their current home. Meaning the seller of the new home they are buying would give them a month or so to get their current house sold in order to buy theirs. Well in this market, that is only rarely an option. So, the million-dollar question is this: how does one who has gained so much equity, now itching to get that bigger house, different location, or perfect rambler for settling into retirement, make this transition without having to move twice? We need to get creative and have a strategy. Two options that have recently proved to be successful, are negotiating a rent-back for sellers or using the Windermere Bridge Loan program.
First, negotiating a rent-back has become a great option for someone who needs to first sell their current home in order to buy. The way it works is we put their home on the market, price it competitively to create demand, and ask for a rent-back as one of the preferred terms. If this rent-back is successfully negotiated, then the seller closes on their home and collects their funds, but gets to stay in the house anywhere from 30-60 days. This enables the seller, who is now a buyer, to have their cash in-hand, time to find a new house, get it under contract and close the sale when their rent-back is ending. This eliminates the need to move twice. There is a bit of calculated risk in this plan, but we’ve seen it work several times, always with a plan B ready just in case. Rarely has plan B needed to be executed, and often times we’ve even been able to pay little to no rent during this time.
The second option is the Windermere Bridge Loan program. This is an amazing tool for homeowners that own their homes free and clear, or have paid down their debt quite a bit. This is a low-cost alternative to pull the equity out of one’s house prior to selling it in order to make a non-contingent offer. The way it works is we take the market value of the house the homeowner current lives in, established by a comparative market analysis completed by your Windermere agent and signed off by the Broker. We then take 65% of that value and subtract any debt owed, and that is the maximum amount the homeowner can borrow for their next down payment. They can then make a non-contingent offer on a new home. What is really great about this, is that it doesn’t require an appraisal (like a HELOC does), and these can easily be turned around in 3-5 business days. This tool provides the opportunity to quickly and inexpensively pull your equity out, be competitive, and eliminates the double move.
The fees associated with this program are a 1% loan fee on the equity that is pulled, a title report, and interest that is incurred between the loan funding and being paid off once the subject home is sold. That interest is conveniently wrapped up in the closing costs when they close the sale of their home, eliminating the need to make monthly interest payments. In a strategy that is somewhat mind blowing- we can sometimes use these bridge loans and never have to actually fund them. For example, if we secure a property non-contingent with the bridge loan and immediately get the subject home on the market, we can often secure a sale with a simultaneous closing, and never have to fund the loan. This eliminates the loan fee, interest, and the need to carry two mortgages.
If you are excited about equity levels and today’s low interest rates and have thought about making that move you’ve been waiting for, but have been fearful of how to do it all – we can help. These two options, along with great attention to detail, hand-holding, and careful planning have helped many people make these exciting transitions. It is our goal to help keep our clients informed and empower strong decisions. Please contact any one of our agents if you would like further information on how this might work for you or someone you know.
Affordability: Commute Times & Interest Rates
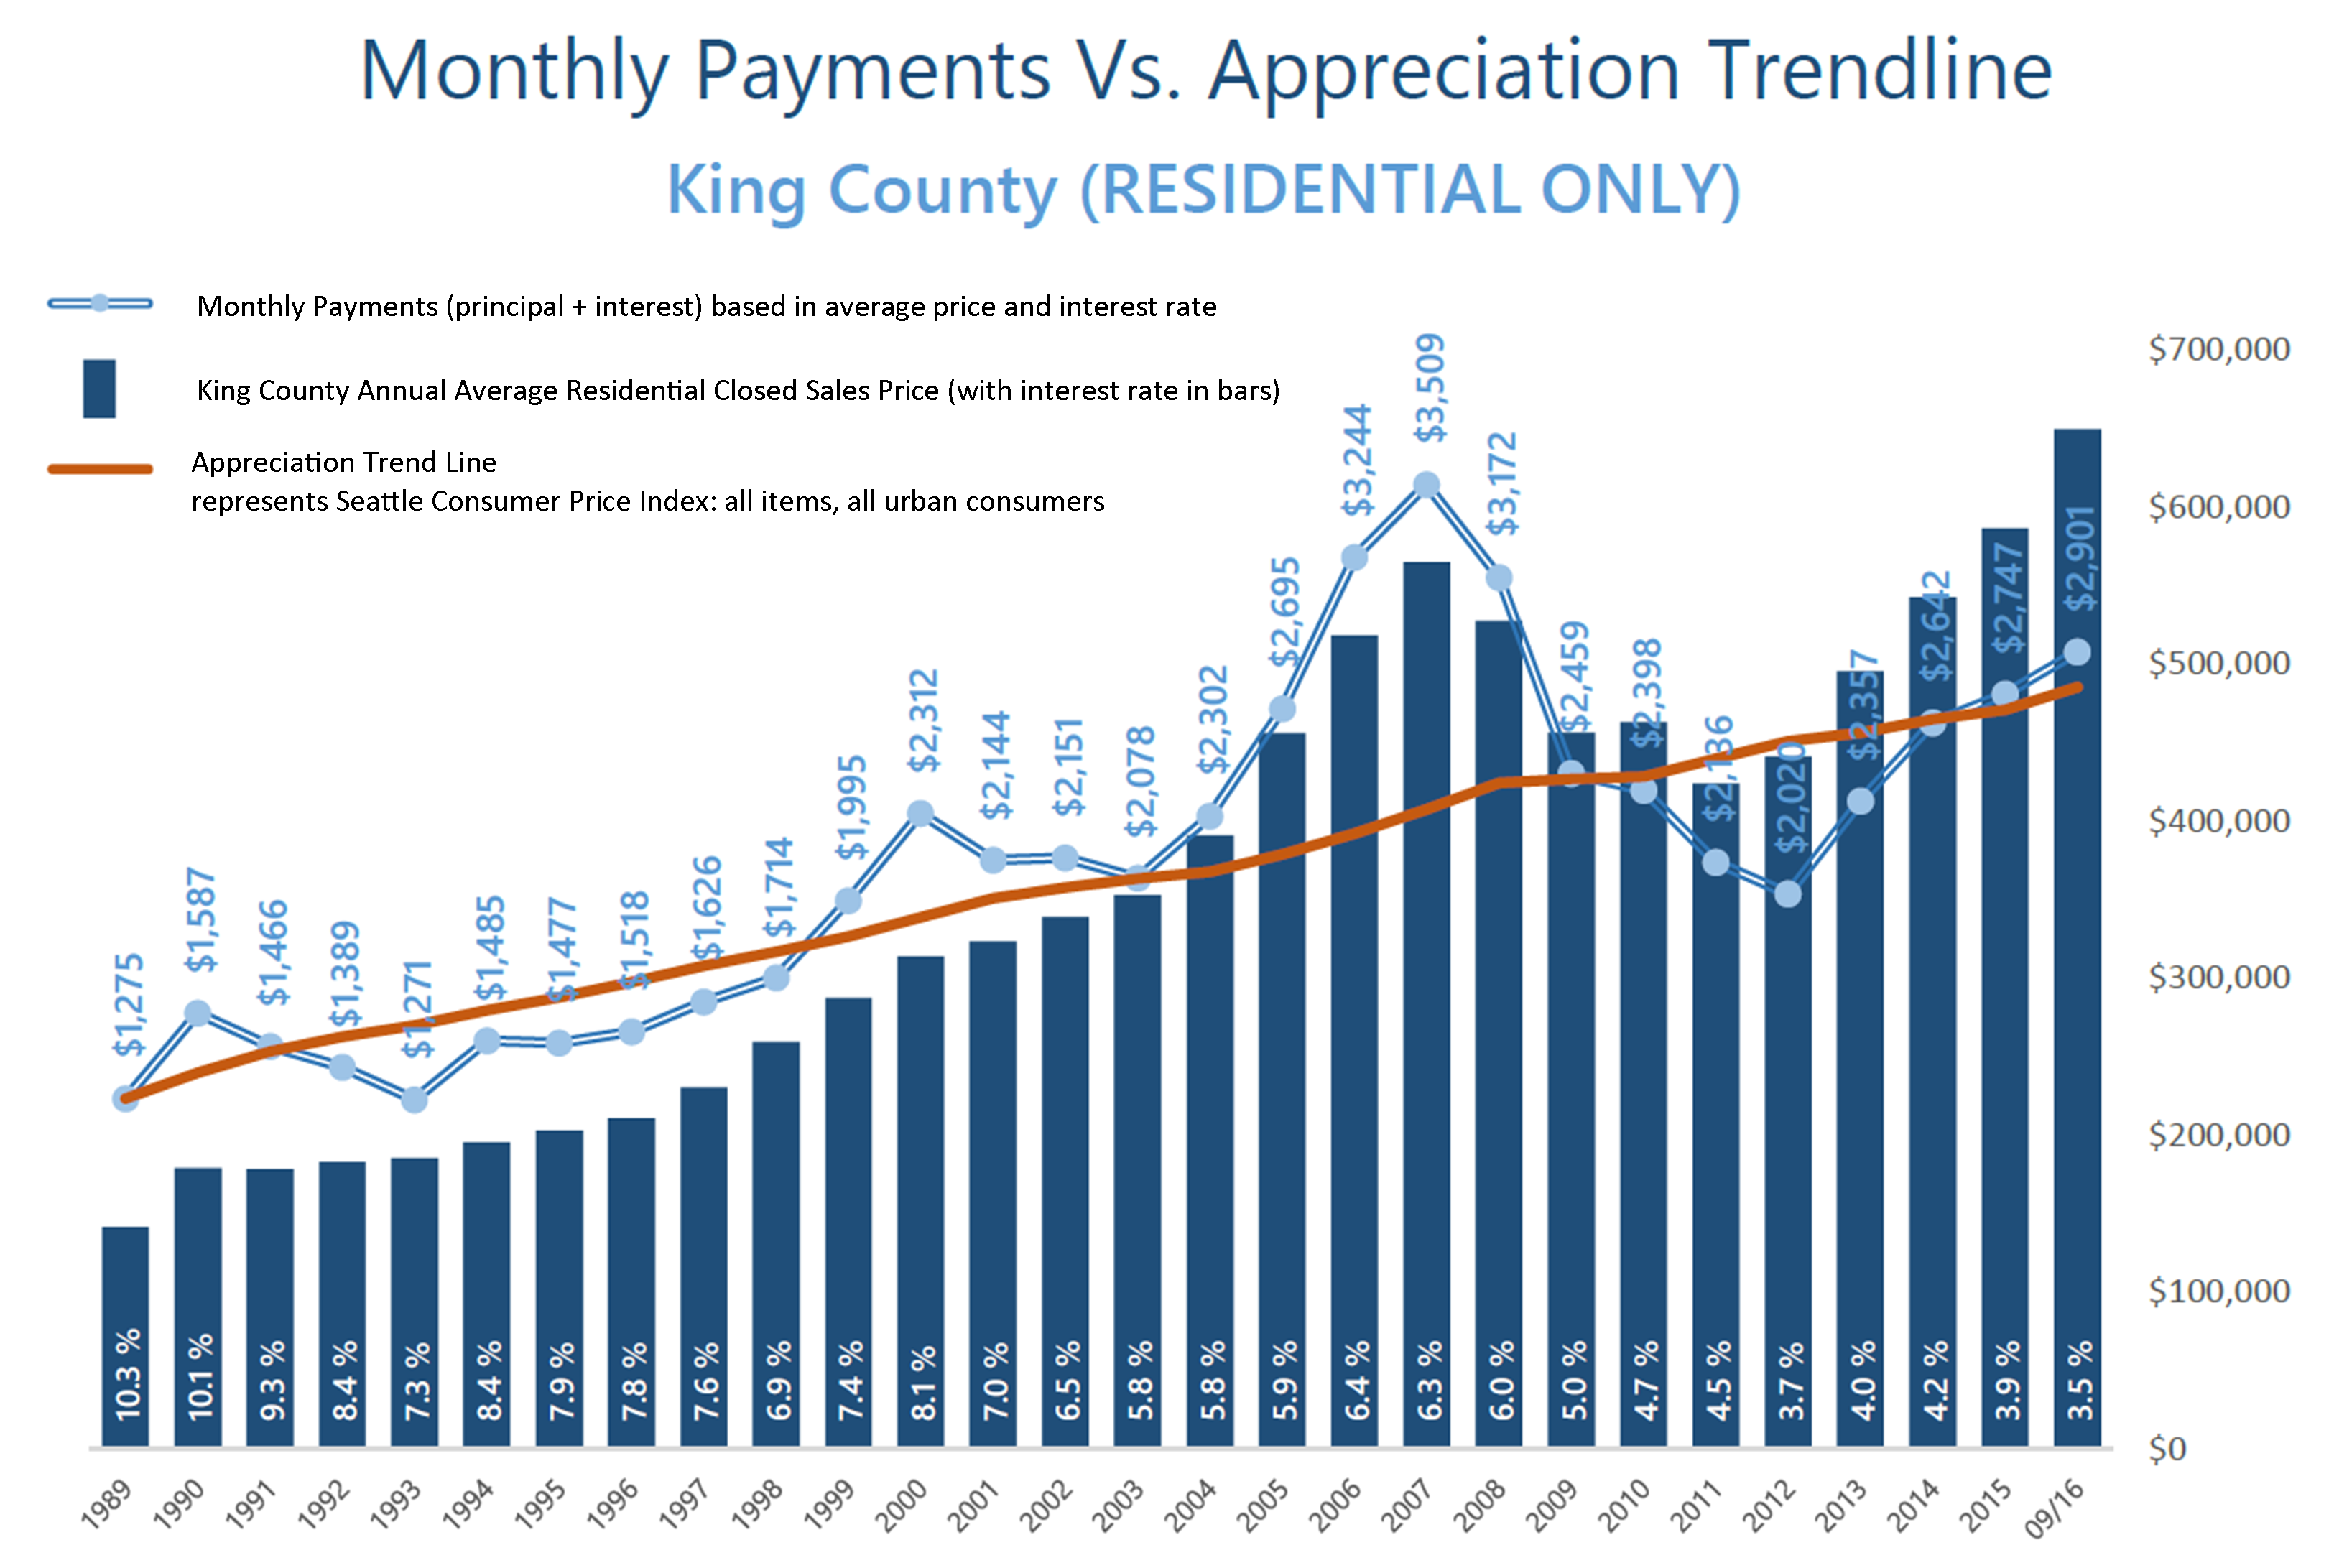
 These graphs illustrate the brass tacks of affordability between King and Snohomish Counties, measured by the average monthly payment. Most recently in September, the average monthly payment was 35% higher in King County compared to Snohomish County. What is fascinating, though, is comparing today’s average monthly payment to peak monthly payments back in 2007! In King County, monthly payments are currently 21% less than during the peak, and in Snohomish County, 36% less. That is a lot of saved monthly overhead. Note that this has everything to do with today’s historical interest rates, as average prices are higher now than in 2007. When one buys or refinances a house, they are not only securing the property, but securing the rate for the life of the loan.
Close proximity to the work place and affordability is often near the top of a buyer’s list of preferred features. 2016 has continued to be a year when commute times to major job centers widened the price divide between key market areas in the greater Seattle area. Over the last 12 months, the average sales price for a single-family residential home in the Seattle Metro area was $696,000! In south Snohomish County (Everett to the King County line), the average sales price for a single-family residential home was $471,000 – 48% less than Seattle Metro. Further, if you jump across Lake Washington to the Eastside, the average sales price for a single-family residential home was $881,000 – 27% more than Seattle Metro!
The “drive to qualify” mentality has been proven by the pending sales rate in south Snohomish County over the last 12 months. Pending sales are up 7% complete year-over-year, whereas in Seattle Metro pending sales are down 1%, and down 2% on the Eastside. We believe this is a result of affordability, more inventory choices in south Snohomish County, new construction options, lower taxes, strong school district choices, and manageable commute times. Newer transit centers and telecommuting have also opened up doors to King County’s little brother to the north as well. If you are curious about possible commute times, you can search for properties on our website based on commutes times, which is a feature provided by INRIX Drive Time. Also, we track the market in several ways, so if the graphs here are interesting to you, any of our agents would be happy to provide additional information relative to your specific neighborhood. Please contact us anytime, as it is our goal to help keep you informed and empower you to make strong real estate decisions.
A Thirteen-Year Overview of Inventory Levels- Where’s the Balance?
The two graphs here illustrate a thirteen-year overview of inventory levels in both King and Snohomish Counties, highlighting the 2007 crash. Inventory levels are measured by the months of available inventory. For example, if there were 60 homes available in July and 30 homes sold in July, you would be left with two months of inventory; meaning that if no new homes came to market, the demand of 30 homes per month would absorb the 60 available homes in two months. A buyer's market is defined by 6+ months of inventory, a balanced market, 3-6 months and a seller's market, 0-3 months. From March to June of this year we averaged 1.1 months of inventory in King County and 1.2 months in Snohomish County, both extreme seller's markets.
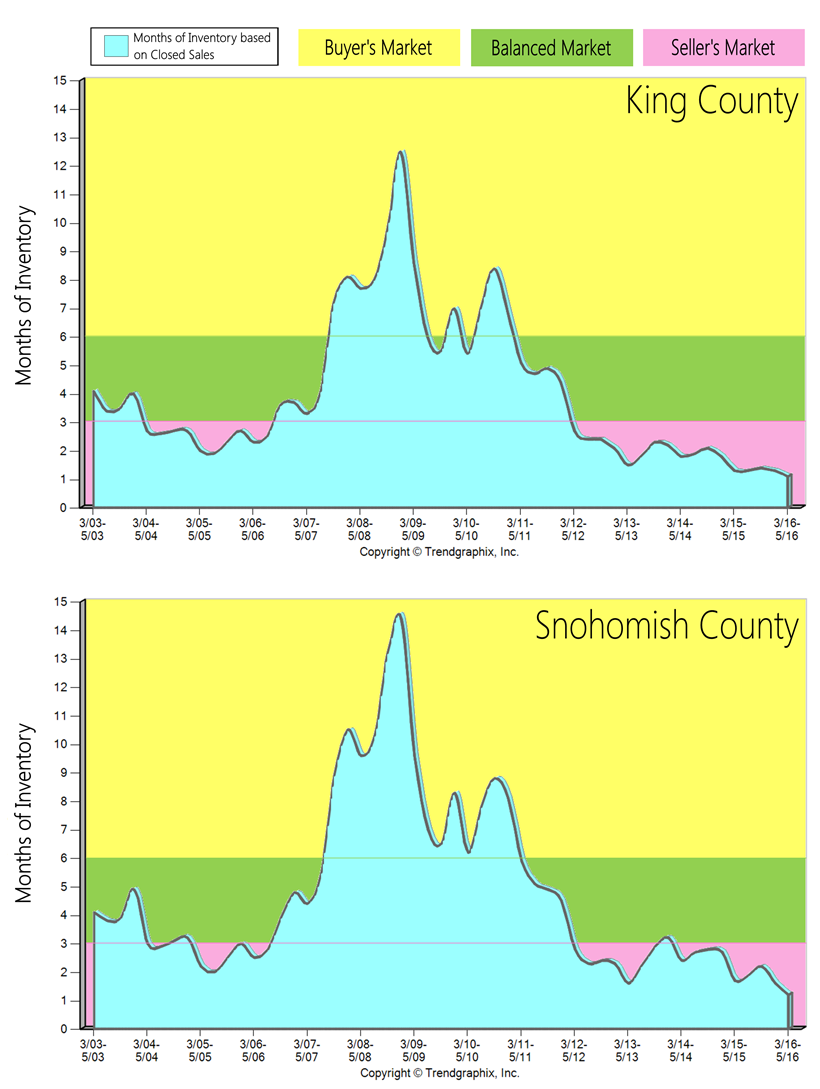 In King County over the last 13 years we saw three years of a buyer's market, which happened during the biggest economic downturn since the Great Depression, after the crash of the housing market in 2007. This economic fallout was a result of predatory lending practices, which created a large population of buyers who were not truly qualified to purchase a home. This oversaturated the market and then led it to its crash when those lending practices were shut down. These severe influences on the market led to quick jumps from a seller's to a buyer's market and then a buyer's to a seller's market. It only took one short year to transition from the seller's market of 2004-2006 to the three-year long buyer's market after the housing crash. Once the sub-prime lending options were shut down in July 2007, it eliminated many buyers, creating an extreme buyer's market. It also only took one short year to transition out of the downturn and back to a seller's market as the economy started to recover. It has been a seller's market in King County since May of 2012 – four years!
In Snohomish County over the last 13 years we saw four years of a buyer's market. Snohomish County was hit a bit harder by the Great Recession than our neighbor to the south, as it took longer to recover. It has been a seller's market in Snohomish County since May of 2012, except for one quarter of a balanced market in the beginning of 2014, when we saw a surge of new construction come to market due to the national builders releasing some neighborhoods they had acquired in the downturn.
Interestingly, the market shifts were brief because the downturn was so severe, which changed the market environment quickly. In order to clean up the predatory lending mistakes of 2004-2007, the market essentially had to come to a standstill and flush out all of the bad loans via foreclosure and short sales, which took five years. The only time we found ourselves in such an extreme buyer's market, was after one of the biggest economic fallouts of the last century. Once that corrected itself we quickly returned to a seller's market due to many positive factors.
Our available housing stock is affected by the limited land left to build on, a thriving job sector (especially in tech), historically low interest rates and the Greater Seattle area being a nice place to live. All four of these indicators have shrunk inventory and put upward pressure on prices. Sellers continue to enjoy great market returns, and buyers continue to fight to secure a home with a 4% interest rate, and not too far from their workplace. Additional inventory would be more than welcomed, it is very clear that we have the demand to absorb it. If you are curious about the value of your home in today's market or securing a purchase please contact one of our agents. We are always happy to help educate you on how this market can benefit your bottom line.
Strategy is Key in an Extreme Market
 The beginning of 2016 has been quite the ride so far in our local real estate market. It has been the most extreme seller's market we've ever seen. At the end of February, both King and Snohomish Counties ended the month with only one month of inventory based on pending sales. Pending numbers (the amount of homes going under contract) were up 35% in King County from the previous month and up 24% in Snohomish over the previous month. Demand is strong! How we manage that demand is critical. Every type of market calls upon different skills to achieve the best outcome for our clients. In this extreme seller's market the strategy one creates for their sellers to gain the best possible outcome is a fine-tuned, high-effort approach.
First, market research and price positioning not only takes studying the history of the market, but anticipating what is next, so no opportunities are missed. Second, properly bringing the home to market is still paramount. Even though there are less homes to choose from in this market, how a home "shows up" could make a difference of thousands of dollars in return for a seller. An investment in professional photography, staging and marketing only adds to the exposure, increasing interest from the buying public. Third, managing the demand – this is huge! This is where communication and being the calm in the storm is key. It is always our goal to harness control and bring calm during the intense initial market time. It is not our goal to take the first offer that comes our seller's way. Instead it is our goal to massage what the home has to offer over a set period of time in order to garner a great price for our Sellers, but also superior terms, such as waived contingencies. Fourth, it is our goal to end with a contract that has a great price, but also one that will make it to the closing table. There are obstacles in this accelerating market, such as passing appraisal, which we anticipate up front to insure a smooth journey through closing.
 By completing extensive market research, studying upcoming trends, highlighting a property's features with superior marketing, executing a strategy to manage the demand and negotiating the best terms for our sellers, we are creating above market-average results! In the first two months of 2016, the average cumulative days on market in King County was 40.5 days and Snohomish County was 50.5. My office averaged 23 days and 25 days respectively. In those same two months the list to sale price ratio in King County was 100.5% and 99.5% in Snohomish County. My office averaged 101.2% and 103.1% respectively. Saved market time and higher price acceleration is resulting in a better bottom line for our clients.
These results do not come without a refined, strategic approach. Understanding the nuances that each market brings equals results in the best interest of our clients. If you or any one you know is contemplating participating in this extreme seller's market please contact one of our agents. It would be our honor to have the opportunity to help create and navigate a successful strategy resulting in a win.
It’s an Amazing Time to be a Seller!
The two graphs here illustrate the amount of homes for sale and the amount of homes sold over the past two years in King and Snohomish Counties. This gives us a good look at the simple principle of supply and demand. 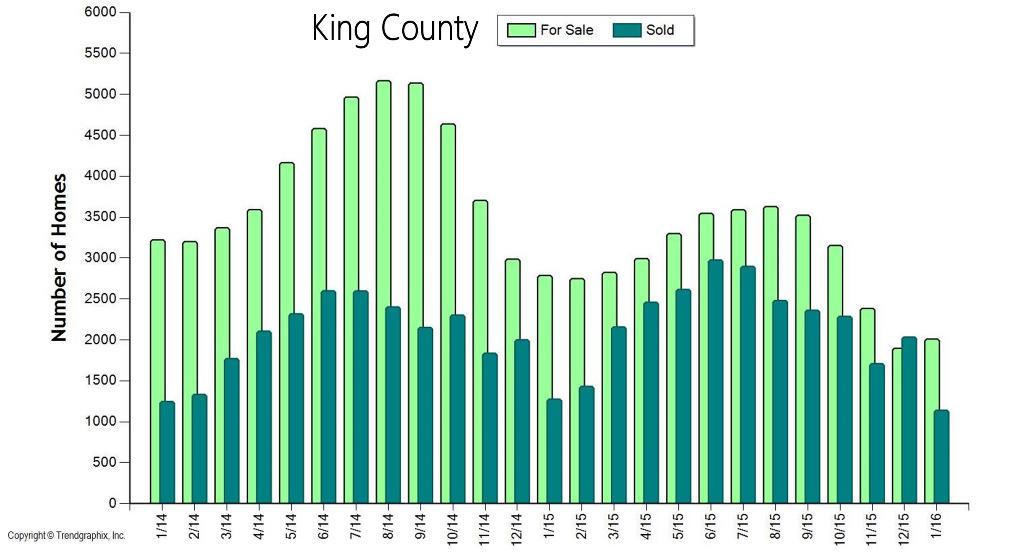 We are currently experiencing one of the strongest Seller's markets in recent history. A Seller's market is defined by having three or less months of available inventory. Currently, King County has 1.2 months of inventory based on pending sales and Snohomish County 1.3. Where this particular Seller's market is unique is that it is not only a shortage of inventory creating this environment, but very high buyer demand as well. Our local job market is thriving, so much so that many people from out-of-state are relocating here to be a part of our economy and the quality of life the Greater Seattle area has to offer. Couple the healthy local economy with still historically low interest rates and the audience for homes that come to the market is huge! Multiple offers are very common and prices are increasing.
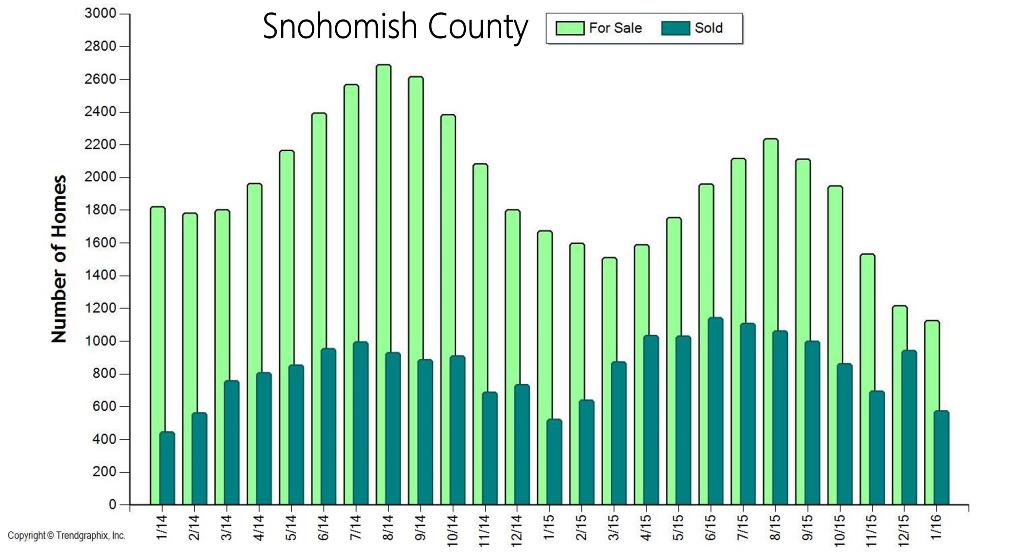 In order to get a better understanding of the market conditions we dug a little deeper and were quite surprised. We looked into the amount of new listings that came to market this January, assuming that there would be a huge deficit of new listings – we were wrong! In King County there were only 111 less listings (-4%) that came to market this January compared to last January, and only 16 less listings (-1%) in Snohomish County. Yes, fewer homes are coming to market, but the high buyer demand has eaten up any inventory carryover month-to-month, leaving us with 30% less homes to choose from compared to the year prior – hence the very low months of inventory. We are coming close to selling out of homes each month and new inventory is required to create more market. It is sort of mind blowing! The good news is, if you look at the graphs above you will see a seasonal uptick in inventory in the Spring and Summer months, and that is needed to meet demand. If you are considering putting your home on the market this year I would advise the sooner the better, as buyers did not hibernate for the winter and will not be worried about flowers blooming in your front yard. Sellers that beat the Spring increase in listings will enjoy a larger audience due to less competition. If you’re a buyer, it is overwhelmingly important that you are aligned with an agent that knows how to win in this market. Terms, negotiations, communication and market knowledge is what sets a highly capable selling agent apart and is required to prevail.
If you have any curiosities or questions regarding the value of your current home or purchase opportunities, please contact any of our agents. It is always our goal to help keep you informed on all things real estate, and help you manage these investments.
Looking Towards the 2016 Real Estate Market
 As we round out a very strong 2015 in the real estate market, it is time to look towards 2016 and what it may bring. After two straight years of inventory challenges, multiple offer madness and steep price appreciation, will things start to temper? Below is a list of my predictions for what 2016 might hold for the real estate market. These are fun, educated guesses based on studying the market and paying attention to important indicators. I hope you enjoy and I welcome your questions or discussions.
1. Interest Rates: They have been saying for a few years now that interest rates are going to go up, and they really haven't. Since 2012 they have ebbed as low as 3.375% and as high as 4.25%, and are currently leveled out at 4% on a 30-year fixed conventional loan. By the end of 2016, I predict that they will be just under 5%. As the economy continues to improve and consumer confidence grows, an increase in rates will be important for the health of our overall economy and the public should be able to handle this rise. Plus, we must not lose sight that the average interest rate over the last 30 years has been 6.959% and we are still WAY below that.
2. Listing Inventory: Inventory has been the biggest challenge this year, with King County hovering between one and two months of inventory and Snohomish Country hovering between two and three months of inventory in 2015. That is LOW!! There are two reasons it has been that way; we have had 21% less homes come to market in King County year-over-year, and 15% less in Snohomish County. There have also been more buyers in the market, causing demand to heavily outweigh supply. In 2016 I think we will see more homes come to market, due to the fact that as prices have appreciated, homeowners have gained much more favorable equity positions, giving them options to make the moves they've been dreaming of and waiting for. Folks are ready to upgrade their lifestyle, whether that means buying a bigger home or transitioning to a "right" size home due to retirement. Pent up seller demand due to these equity and lifestyle factors will lead to an increase in homes coming to market.
3. Buyer Demand: Buyer demand will remain strong! This is largely related to our booming job market and the expanding tech sector. Our unemployment rate is 4%, meaning jobs are more abundant than they have been in years, and wages are growing in every county. Couple this with low interest rates, and it equals a more-than-plentiful pool of buyers. One factor to look out for as we head into 2016, is if the strong buyer demand we have will quickly absorb any increase in inventory, keeping months of inventory basically the same as 2015. This will be a fun one to watch.
4. Prices: We will indeed continue to see price appreciation due to the factors above. Year-to-date, median price appreciation in King County is up 8% complete year-over-year and up 9% in Snohomish County. A year from now I anticipate price appreciation to slow to 6% in King and 5% in Snohomish, due to a bit more inventory, and meet peak levels. This is still higher than the normal 3-4% year-over-year appreciation, but it is below the double-digit appreciation we saw in 2013 and 2014, thank goodness! As we have dug out of the Great Recession's hole and regained equity levels after the fall of the sub-prime mortgage fiasco it is important to retreat back to more sustainable appreciation levels.
5. First-Time Home Buyers: The big talk of 2015 was the Millennial generation, and when they would jump into the housing market. They have started to make their play as they are getting some of those great tech sector jobs, but many are limited in purchasing due to high student loan debt. We are starting to see FICO scores loosen up a bit for this reason. Interestingly enough, the average FICO score for a denied borrower for a conventional loan was 700, and 754 for an approved borrower. Average FICO score for a FHA borrower who was denied was 635, and 687 for an approved borrower. These are important factors to pay attention to along with debt-to-income ratios. Also important to note is that rents are extremely high in the Greater Seattle area, so the cost of owning over the long term is more favorable. Once the Millennials decide that they are ready to settle down, what they are willing to have their commute look like and pay down some of that debt they will be ready to start building household wealth by buying vs. renting.
If you or anyone you know has any questions about real estate, please don't hesitate to contact any one of our agents. We are here to help!
How Much is Your Home Worth?
A Look at Local Home Value Growth Since 2012
Since 2012, home values have grown by around 10% each year, resulting in substantial return in pricing. Below are some examples of actual homes sold in 2012 and again in 2015 that were not remodeled or significantly improved in between sales. These examples show the return in home values that we have experienced since the economic downturn. We pulled these examples to show you actual pound-for-pound market data versus the statistical percentages often quoted in market updates. We think these examples are pretty telling and quite exciting!
As you can see in the current economic update from Matthew Gardner, inventory has been a challenge. Many folks have been waiting for their current home values to return in order to make big moves involving their retirement, upgrading homes, investing or even buying a second home. If you are one of those people, we hope these examples provide you insight on the increase in home values and how they might pertain to you. As we head into the New Year, if you'd like a Comparable Market Analysis (CMA) on your home so you have a better understanding of your home's value, any one of our agents would be happy to do that. This would be an important component in charting your 2016 financial goals, and what a great time of year to gather that information.
3 bedroom 3200 sq ft Edmonds home: |
|
 |
 |
Sold in August 2012
|
Sold in July 2015
|
$185,050 INCREASE IN HOME VALUE: 32%! |
|
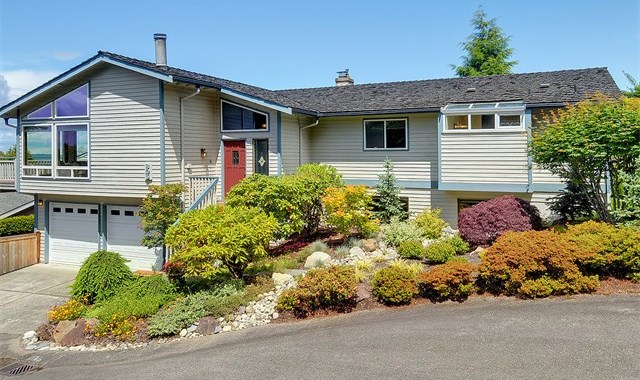
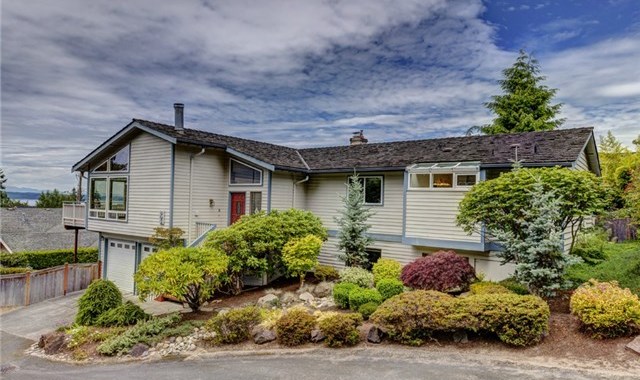
4 bedroom 2100 sq ft Bothell home: |
|
 |
 |
Sold in February 2012
|
Sold in February 2015
|
$114,872 INCREASE IN HOME VALUE: 36%! |
|
3 bedroom 1400 sq ft Shoreline home: |
|
 |
 |
Sold in June 2012
|
Sold in March 2015
|
$102,250 INCREASE IN HOME VALUE: 33%! |
|
3 bedroom 1800 sq ft Lynnwood home: |
|
 |
 |
Sold in December 2011
|
Sold in May 2015
|
$95,000 INCREASE IN HOME VALUE: 43%! |
|
We are currently working on more examples in surrounding communities… check out our Price Appreciation Study for more. And contact any one of our agents for a Comparable Market Analysis on your home.
Housing Demand Defined
 What defines a housing market? We have had many different markets over the years that have been defined by certain identifiable factors. Will the last person leaving Seattle- turn out the lights, do you remember that billboard from 1971? Or the global housing boom of 2005-2007 that was driven by sub-prime credit lending options (which no longer exist, thank goodness!). Our current market is defined by strong demand and low inventory – the basic economic principle of supply and demand – Economics 101! A market with 0-3 months of inventory is a seller's market, 4-6 a balanced market and 6+ months a buyer's market. The route of the 2007-2011 economic down-turn, where months of available inventory favored buyers and was as high as 13 months, seems like ancient history. Since the Summer of 2012, months of inventory has favored sellers in both King and Snohomish counties, with an average of two months of available inventory between the two counties over the last three years. There is a market divergence going on between King and Snohomish County due to some unique factors each county possesses.
First, King County's lack of inventory has been drastic. Year-to-date, it has hovered at one month of available inventory, which means that each month we are nearly selling out of homes! This is due to the fact that demand is high and inventory is down. In the last 12 months, Seattle has had 27% less homes for sale than the previous 12 months, and closed sales are up 6%. In fact, Auction.com just named Seattle the number one housing market in the nation. This is due to the city's large technology sector driving employment, low interest rates and an increase in household formation. The housing premium in Seattle is rooted in shorter commute times to job centers, high walk scores and hip urban centers. The premium is real though, with the median home price over the last 12 months in Seattle reaching $528,000 – up 13% from the previous 12 months.
In Snohomish County inventory is still tight, with an average of two months of available inventory this year. Inventory has been somewhat supported by new construction and improved equity levels for re-sale properties. The median home price over the last 12 months was $347,000 – 34% less than Seattle. Median price growth is up 9% complete year-over-year.
What should we expect going forward into 2016? In both counties there was an increase in inventory in the third quarter. This is a promising indicator that folks are feeling more comfortable coming to market due to price increases after a booming spring market and healthier overall economic environment. Where this market is different from the bubbly market of 2007 are the drivers of the strong local economy, low interest rates and job growth, versus the unsustainable lending standards of the sub-prime loan movement. I believe we will see more homes come to market, especially as we head into the spring 2016 market. Folks are ready to move on to what is next for them, and recouped prices are enabling those choices. This increase will be welcomed as it will provide more options for buyers and will start to temper price growth, which is a good thing.
Where this market has gotten a bit tricky, is where one goes once their home sells. The low inventory has made this challenging, but with any market challenge you find creative and strategic ways to maneuver through and find success for your clients. Windermere has a great Bridge Loan product to utilize, temporary moves have solved these transitions, and longer closings with seller rent-backs have also been widely used to help make seamless transitions. This an exciting market to participate in, and creative strategy is the name of the game. Please contact one of our agents if you would like to know more about the current market conditions and how they relate to your bottom line and lifestyle decisions.
Market Update – Q3 2015
Snohomish County
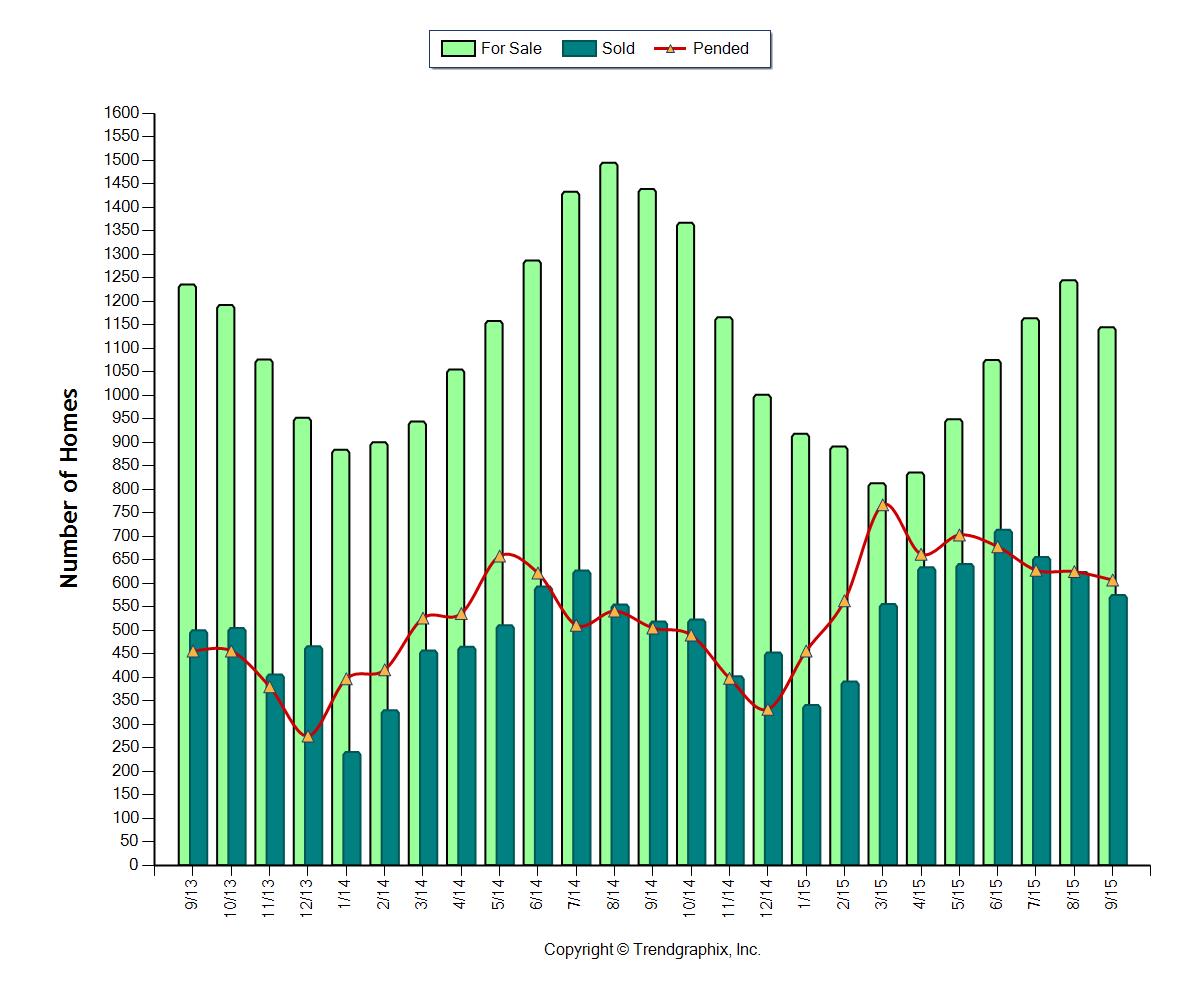
Seasonal patterns are returning after the market’s fall and recovery
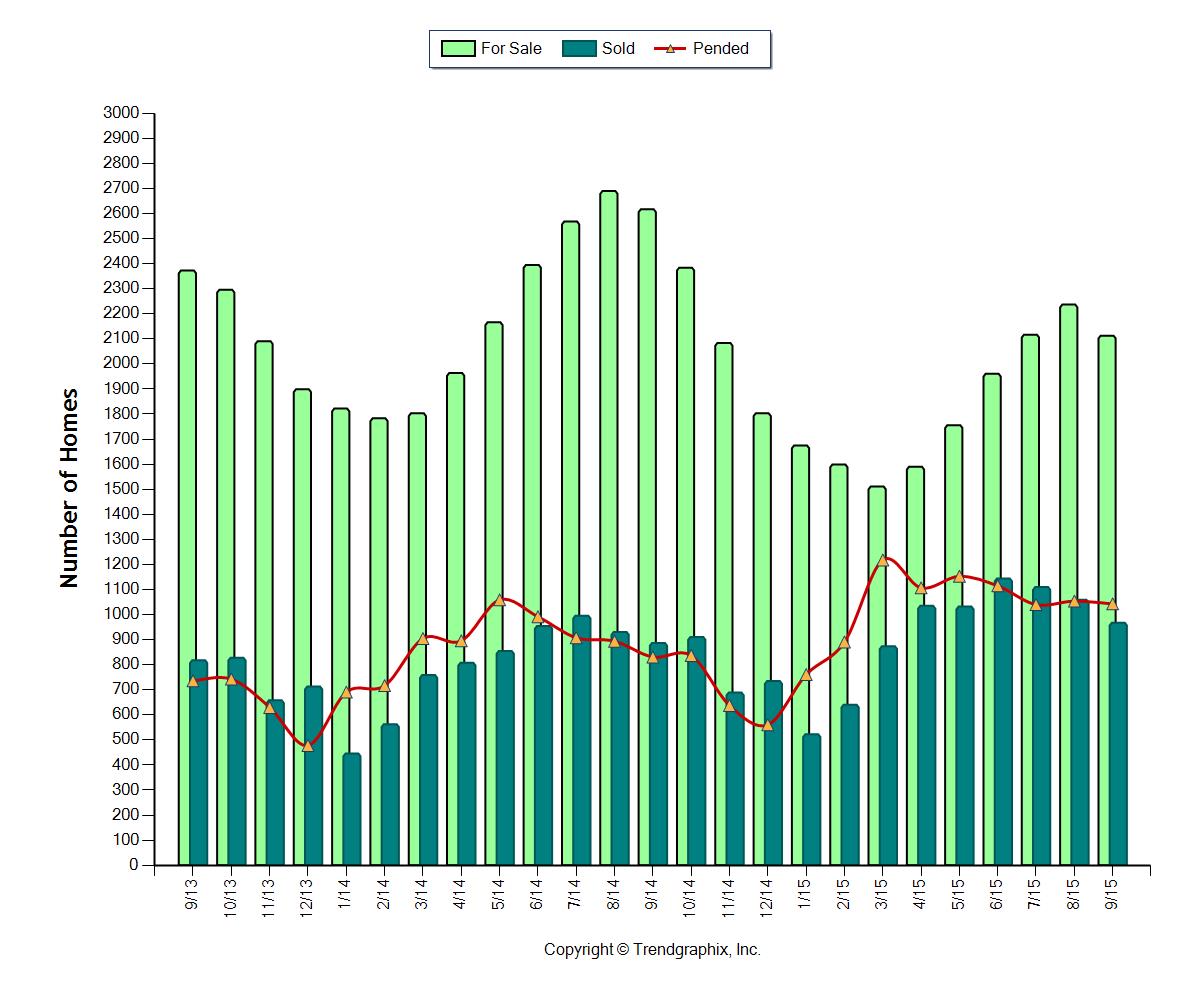
The graph above shows a two-year history of the market, where we have clearly seen a surge of inventory from March to August. In fact we saw a 48% increase in inventory during this time period. While that is a welcome increase, inventory growth was down 1% from the year prior, all while closed sales were up 18%! Months of Inventory based on pending sales has held steady at an average of two months over the last year. Due to demand outweighing supply we continue to see above-normal price growth, with both median and average prices up 9% complete year-over-year.
South Snohomish County
Seasonal patterns are returning after the market’s fall and recovery
You can see in the graph above a clear surge of inventory came to market from March to August. In fact we saw a 53% increase in inventory during this time period. While that is a welcome increase, inventory growth was down 5% from the year prior, all while closed sales were up 19%! Months of Inventory based on pending sales has held steady at an average of two months over the last year. Due to demand outweighing supply we continue to see above-normal price growth, with both median and average prices up 9% complete year-over-year.
North King County
Price increases are strong due to high demand and low inventory
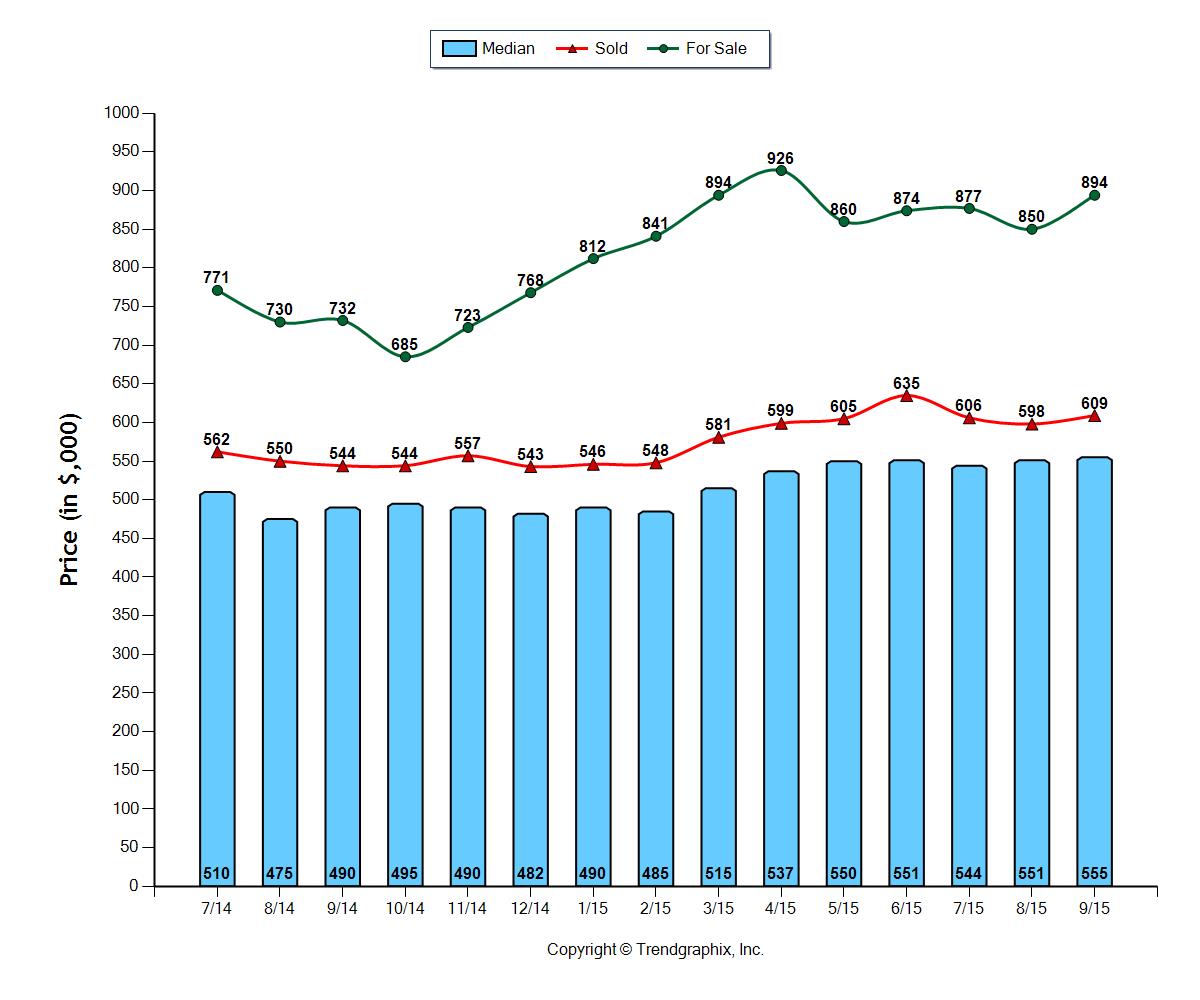
All indicators, such as sold median price, sold average price and sold price per square foot point to a 10% increase in prices complete year-over-year. The median price in North King County this September was $555,000 and the average was $609,000. Average days on market have shrunk to as low as 22 days this last month, and the list to sale price ratio was 101%. Lack of supply and high demand is the gas in this market’s engine. Months of inventory based on pending sales finally crested one month after a small surge of additional inventory in the third quarter.
Eastside
Seasonal patterns are returning after the market’s fall and recovery
The graph above shows a two-year history of the market, where we have clearly seen a surge of inventory from February to August. In fact we saw a 44% increase in inventory during this time period. While that is a welcome increase, inventory growth was down 45% from the year prior, all while closed sales were up 10%! Months of Inventory based on pending sales has held steady at an average of 1.5 months over the last year. Due to demand outweighing supply we continue to see above normal price growth, with both median and average prices up 9% complete year-over-year.
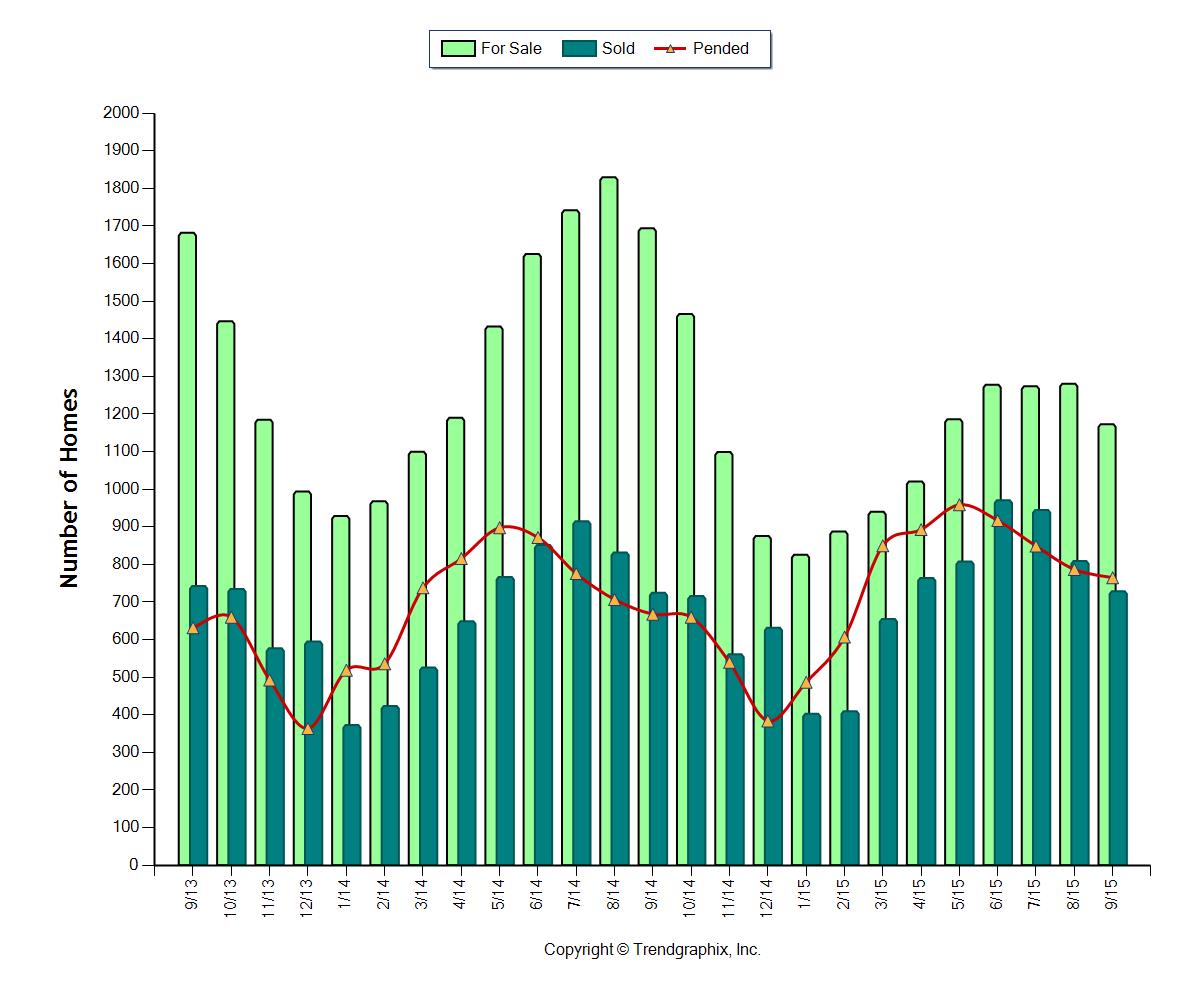
Seattle Metro
Price increases are strong due to high demand and low inventory
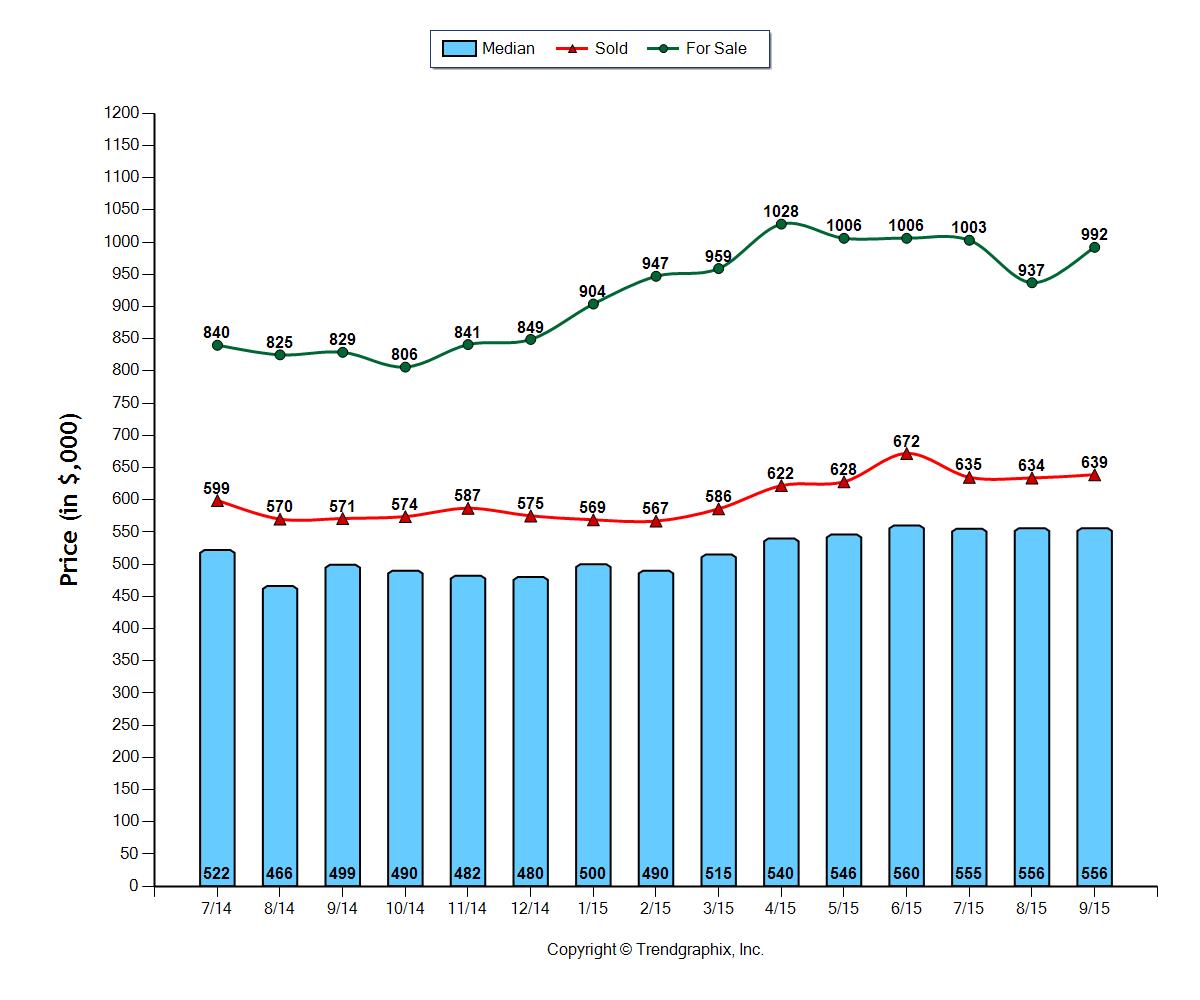
All indicators, such as sold median price, sold average price and sold price per square foot point to an 11% increase in prices complete year-over-year. The median price in the Seattle Metro area this September was $556,000 and the average was $639,000. Average days on market have shrunk to as low as 22 days this last month, and the list to sale price ratio was 101%. Lack of supply and high demand is the gas in this market’s engine. Months of inventory based on pending sales finally crested one month after a small surge of additional inventory in the third quarter.
South King County
Price increases are strong due to high demand and low inventory

All indicators point to strong price increases with median price up 11%, average price up 8% and average price per square foot up 8% complete year-over-year. The median price in South King County this September was $335,000 and the average was $358,000. Average days on market have shrunk to as low as 36 days this last month, and the list to sale price ratio was 99%. Lack of supply and high demand is the gas in this market’s engine. Months of inventory based on pending sales finally crested 1.5 months after a small surge of additional inventory in the third quarter.
This is only snapshots of the trends in our area. Please contact one of our agents if you would like further explanation of how the latest trends relate to you.
