Facebook
 X
X
 Pinterest
 Copy Link
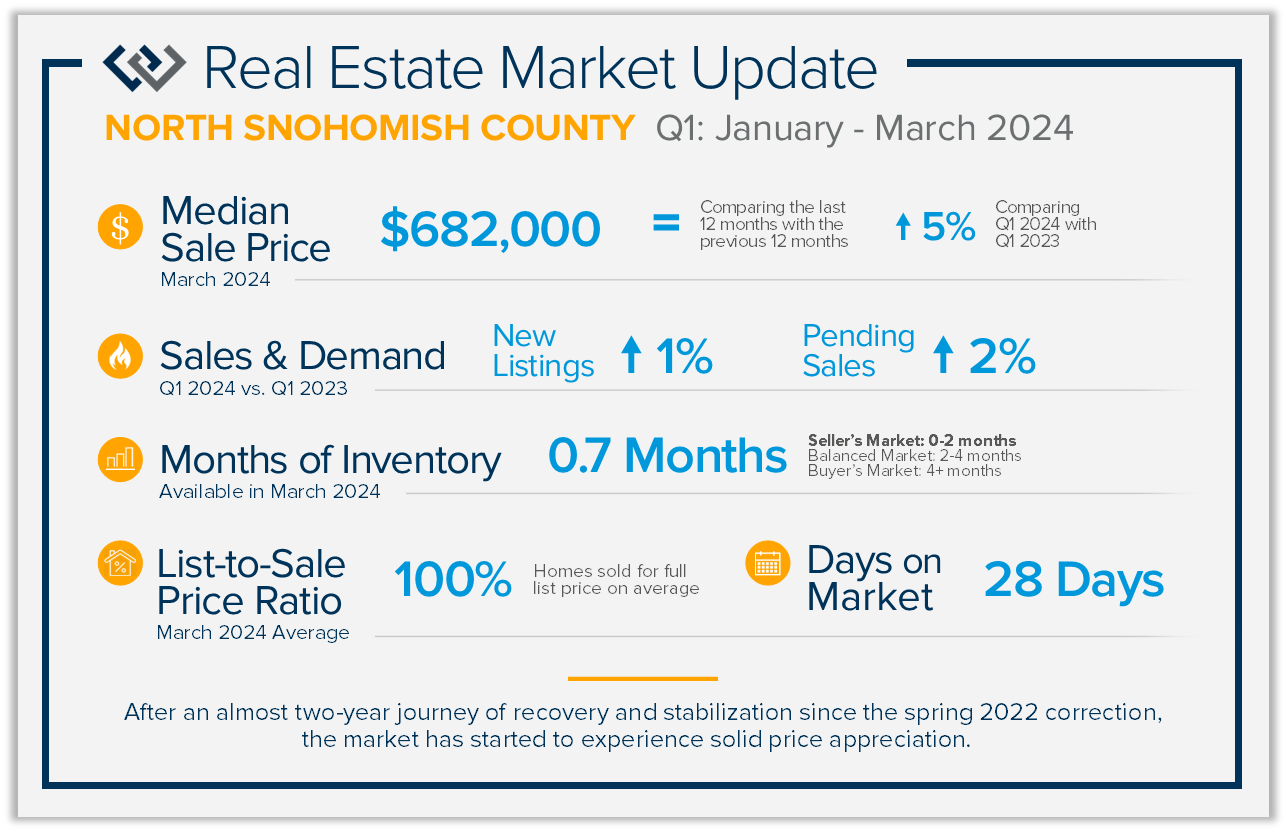
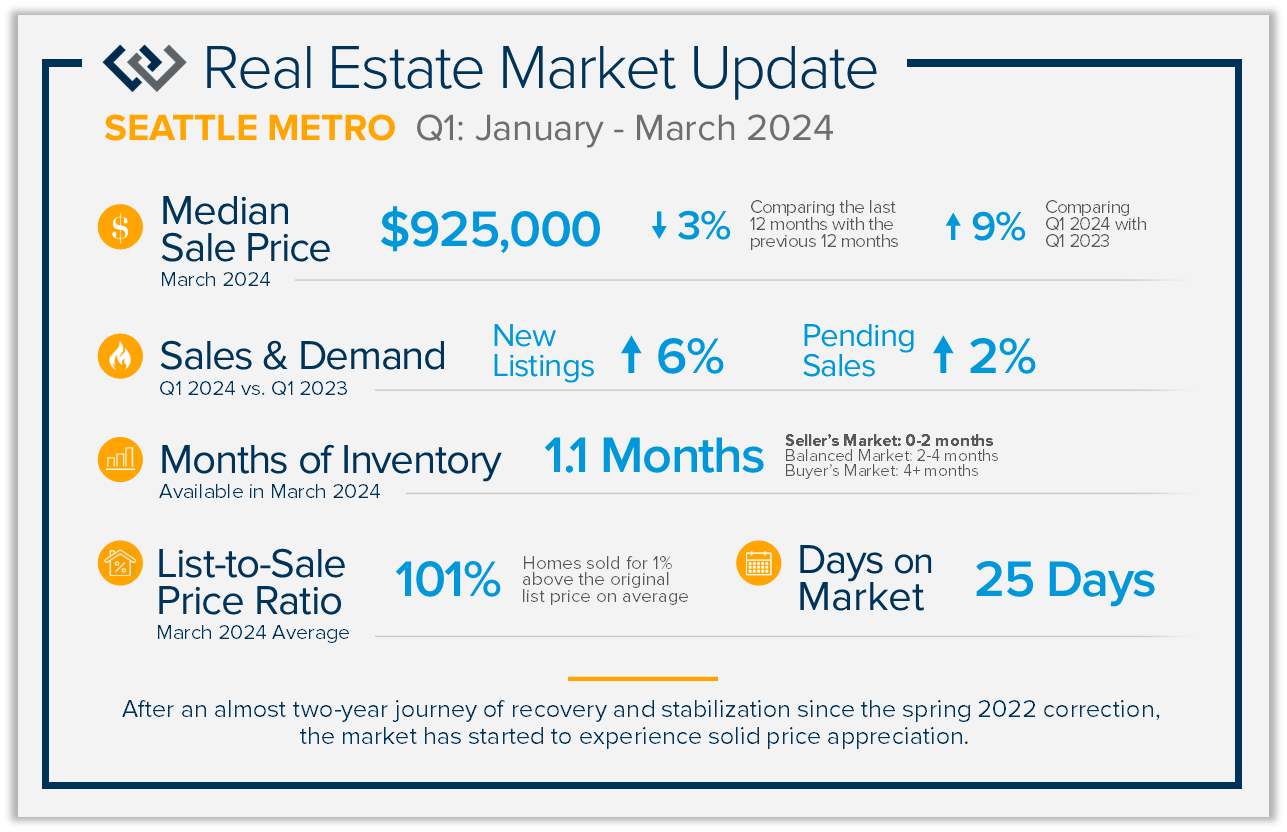
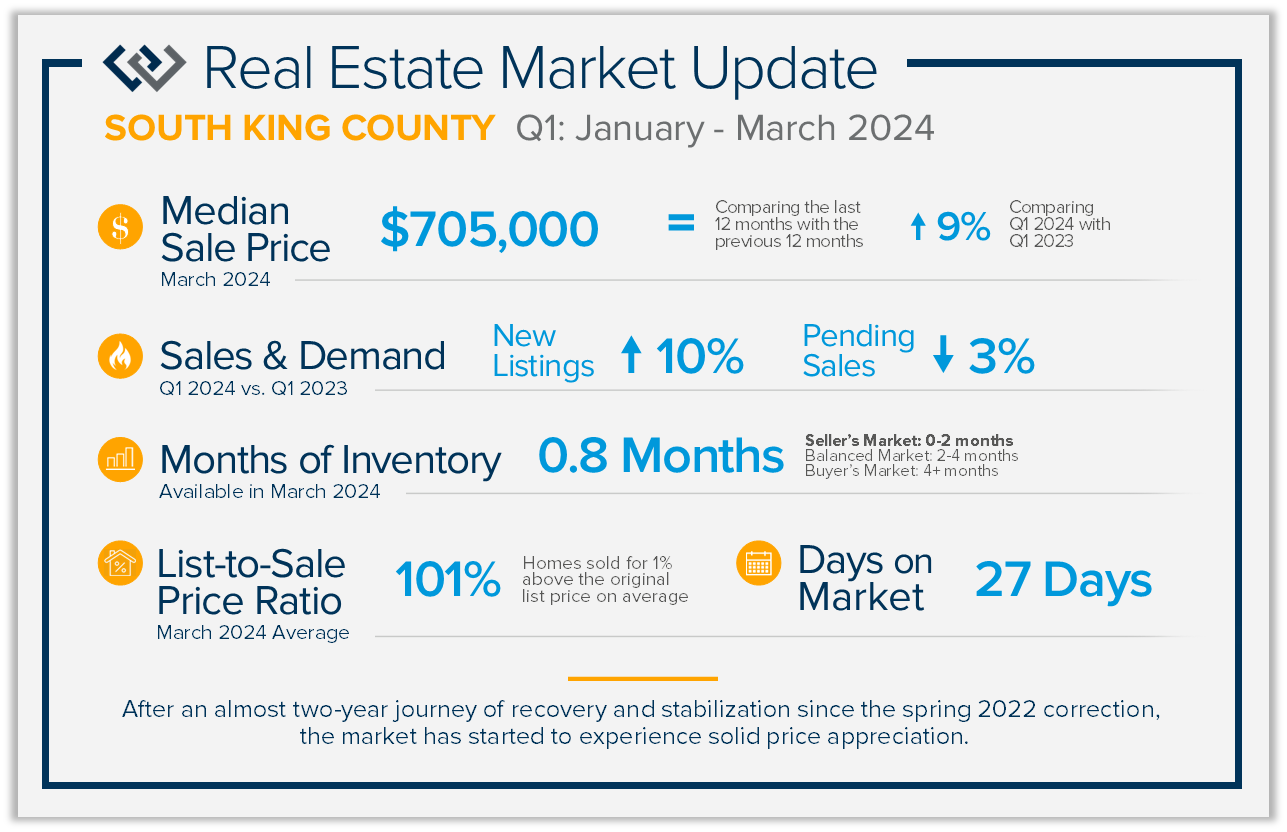
QUARTERLY REPORTS Q1 2024

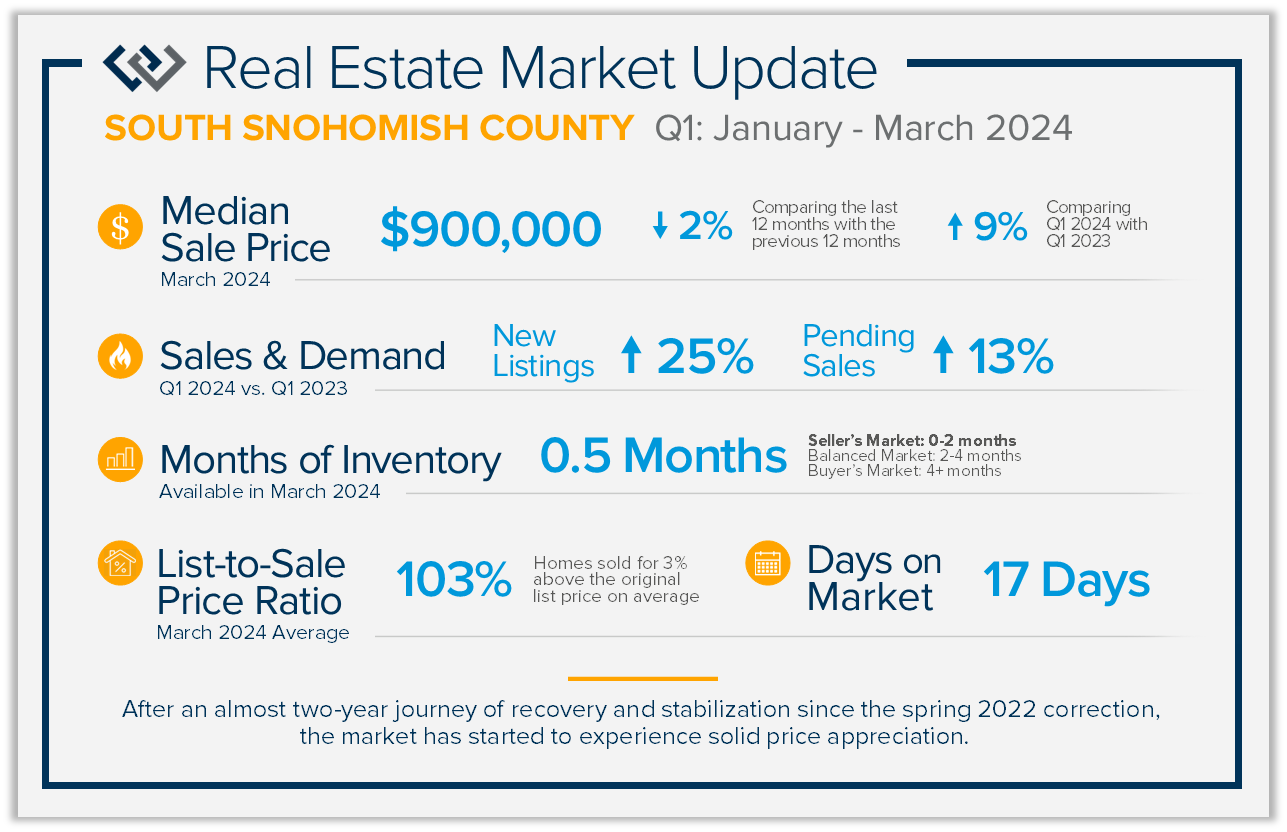
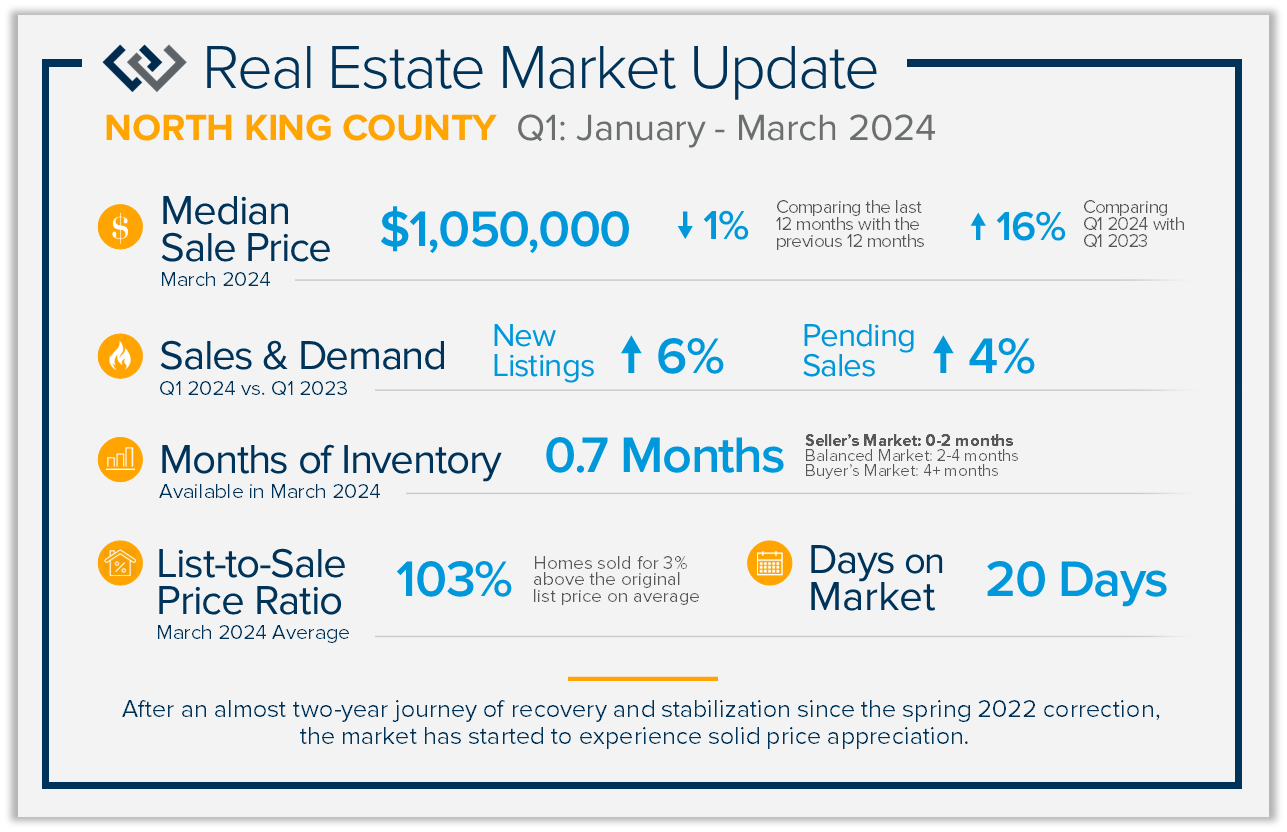
After an almost two-year journey of recovery and stabilization since the spring 2022 correction, the market has started to experience solid price appreciation. The median price in Q1 2024 vs. Q1 2023 shows that despite interest rates remaining stubborn, buyer demand is returning to the market. Improved consumer confidence and acclimation to lending costs have caused price growth, especially amongst tight inventory levels.
New listings are slowly increasing over 2023 as pent-up seller demand meets the market. Equity levels across our region are strong, providing favorable returns for home sellers. Many experts predict interest rates to gradually fall in 2024, estimating they will reach the mid to lower 6% range later this year. While the cost of lending still has some buyers sidelined, many are forging ahead now.
Life changes often determine a move. It is our goal to help empower strong decisions by assessing our client’s lifestyle and financial goals amidst real-time market trends and conditions. Whether you have considered selling, buying, or both, or you’re just curious about the market, please reach out.

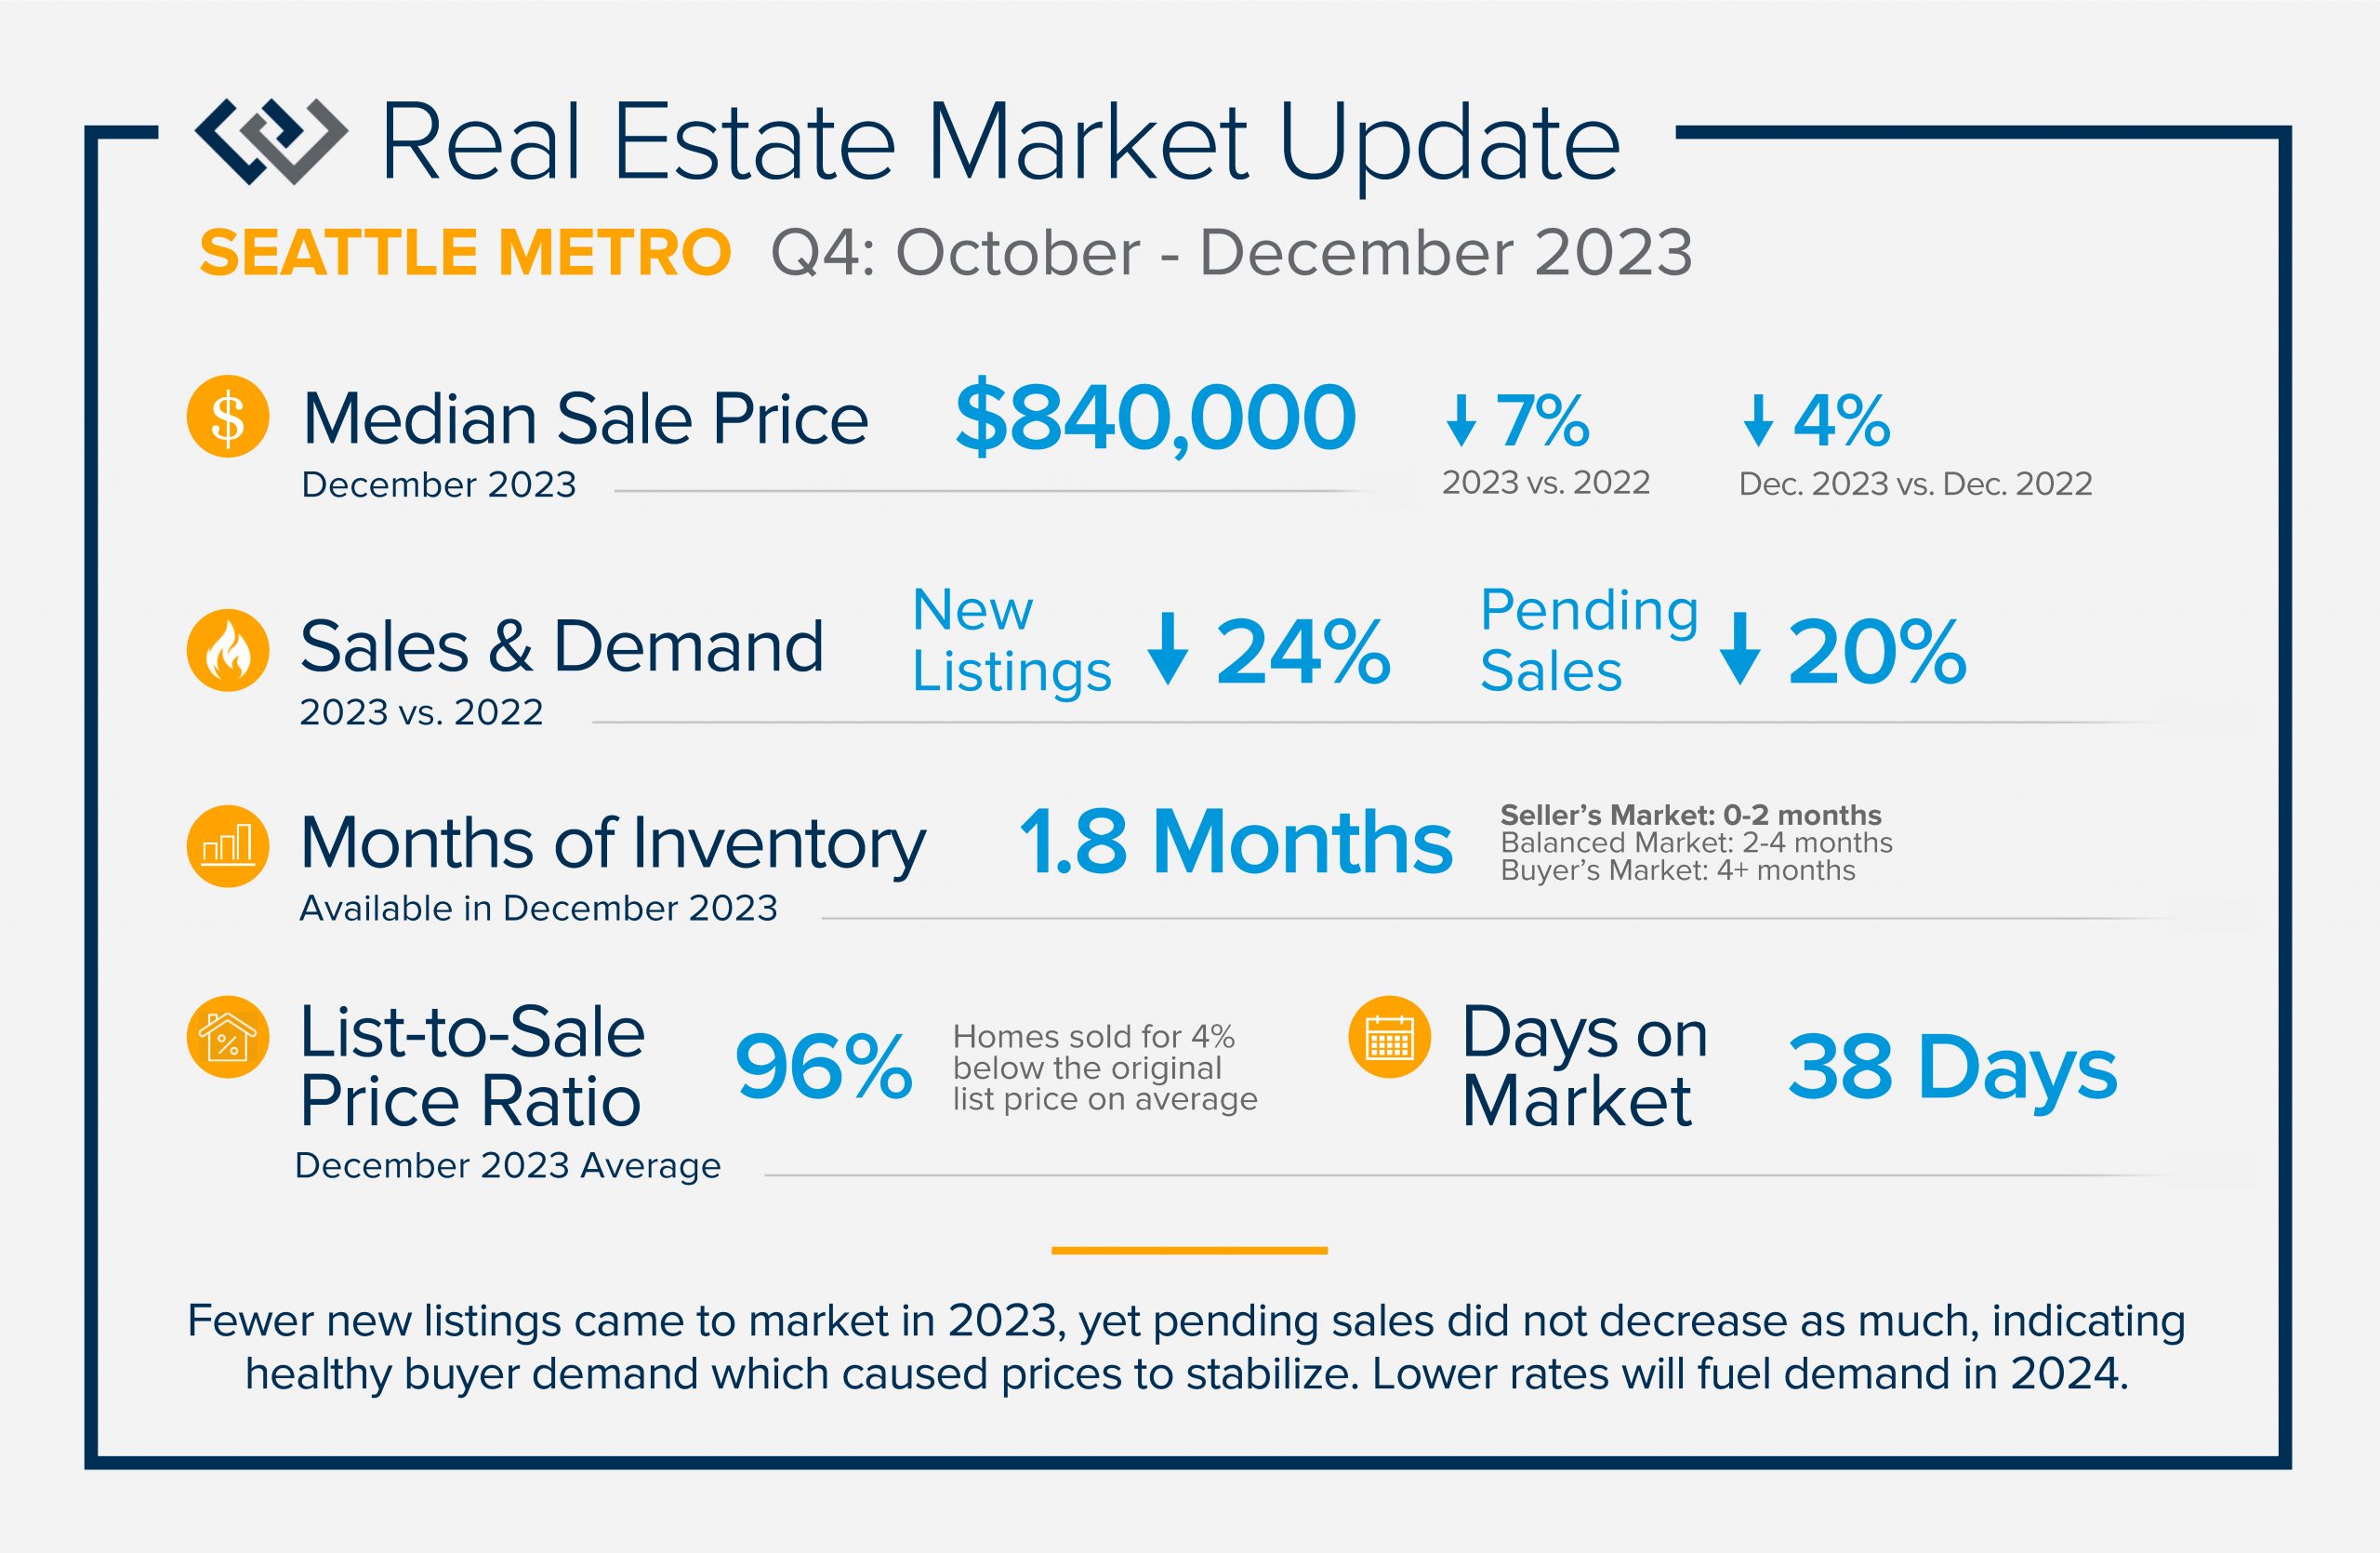
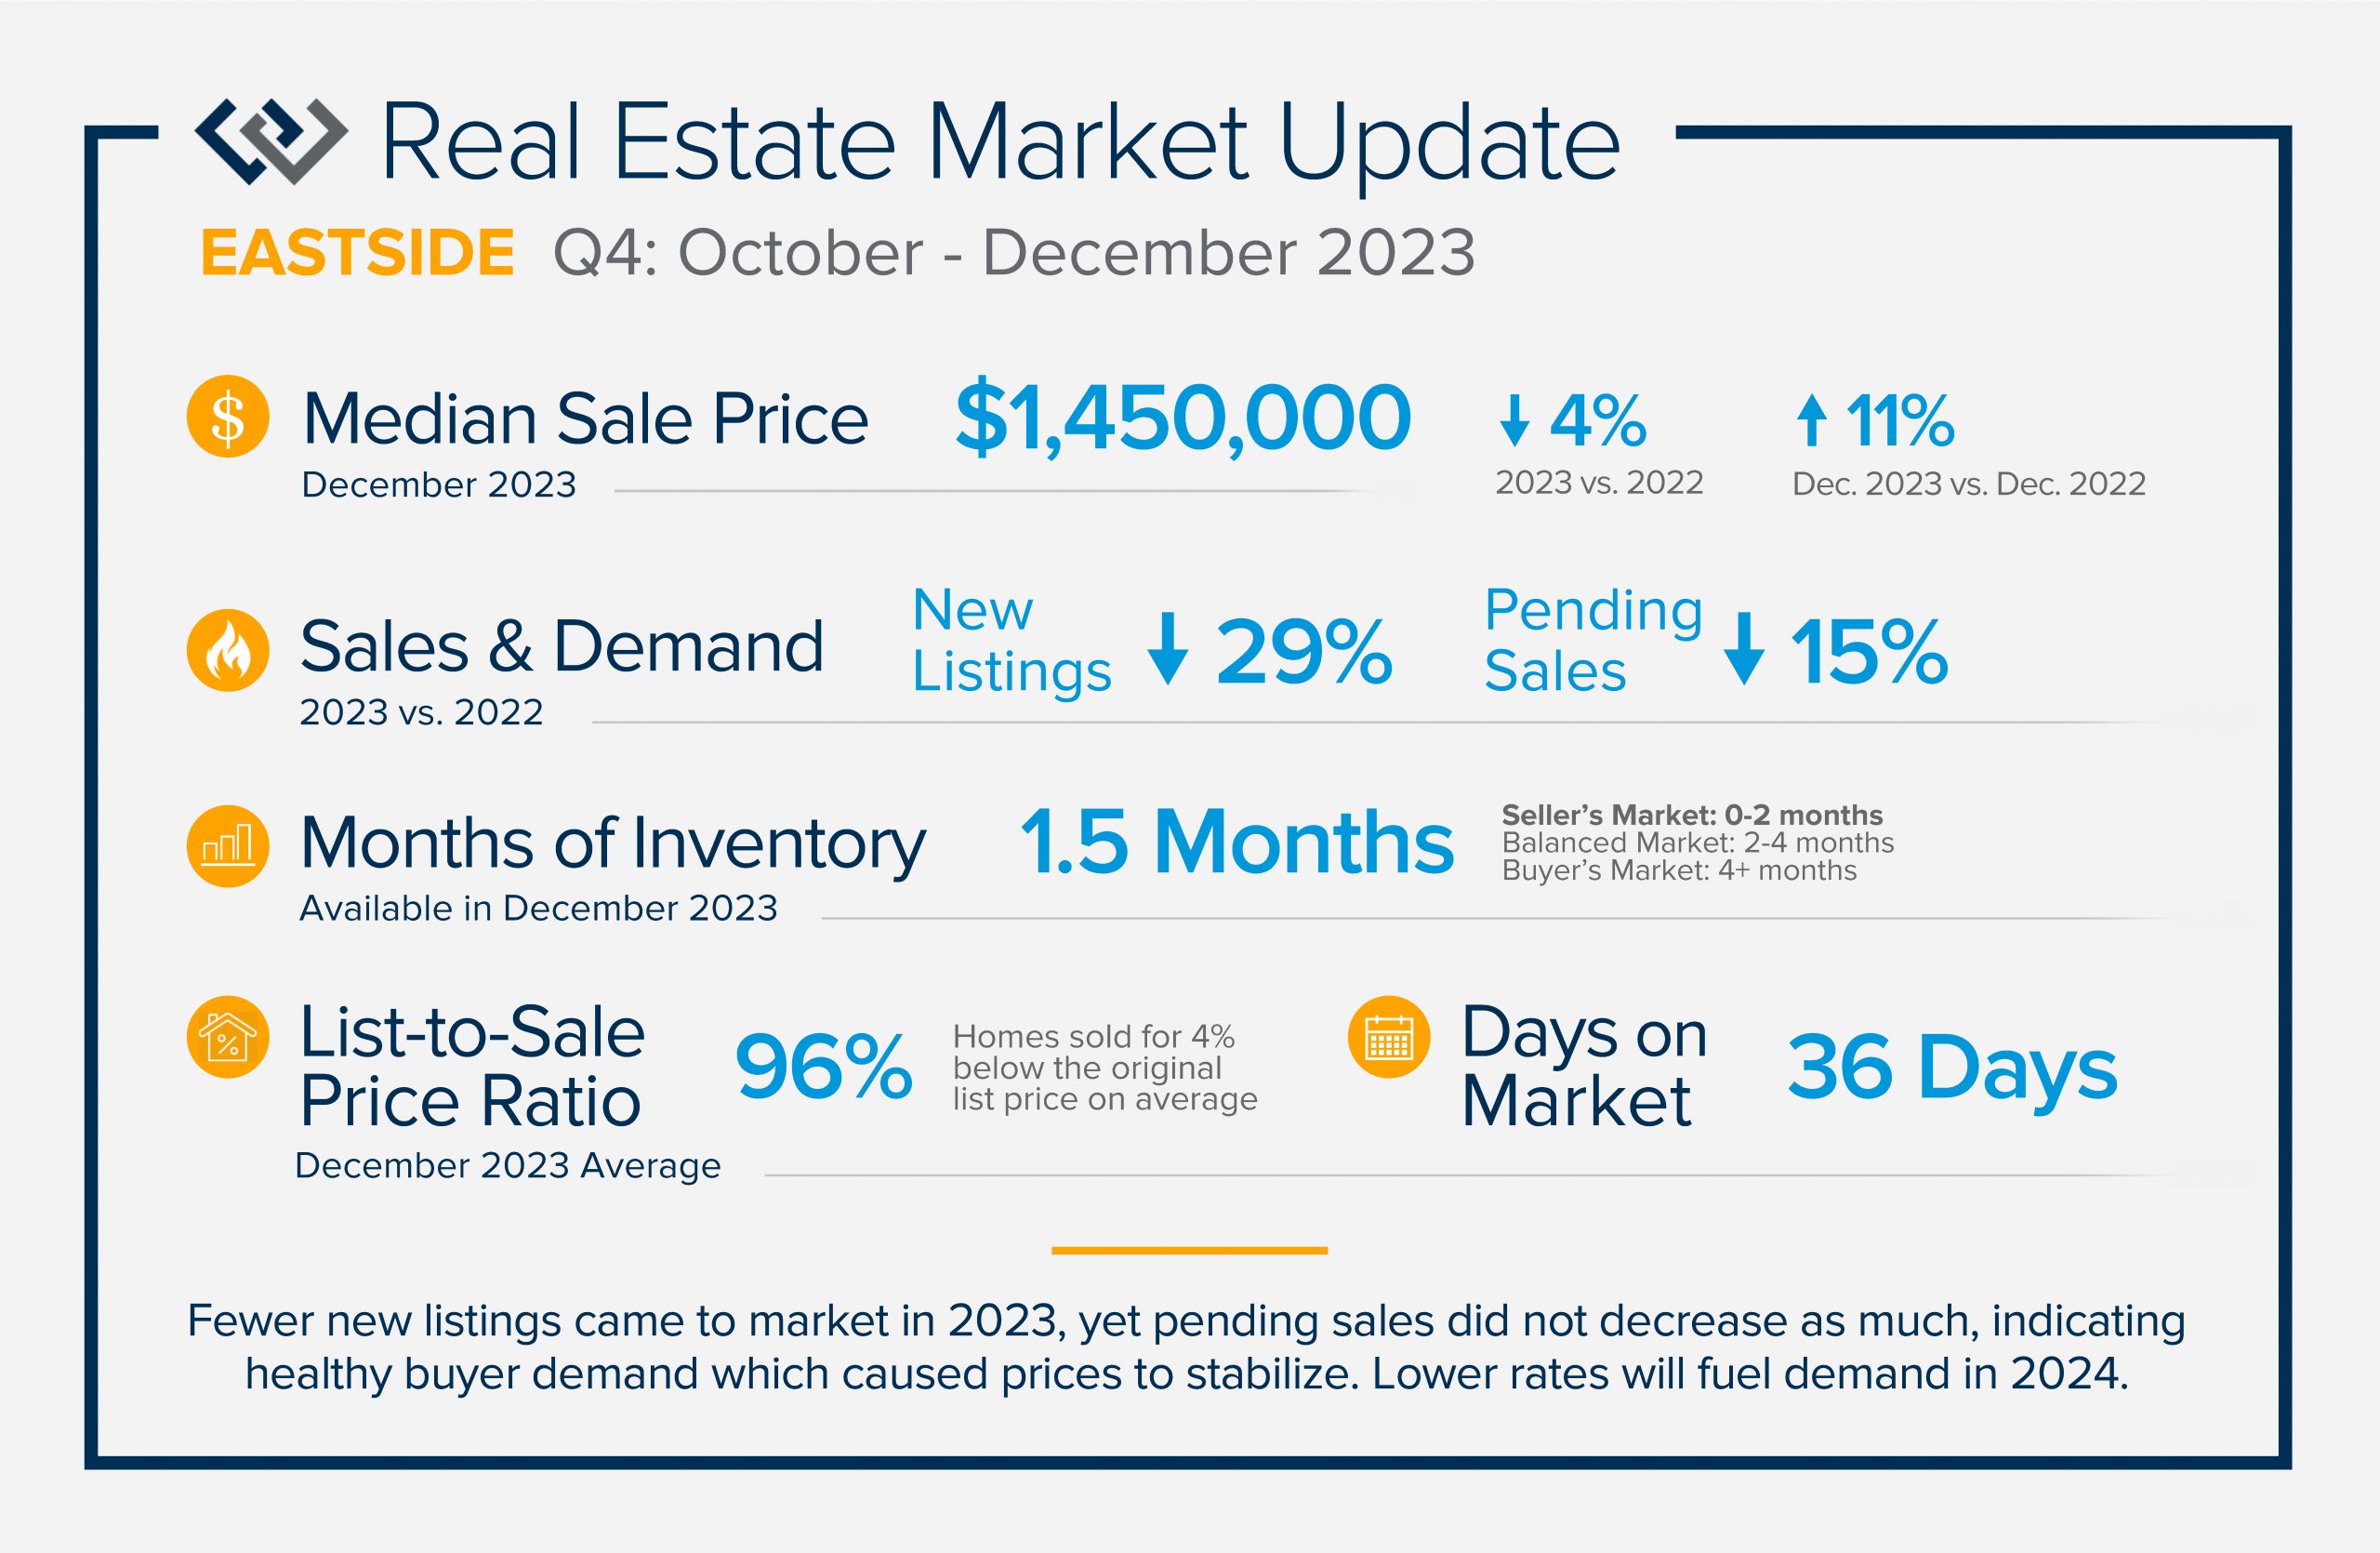
QUARTERLY REPORTS Q4 2023

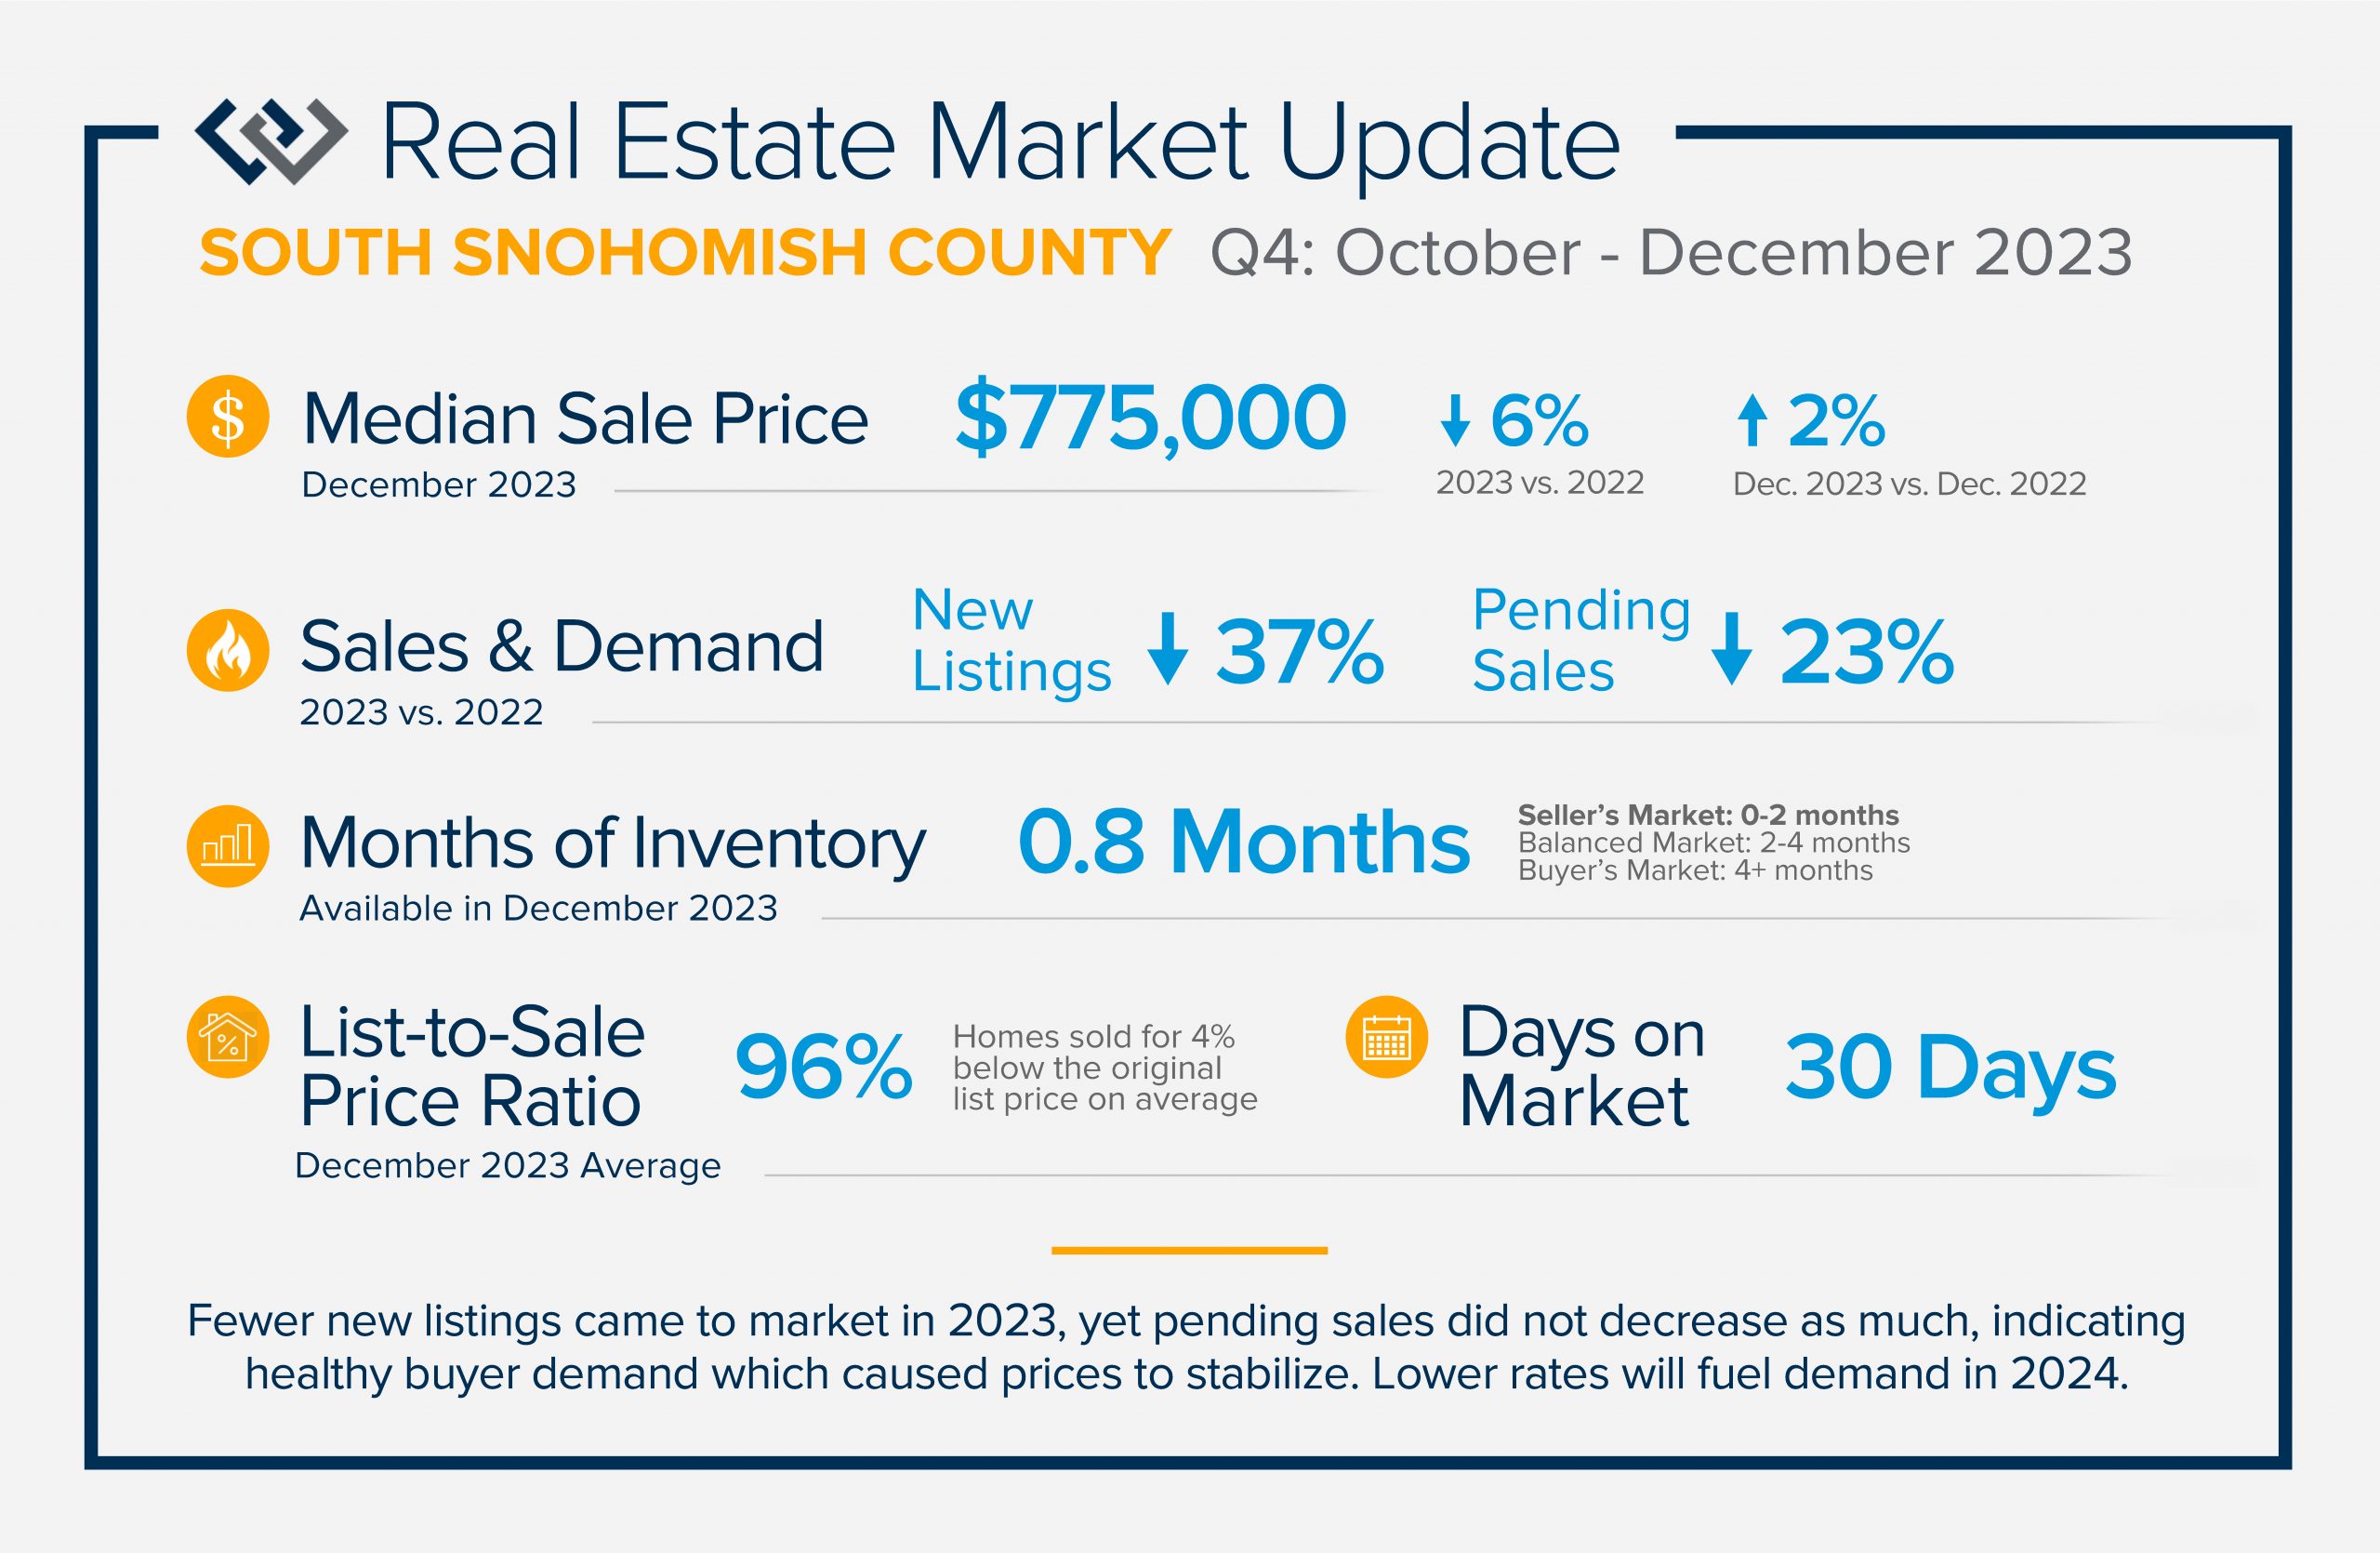

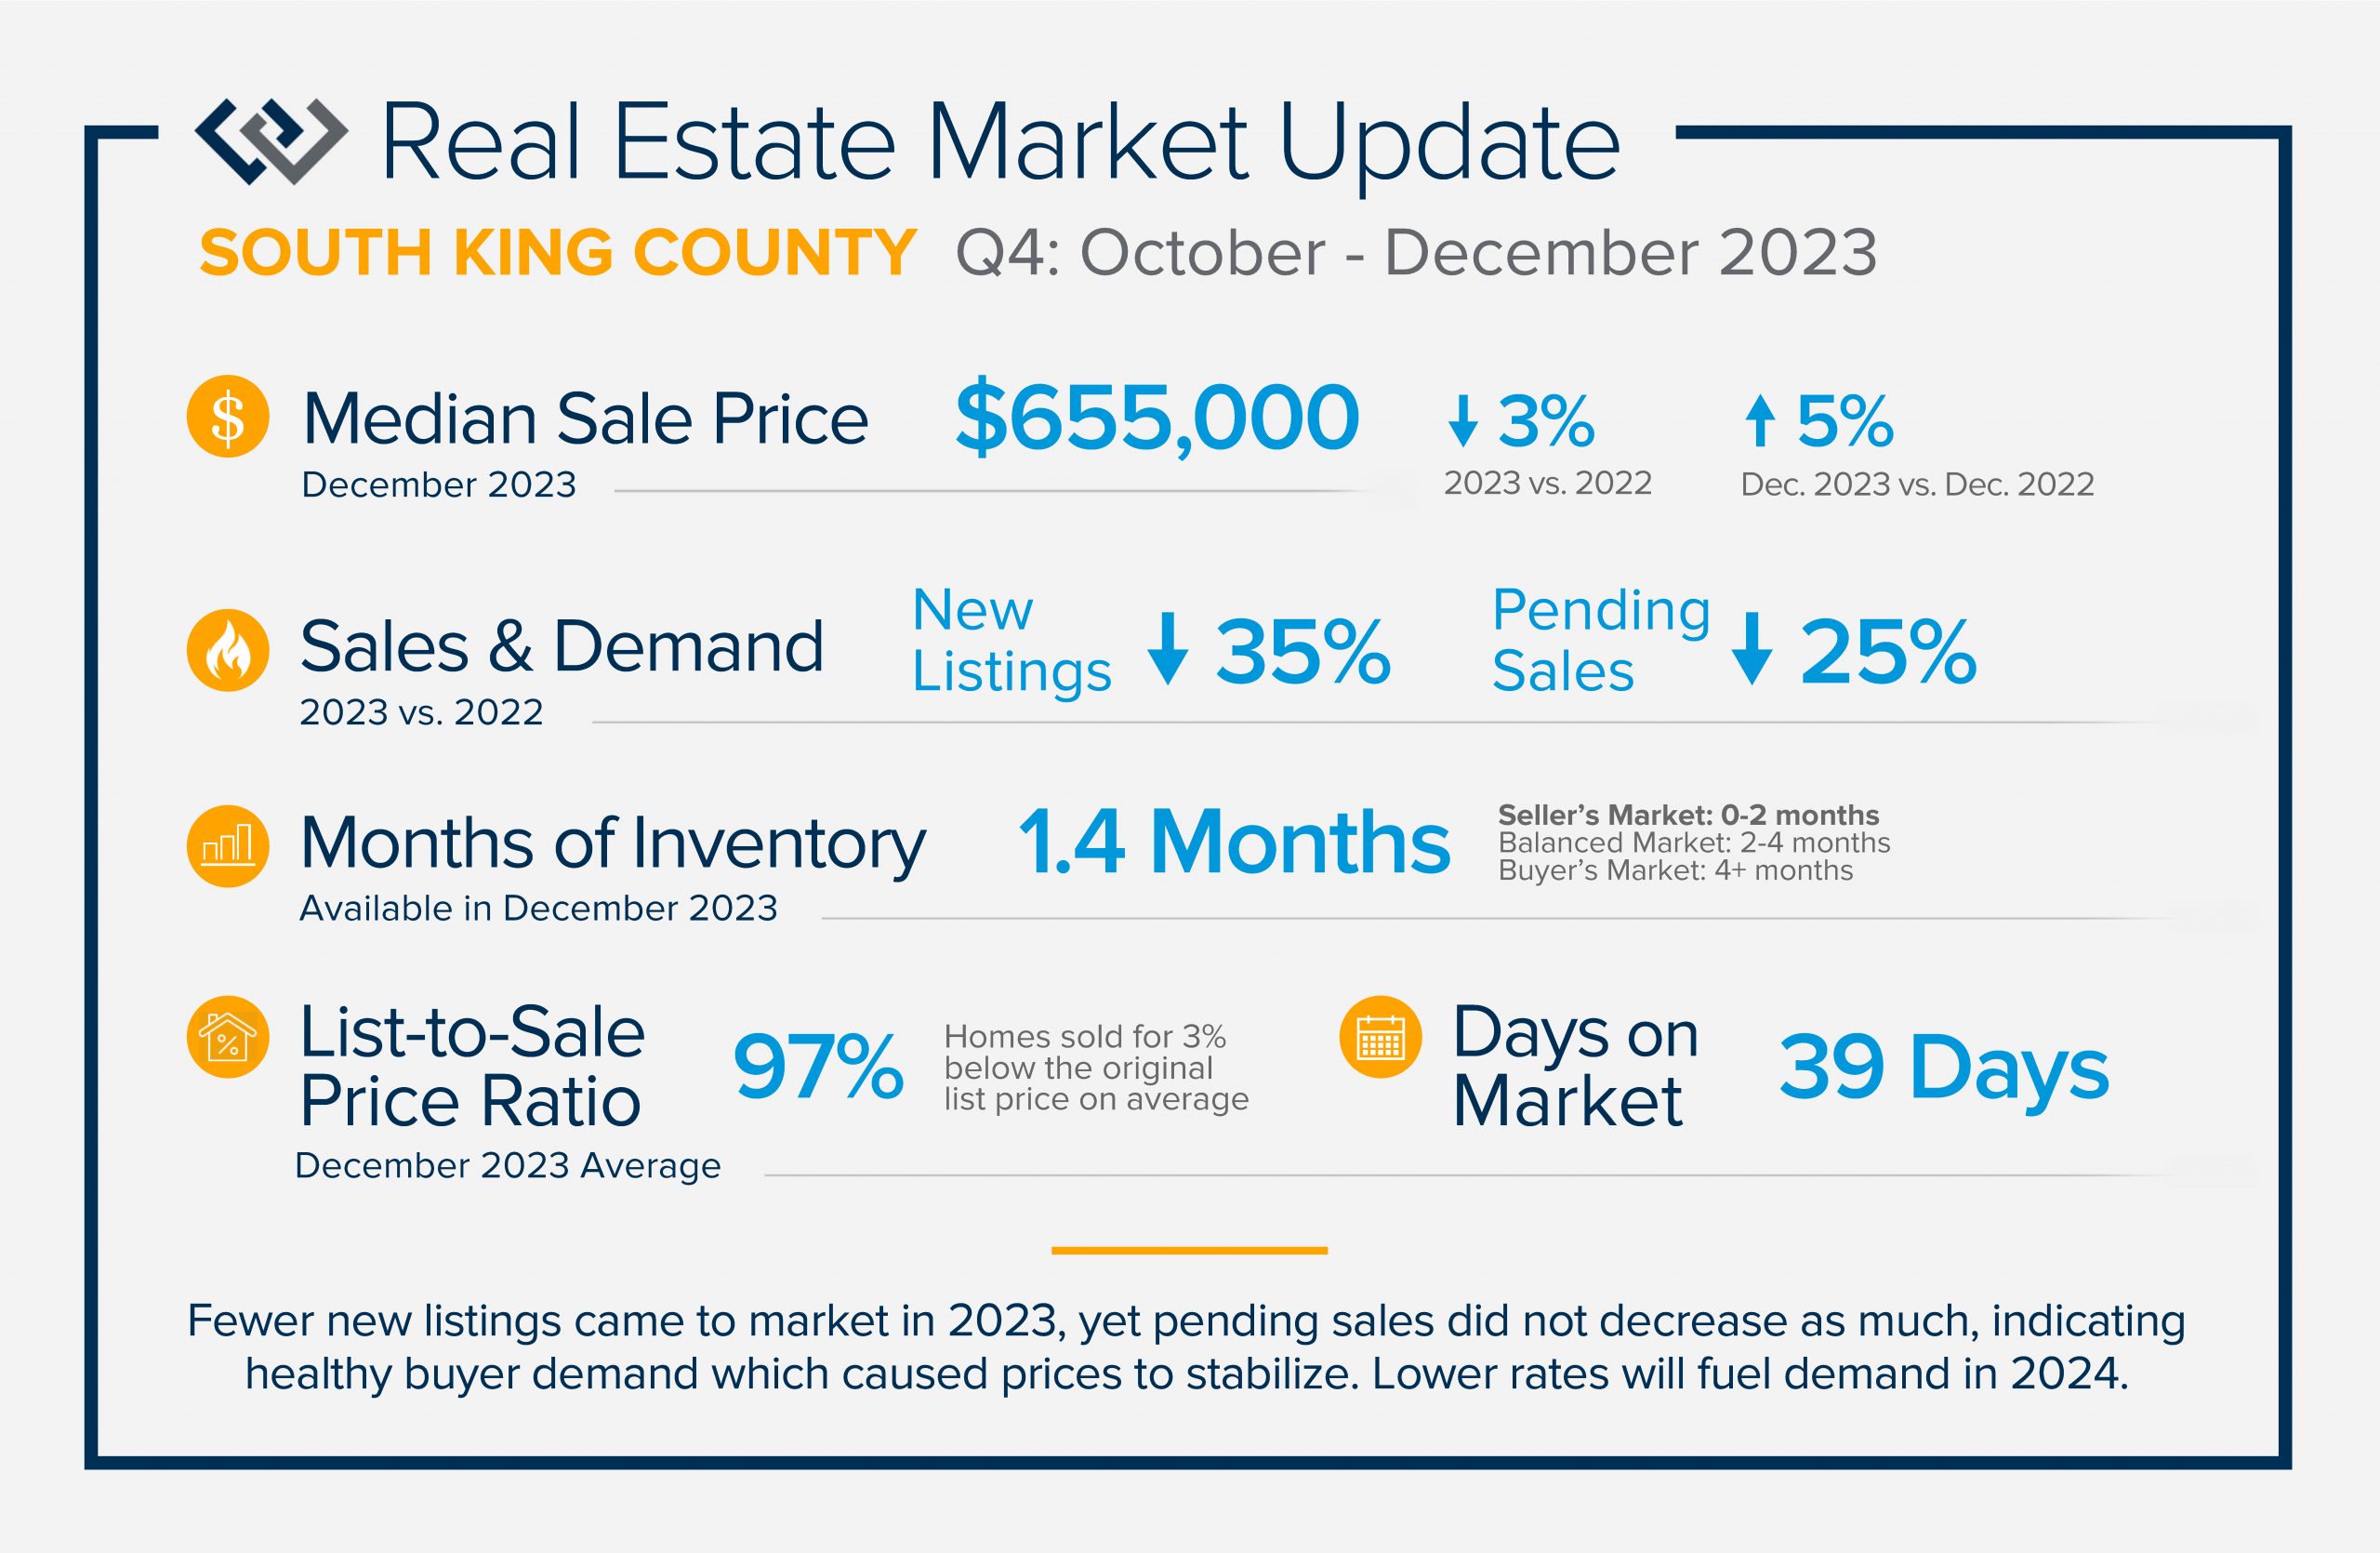
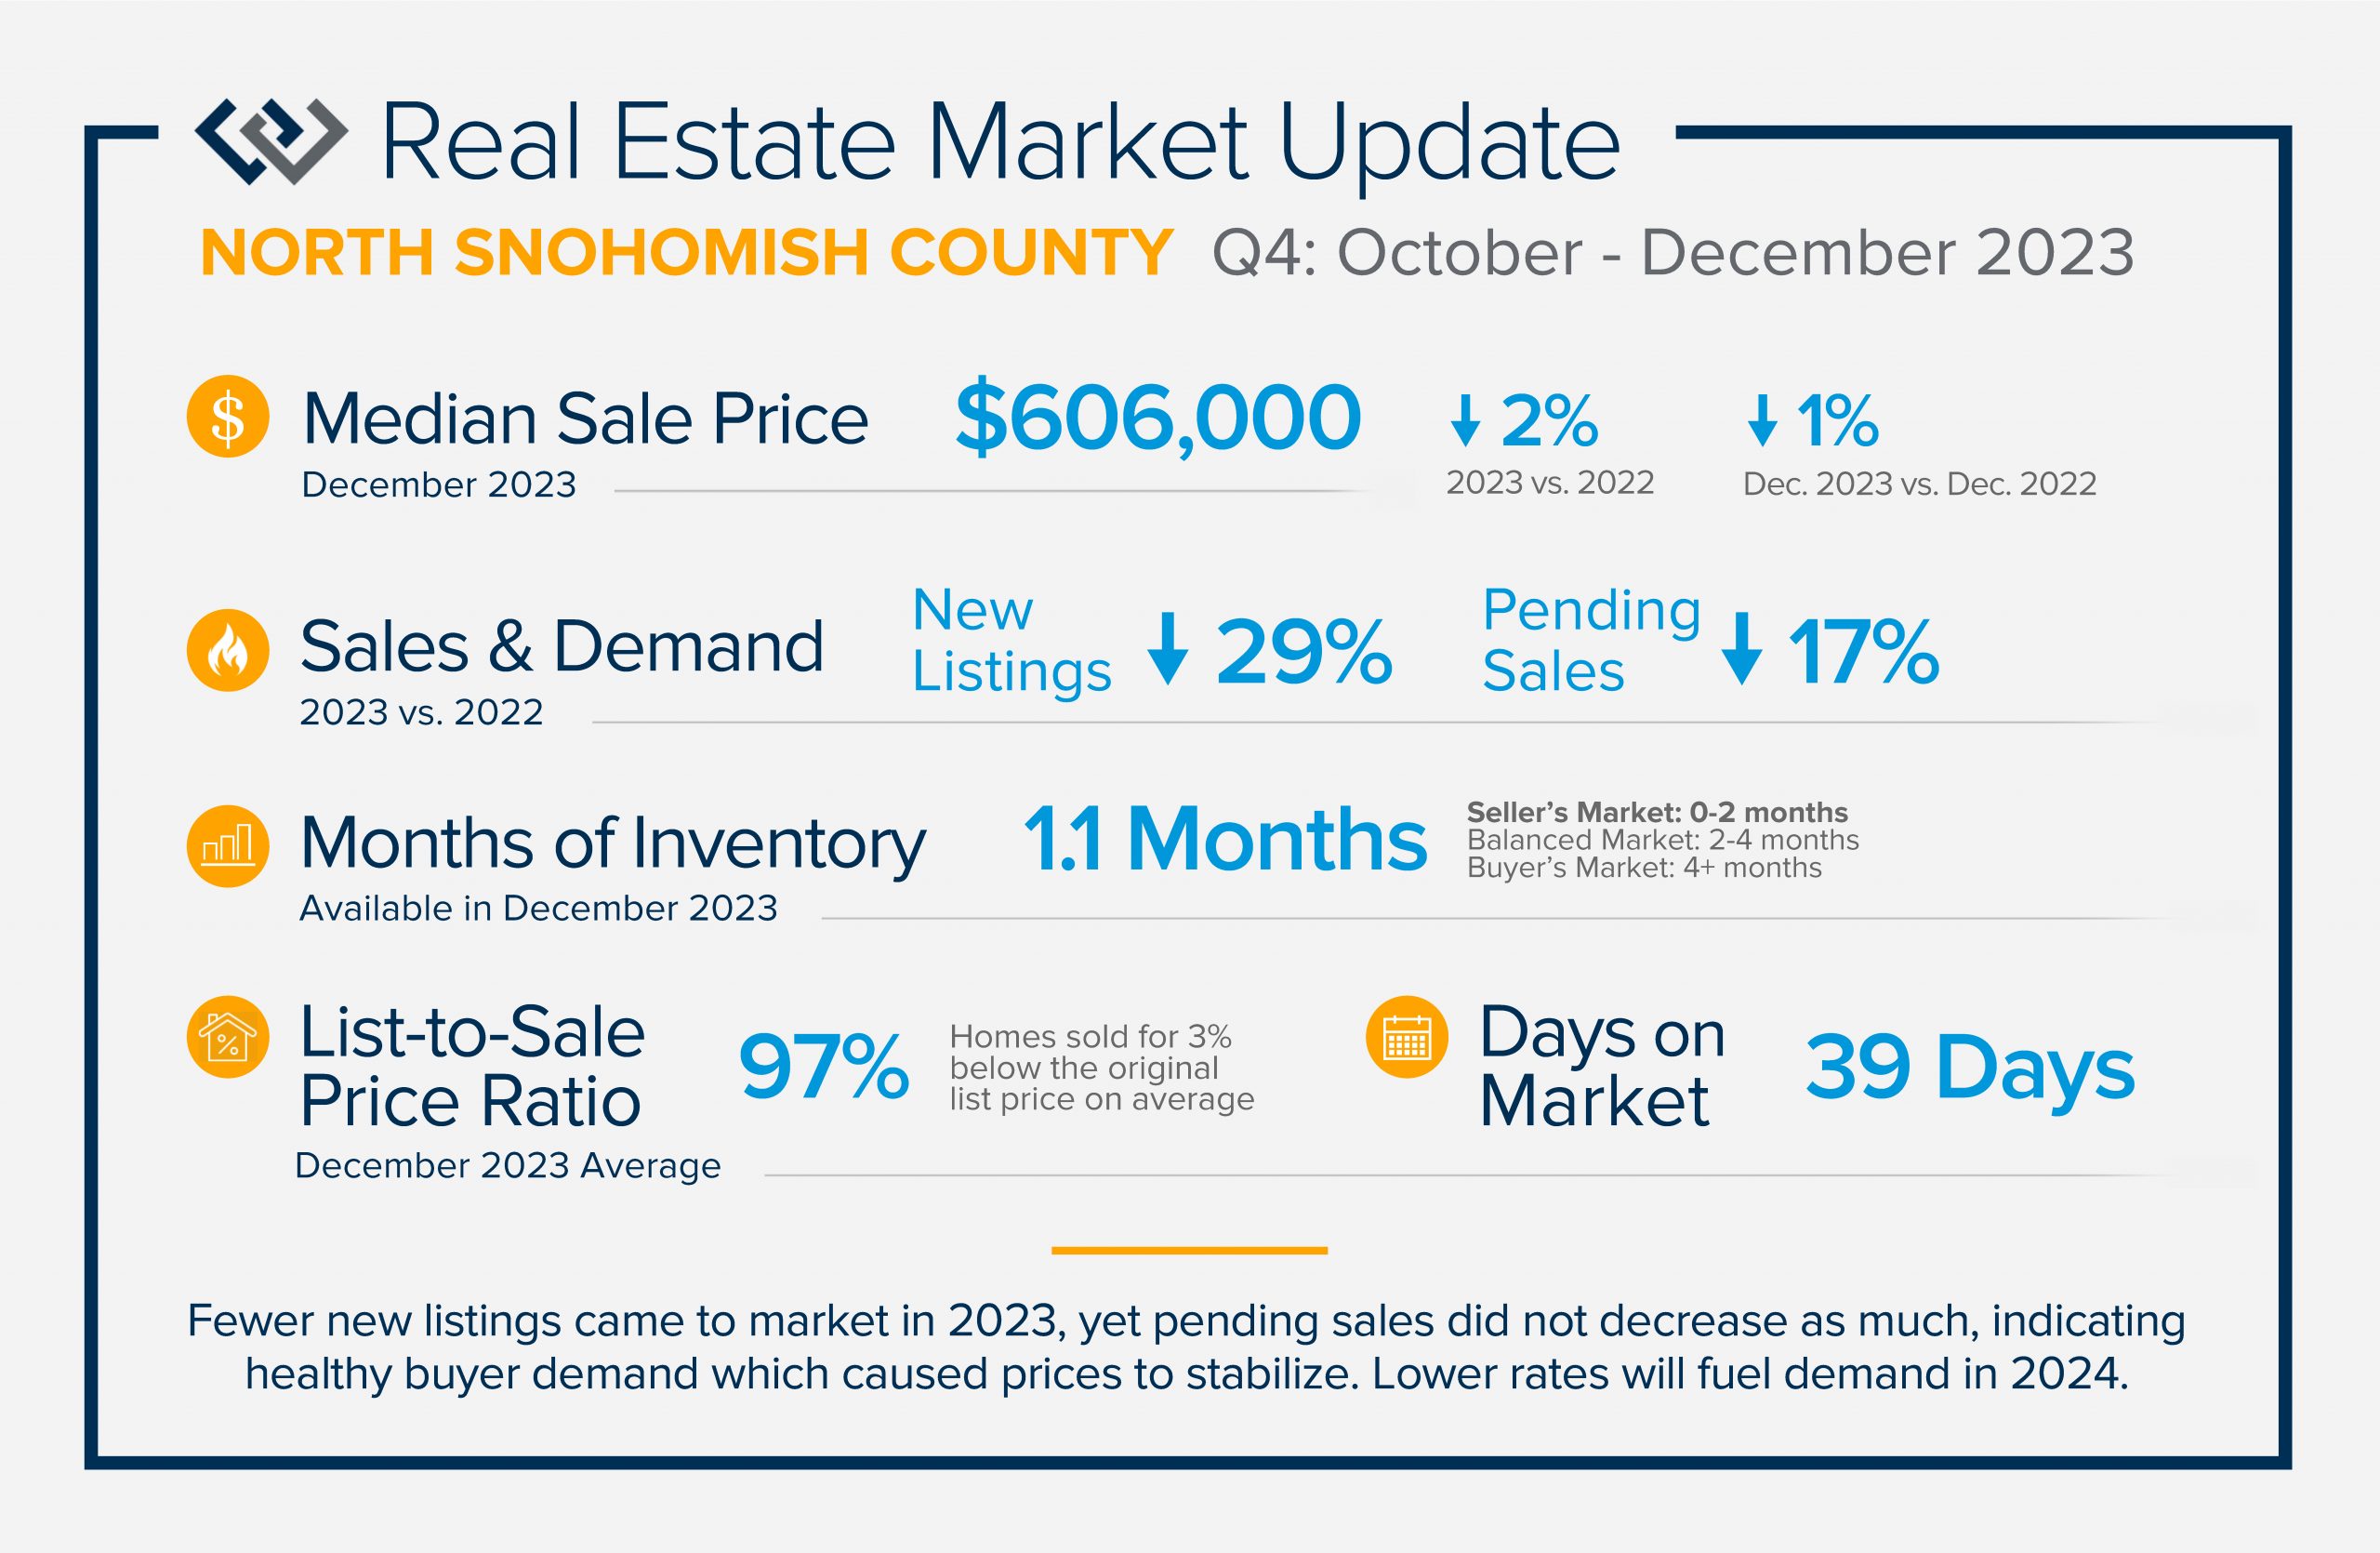
The story of 2023 was balancing interest rates with home purchases and even home sales. The average weekly rate in 2023 was 6.8% and peaked in October at 7.94%. This caused some buyers to pause due to cost. Many sellers were reluctant to move and give up their low payments based on historically low rates, hence the large decrease in new listings in 2023.
Despite the highest rates we’ve seen in two decades, pending sales did not falter like new listings, indicating continued demand and resulting in a seller’s market. Inventory remained tight throughout 2023 and prices stable over 2022 (the peak) when the average rate was 5.34%. Since October, rates have come down by over 1%, bringing more buyers to the market. The Fed plans to continue this trend in 2024 which will increase buyer activity and new listings. 2024 will provide improved opportunities for all with a less stringent lending environment.
If you are curious about how the trends relate to your goals, please reach out. I strive to keep my clients well-informed and empower strong decisions.
QUARTERLY REPORTS Q3 2023

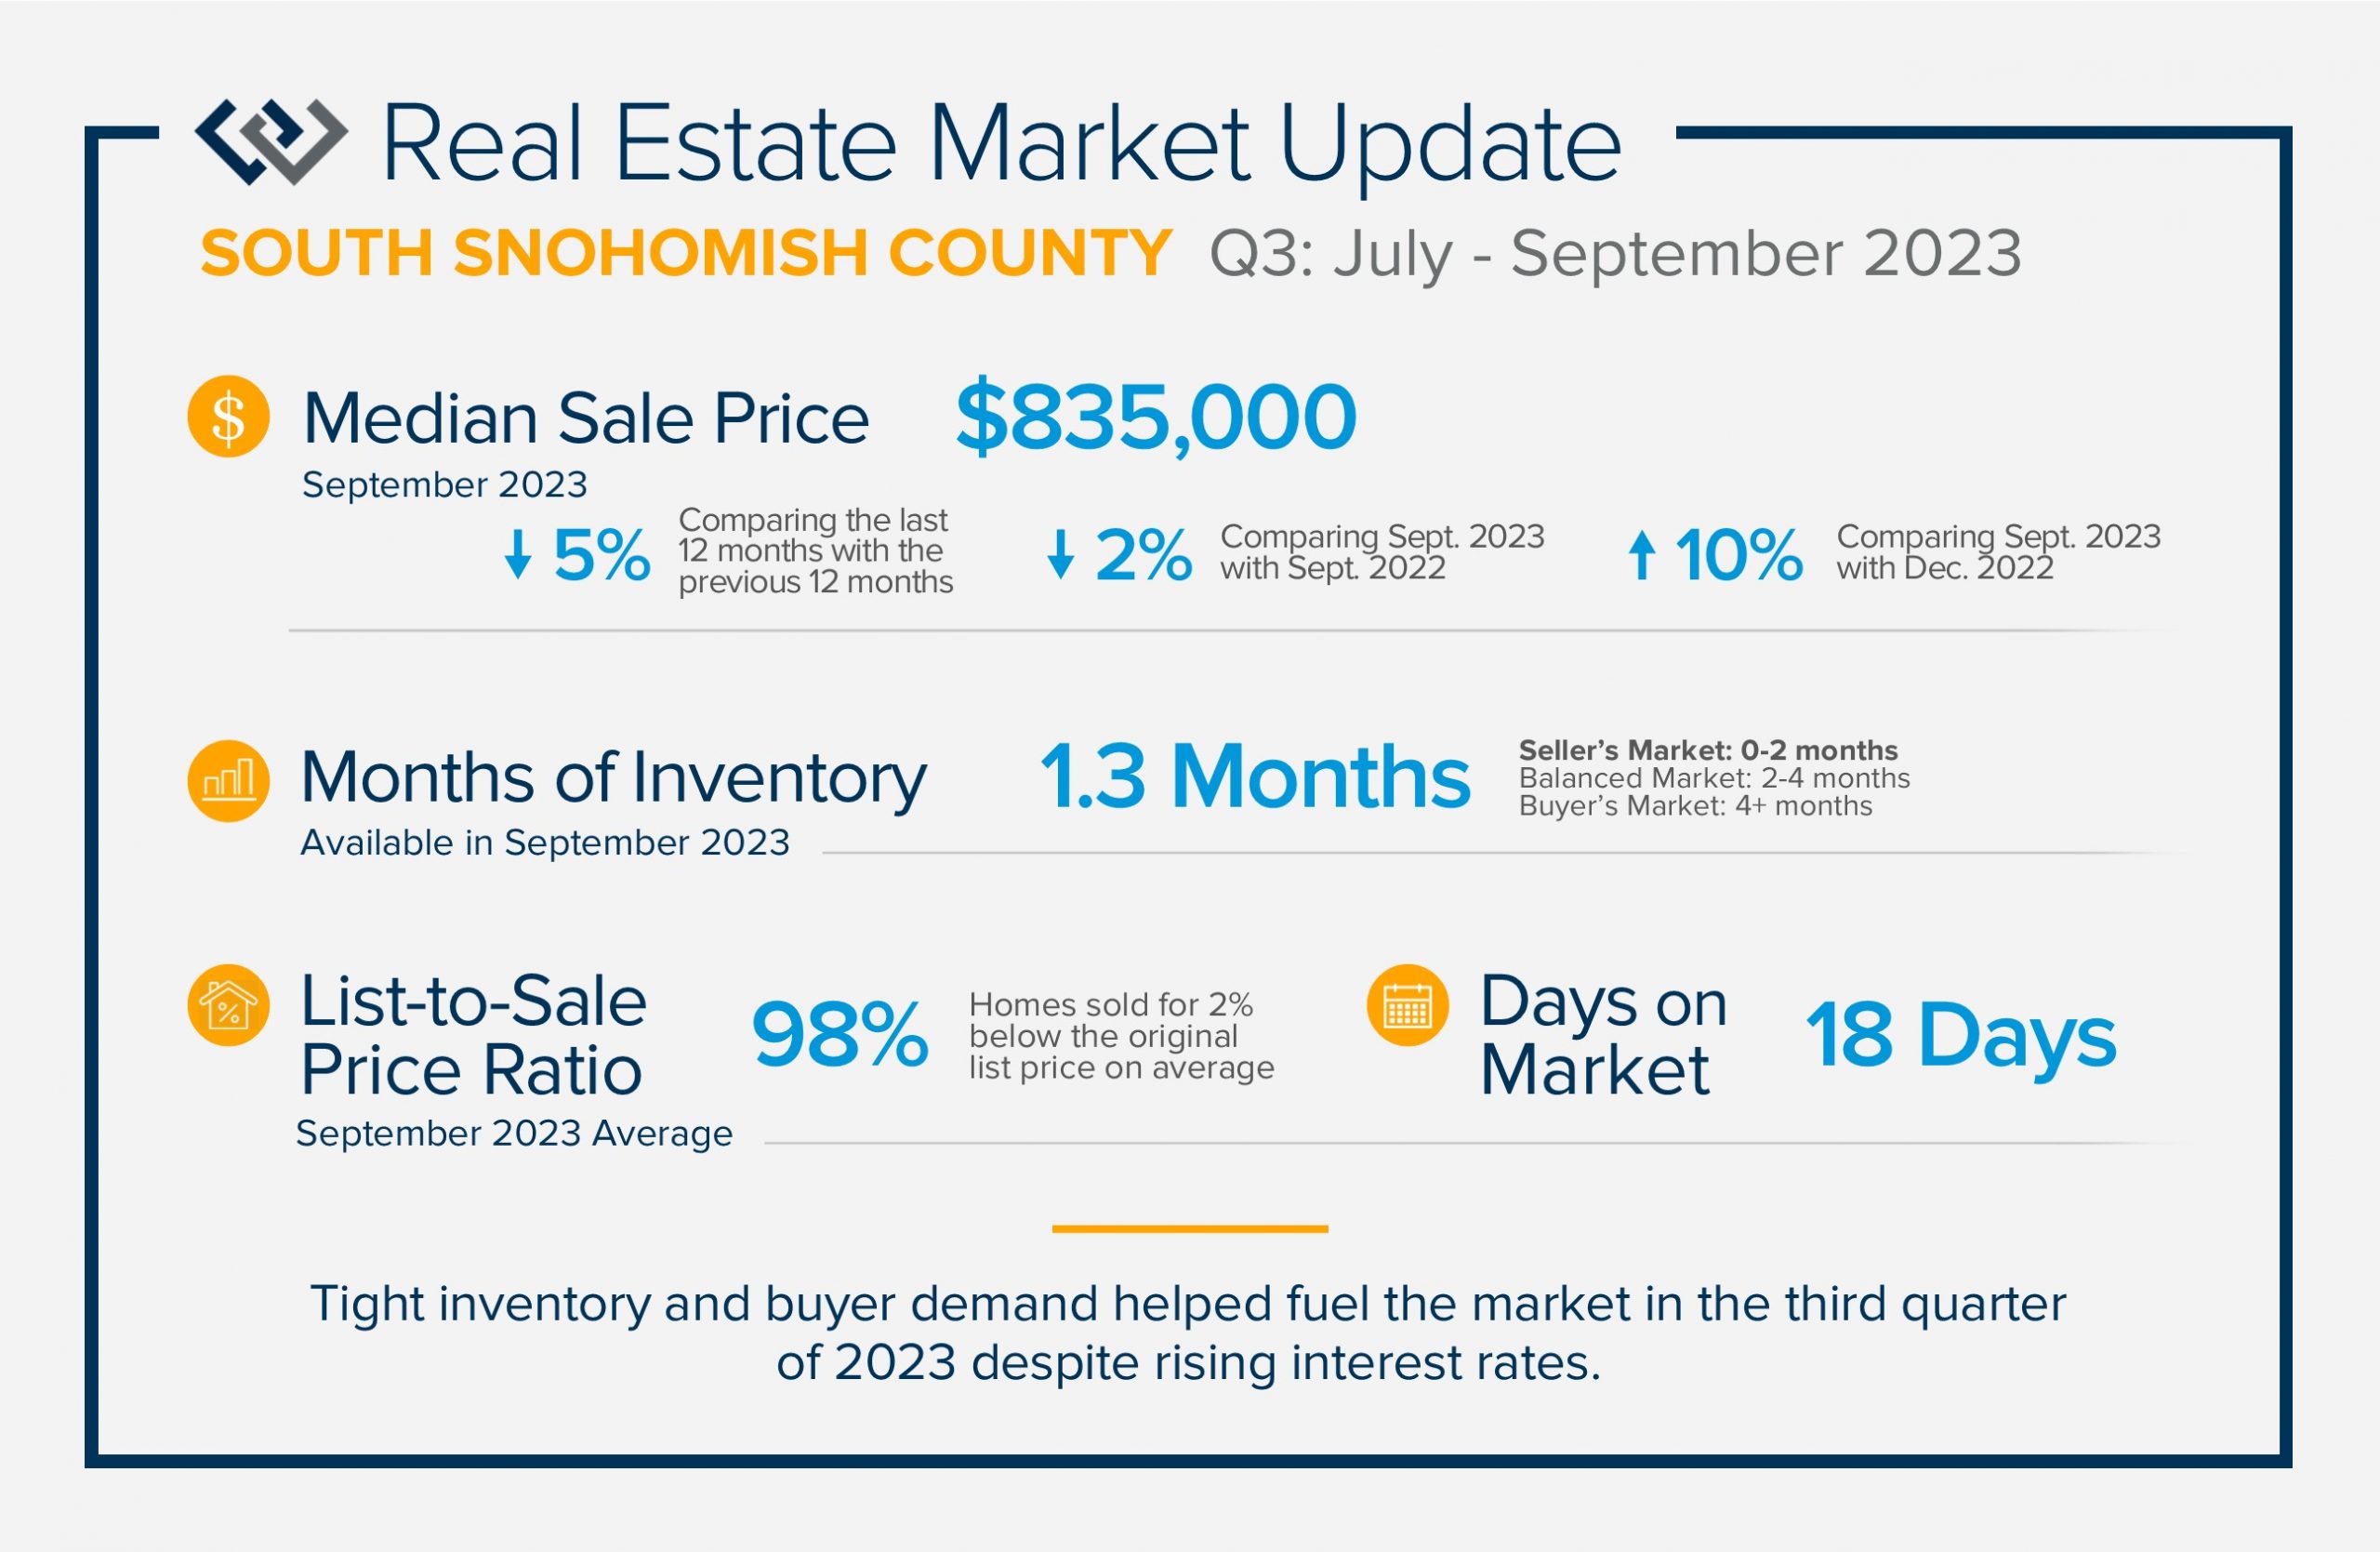
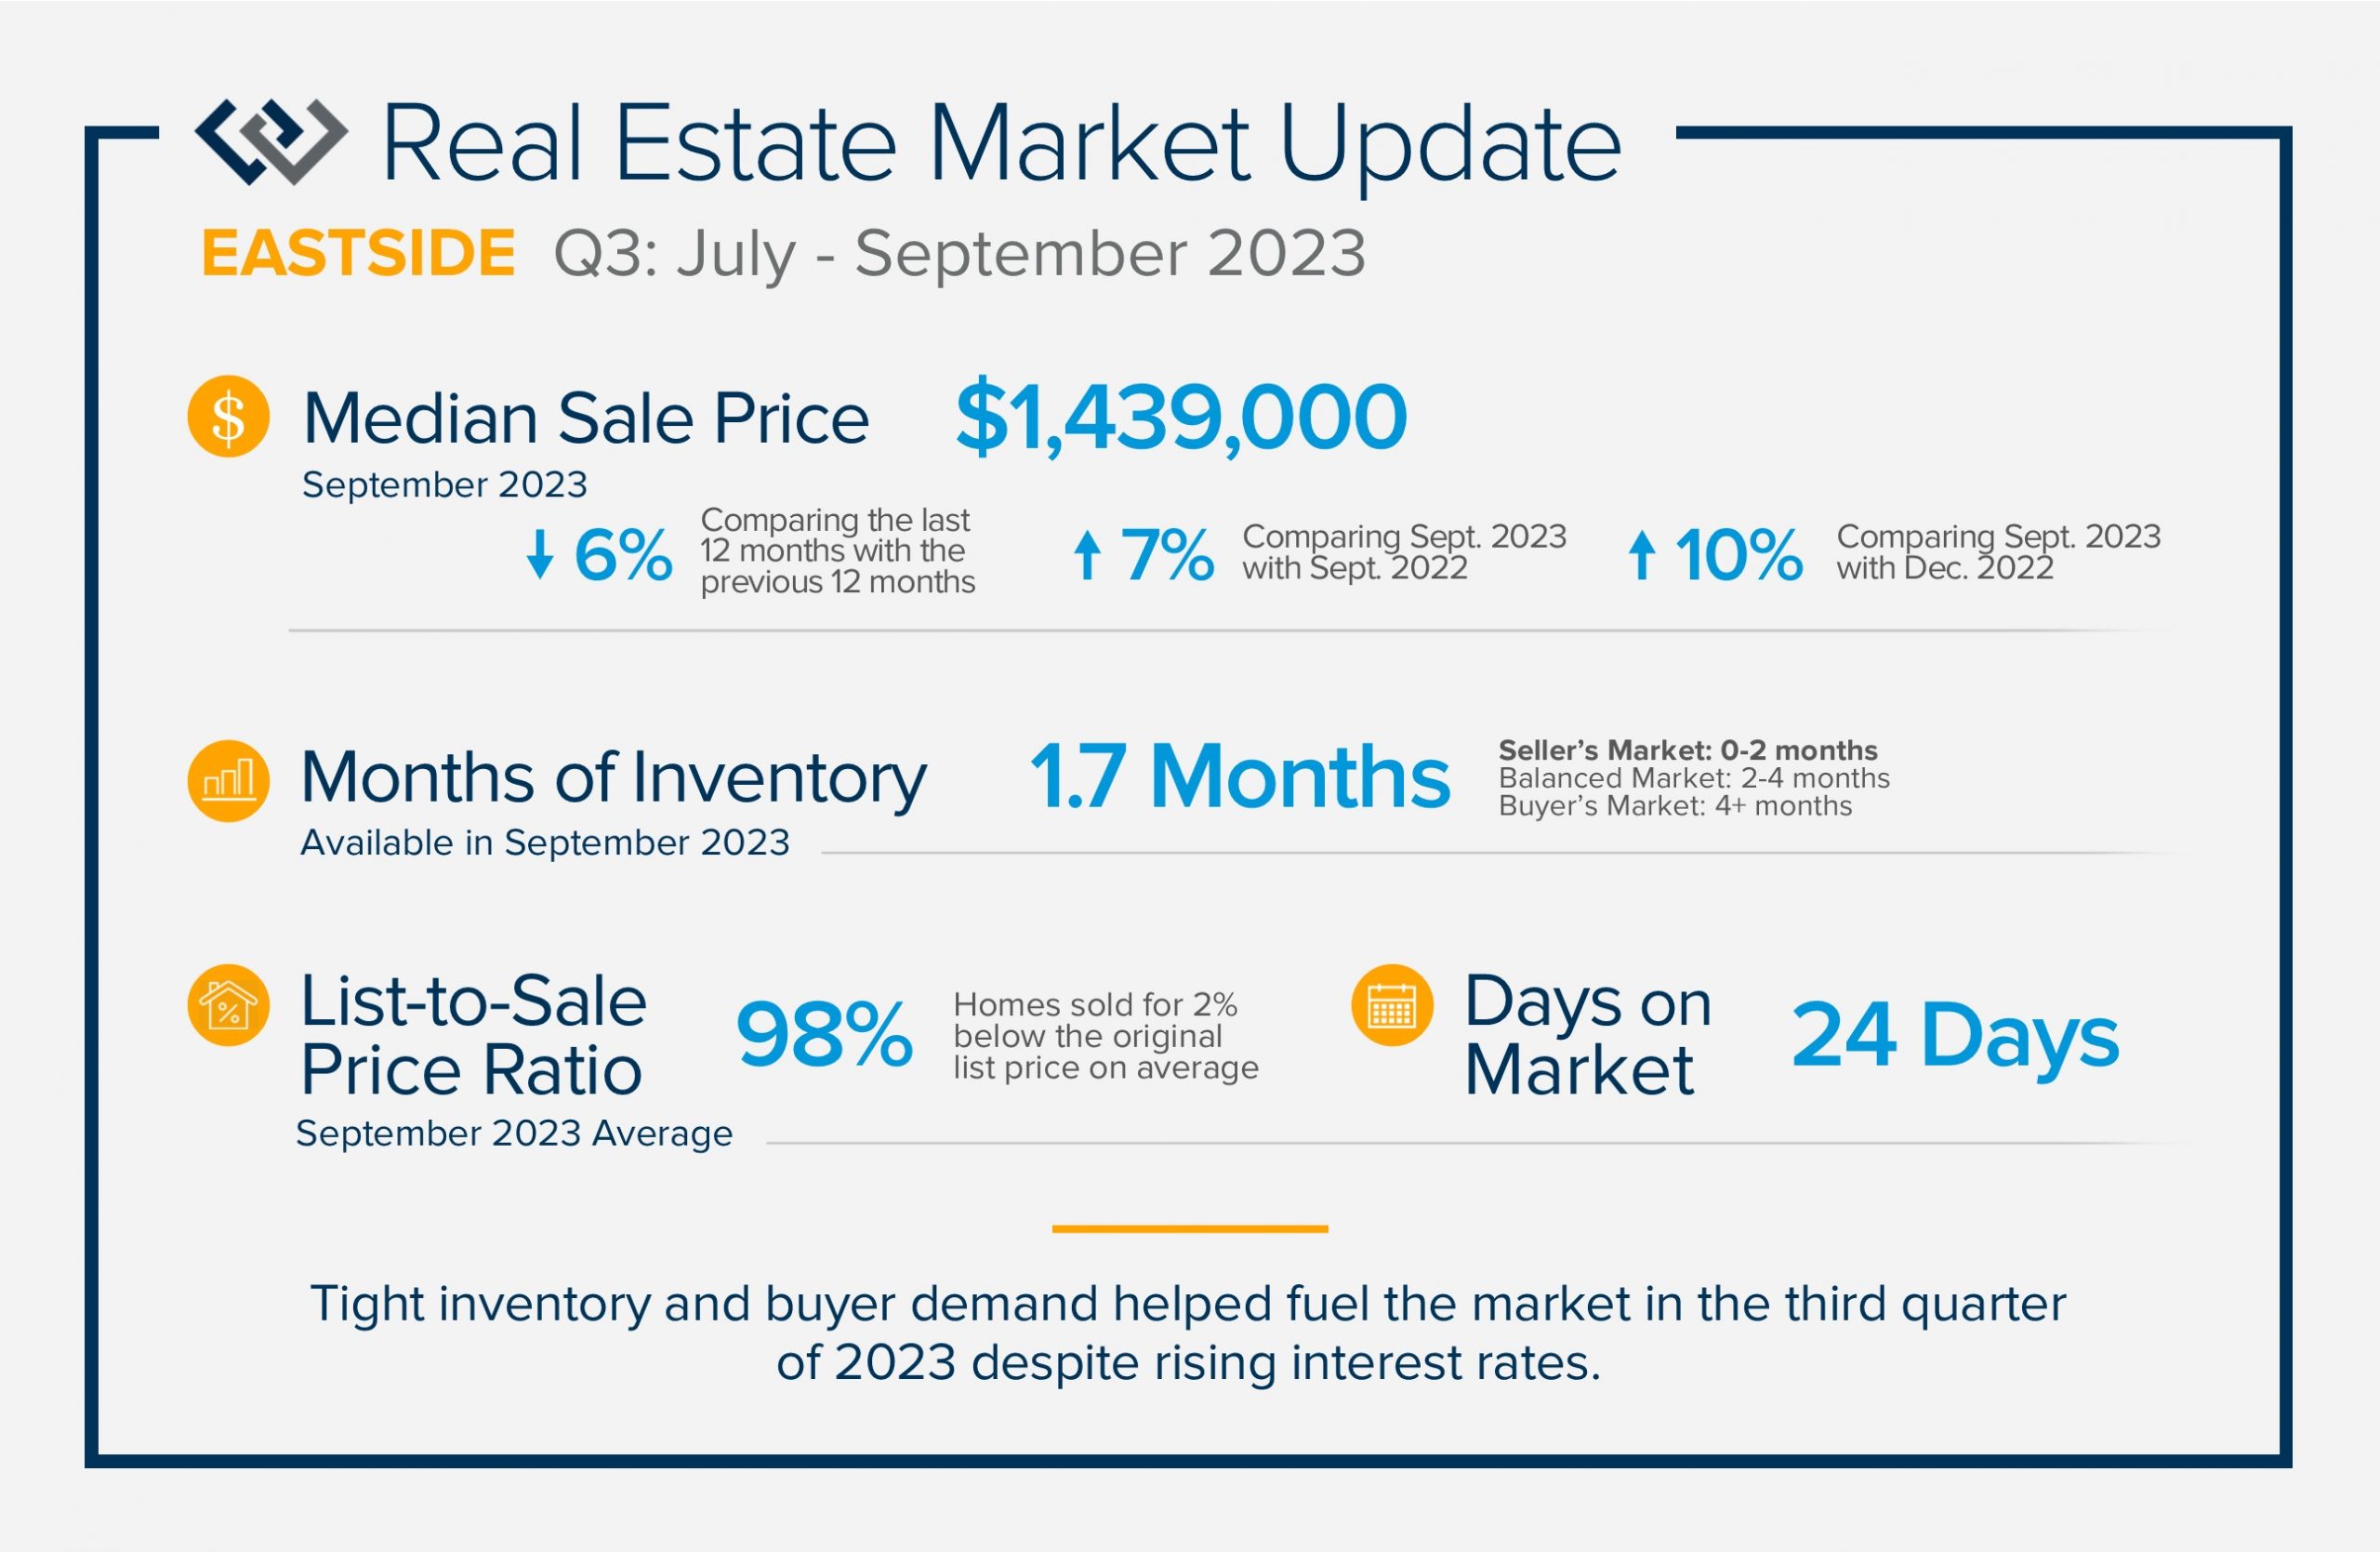
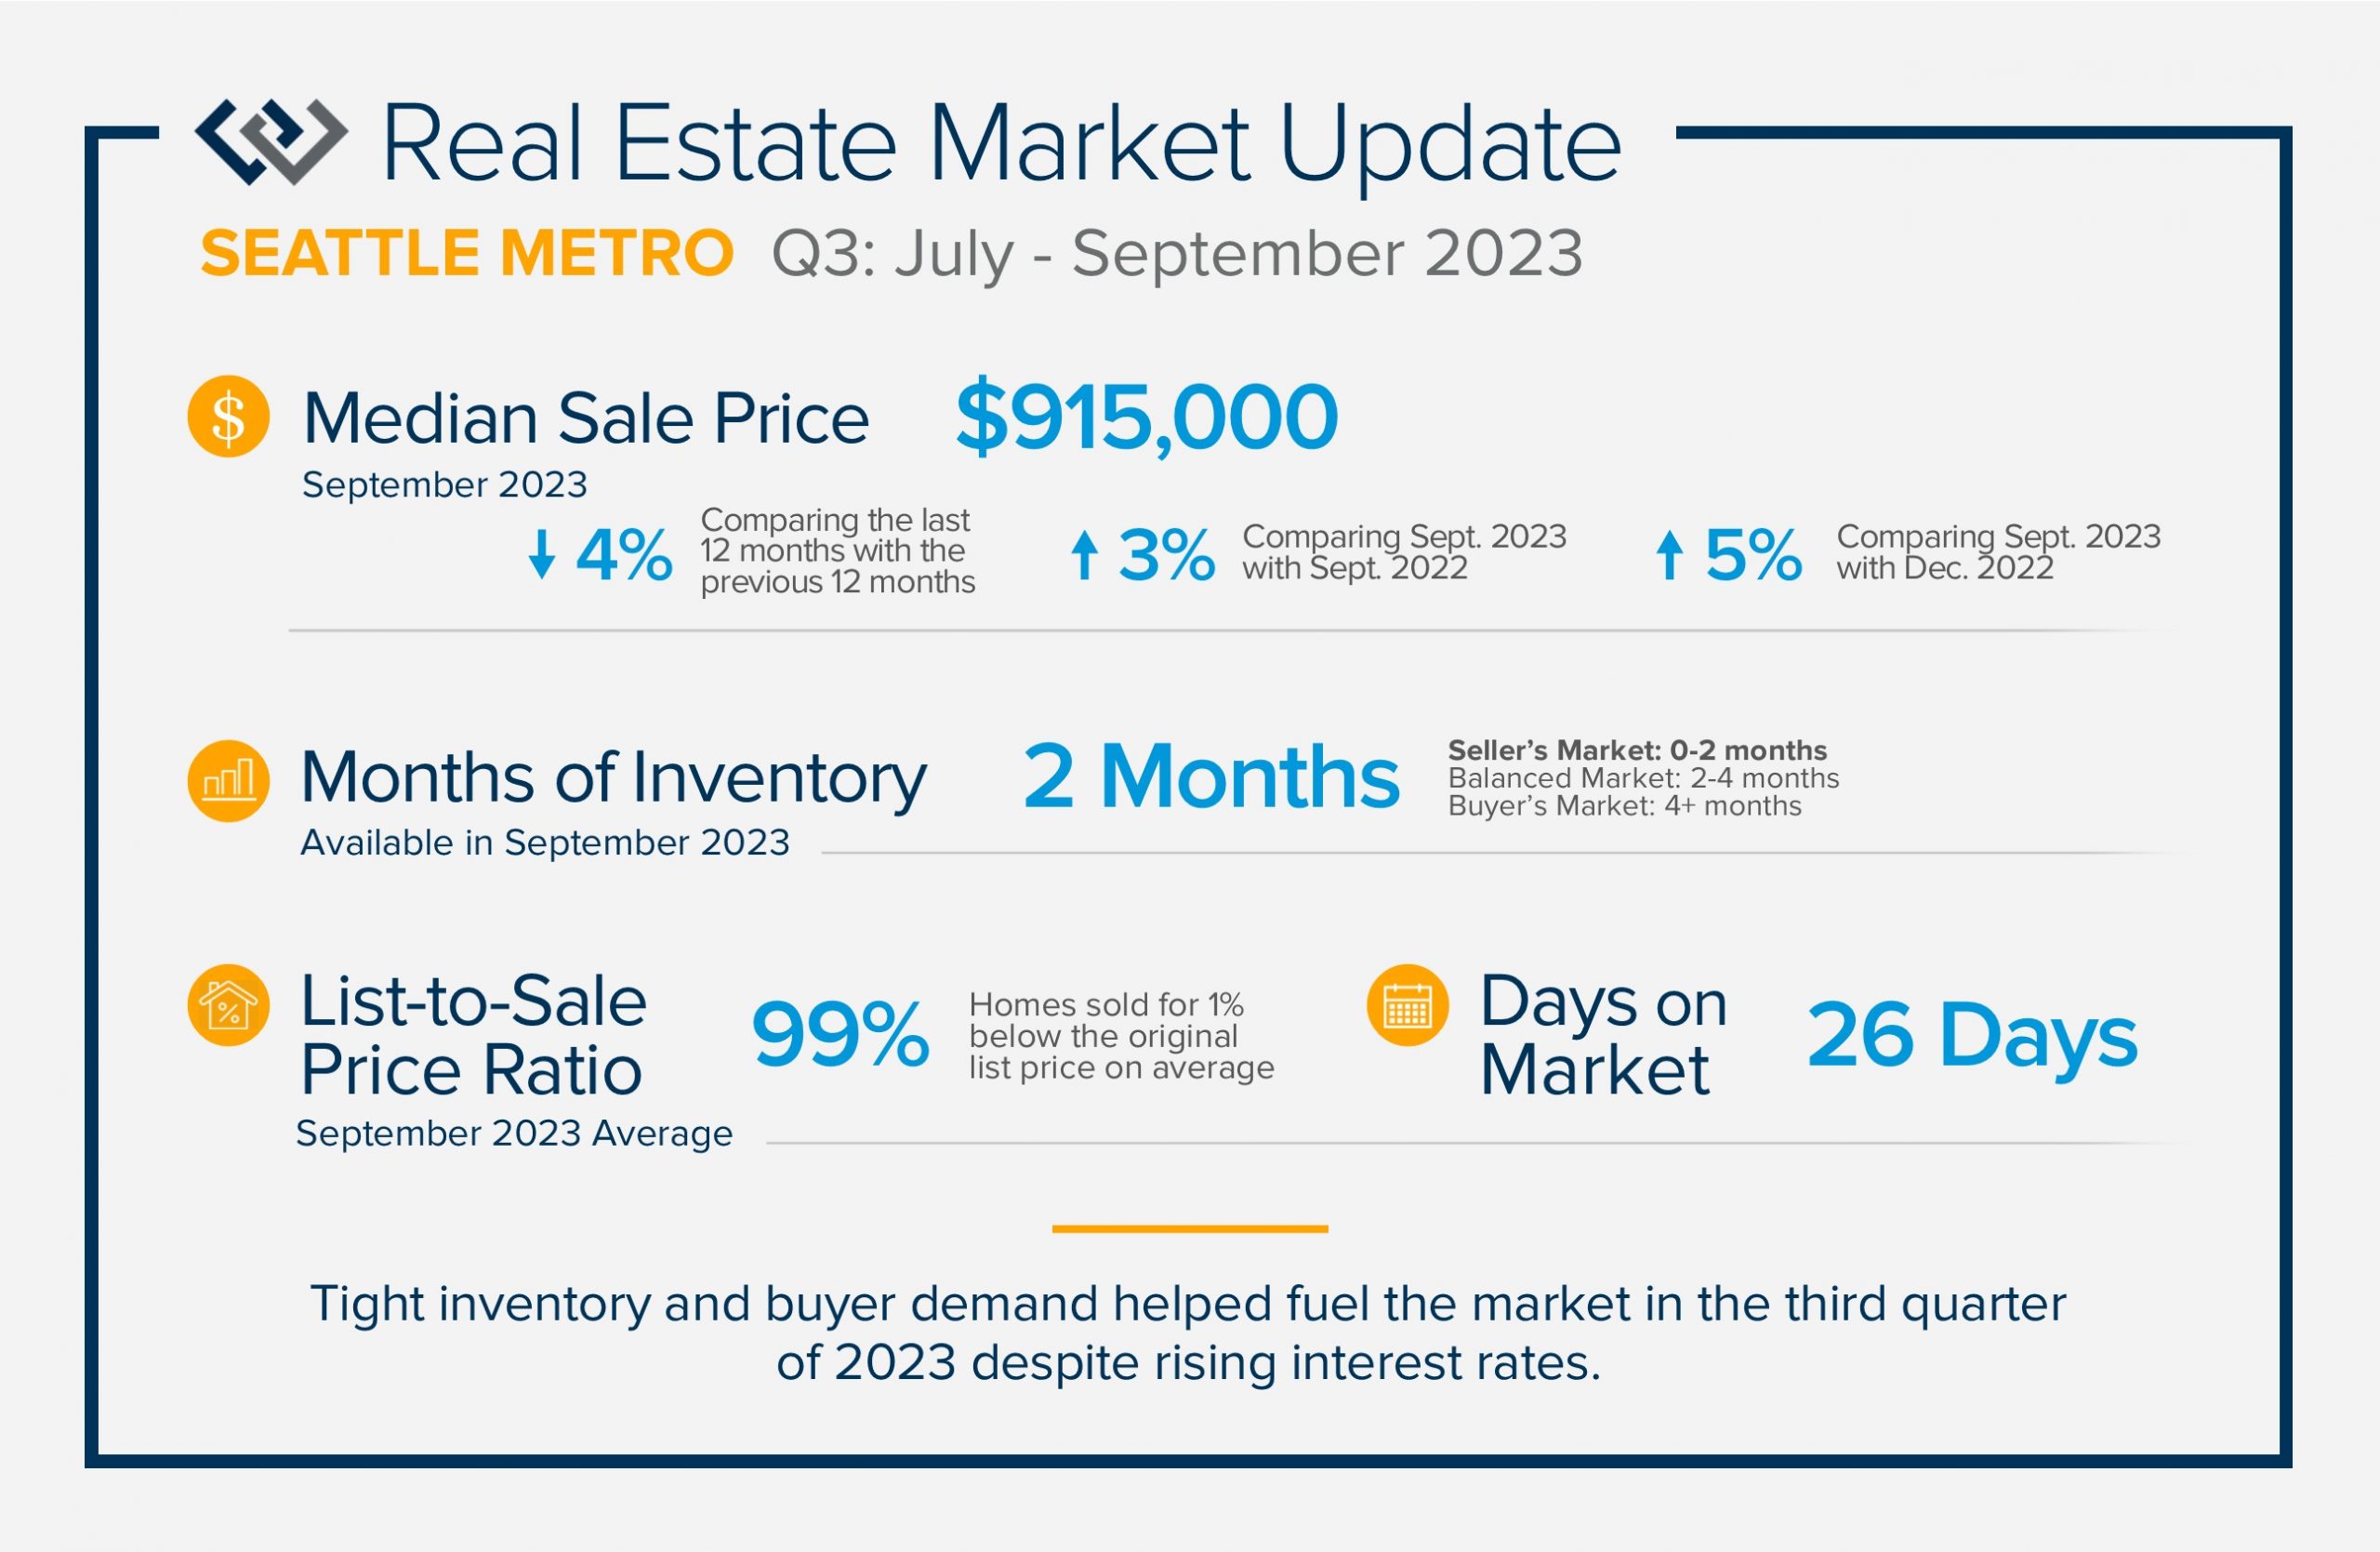
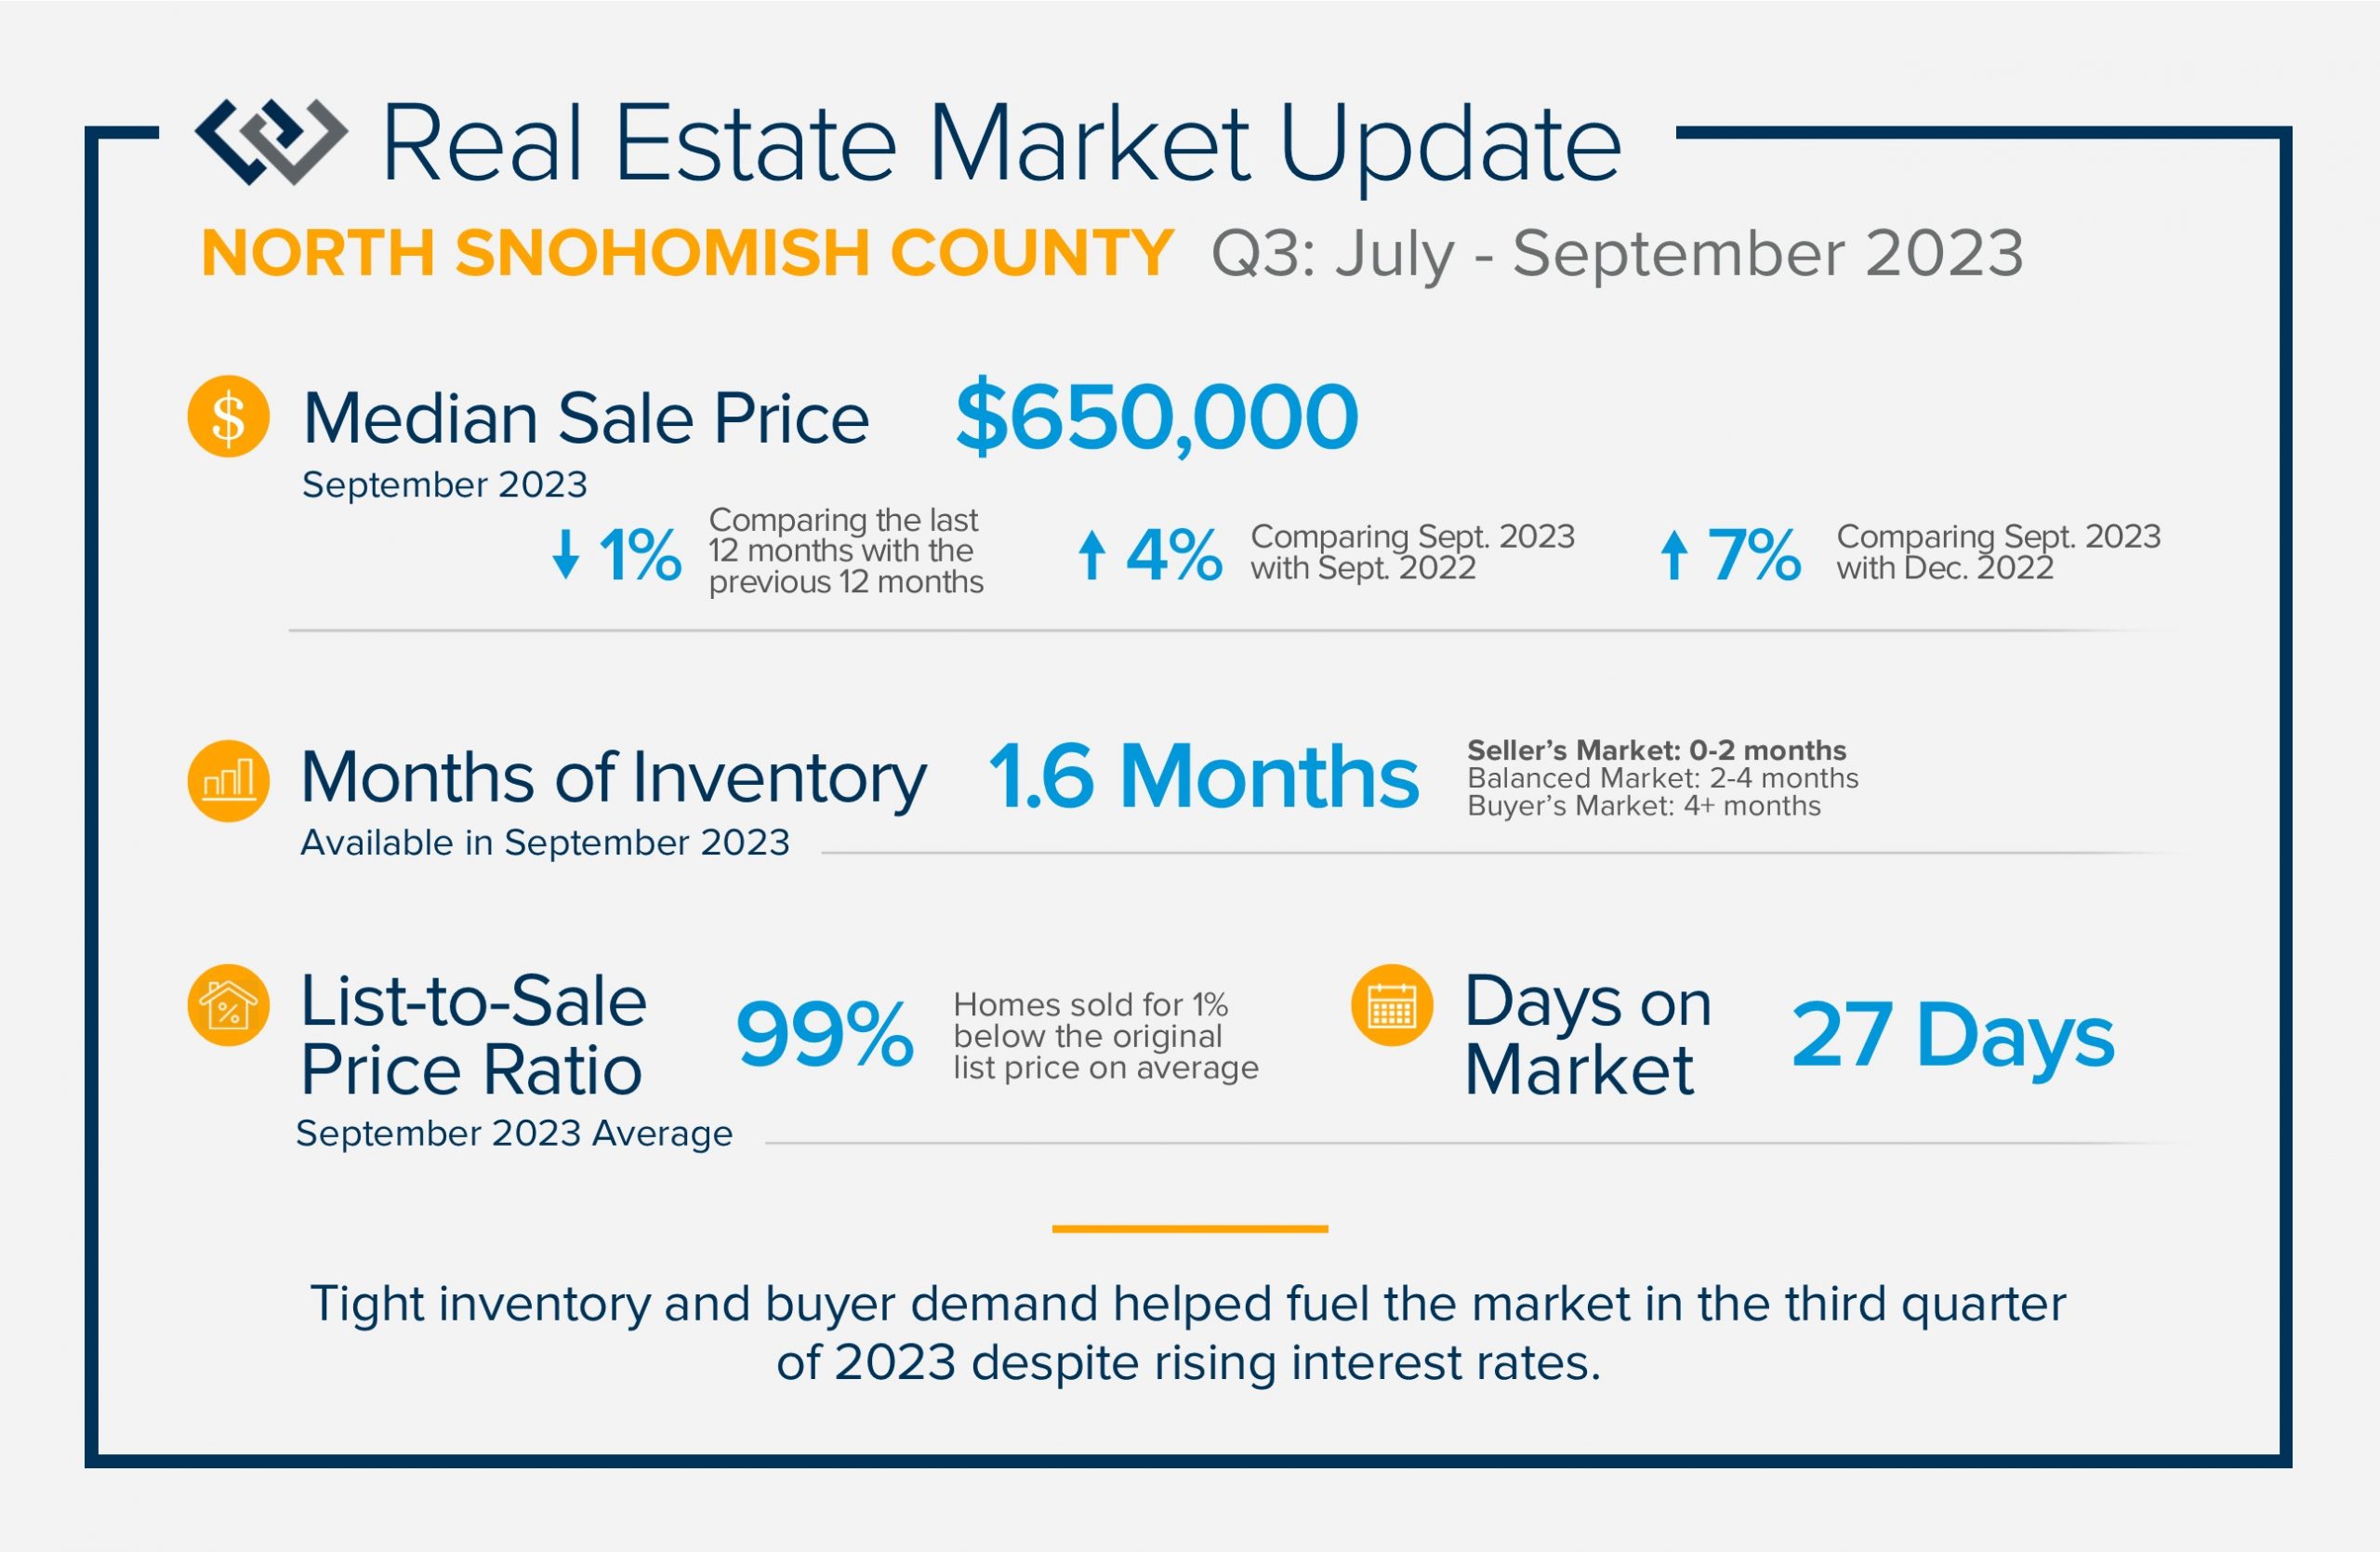
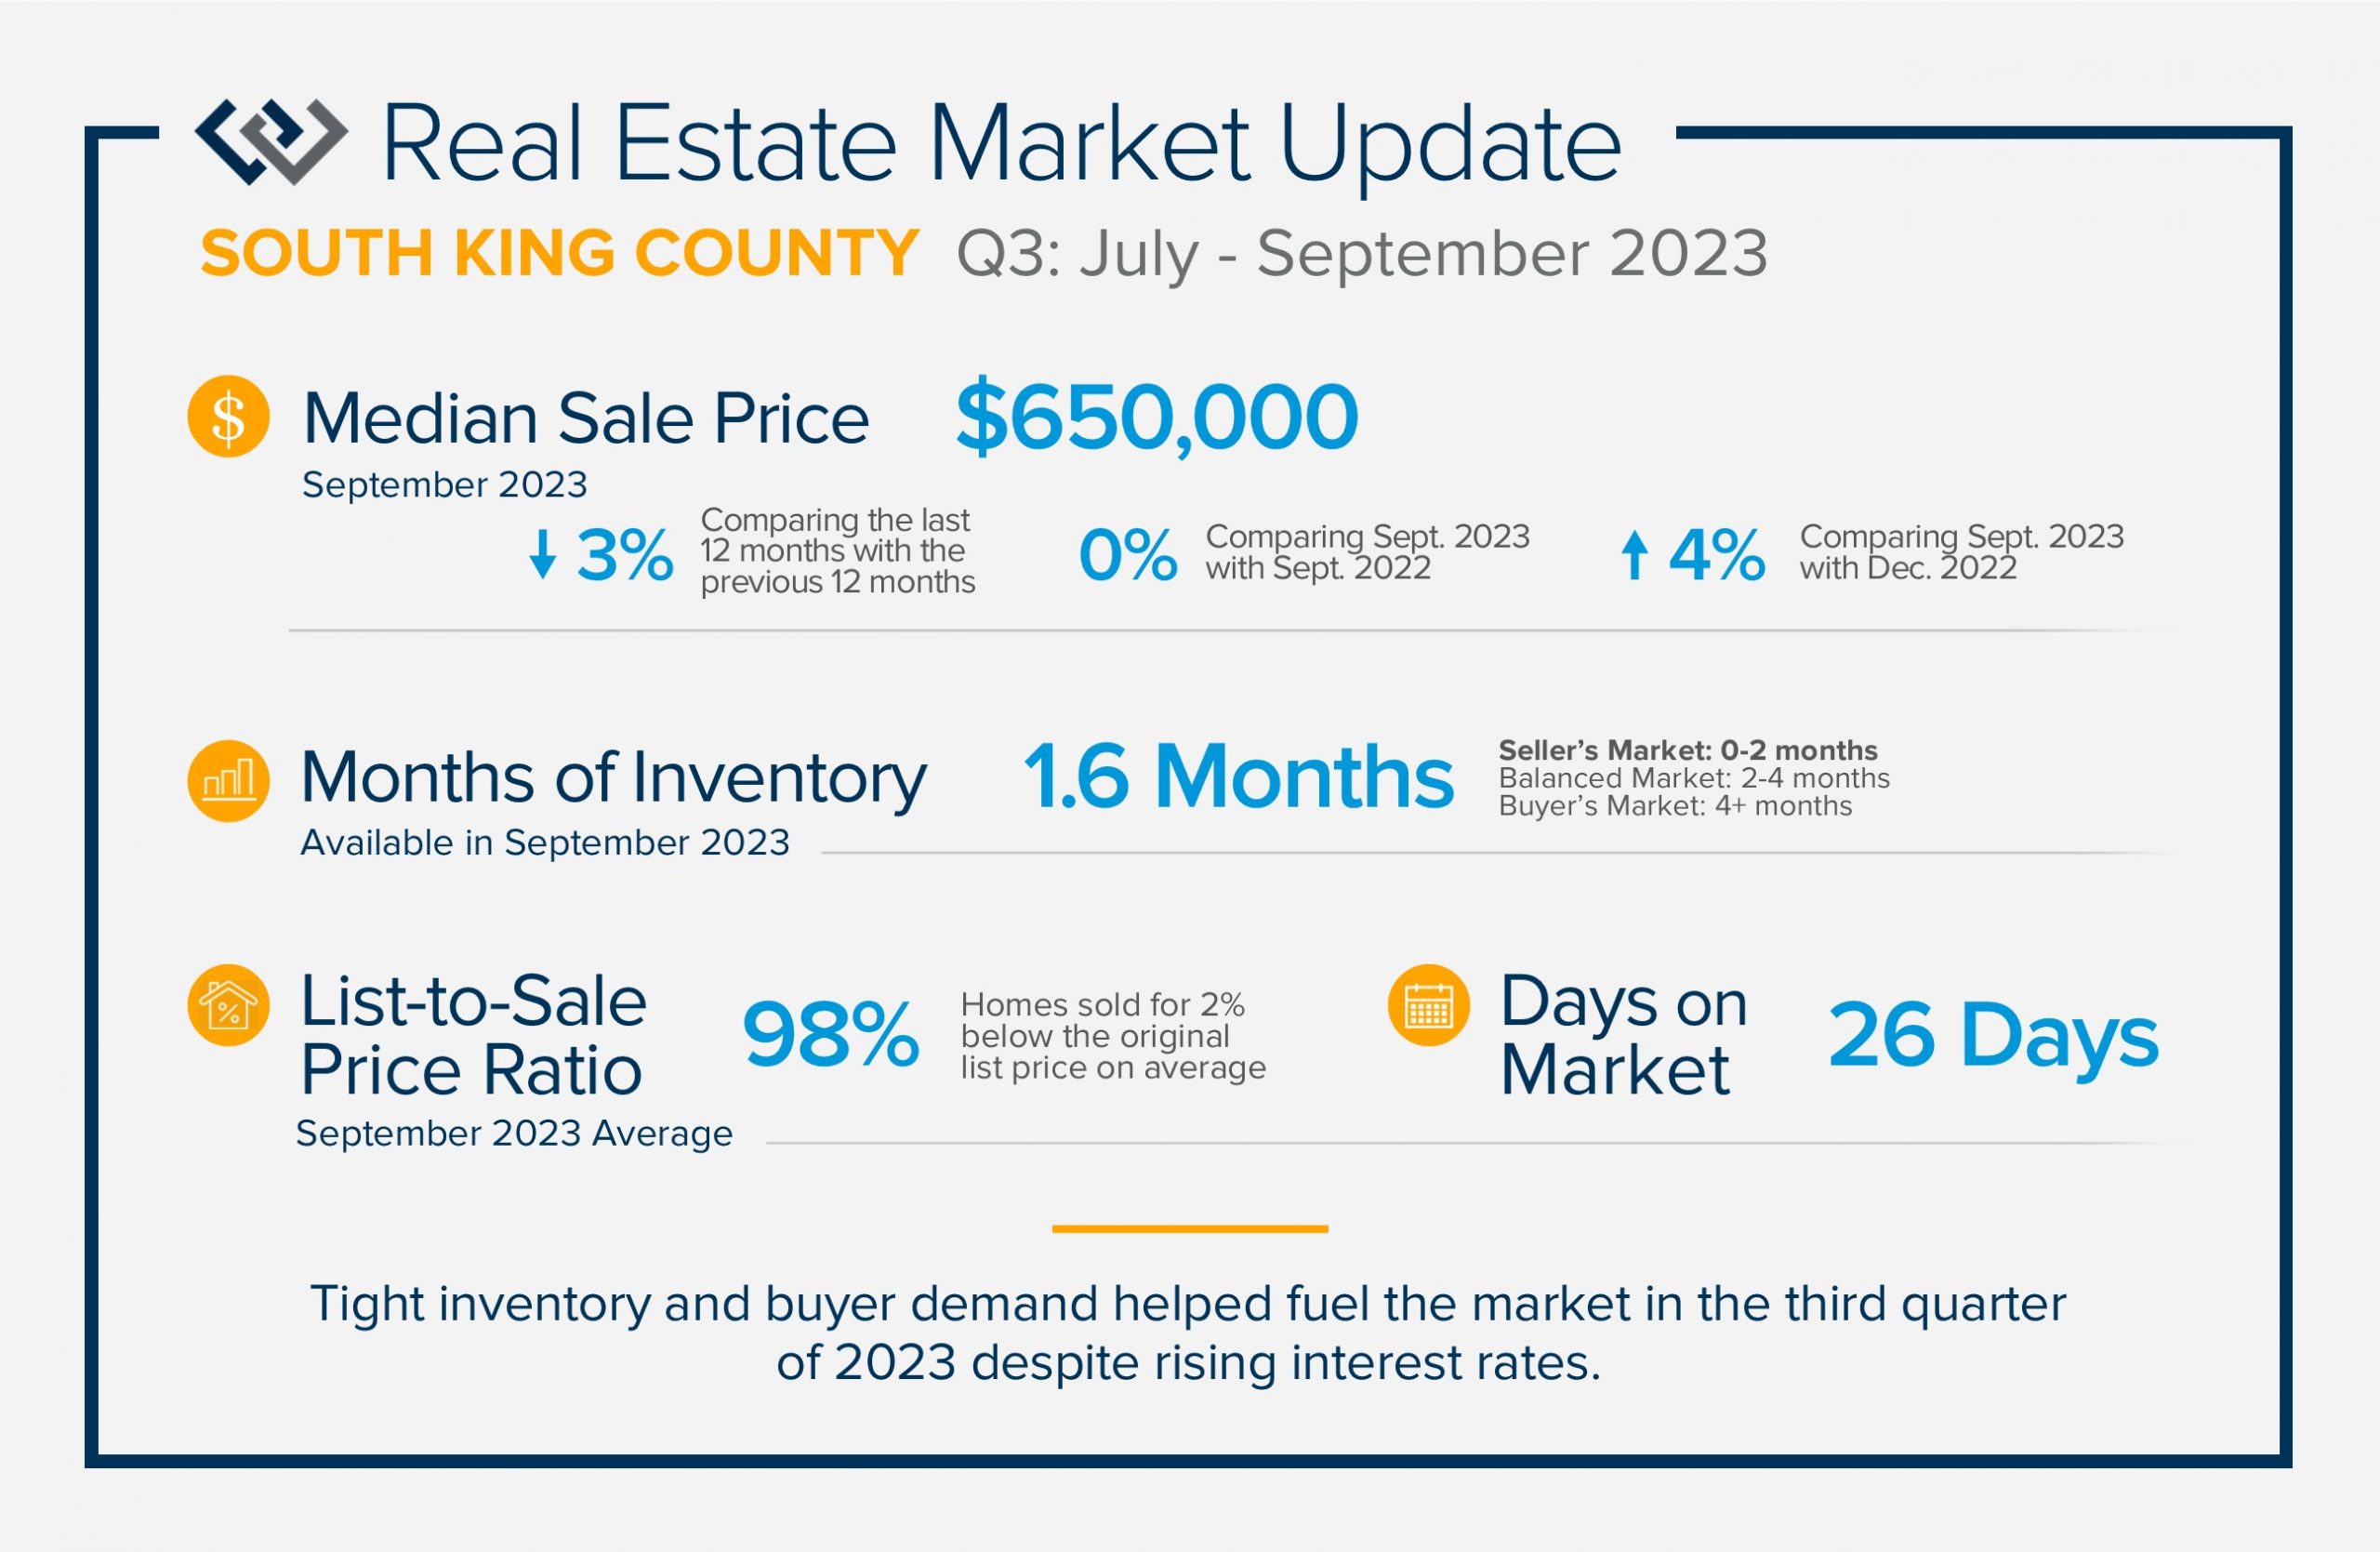
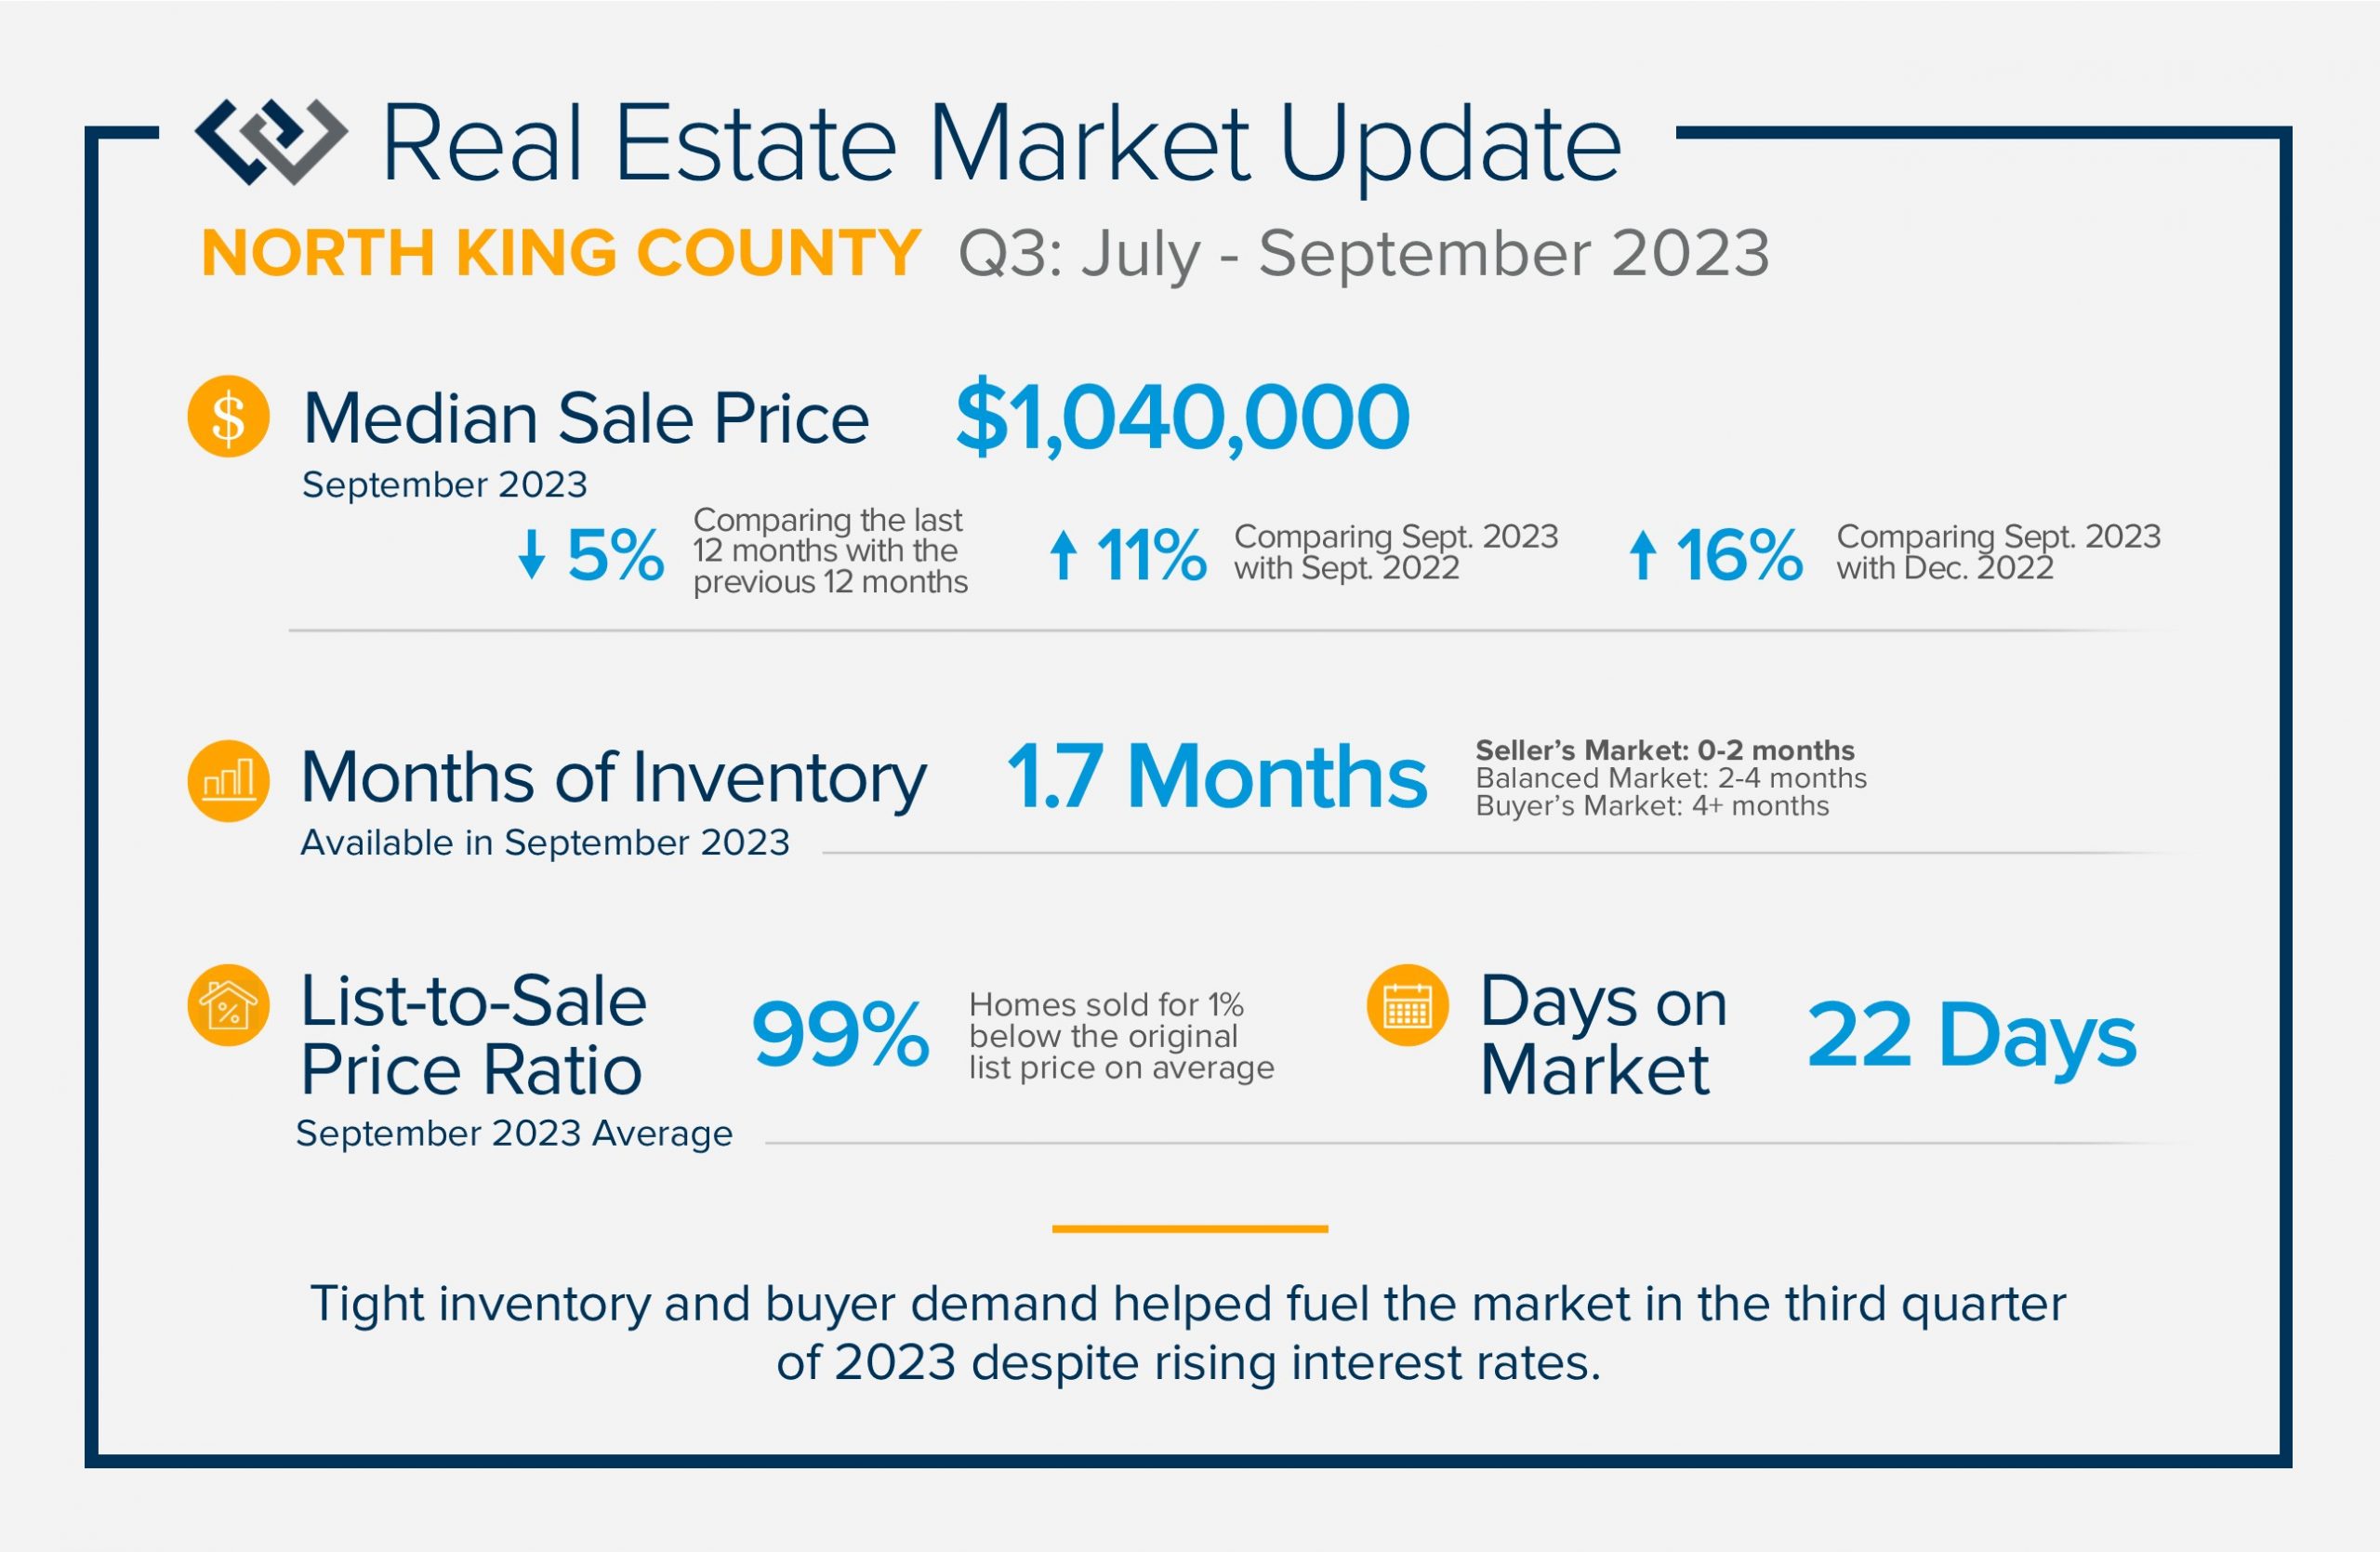 Tight inventory and buyer demand helped fuel the market in the third quarter of 2023 despite rising interest rates. There have been fewer listings in 2023 than in 2022 which has created price growth since the first of the year. Prices peaked in spring 2022, corrected in the second half of 2022, and then they started to rise again in 2023. Home equity is high with over 50% of all homeowners having 50% or more equity in their homes.
Higher interest rates have been a factor that buyers are having to manage. Some buyers are getting creative with interest rate buy-downs to help ease their monthly payments. Experts predict that rates will decrease over the next 18 months making temporary rate buy-downs attractive.
As we finish out 2023, we anticipate inventory to remain tight and buyer demand to continue. Sellers who are deciding to cash in their equity now are finding success. If you are curious about how the real estate market relates to your goals, please reach out. It is my goal to help keep my clients informed and empower strong decisions.
QUARTERLY REPORTS Q2 2023


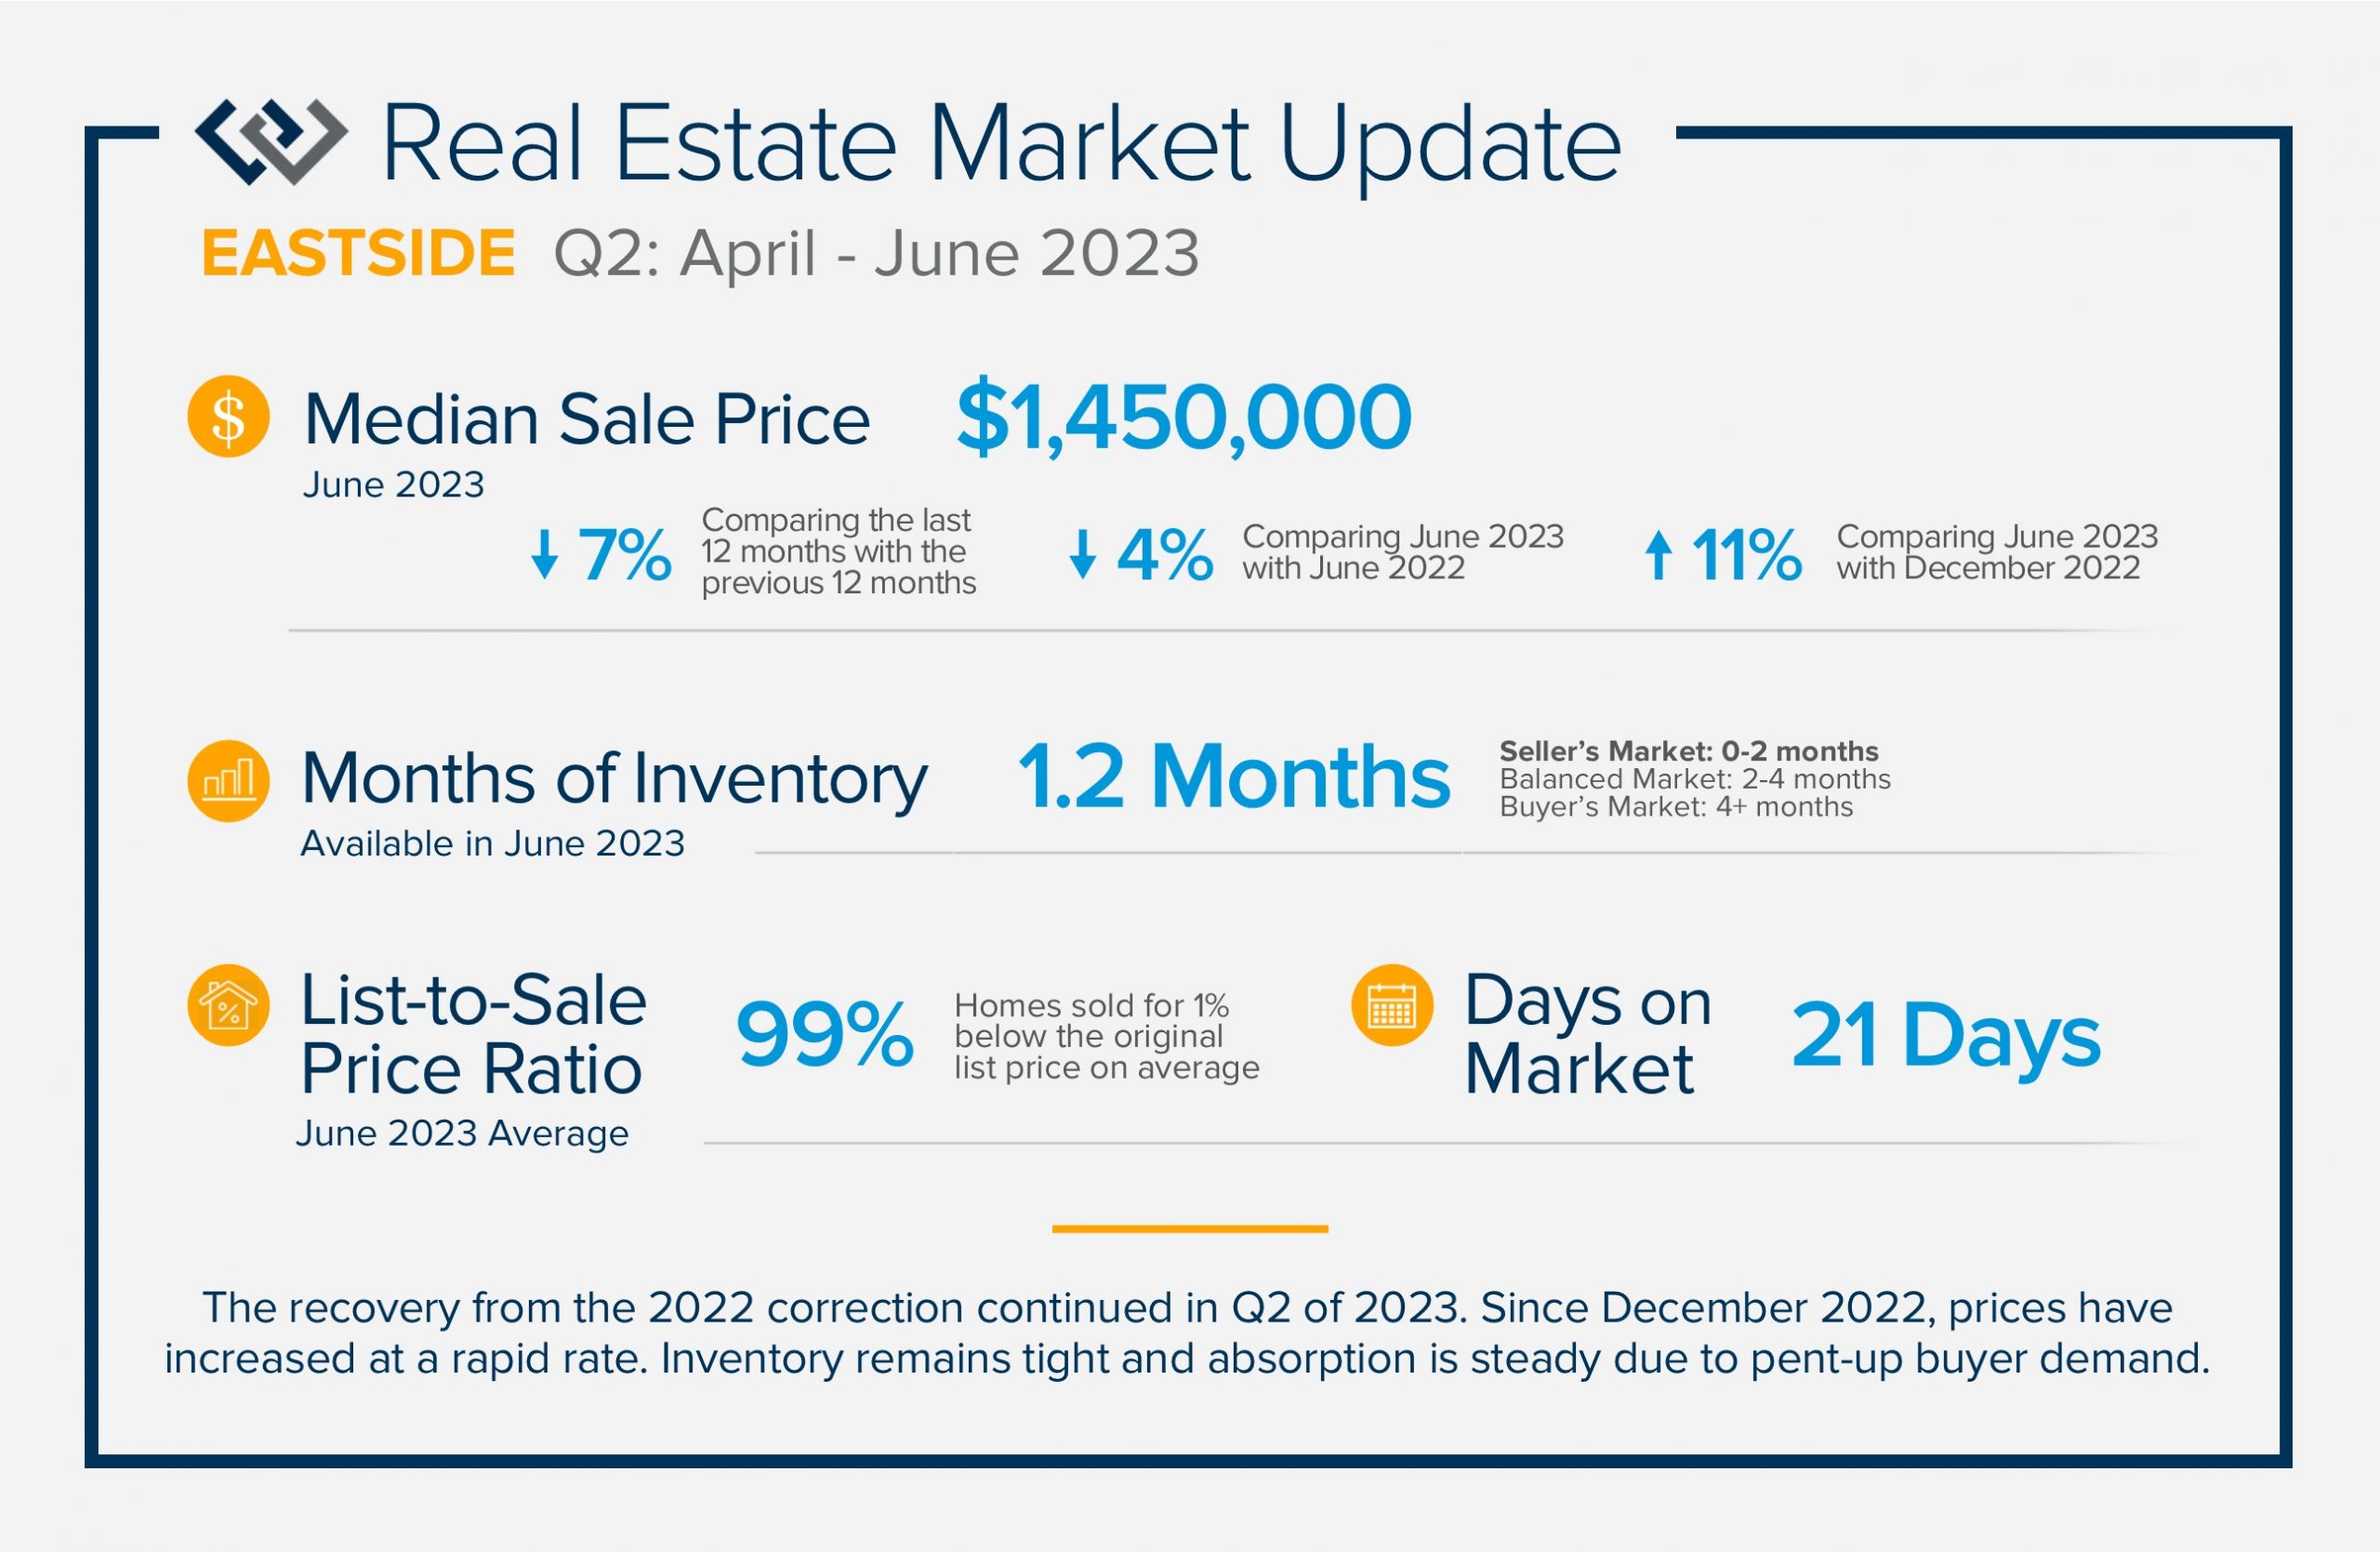
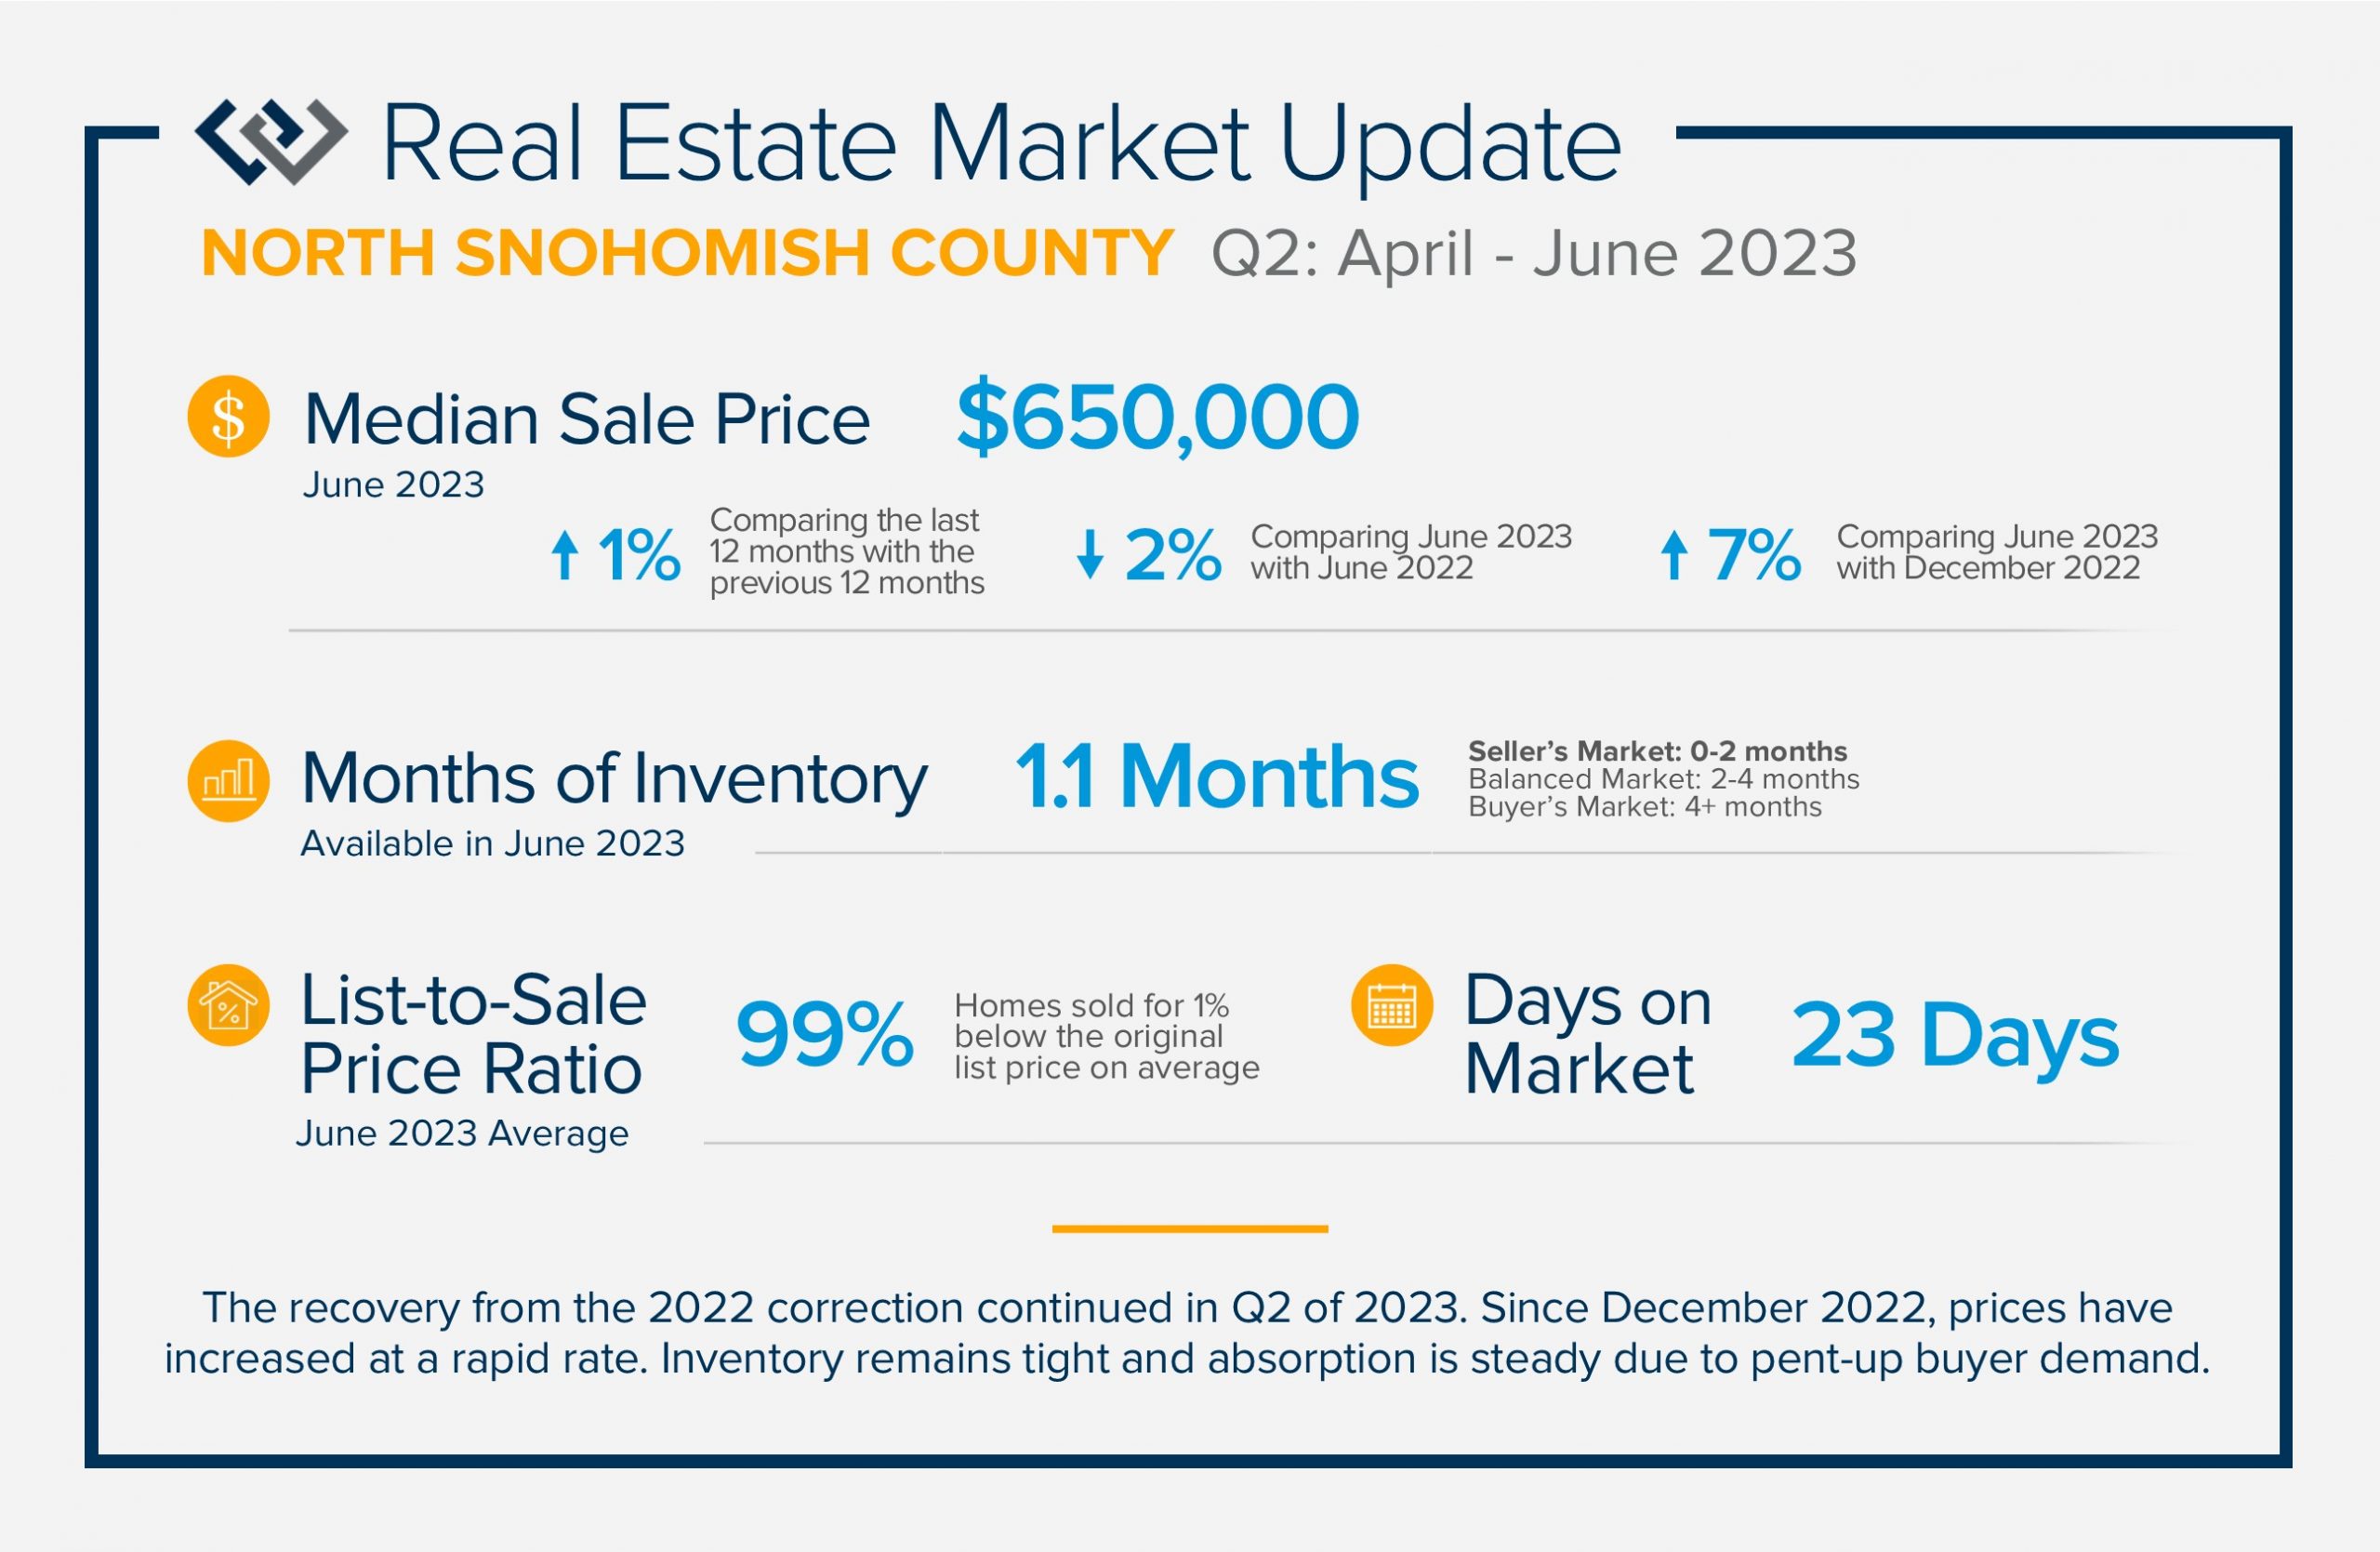
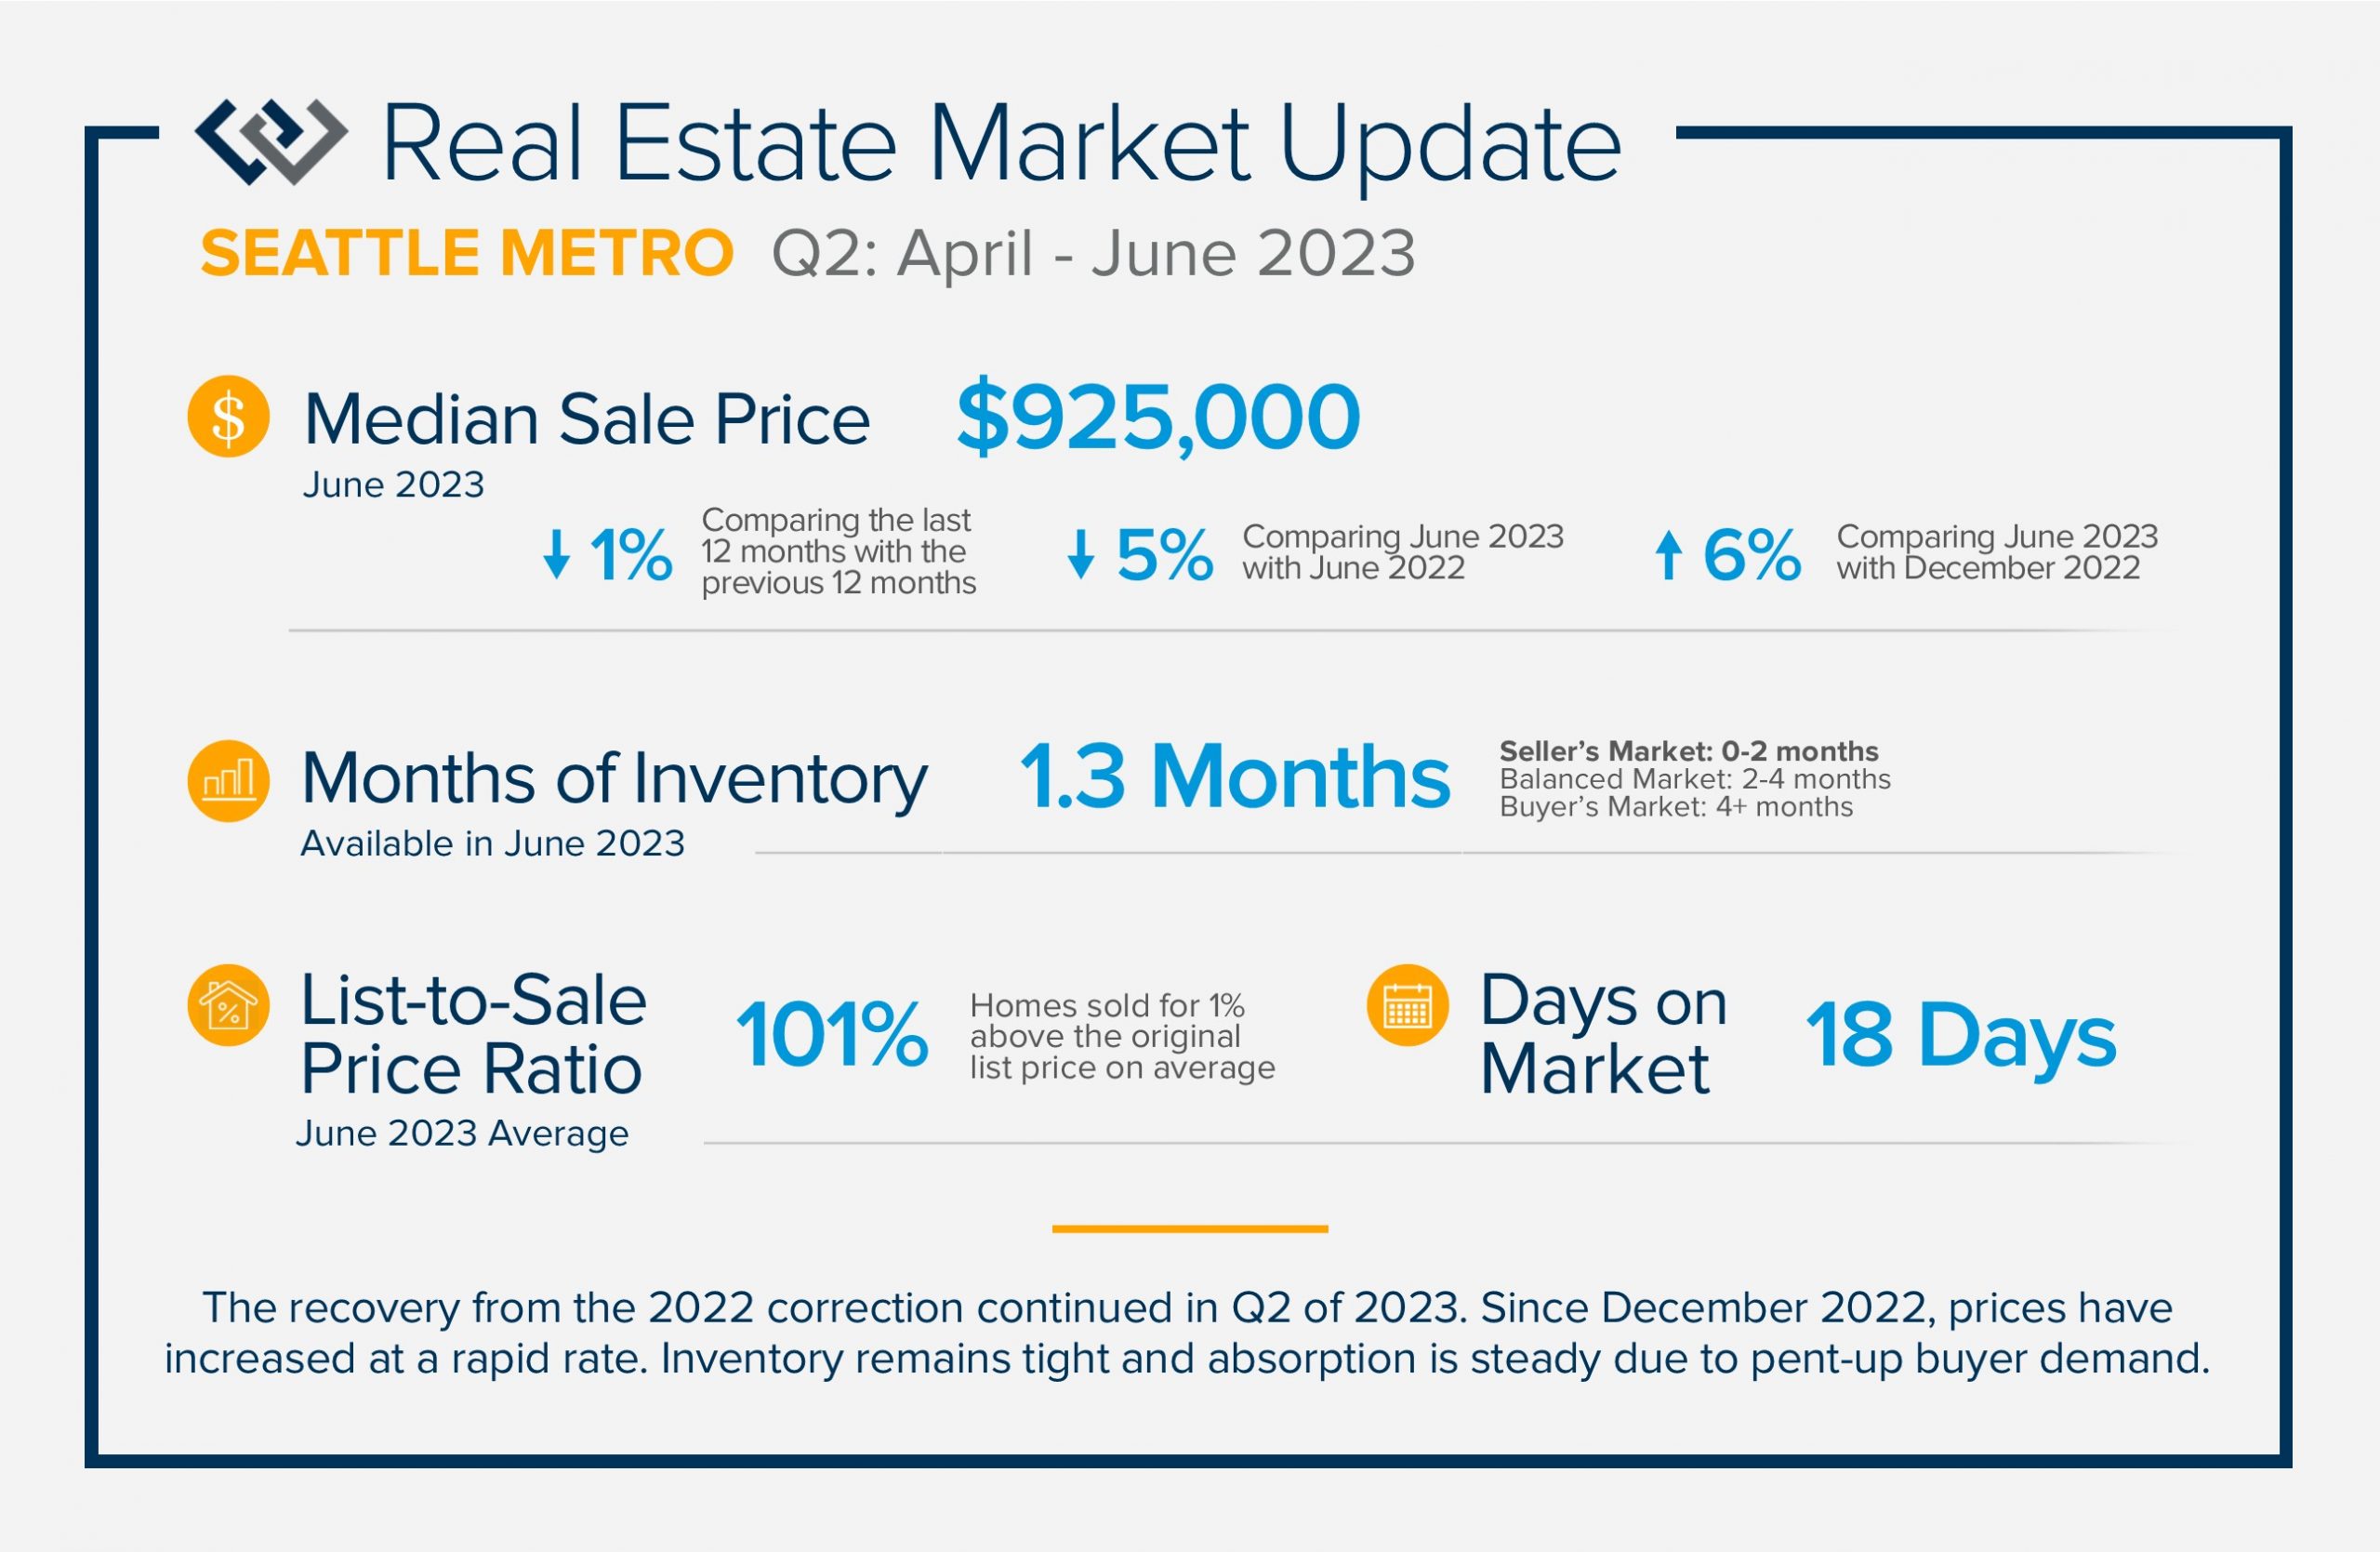
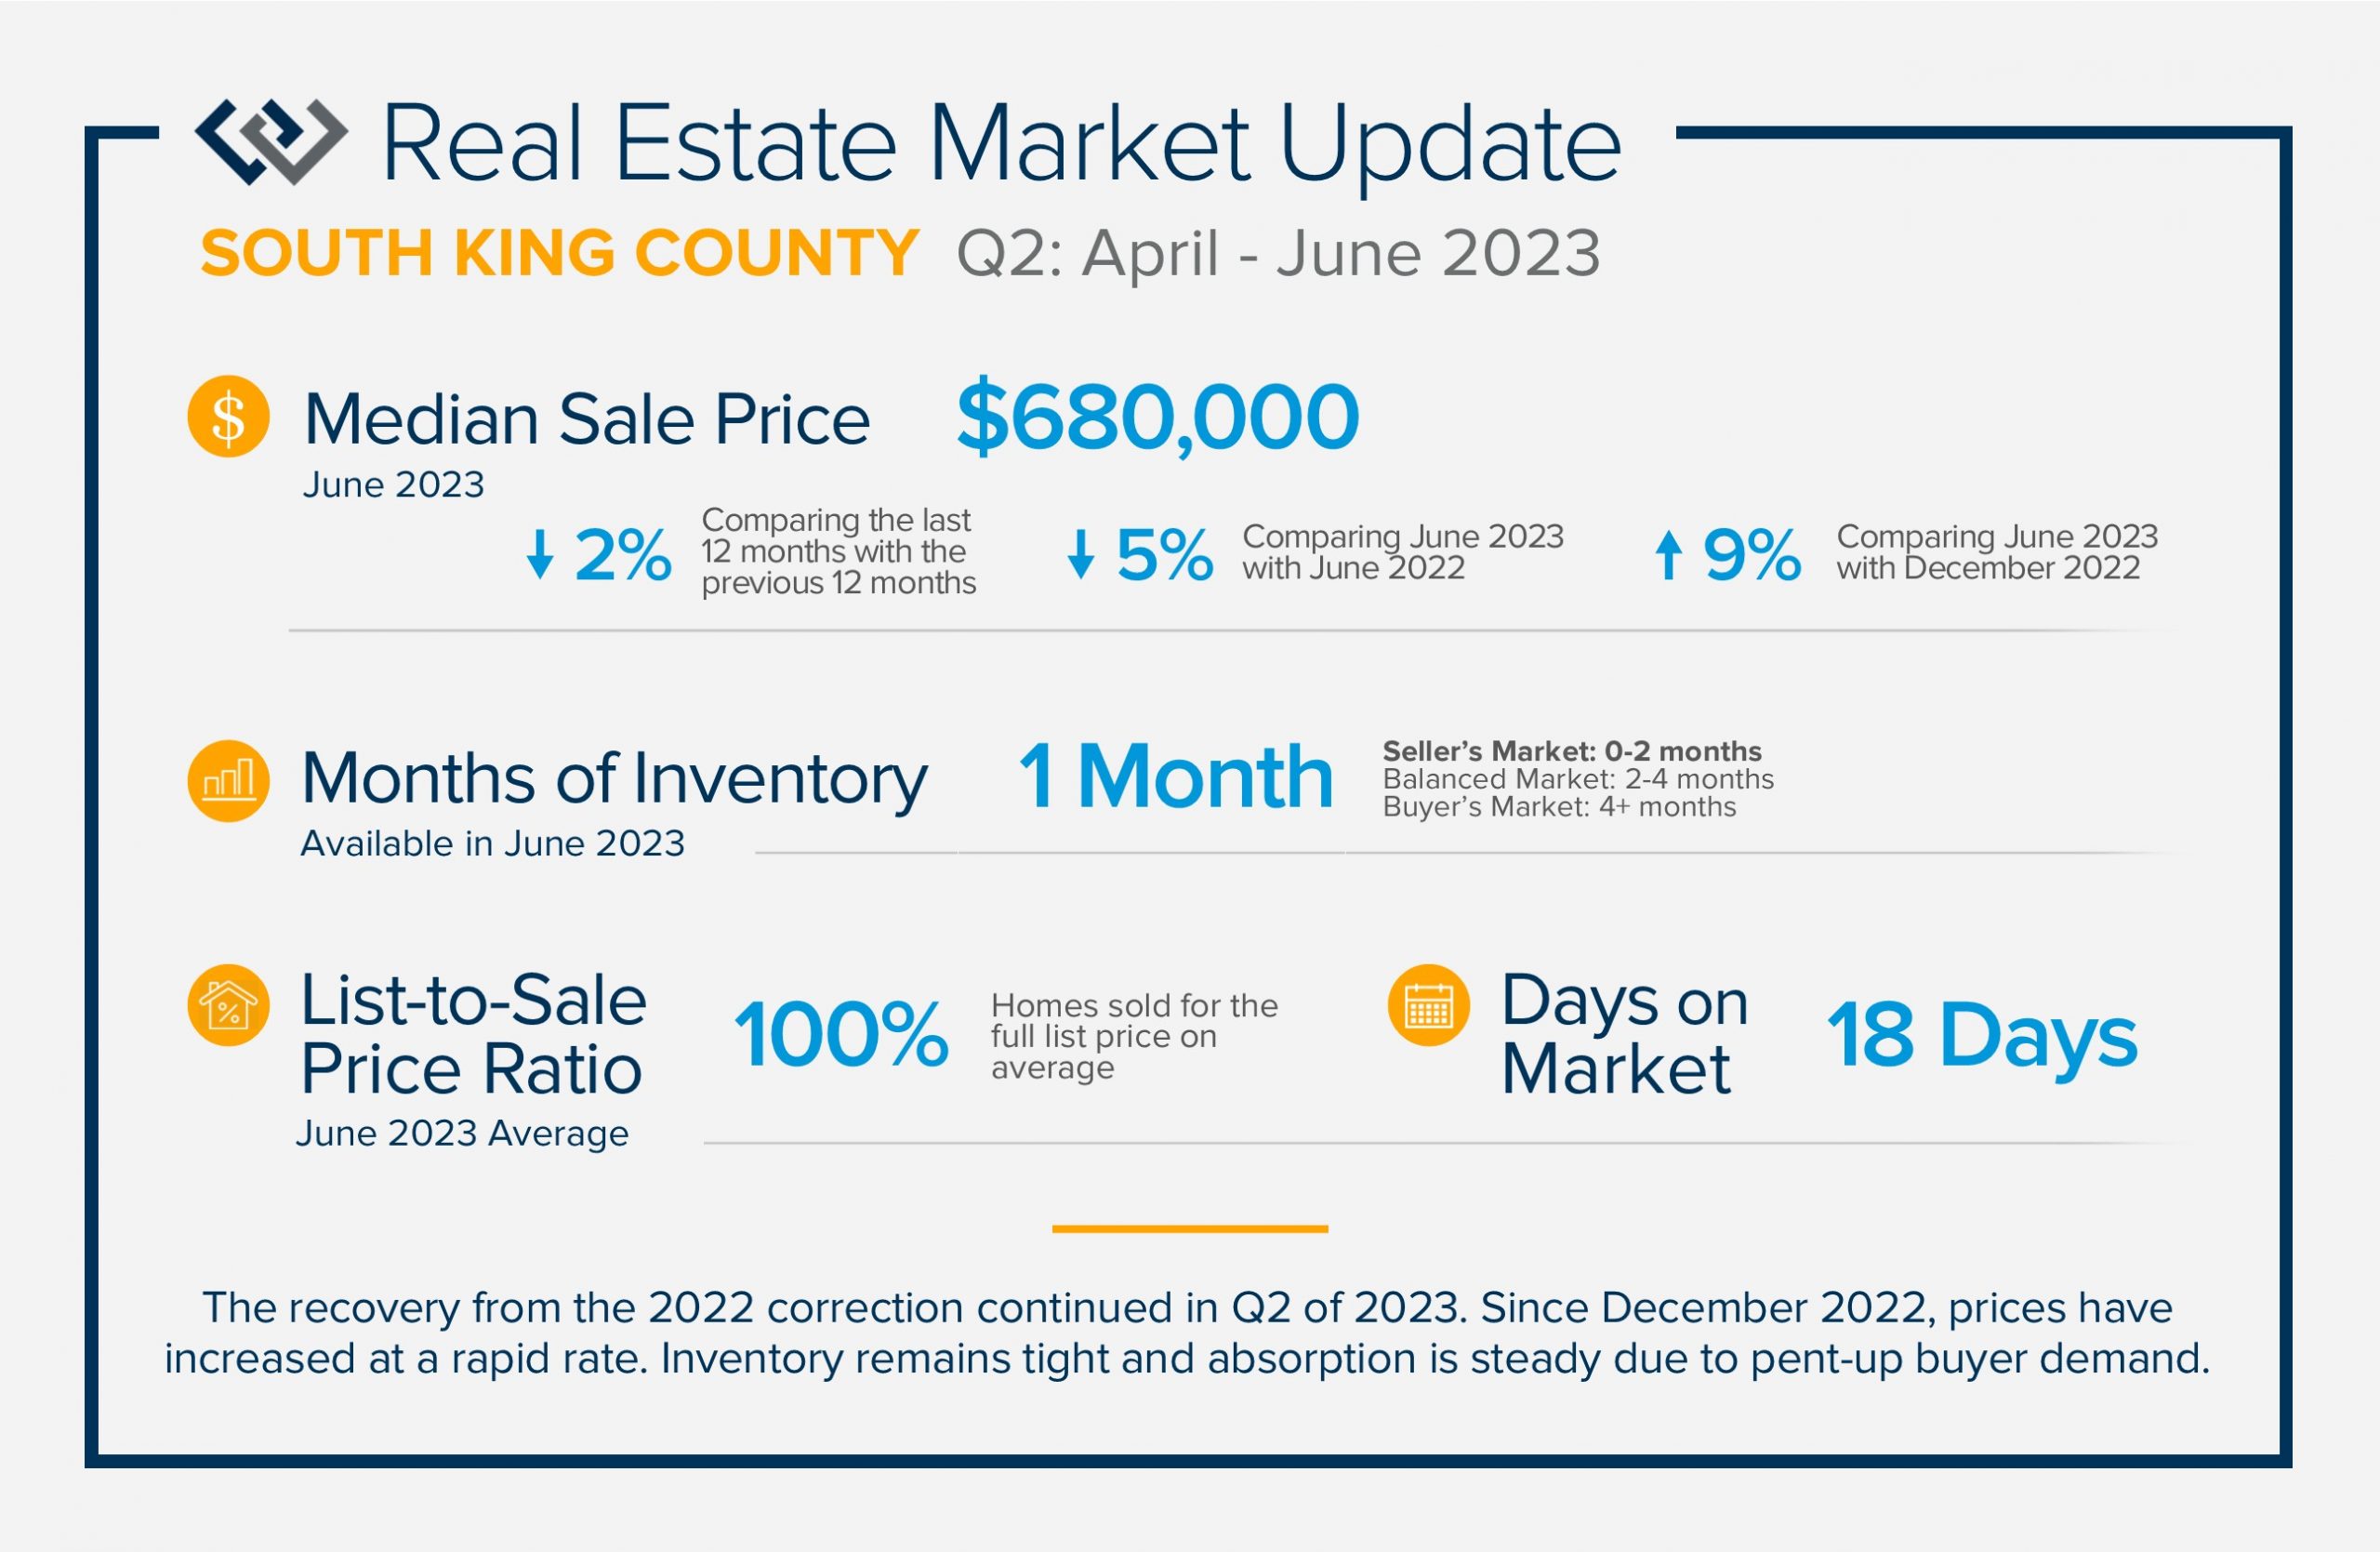
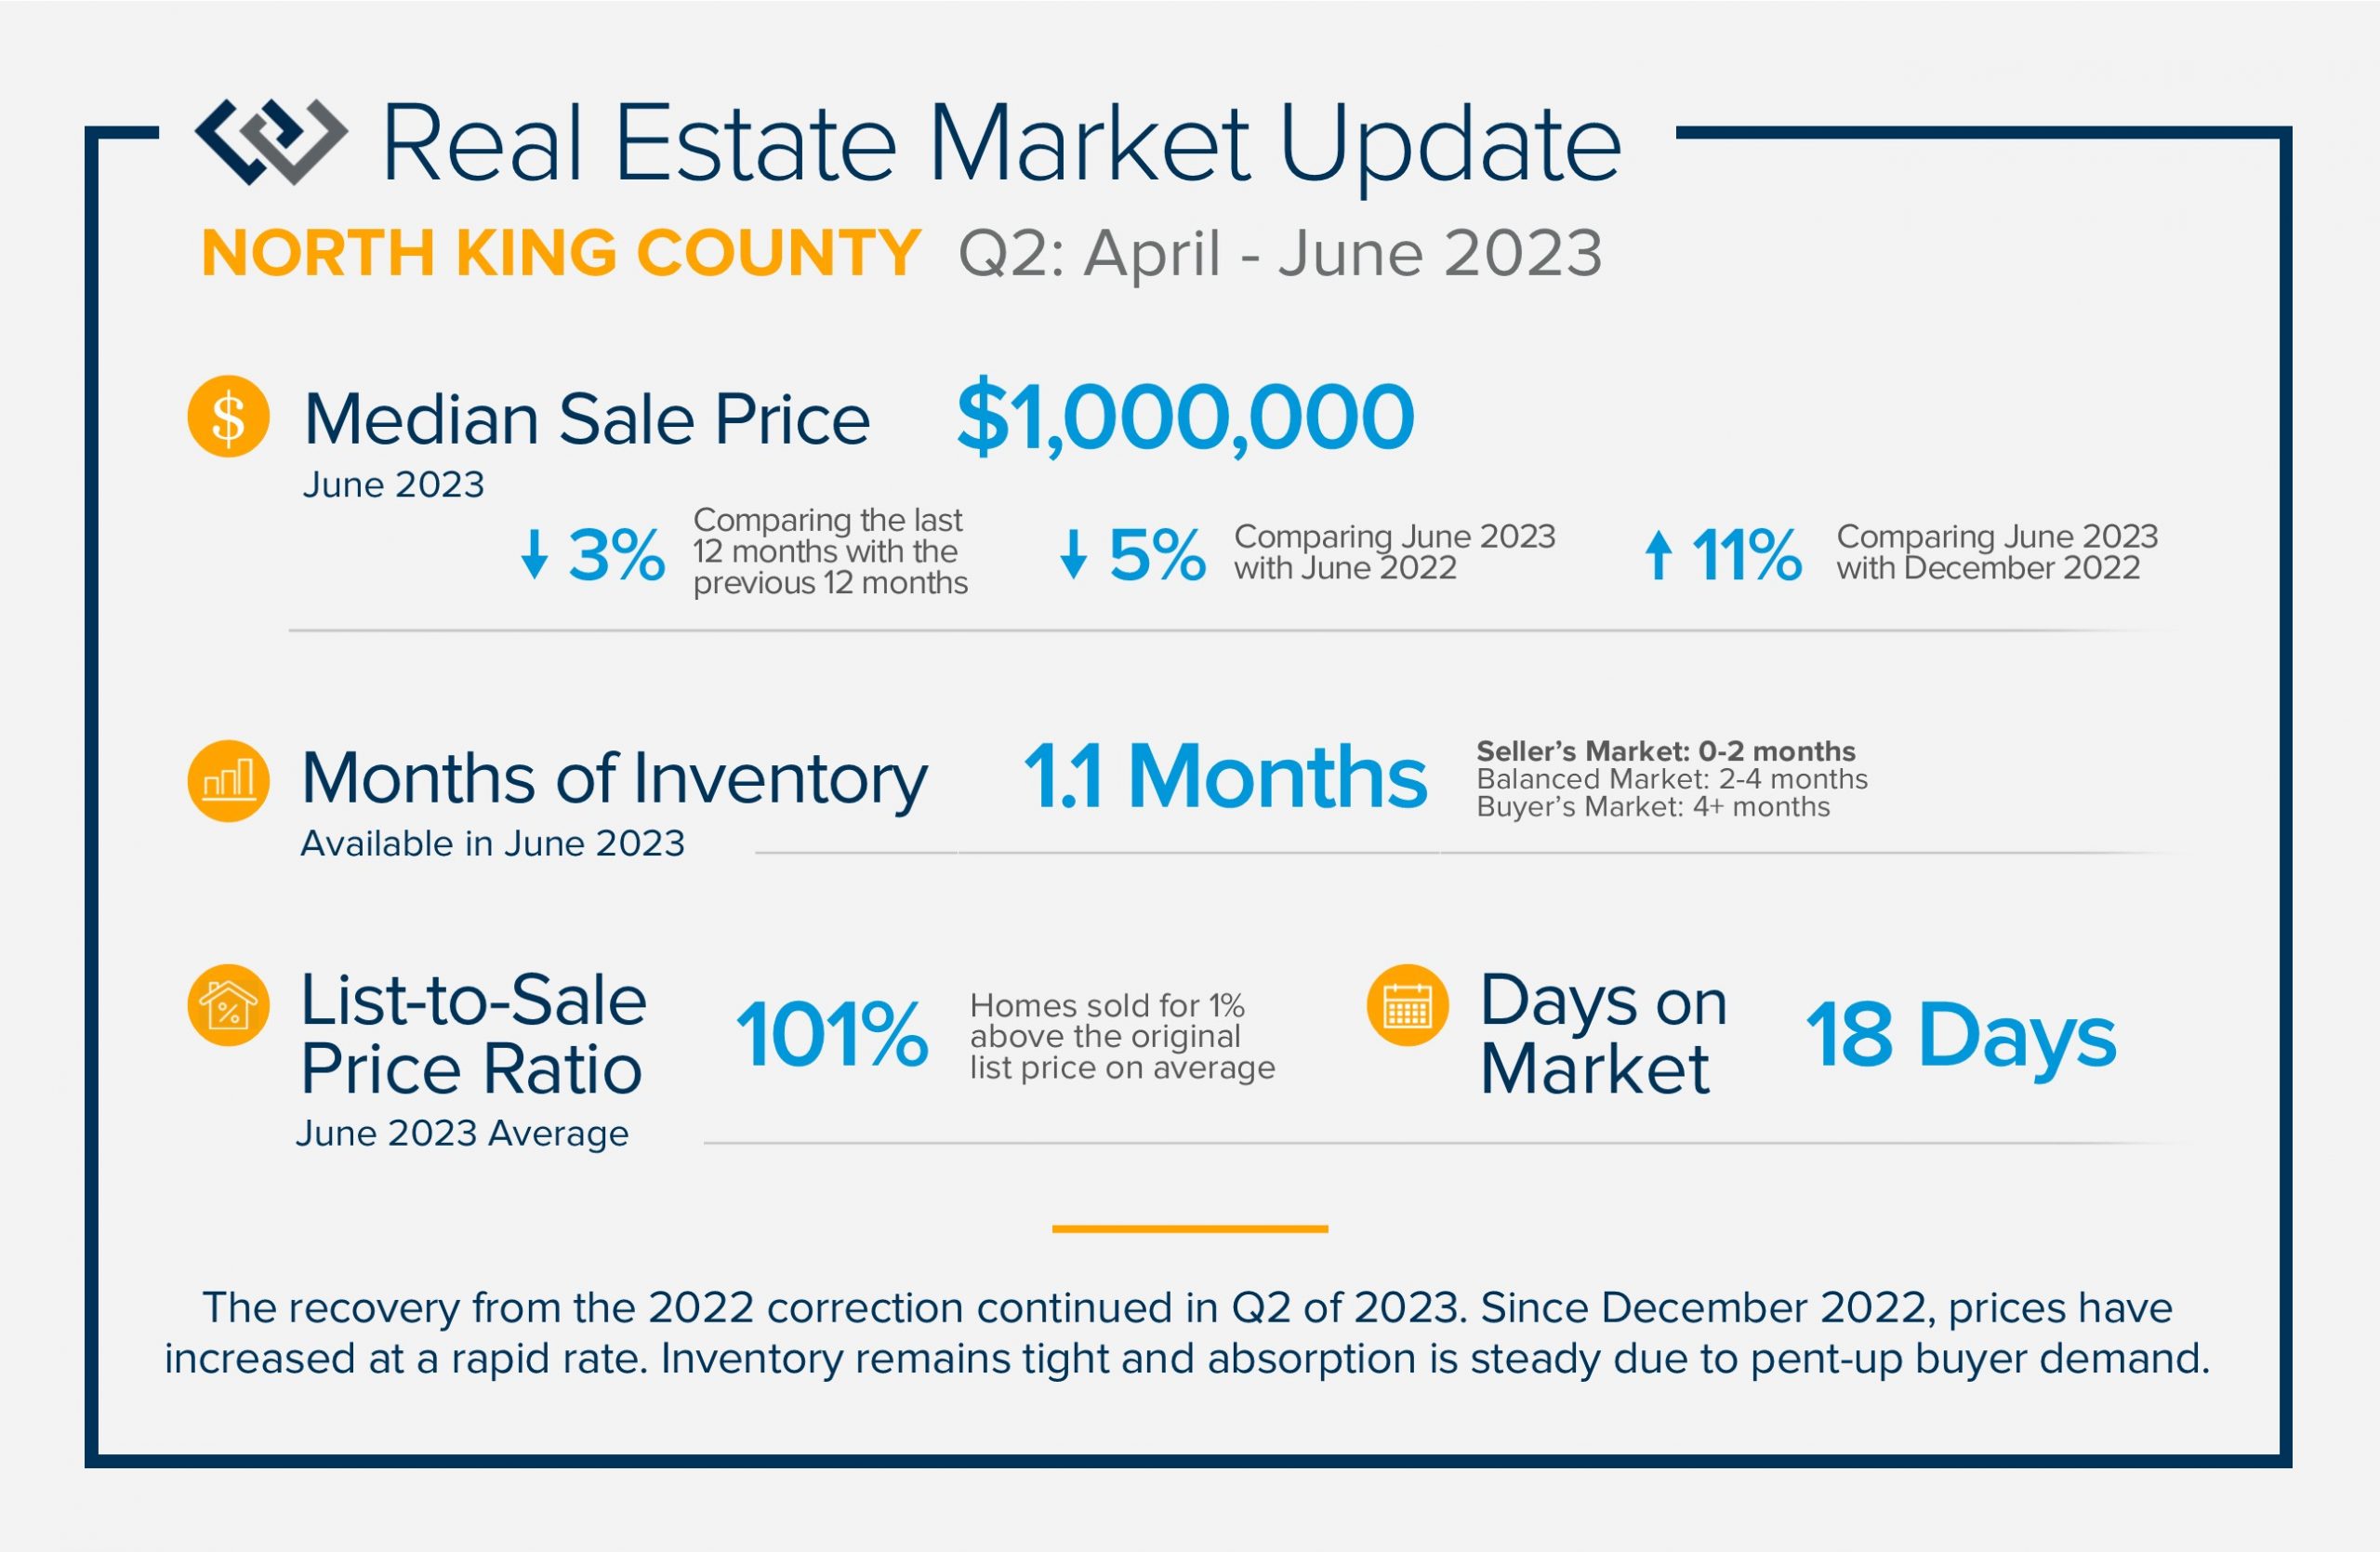 The recovery from the 2022 correction continued in Q2 of 2023. Since December 2022, prices have increased at a rapid rate. Inventory remains tight and absorption is steady due to pent-up buyer demand. Shorter days on market and healthy list-to-sale price ratios illustrate when a seller meets the market with appropriate pricing and is in good condition, a swift and successful sale is in store. Despite higher interest rates the market continues to churn. Rates are anticipated to come down, and when they do competition will increase.
If you are curious about how the trends relate to your goals, please reach out. It is my goal to keep my clients well-informed to empower strong decisions.
Exploring Lynnwood: Community Events
From lively festivals to engaging cultural celebrations, Lynnwood offers a wide range of events that bring the community together and foster a sense of camaraderie among residents and visitors alike. Whether you're looking to sample local cuisine, enjoy live music, or learn about the area's rich history and culture, there's something for everyone in Lynnwood's bustling event scene. Join us as we take a closer look at some of the most exciting community events coming up.
April 29th | Earth Day Drive Thru
Location: Lynnwood Operations & Maintenance Center
Time: 9am to 11am
Free compost (self-serve), free shredding service (up to 2 boxes per car), Rain barrels (must be preordered on the website). Lynnwood residents only.
May 29th | Memorial Day Ceremony
Location: Veterans Park
Time: 11am
A ceremony that includes music, laying of the wreath, and a rifle salute; remembering those who have died in service to our country.
June 3rd | Cops & Kids
Location: Alderwood Mall Terraces
Time: 10am to 1pm
Meet members of the Lynnwood Police Department, up close tours of police vehicles, Police K-9 demonstrations, free prizes and giveaways
June 10th | E-Waste & Styrofoam Collection
Location: Lynnwood Operations & Maintenance Center
Time: 10am to 12pm
Electronic waste (see website for accepted items) and Styrofoam (must be clean, all tape and stickers removed) collection.
June 10th | History & Heritage Days
Location: Heritage Park
Time: 10am to 2pm
Car 55 of the Seattle-Everett Interurban Trolley will be open to the public with tours available, and all buildings in Heritage Park will be open for visitors. Also on July 8th and August 12th.
June 24th | Water Safety Fair
Location: Lynnwood Recreation Center
Time: 9am to 11:15am
Fun & interactive event including boating safety, river safety, CPR, victim recognition & simple rescue techniques, cold water safety & more. Free Rec Swim for participants afterwards.
July 20th | Shakespeare in the Park
Location: Lynndale Park Amphitheatre
Time: 7pm to 9pm
Enjoy an evening of fun for the whole family at Lynndale Park this summer. July 20th will be The Tempest, July 27th will be Henry VI, Part 1 and August 3rd will be Romeo and Juliet.
September 9th | Fair on 44th
Location: 44th Ave W in front of Civic Campus
Time: 10am to 2pm
Each year, the city closes 44th Ave from 188th St SW to 194th St SW and fills the road with City Departments and community partners. There will be vehicle tours, demonstrations, and hands-on games and activities for families.
Find more events and activities at The City of Lynnwood.
QUARTERLY REPORTS Q1 2023
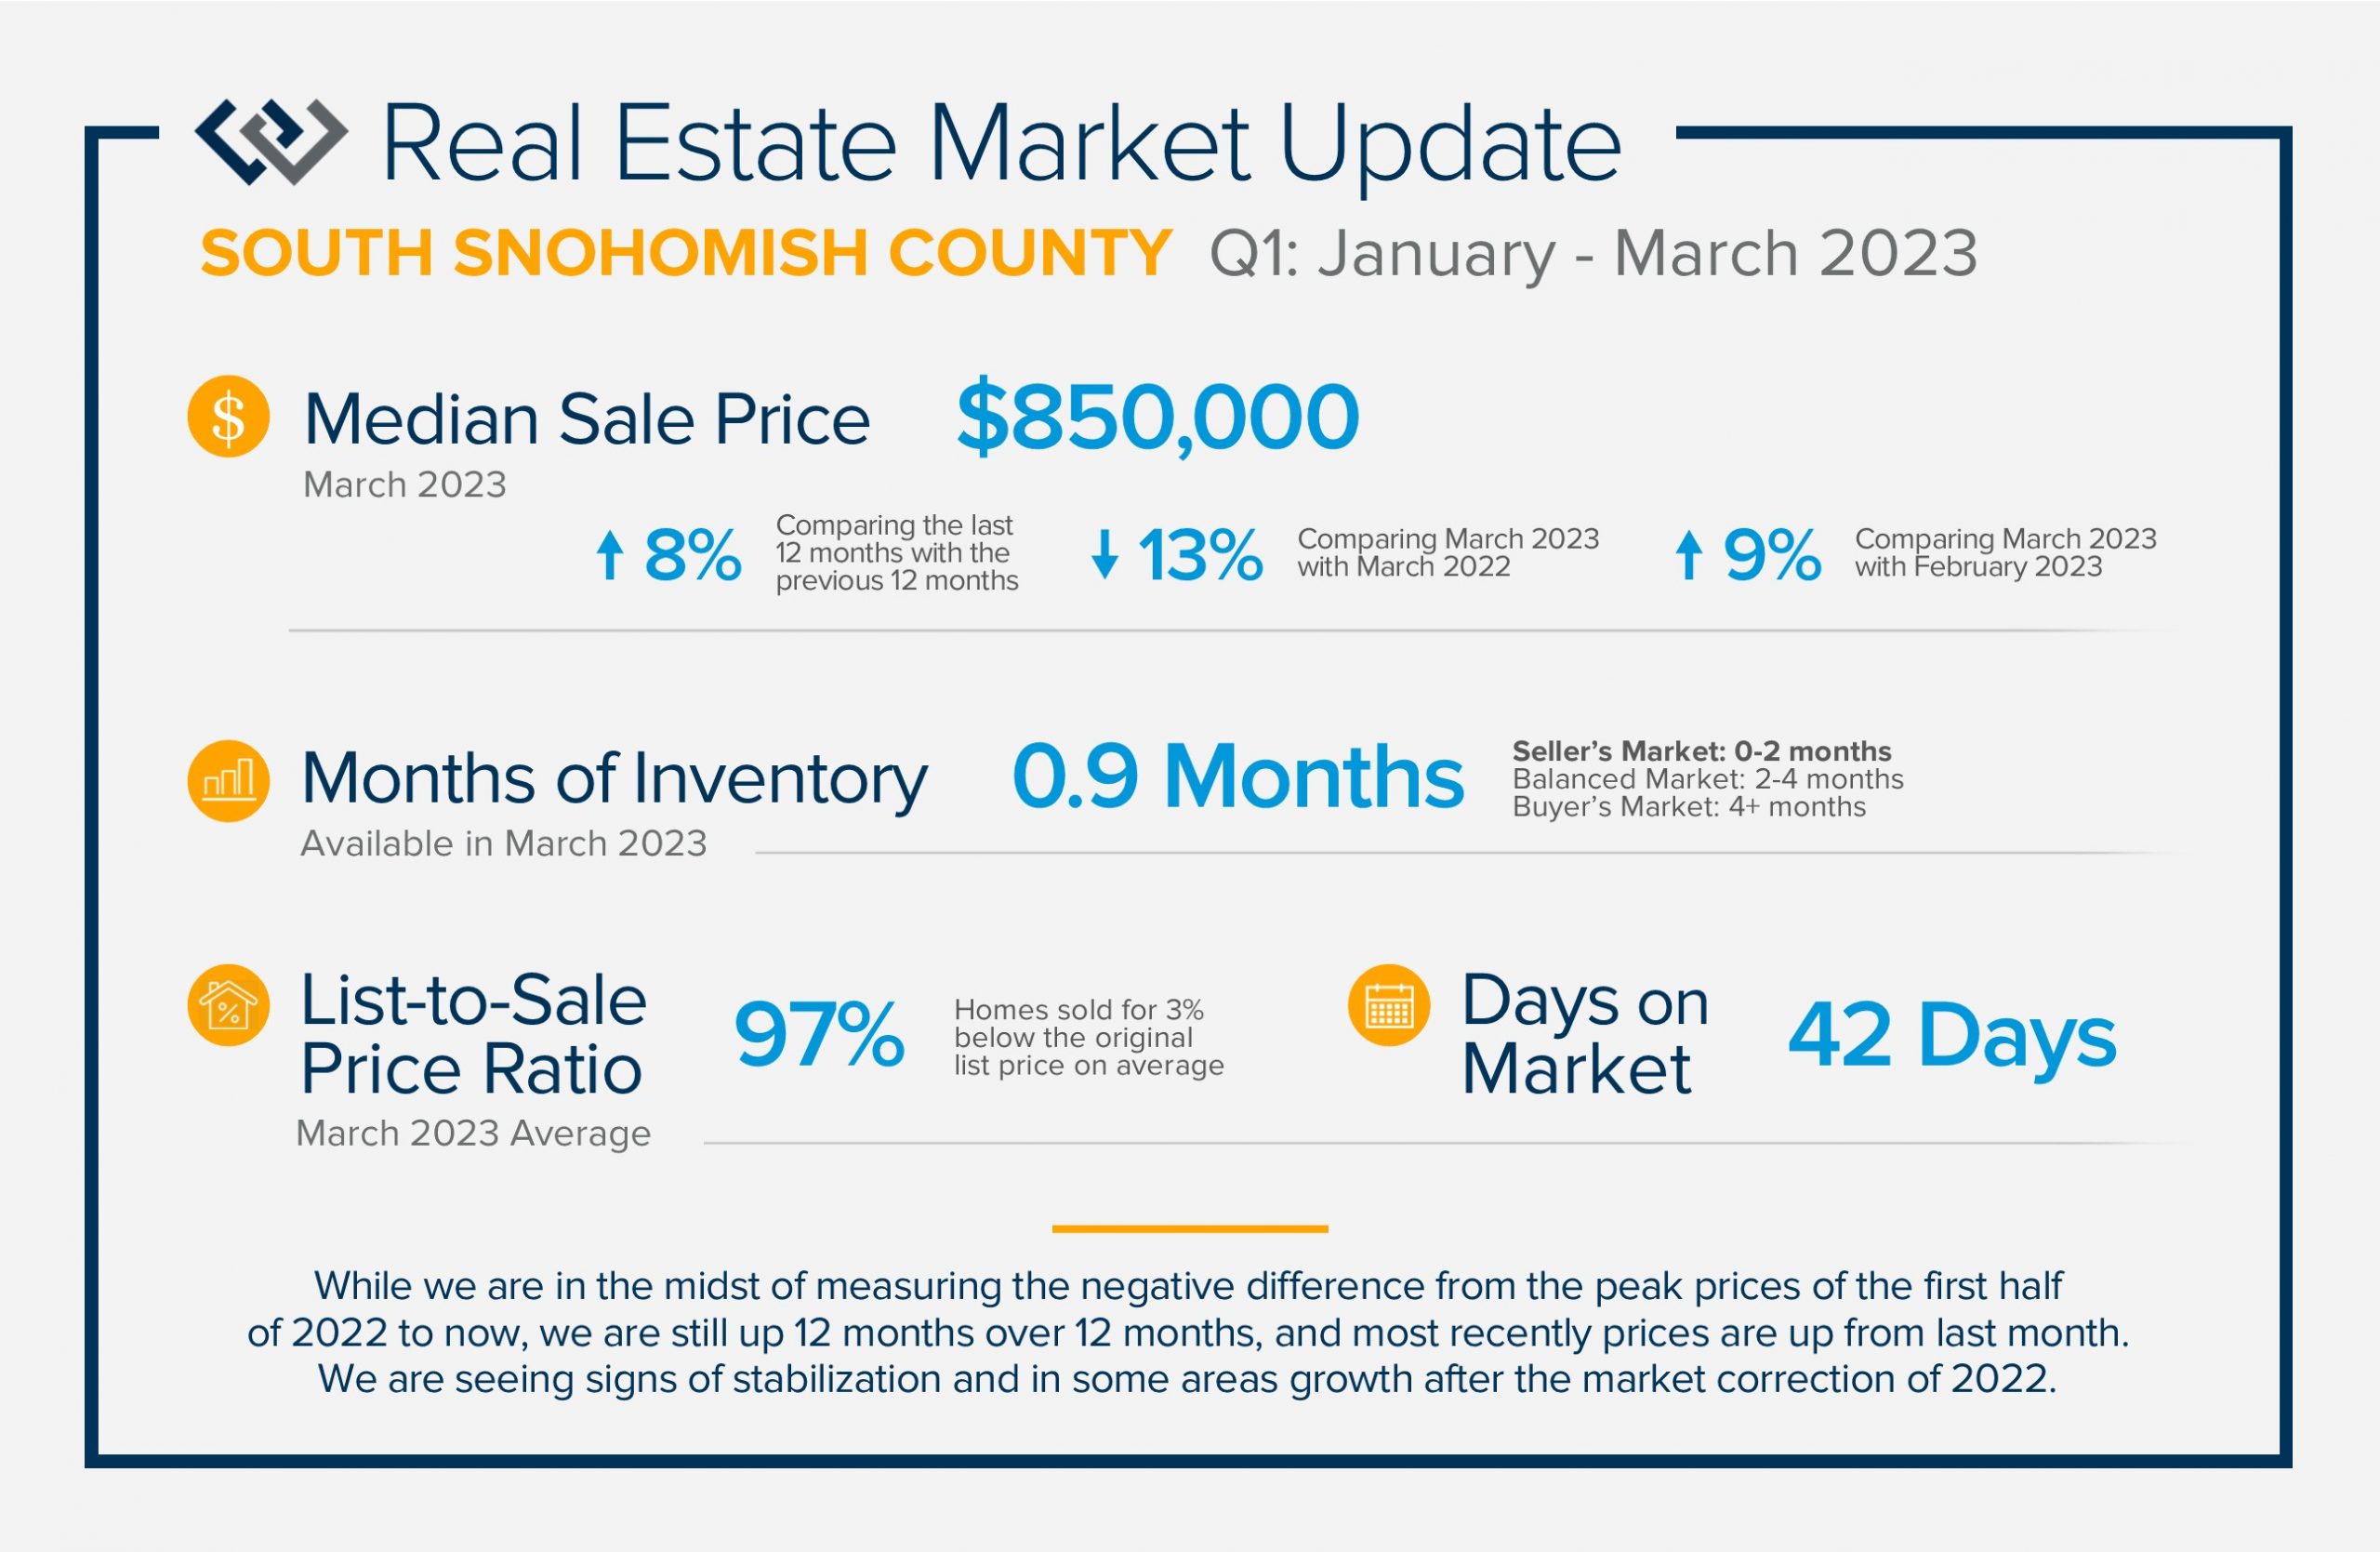
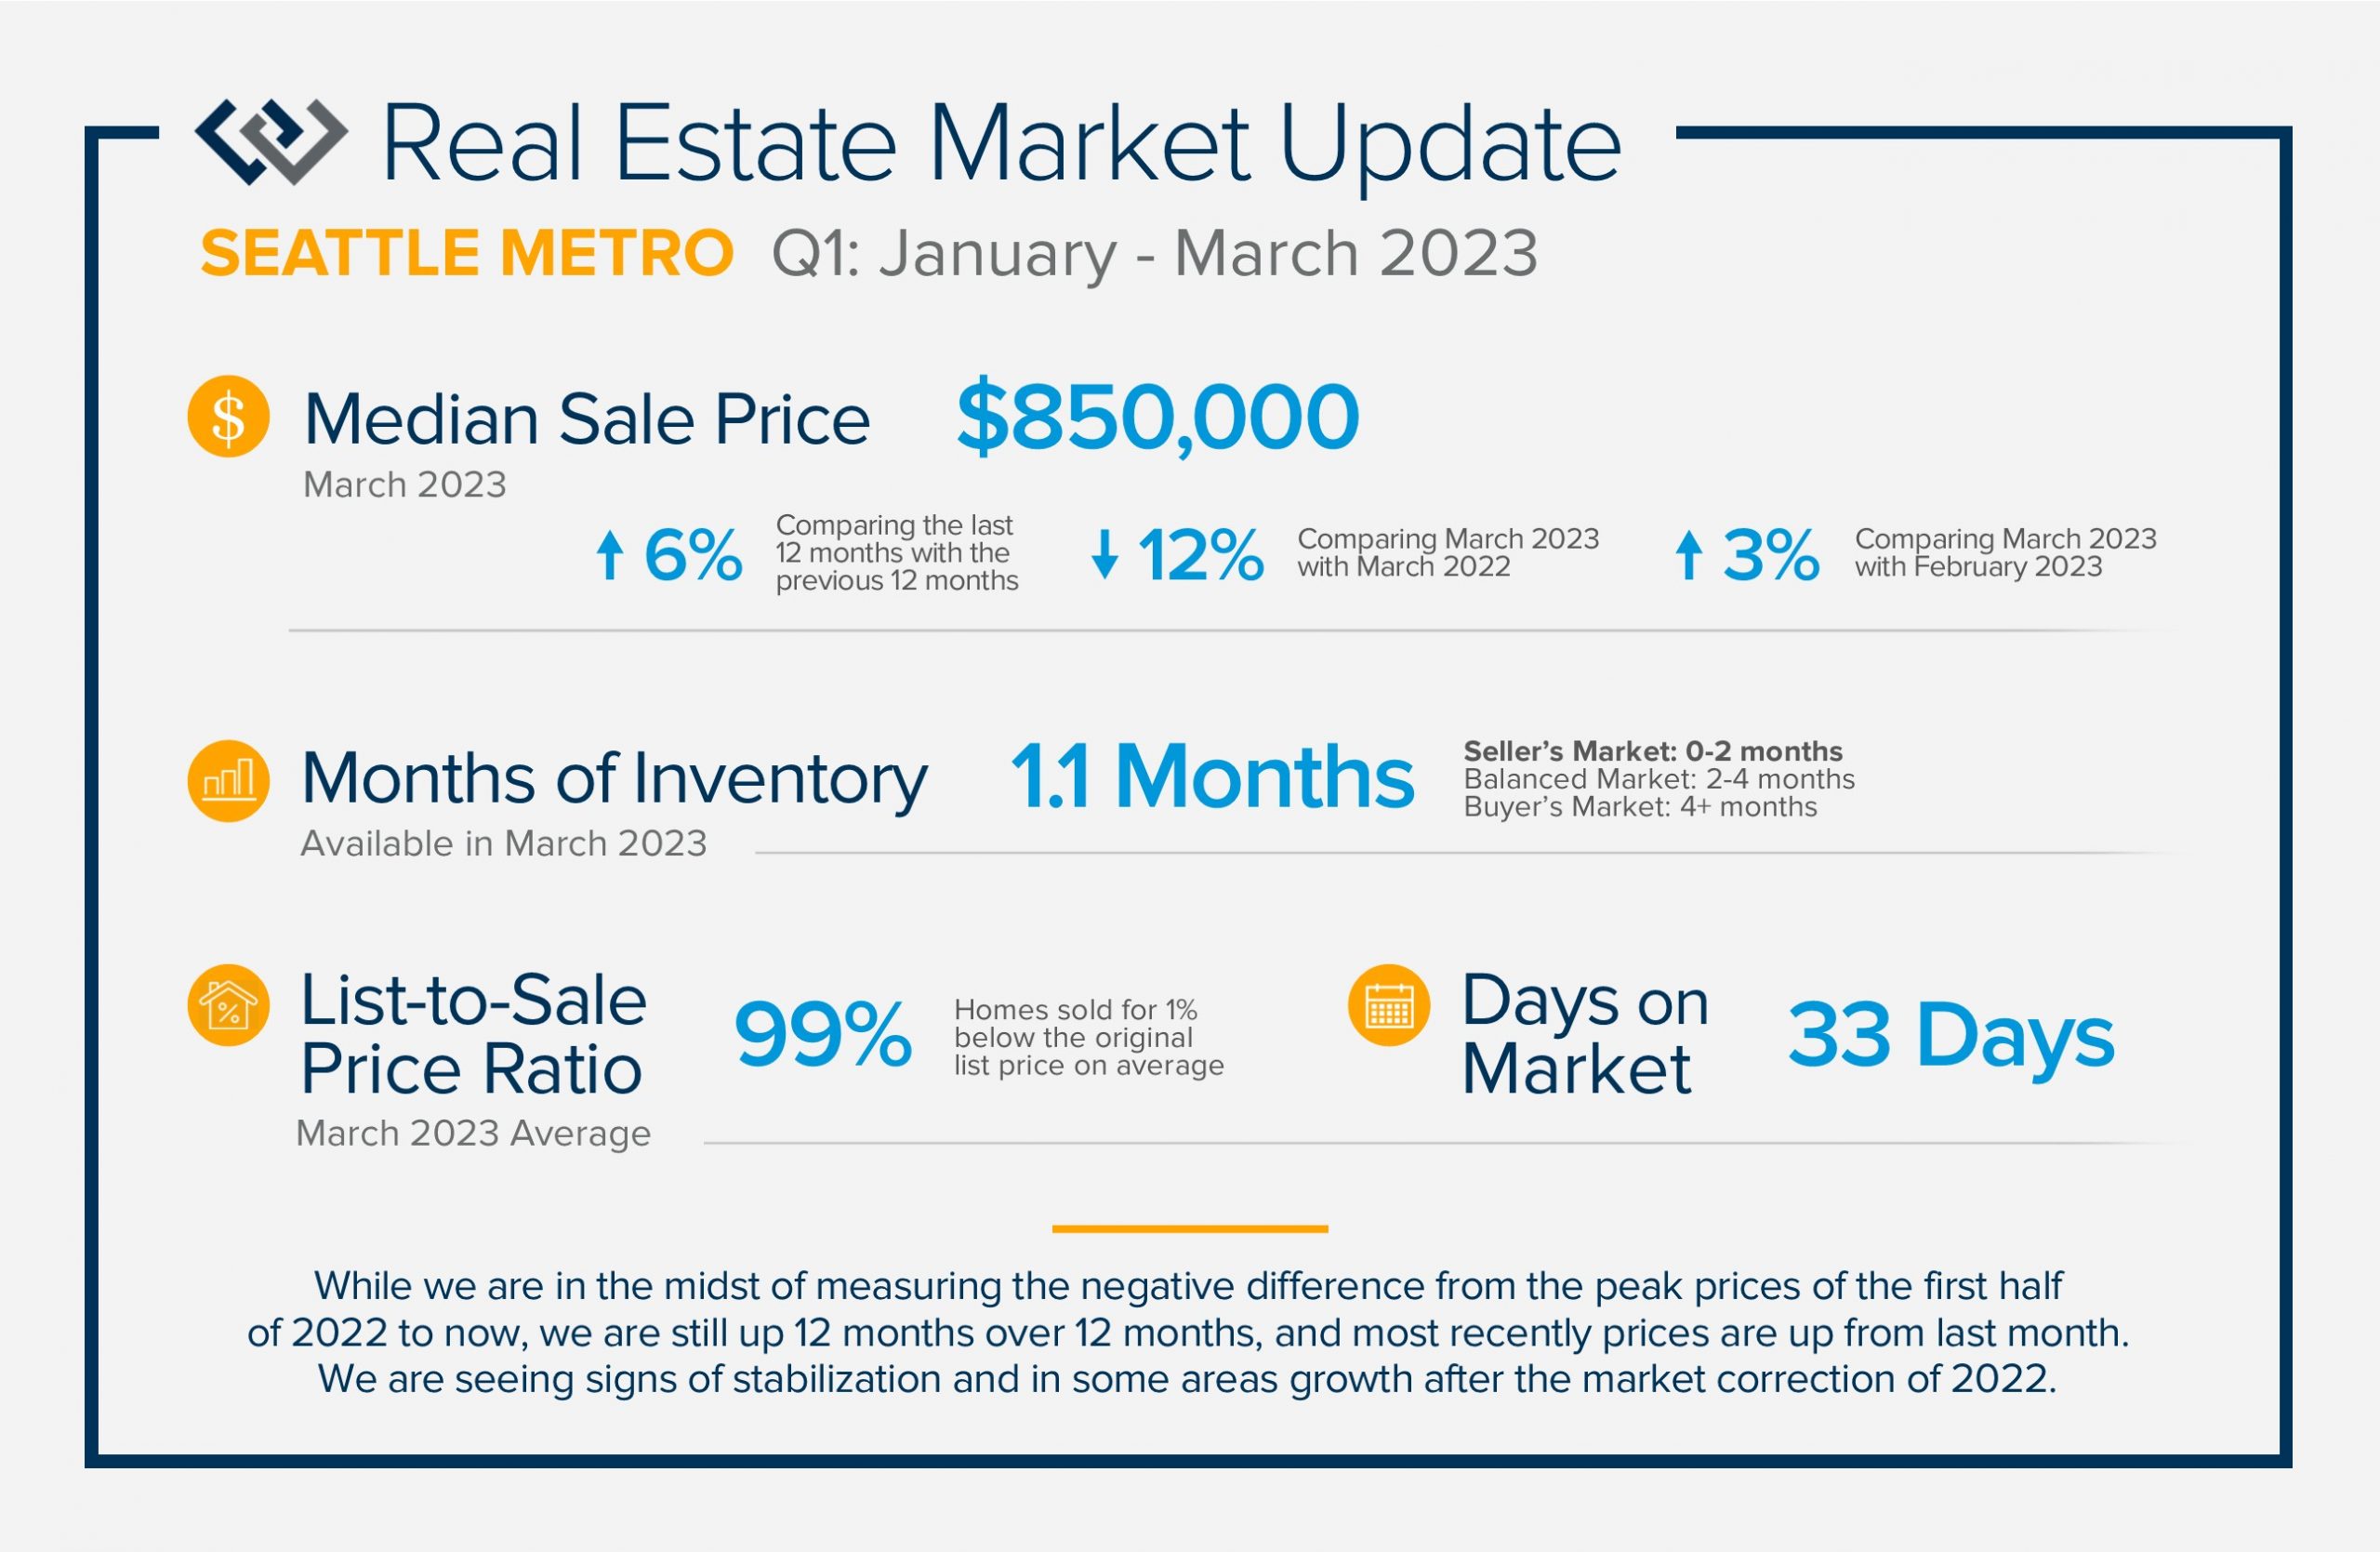
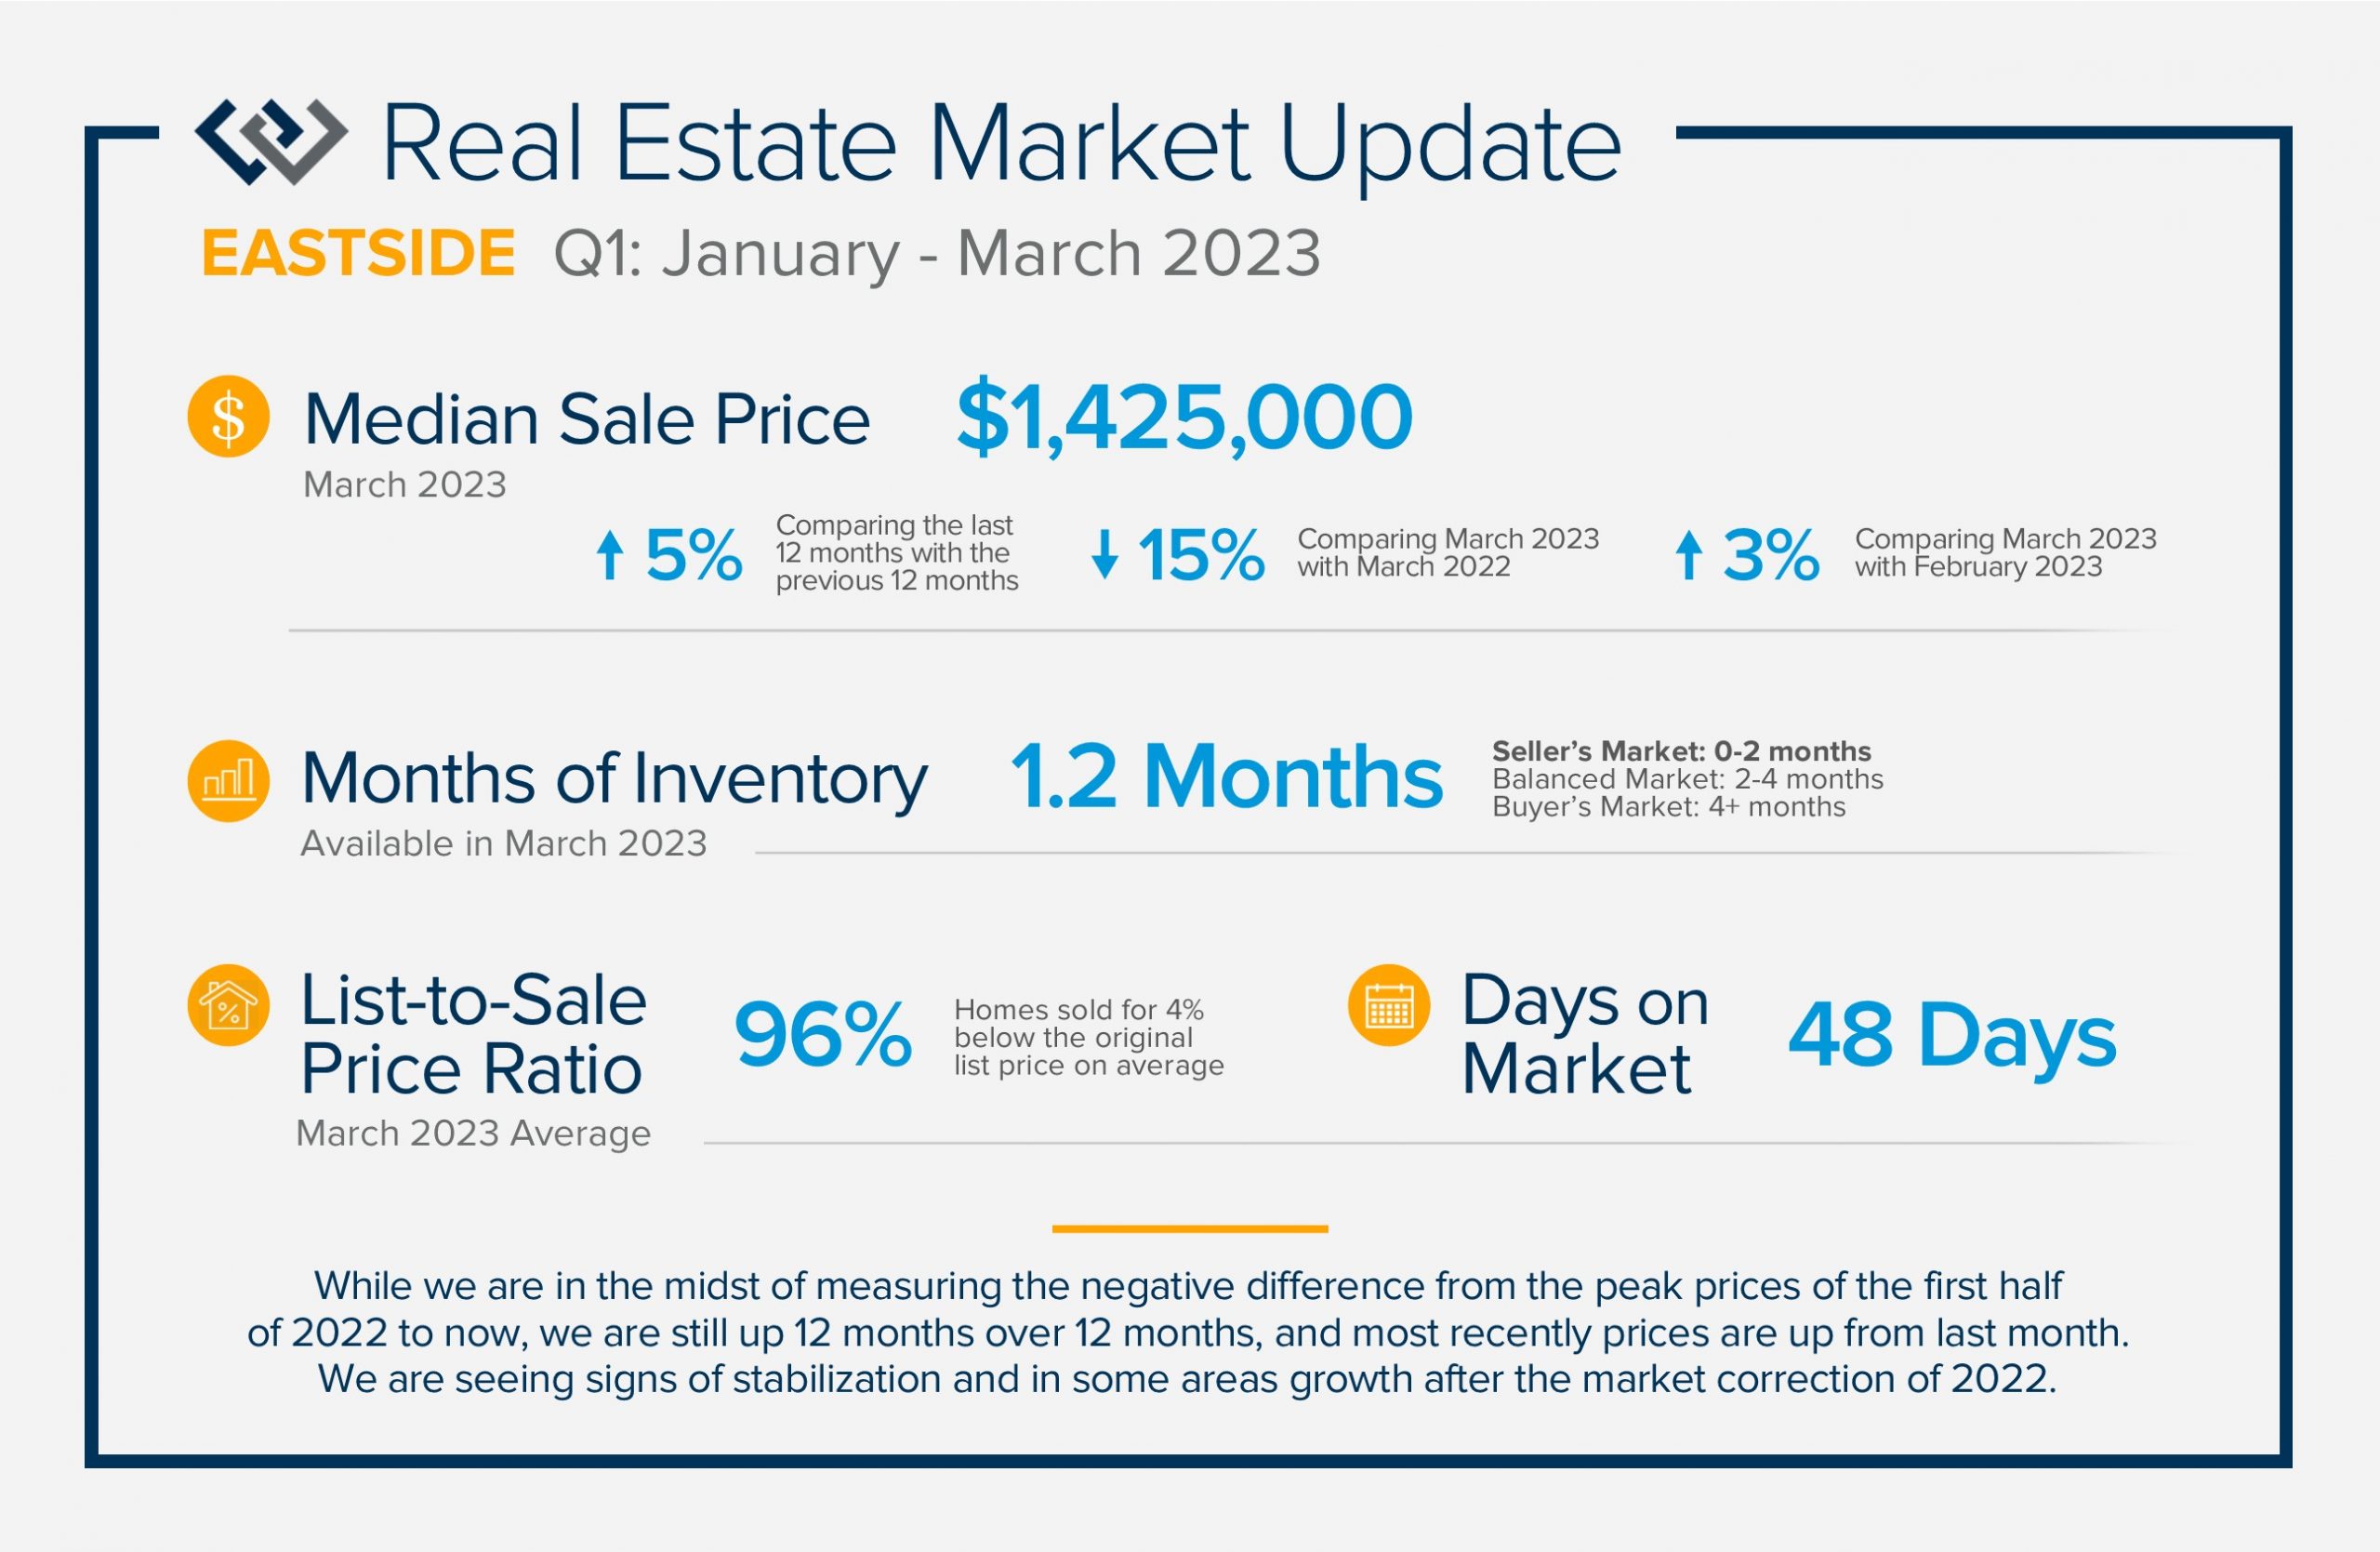
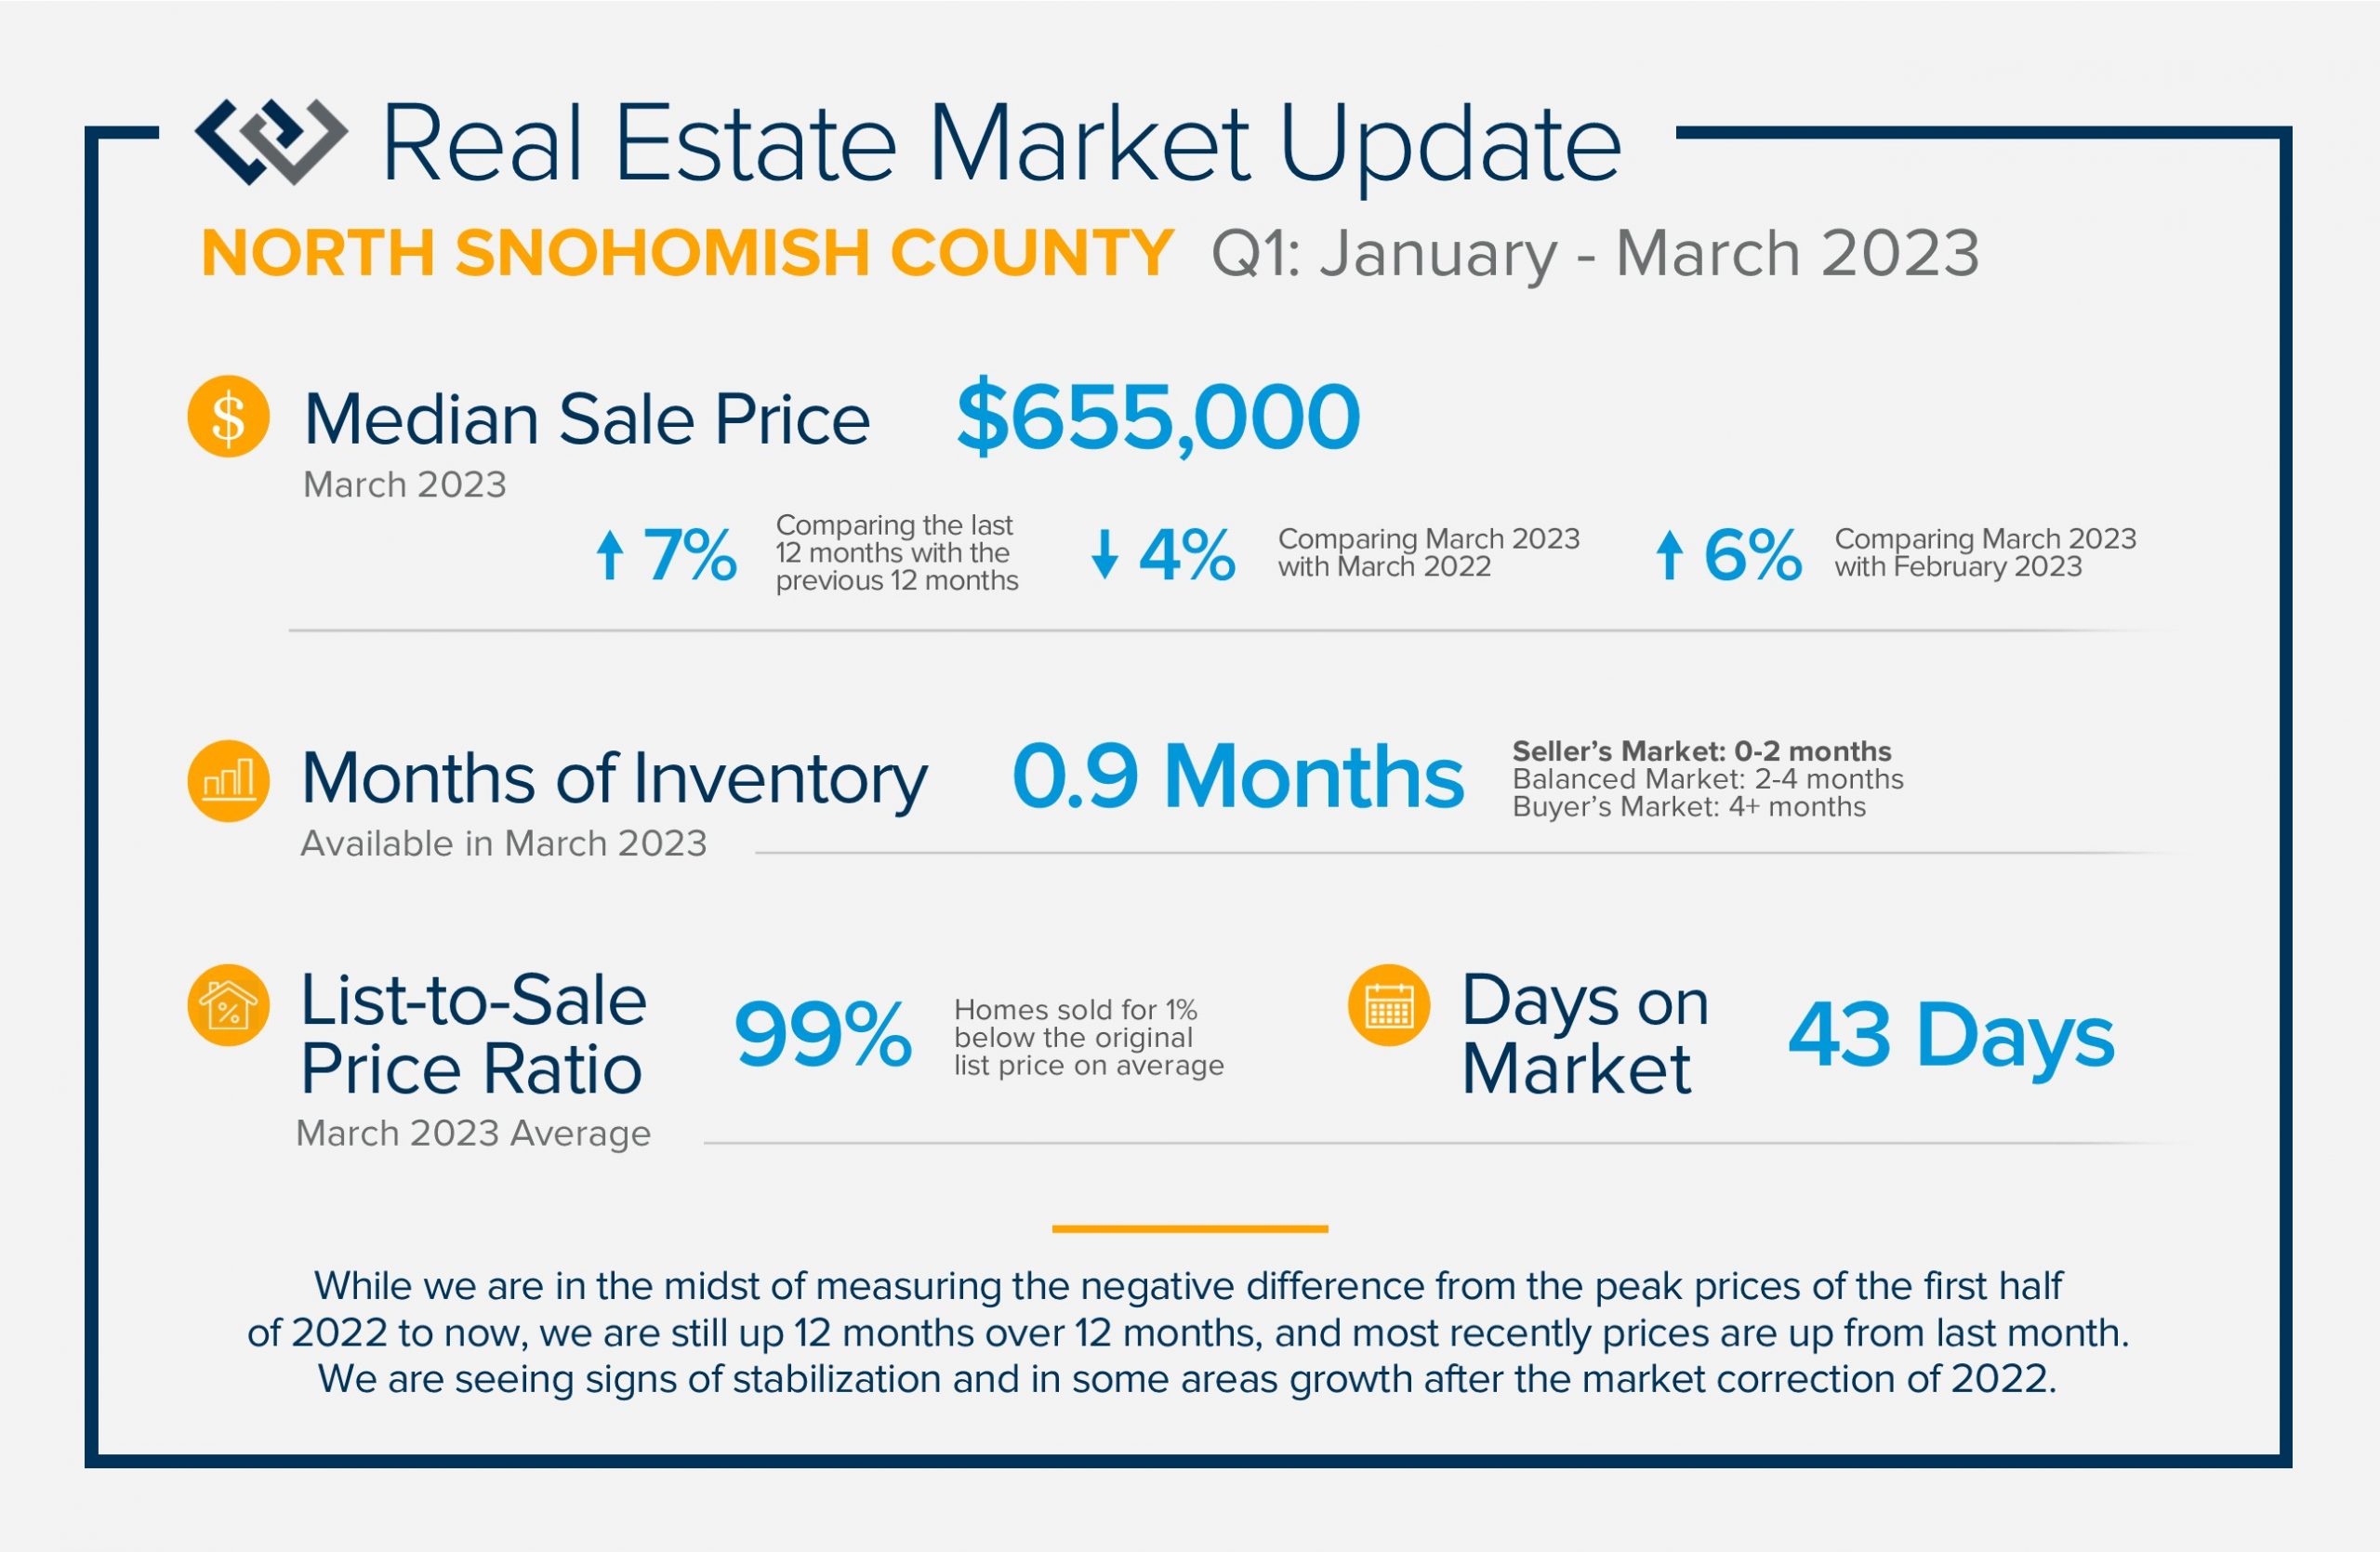
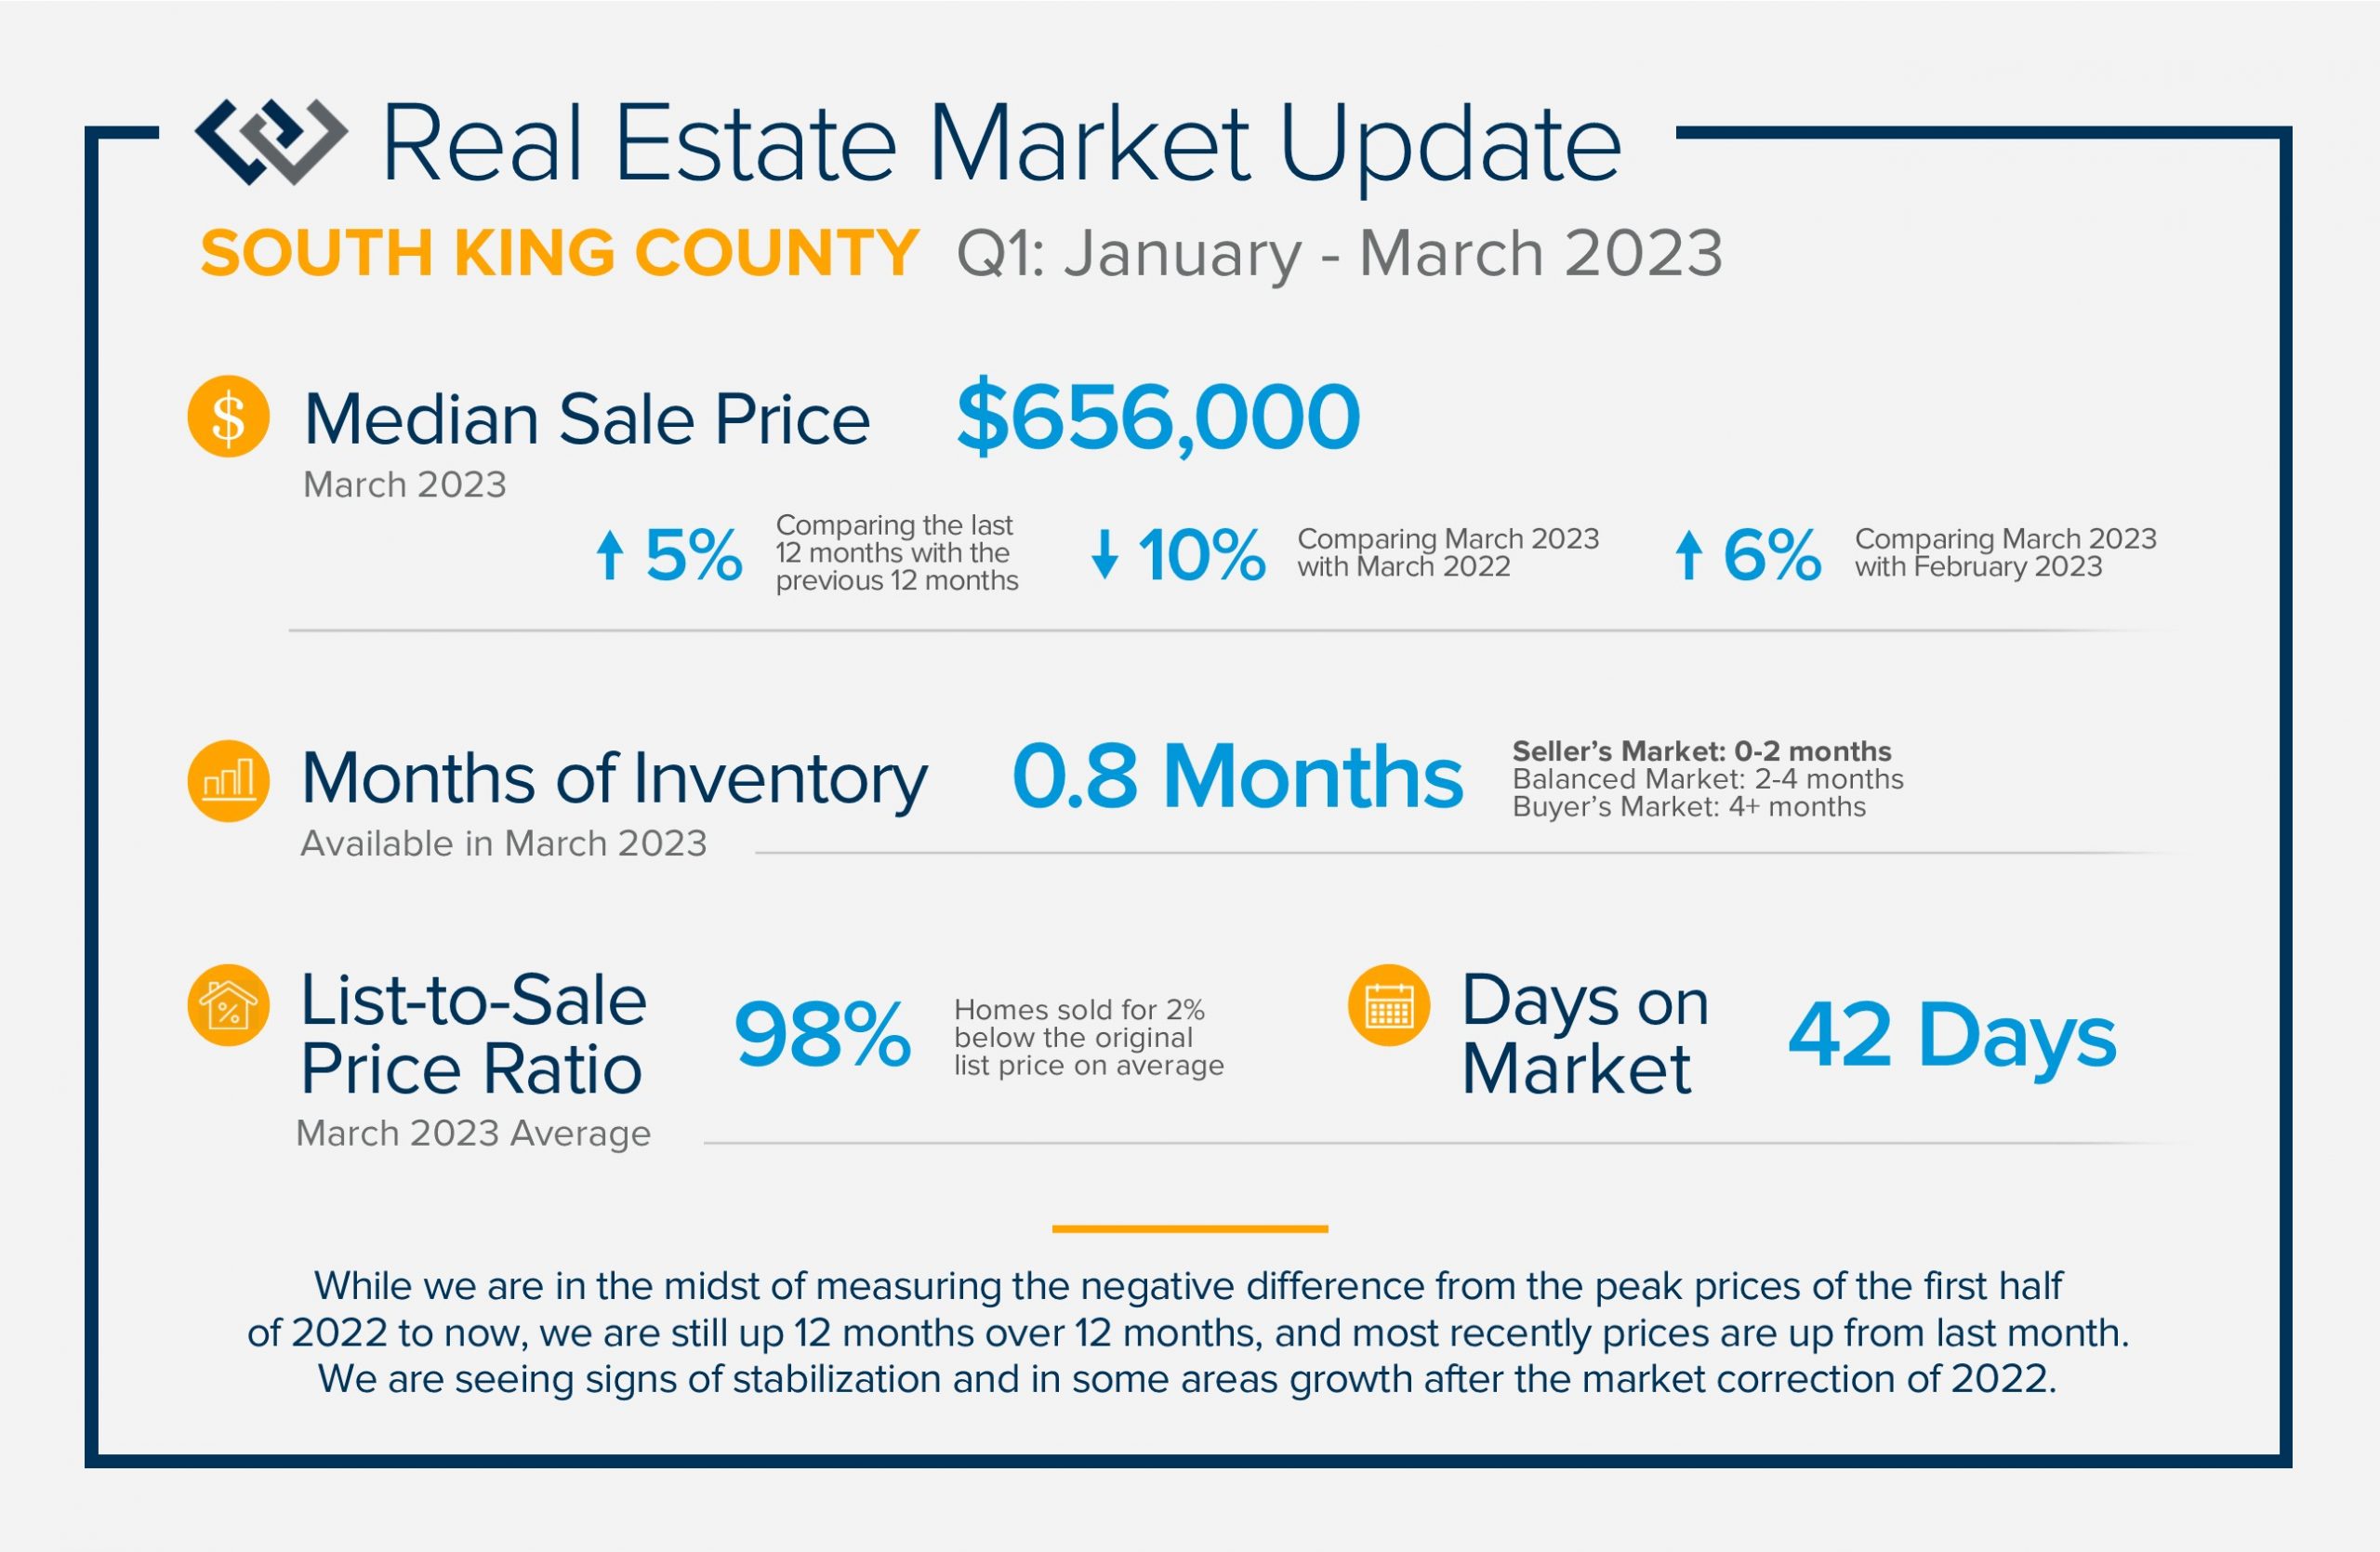
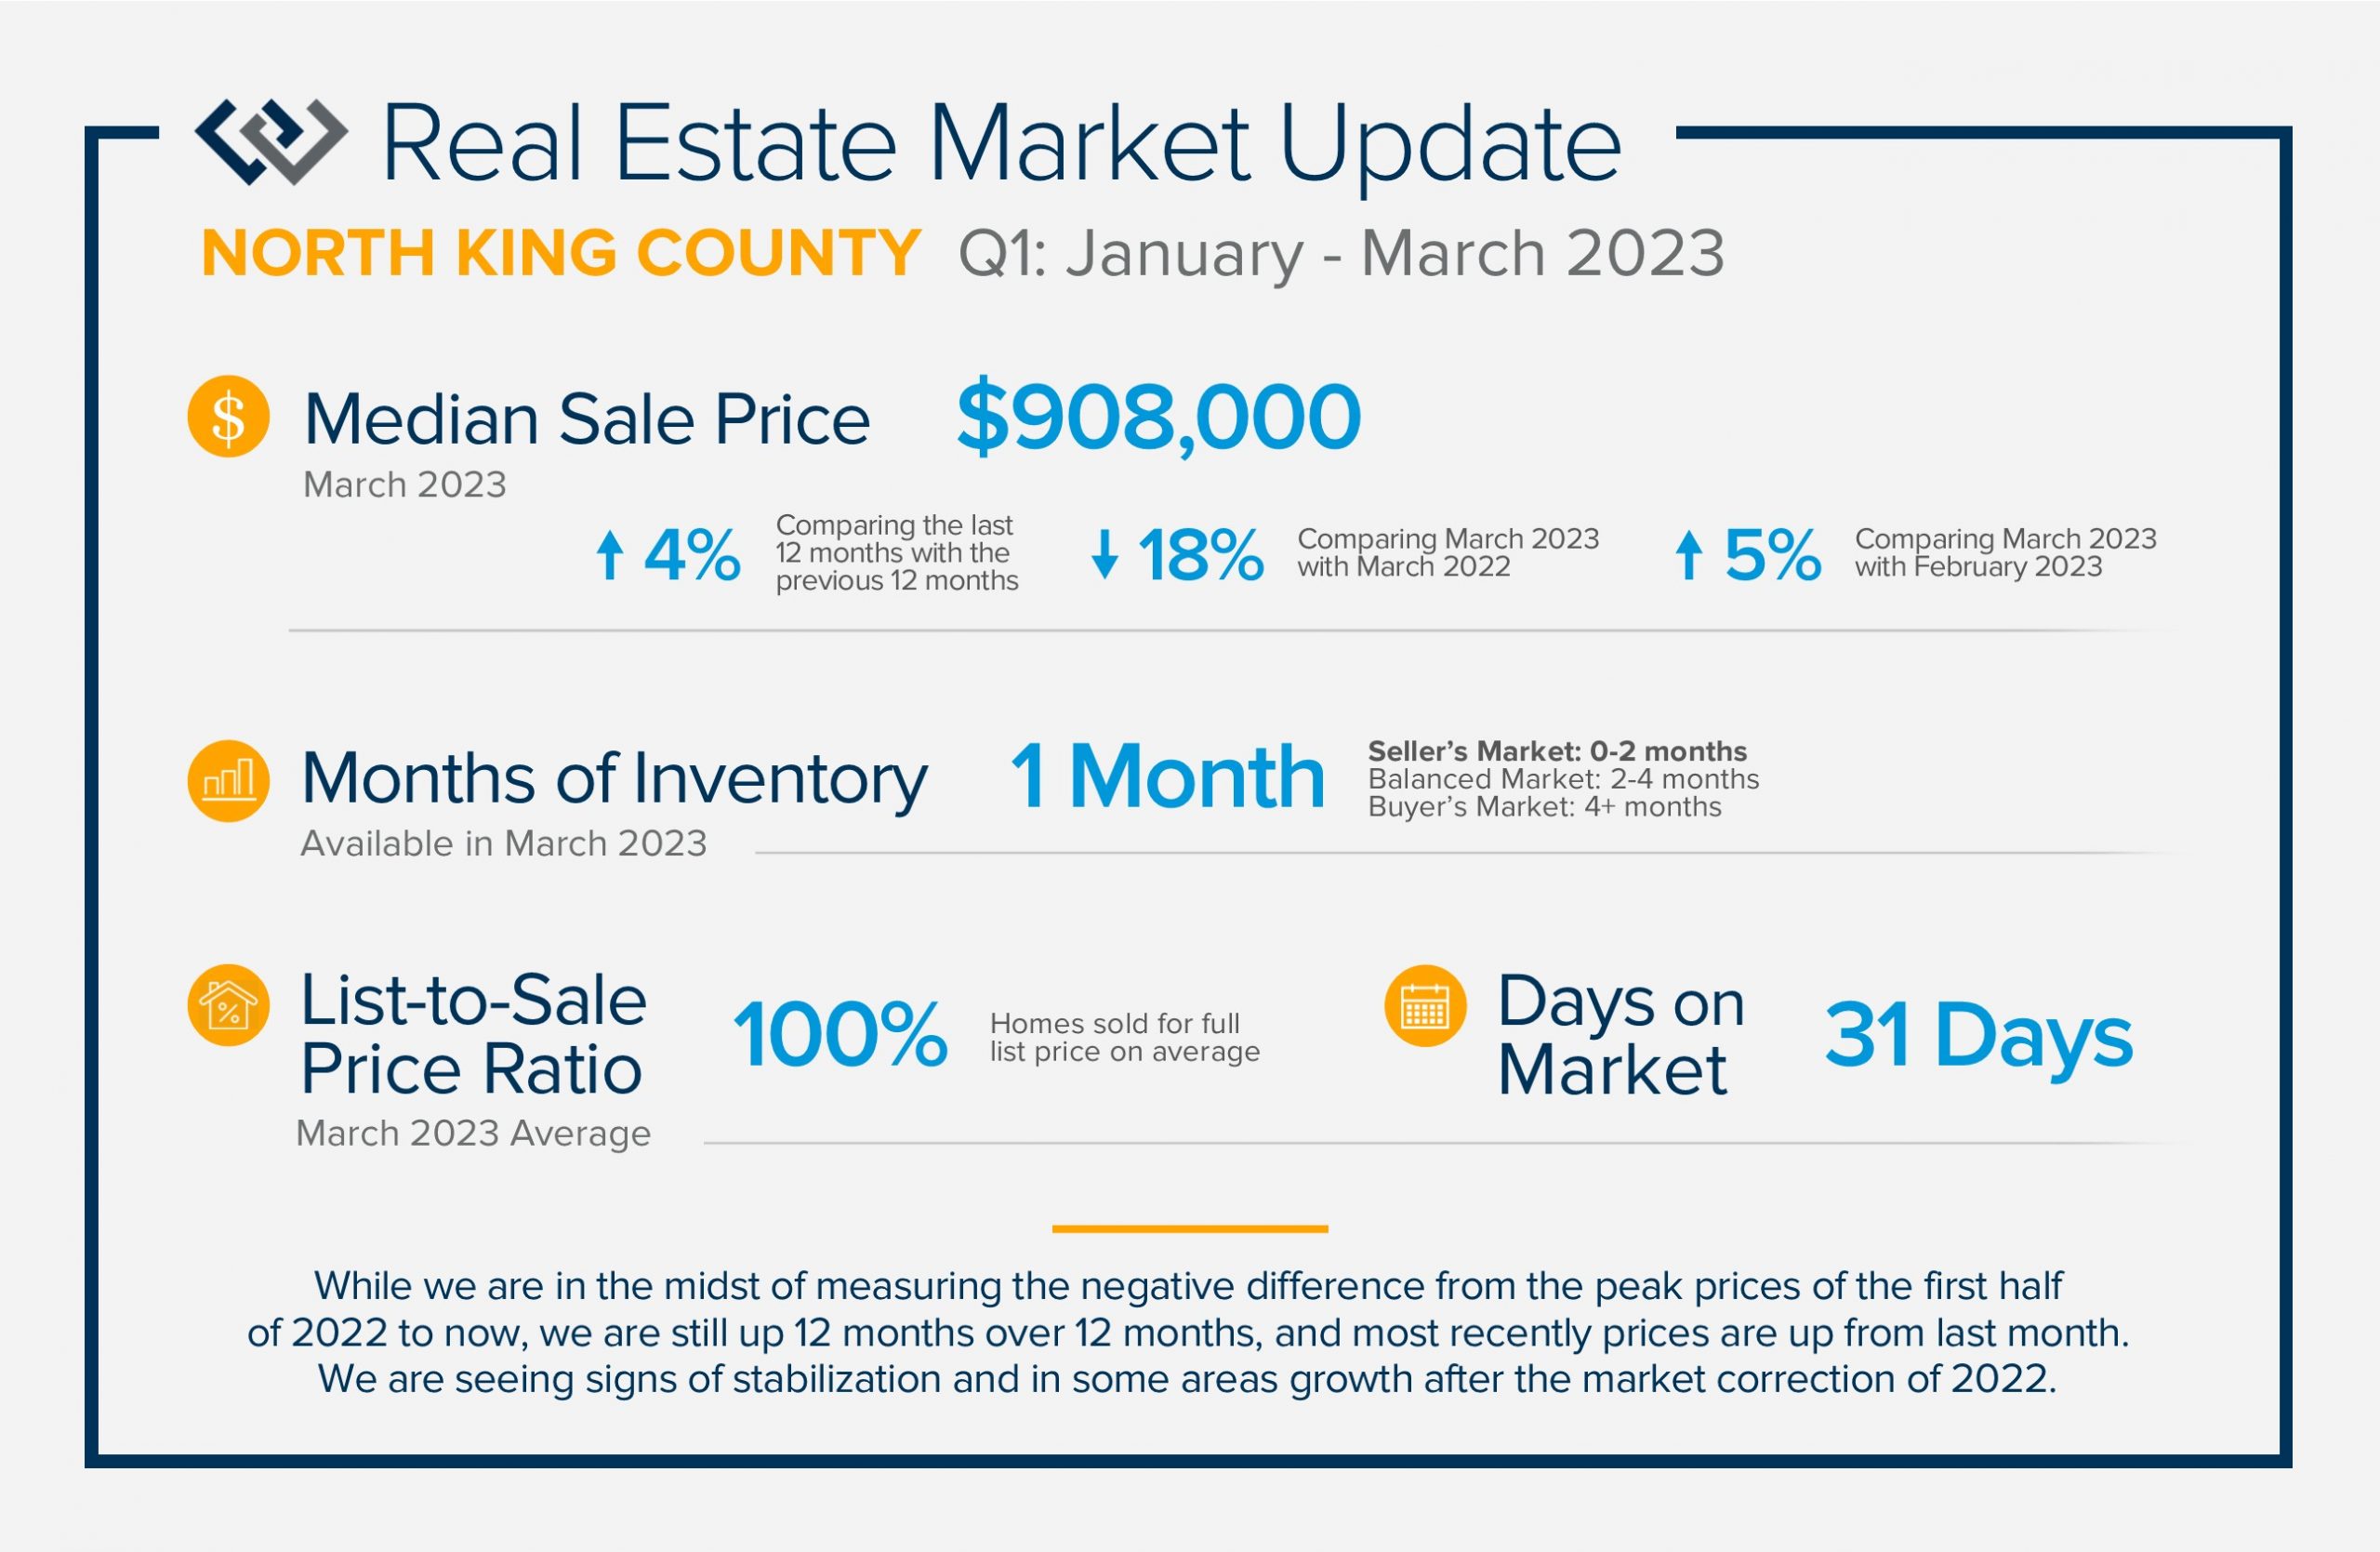 We are seeing signs of price stabilization and some growth after the market correction of 2022! Illustrated on the front is the up-down-up trajectory that home prices have experienced over the last year. While we are in the midst of measuring the negative difference from the peak prices of the first half of 2022 to now, we are still up 12 months over 12 months, and most recently prices are up from last month.
The correction in prices was a result of a 3-point increase in interest rates over the second half of 2022. Data shows the market has recalibrated in 2023 which has increased buyer demand as consumers have become more comfortable with the “new normal”. This has caused prices to stabilize and start to grow month-over-month since January. Days on market are shrinking and sale prices are averaging closer to the list prices, and in some cases are escalating over the list price. It has been an eventful past year highlighting the importance of real-time, accurate information to help empower strong decisions. Moves are motivated by life changes, lifestyle goals, and strategic financial planning. If you or someone you know is curious about how the market relates to these needs, please reach out.
Exploring Lynnwood: 5 Parks & Open Spaces to Enjoy This Spring

EXPLORING LYNNWOOD
5 Parks and Open Spaces to Enjoy This Spring
Lynnwood offers a diverse array of natural wonders just waiting to be explored. From lush, tree-lined parks to serene lakes and expansive open spaces, this city boasts a wealth of outdoor attractions for visitors and locals alike. Whether you're looking for a tranquil escape from the bustle of city life, or seeking adventure on hiking trails and fishing lakes, Lynnwood's parks and open spaces offer a wealth of opportunities to connect with nature and experience the beauty of the Pacific Northwest. Join us as we take a closer look at some of the top parks and open spaces that make Lynnwood a true gem of the region.
Lynndale Park
Lynnwood's largest park is a natural wonderland spanning approximately 22 acres, with much of the area preserved as native forest. The remaining space is thoughtfully developed to accommodate a range of active recreational uses, including athletic fields, an off-leash dog park, and a thrilling skate park. Visitors can also enjoy the park's orienteering course, a fun activity that challenges participants to navigate through the park's trails using only a map and compass. The park is a popular destination for summer day camps and scouting programs, and an amphitheater nestled deep in the forest offers a magical setting for enchanting summer performances of Shakespeare in the Park. Whether you're seeking adventure on the trails or an afternoon of family fun, Lynnwood's largest park is a must-visit destination for anyone looking to explore the city's natural beauty.
Municipal Golf Course
For golf enthusiasts seeking a challenging yet enjoyable 18-hole course, Lynnwood Municipal Golf Course is a must-visit destination. Located in the heart of the city, the course offers a full range of amenities, including merchandise, rentals, and a full-service Pro Shop. Open year-round, the course is designed with a focus on fun, combining tight fairways with clever hole layouts that test the skills of even the most seasoned golfers. The course is surrounded by the Golf Course Trail, a scenic combination of soft and hard surface off-road pedestrian paths that wind around the perimeter of the course. Whether you're looking to sharpen your golf game or enjoy a leisurely stroll in nature, Lynnwood Municipal Golf Course is the perfect spot for a day of outdoor recreation.
Scriber Lake Park
Scriber Lake Park is a peaceful haven in the heart of Lynnwood, offering a much-needed escape from the noise and activity of urban life. The park is centered around Scriber Lake, a calm body of water surrounded by thriving wetlands that provide a vital habitat for a variety of wildlife, from fish and waterfowl to songbirds and small mammals. The lake serves a crucial function as a regulated stormwater holding facility, ensuring the continued health of the local ecosystem. Visitors can enjoy the park's natural beauty by strolling along a floating boardwalk or exploring the network of scenic trails. Convenient amenities such as restrooms and parking make for a comfortable and enjoyable outdoor experience.
Meadowdale Athletic Complex
This state-of-the-art outdoor sports complex is a must-visit destination for athletes and sports fans alike. Boasting an impressive array of facilities, including five all-weather softball/baseball fields and two regulation-sized all-weather fields for soccer, football, rugby, and lacrosse, visitors can enjoy a range of outdoor activities in one convenient location. In addition to the sports fields, the complex also features playgrounds, a concession stand, walking trails, and restrooms, making it the perfect spot for a fun and active day out with family and friends.
Lund’s Gulch
Lund's Gulch is a breathtaking watershed basin tucked away in the heart of Lynnwood. A dense canopy of mature second-growth forest stretches over steep slopes and wetlands, offering visitors a glimpse into the region's rich natural heritage. At the heart of the basin flows Lund's Gulch Creek, a salmonid stream that winds its way through the forest before emptying into the majestic Puget Sound. The basin is also home to Snohomish County's famed Meadowdale Beach Park, which offers a well-maintained trail system with direct access to the Sound.
There's even more to discover over at The City of Lynnwood.
QUARTERLY REPORTS Q4 2022

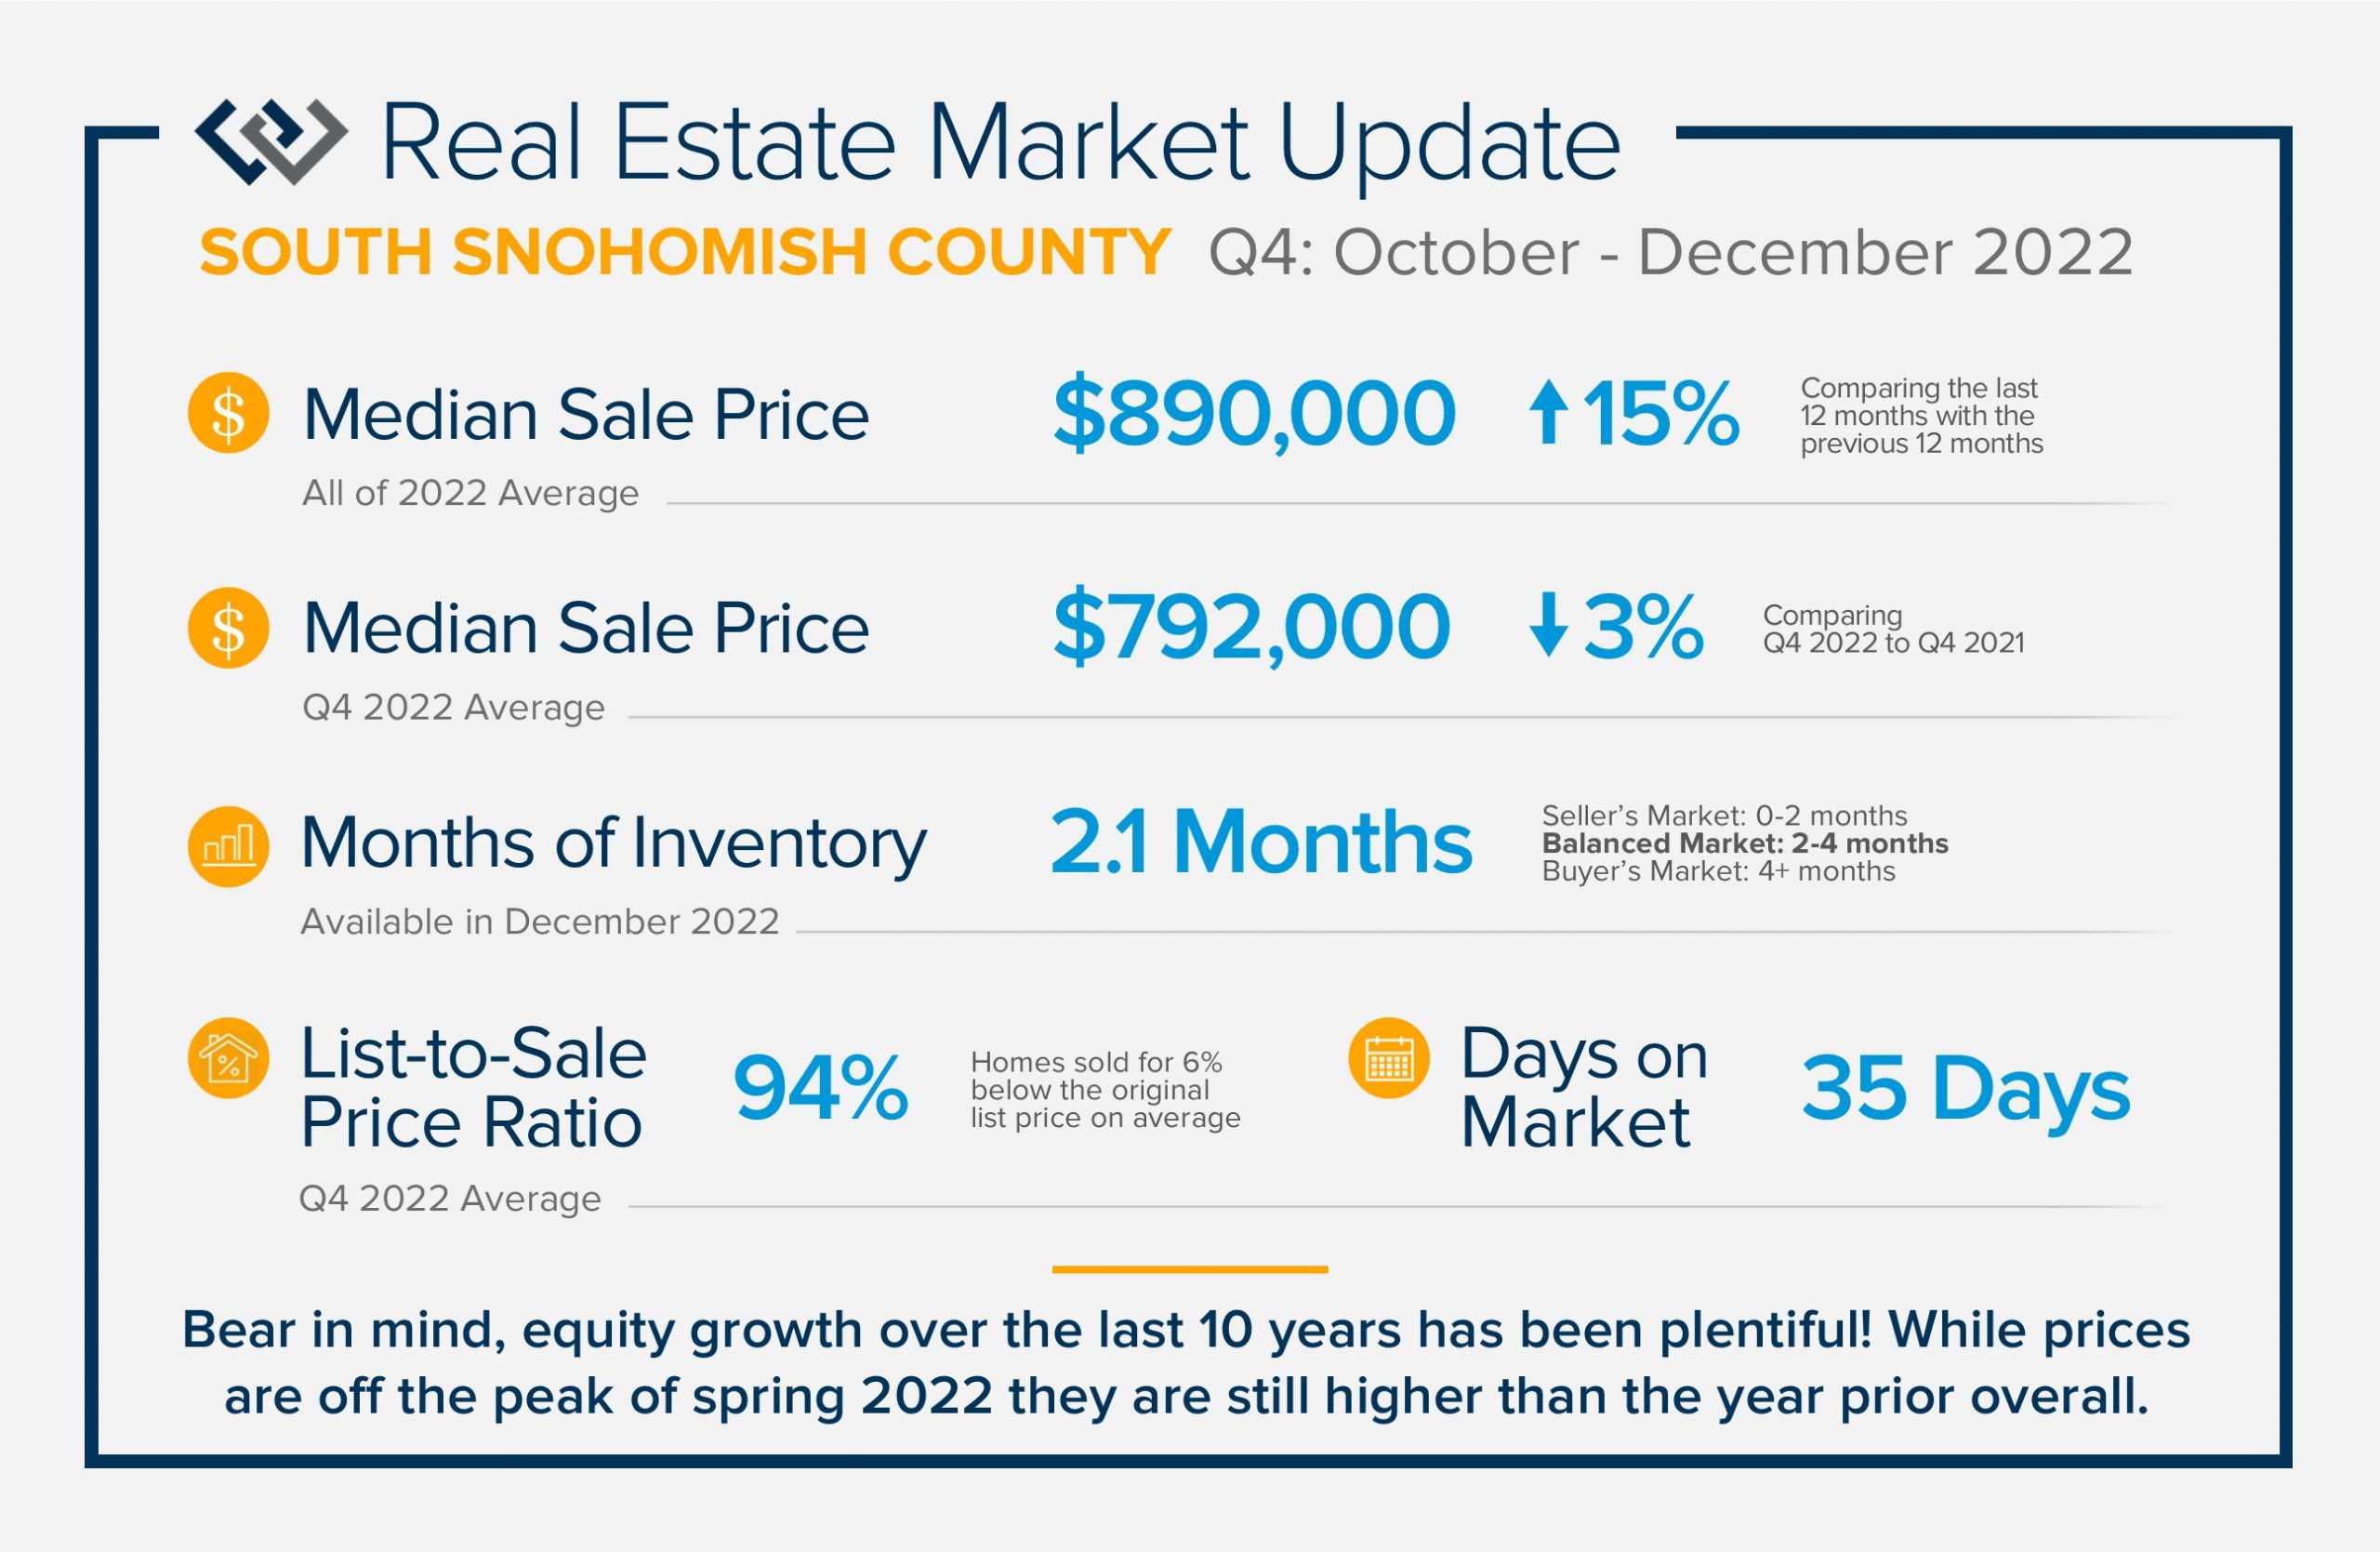
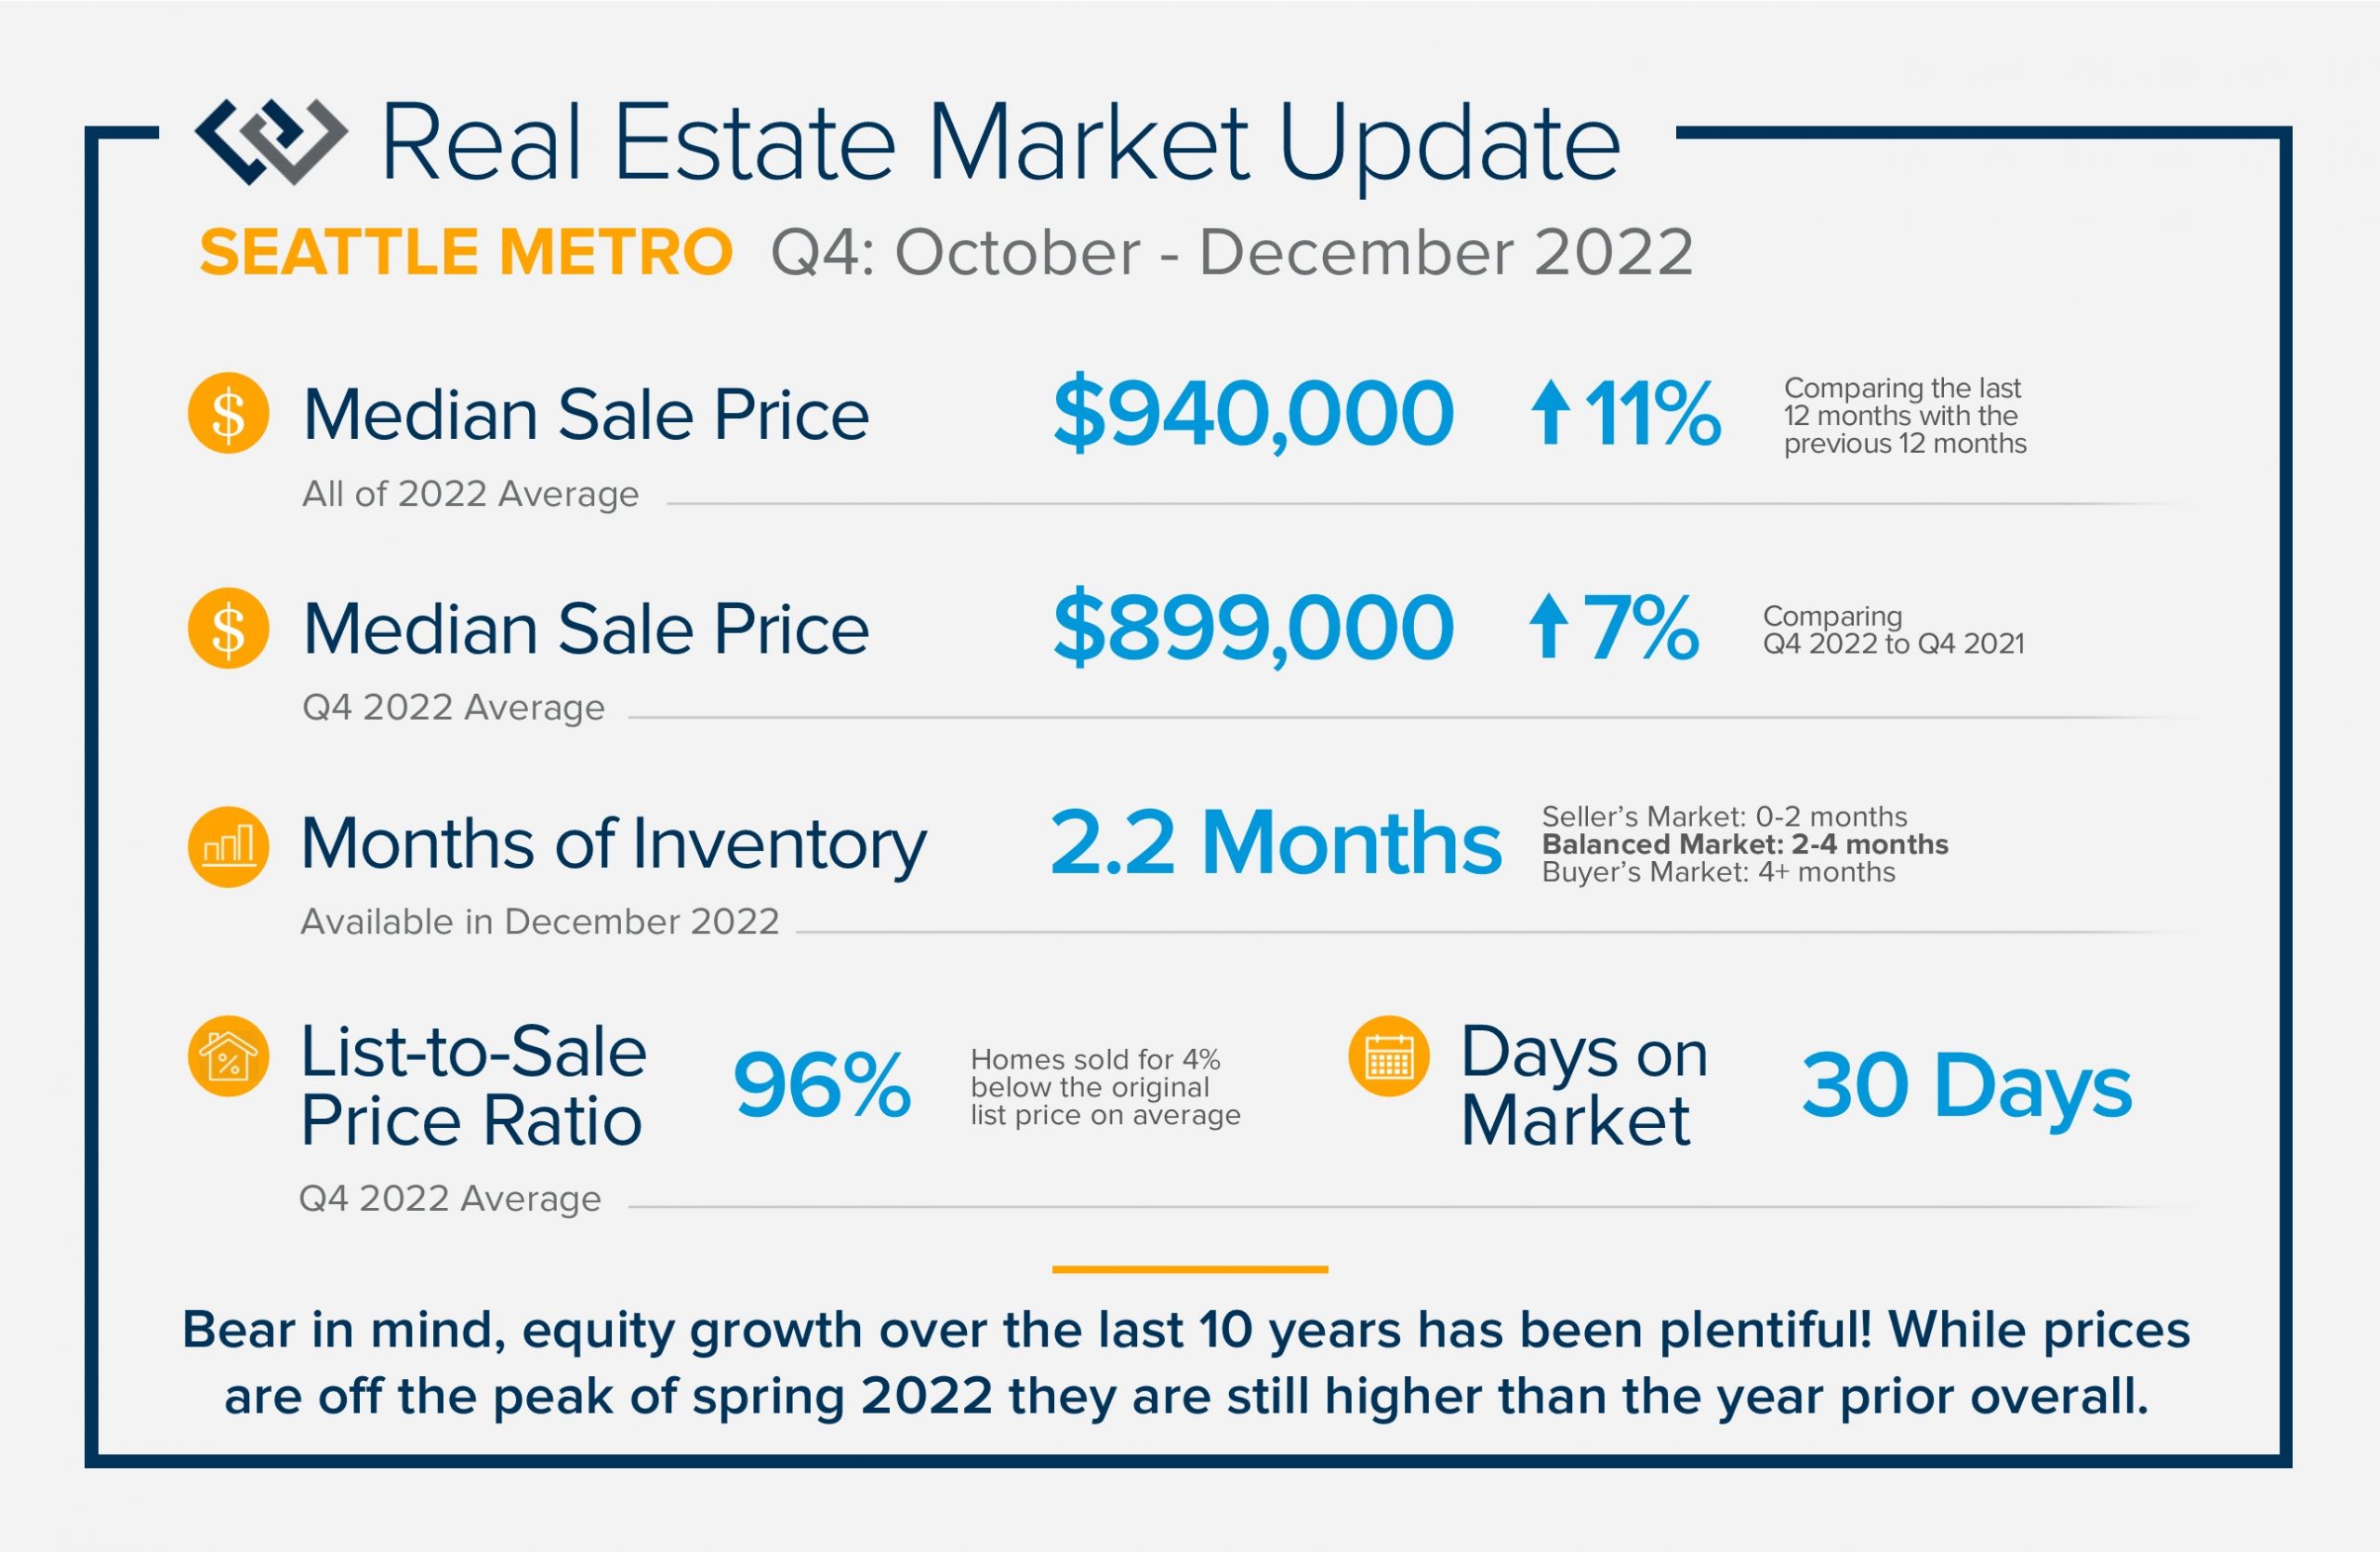
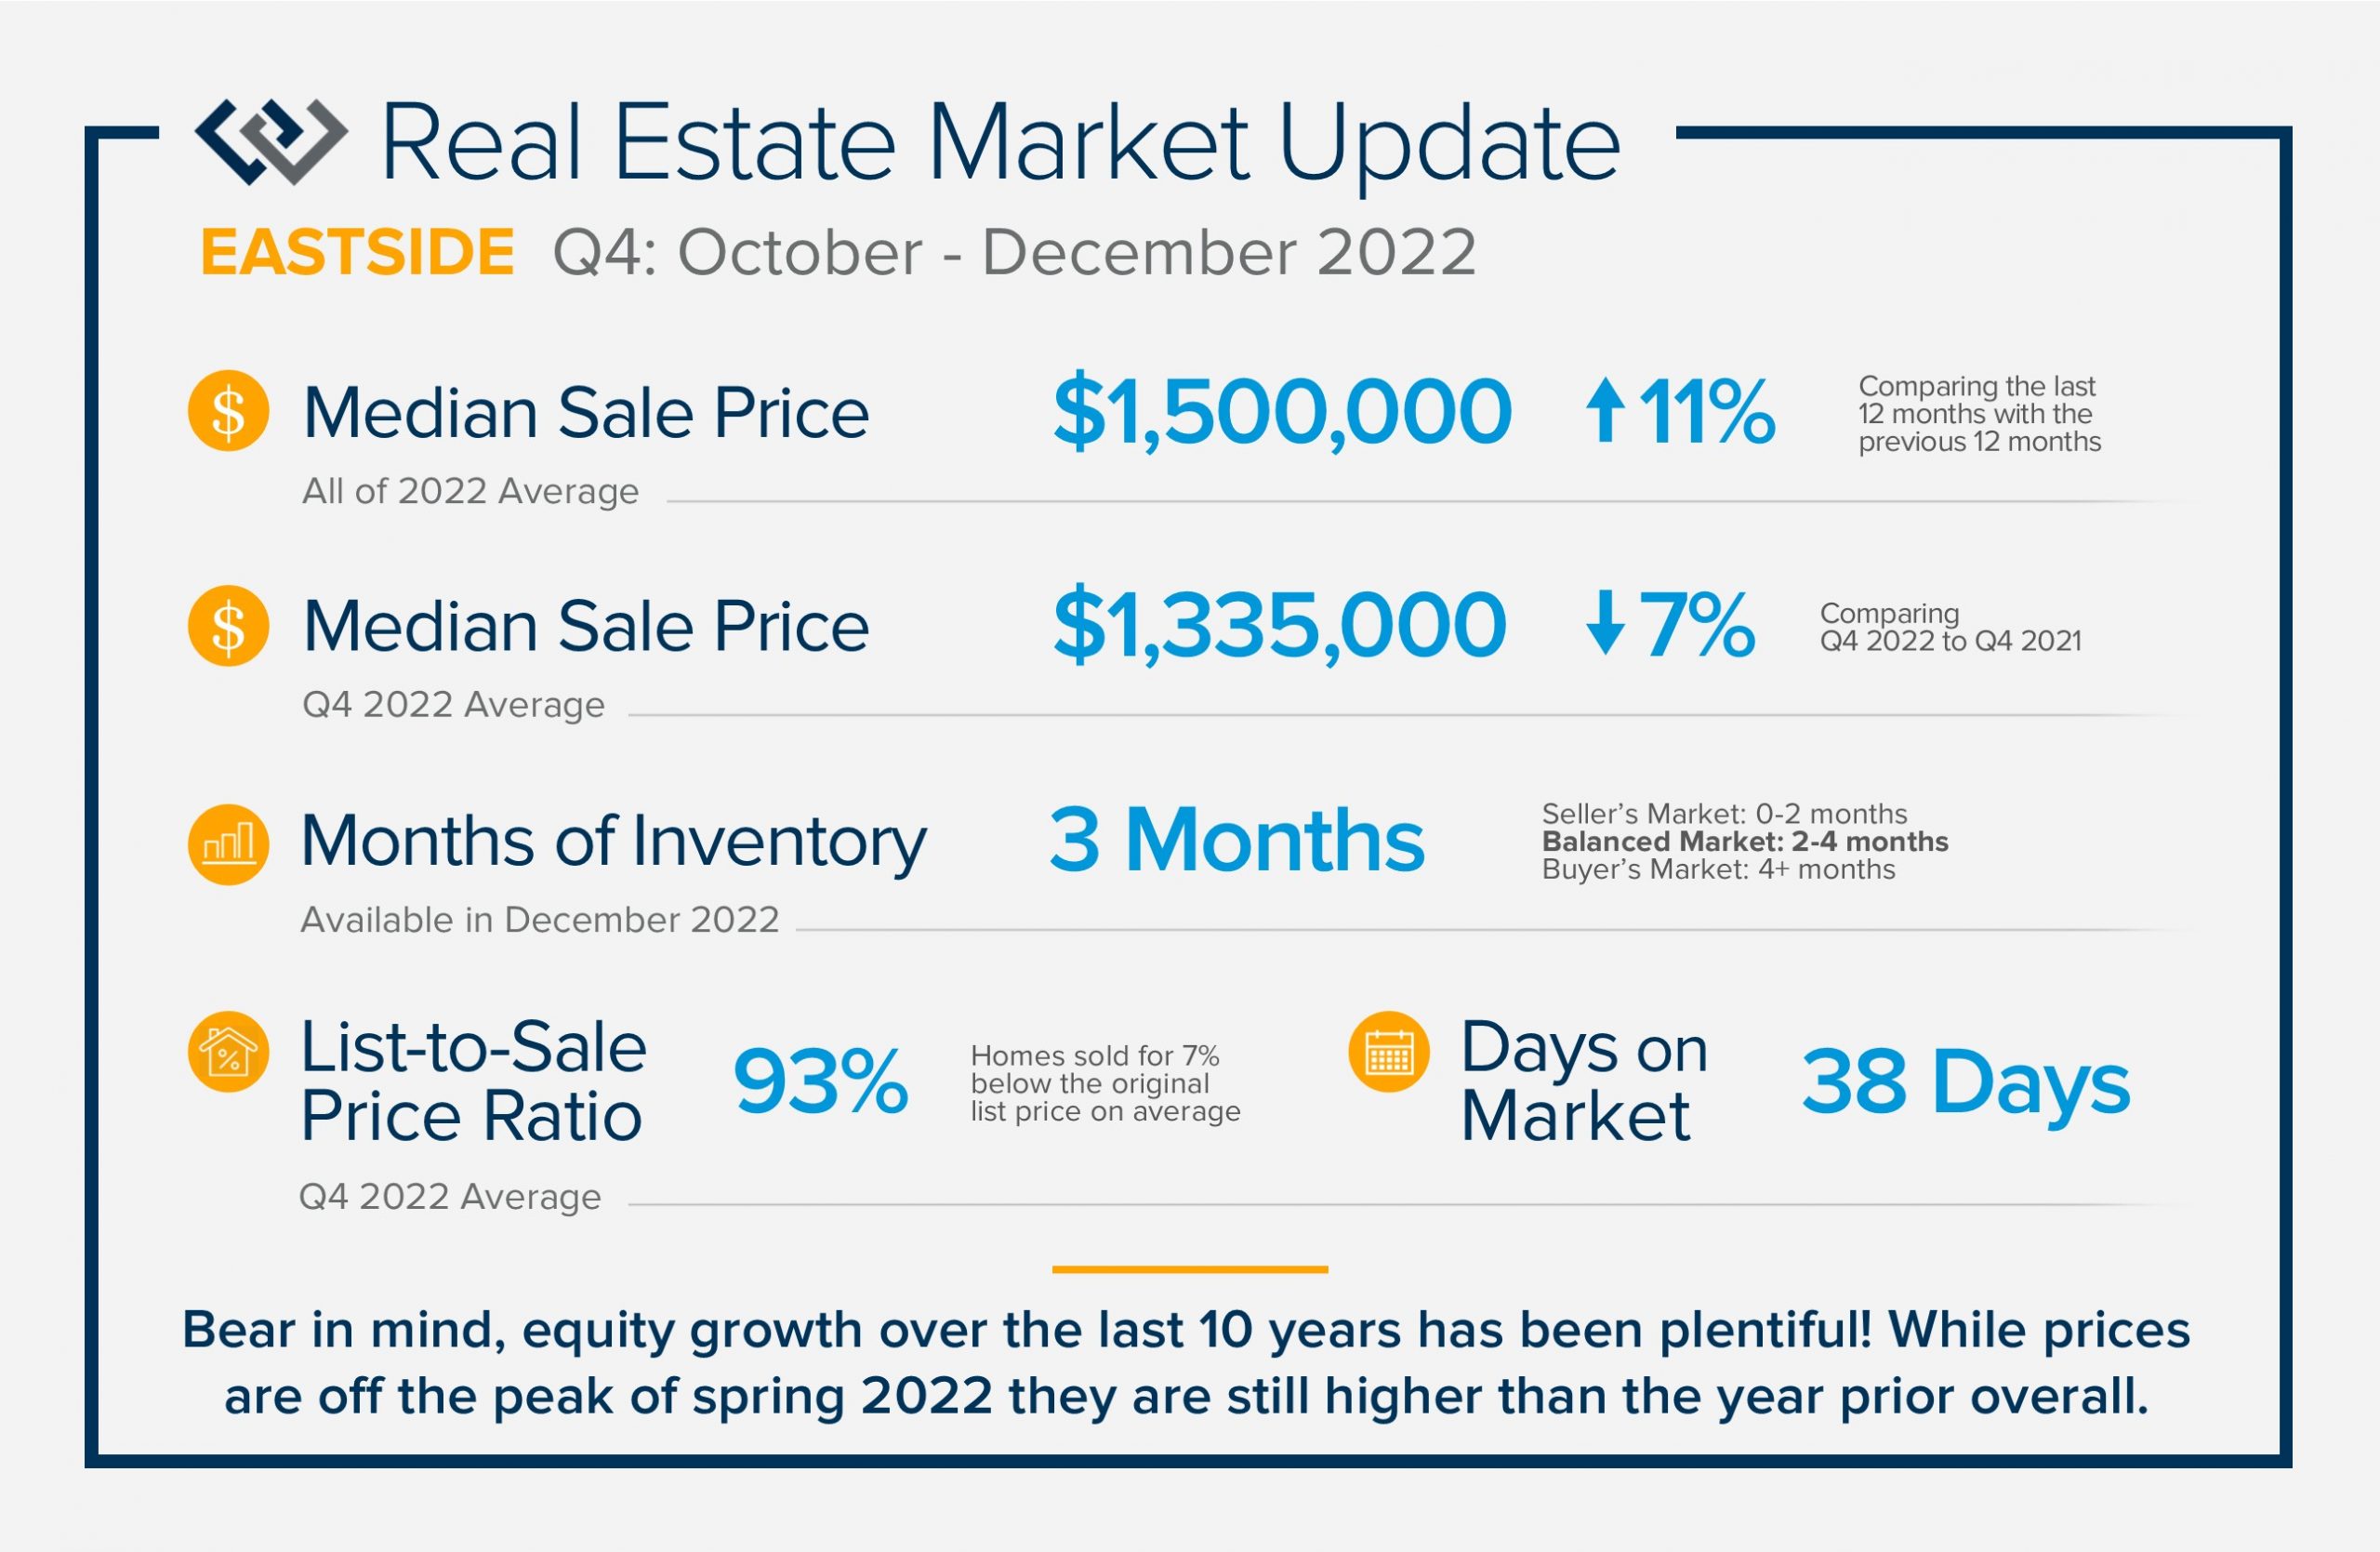
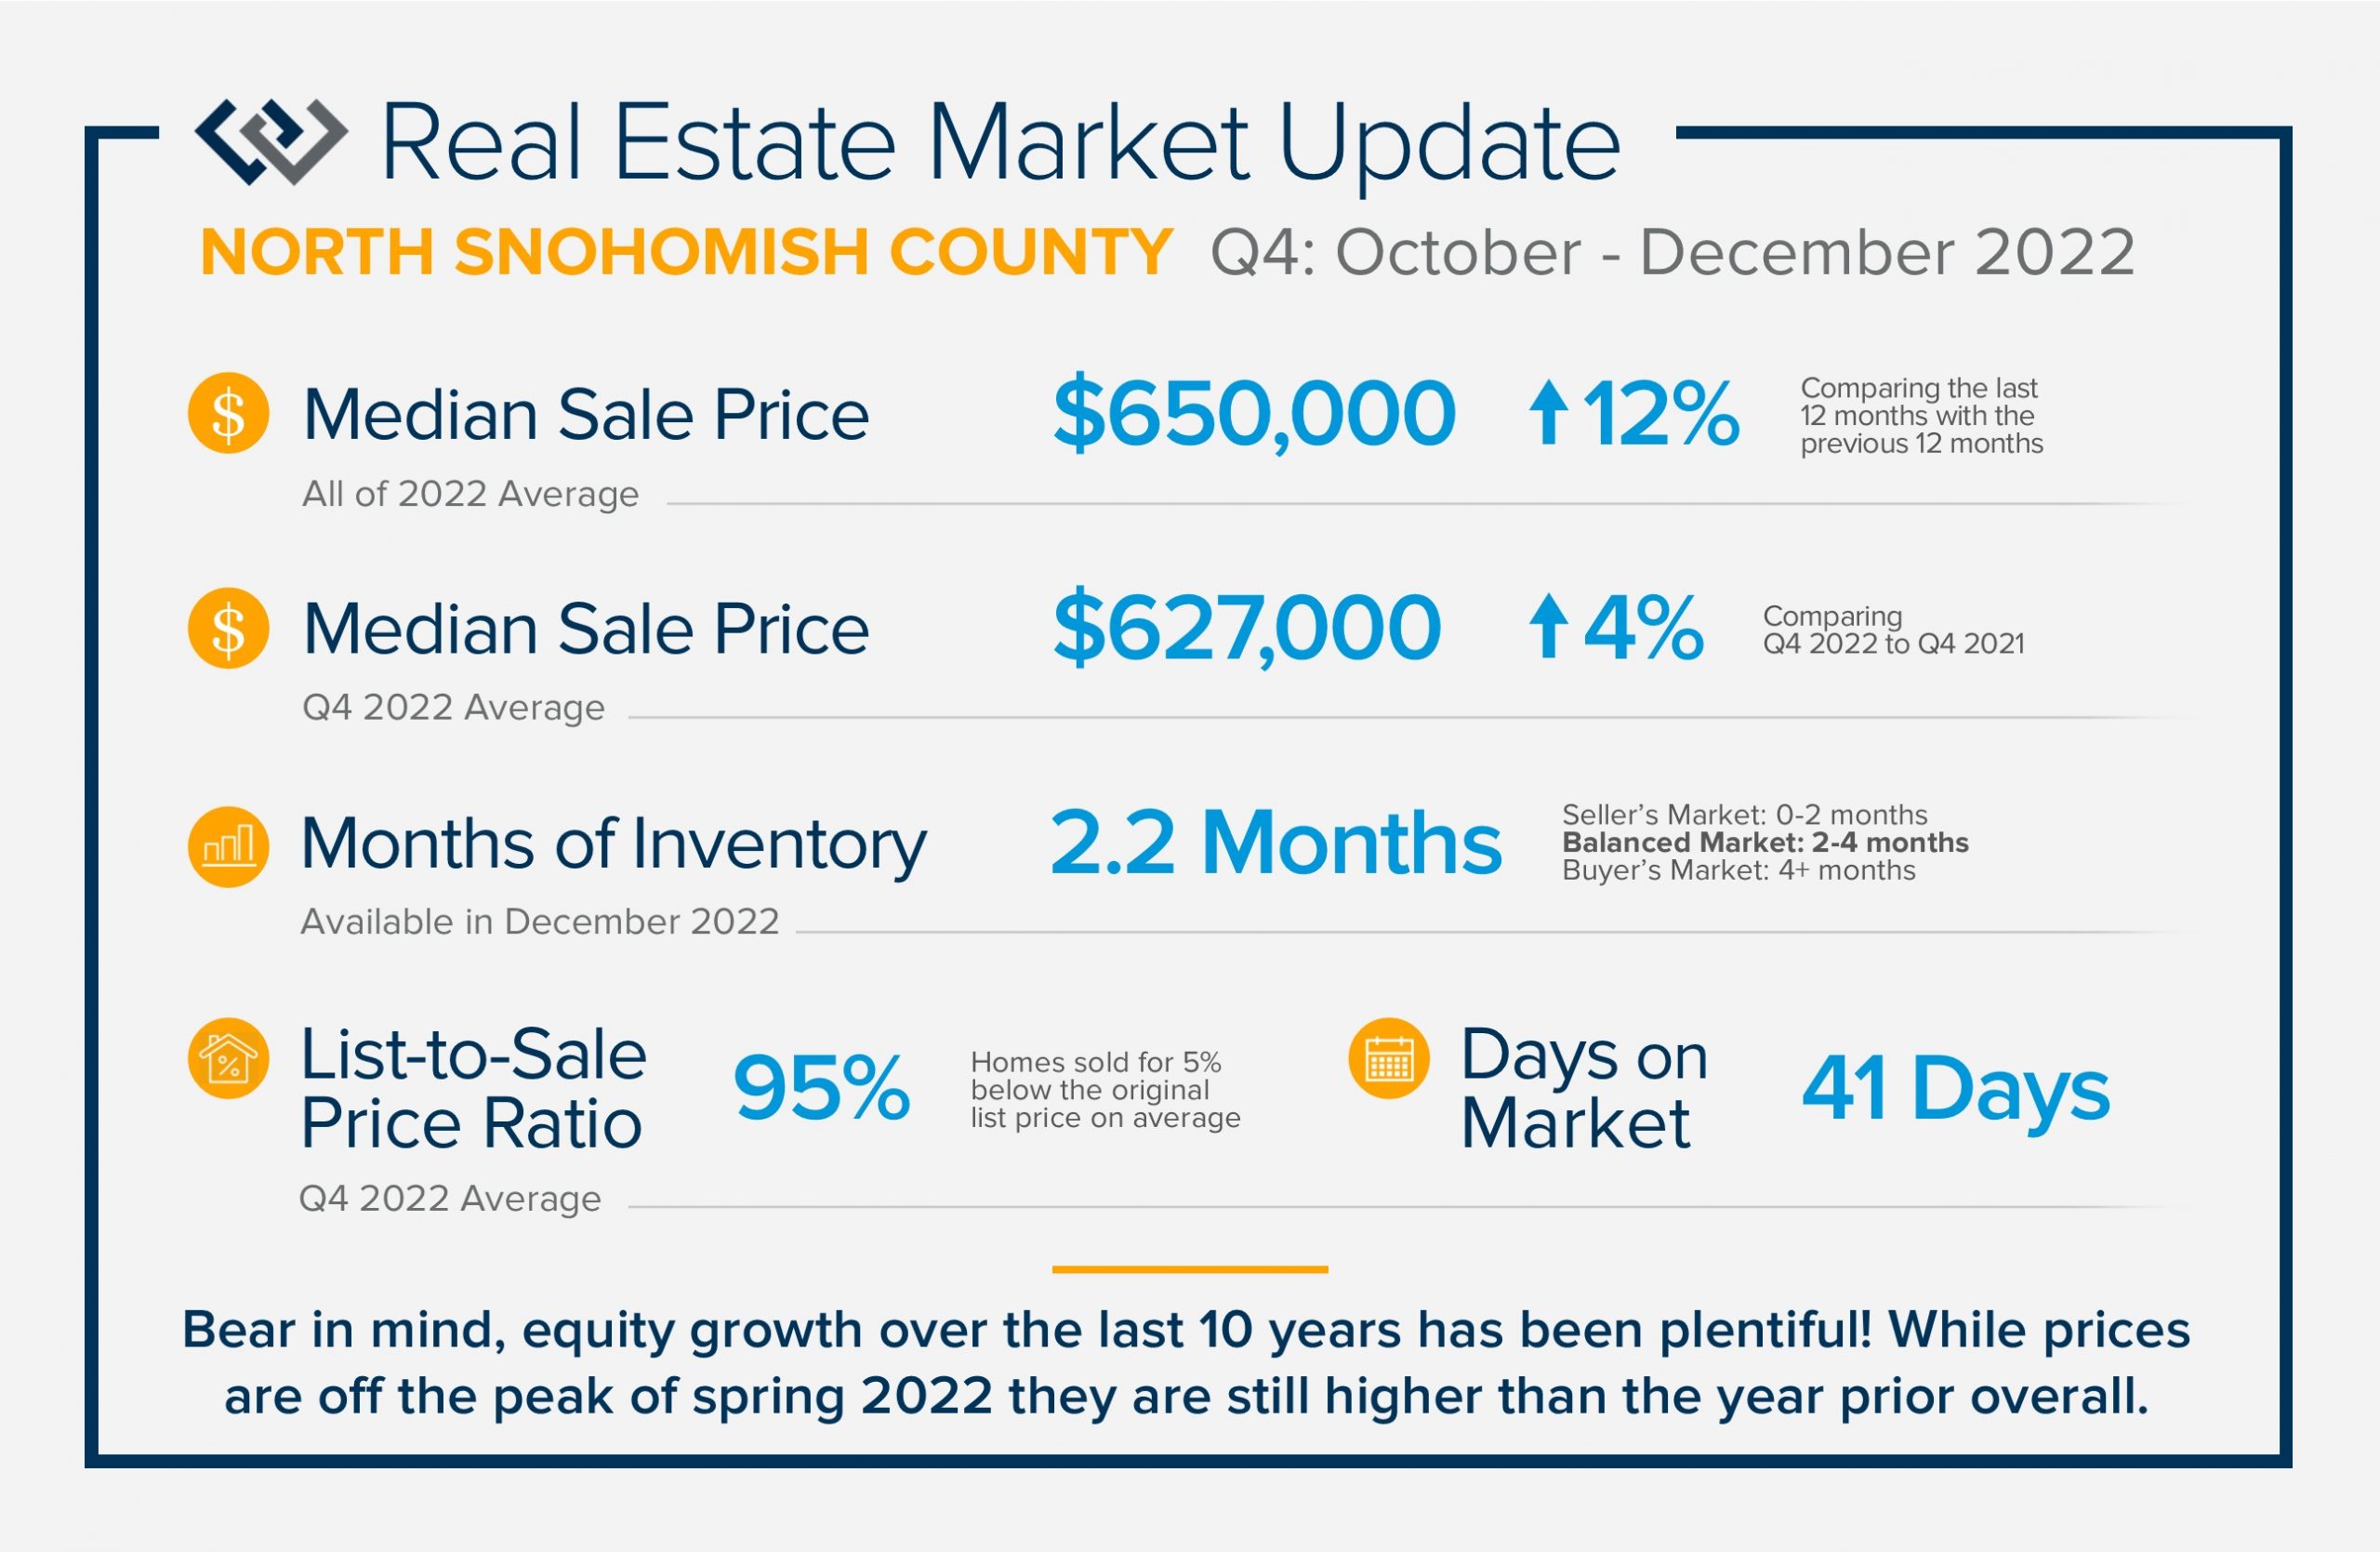
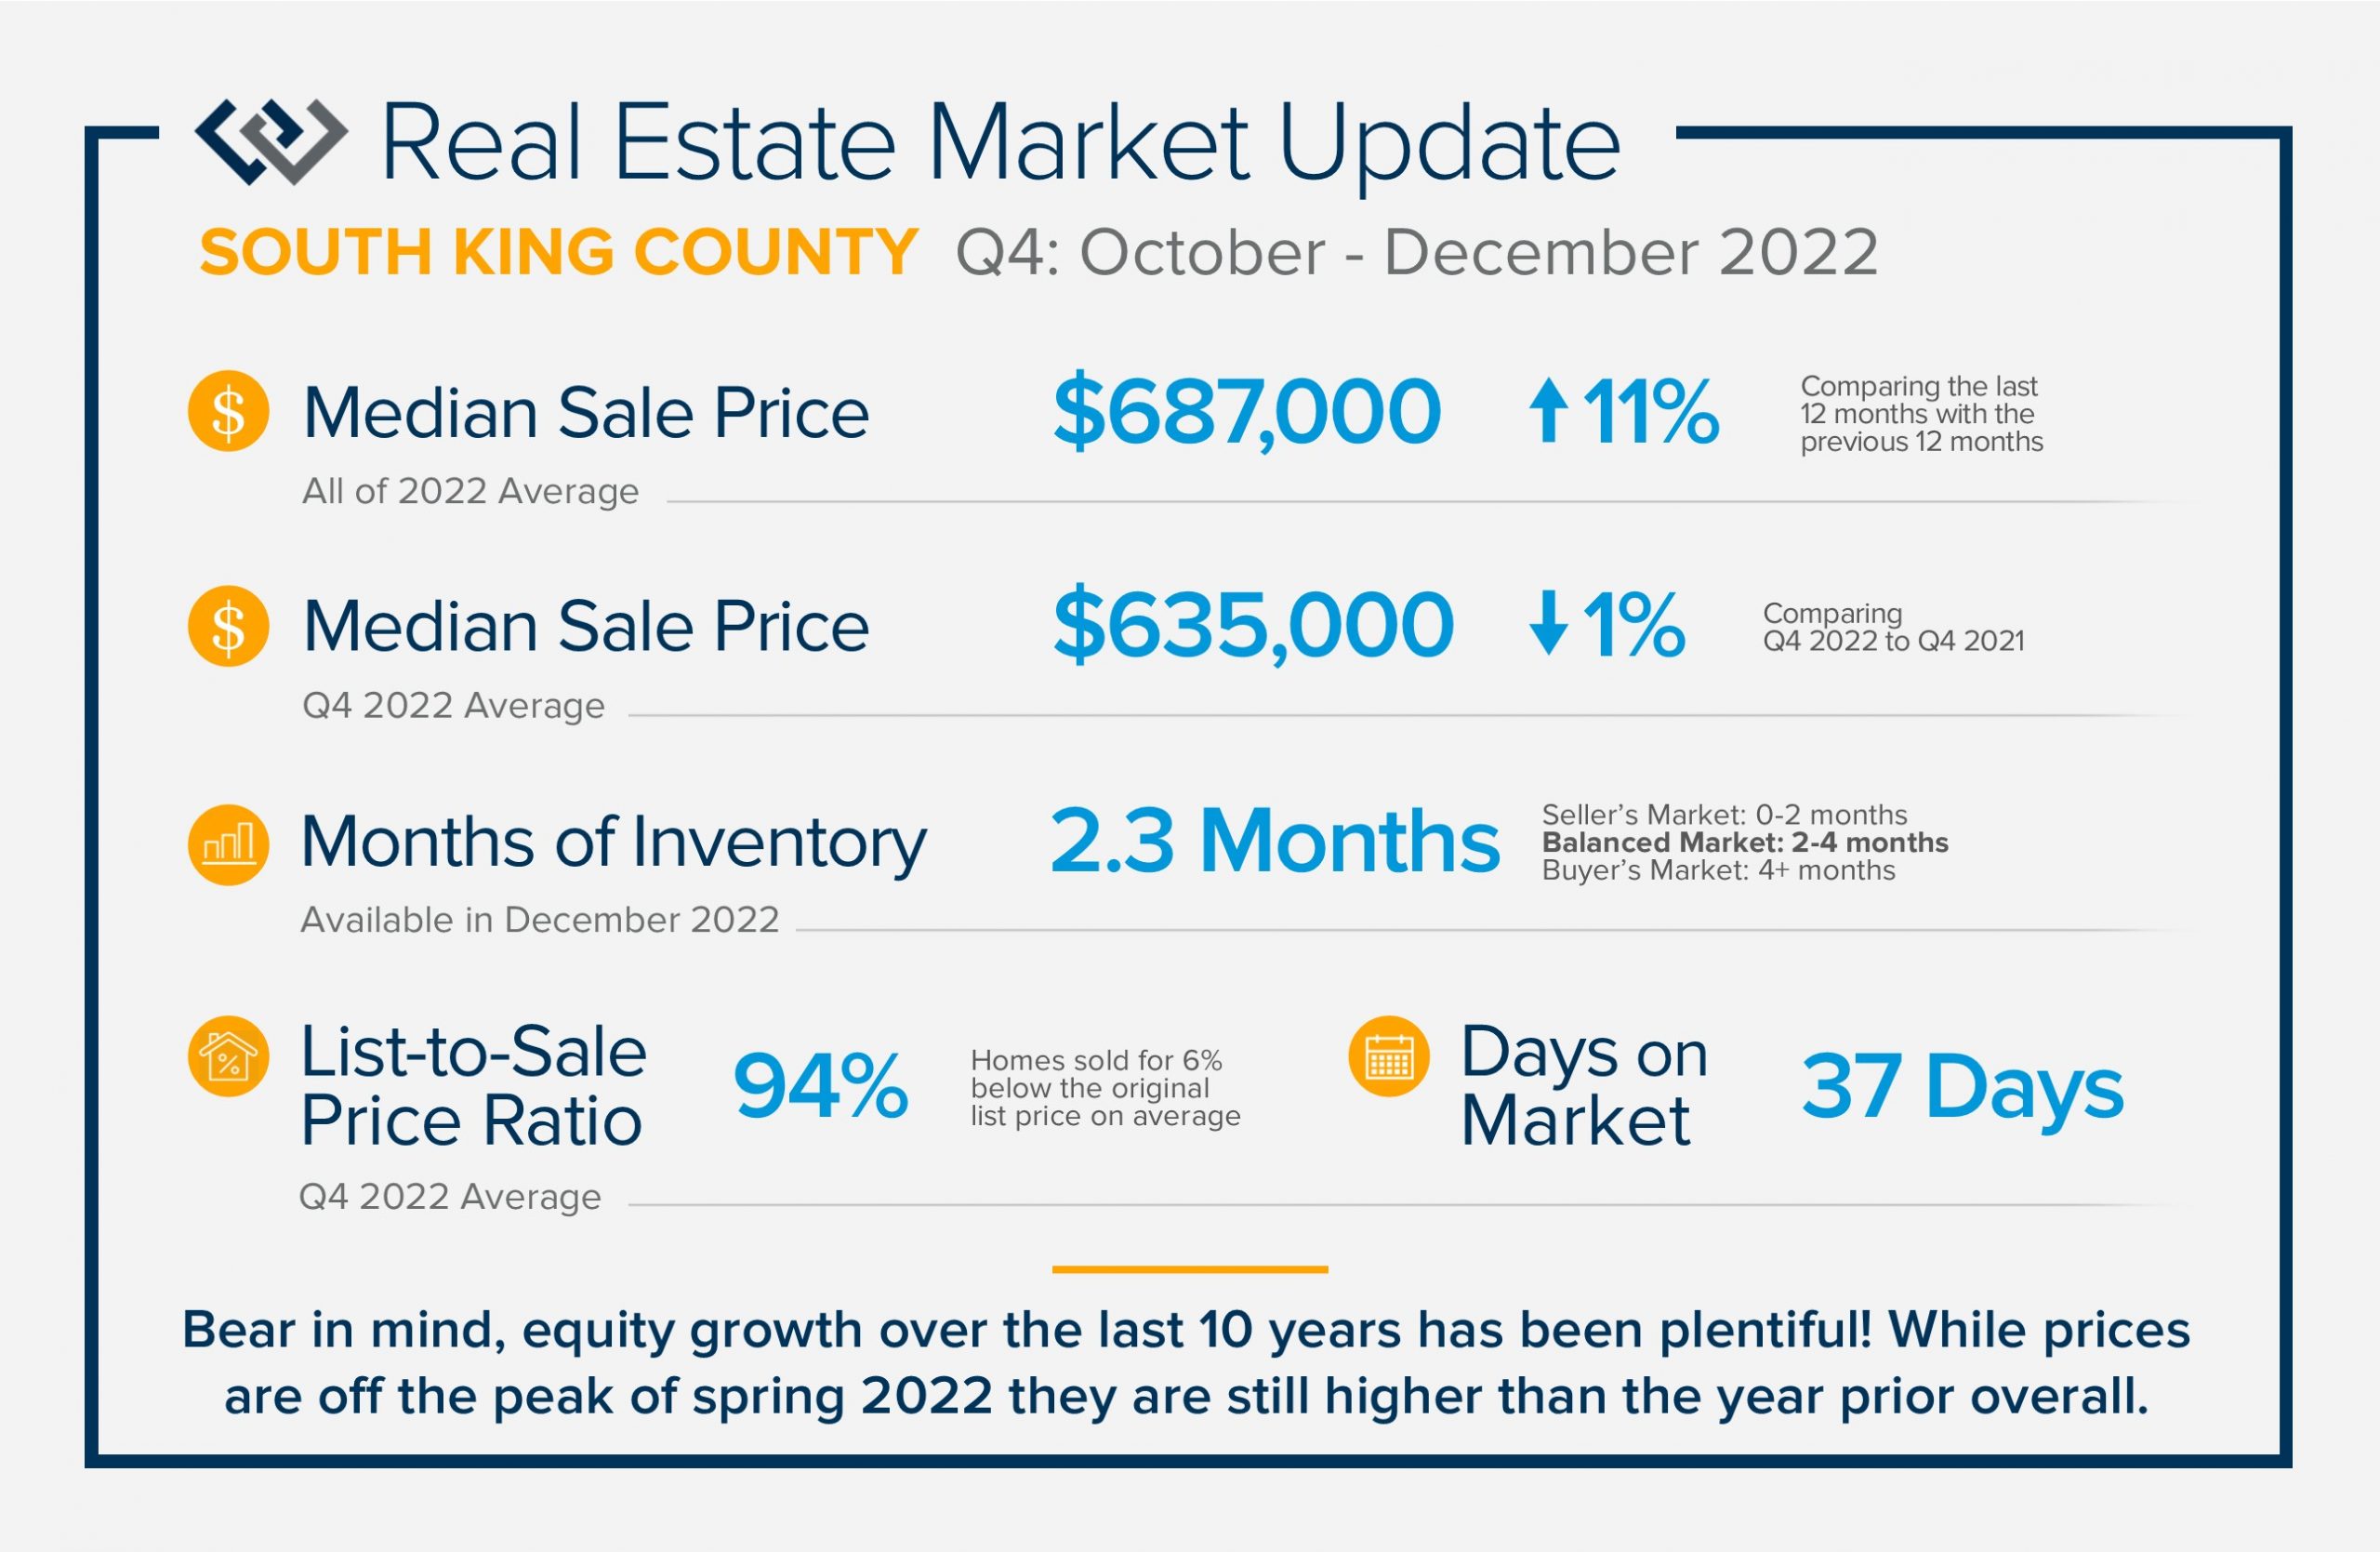
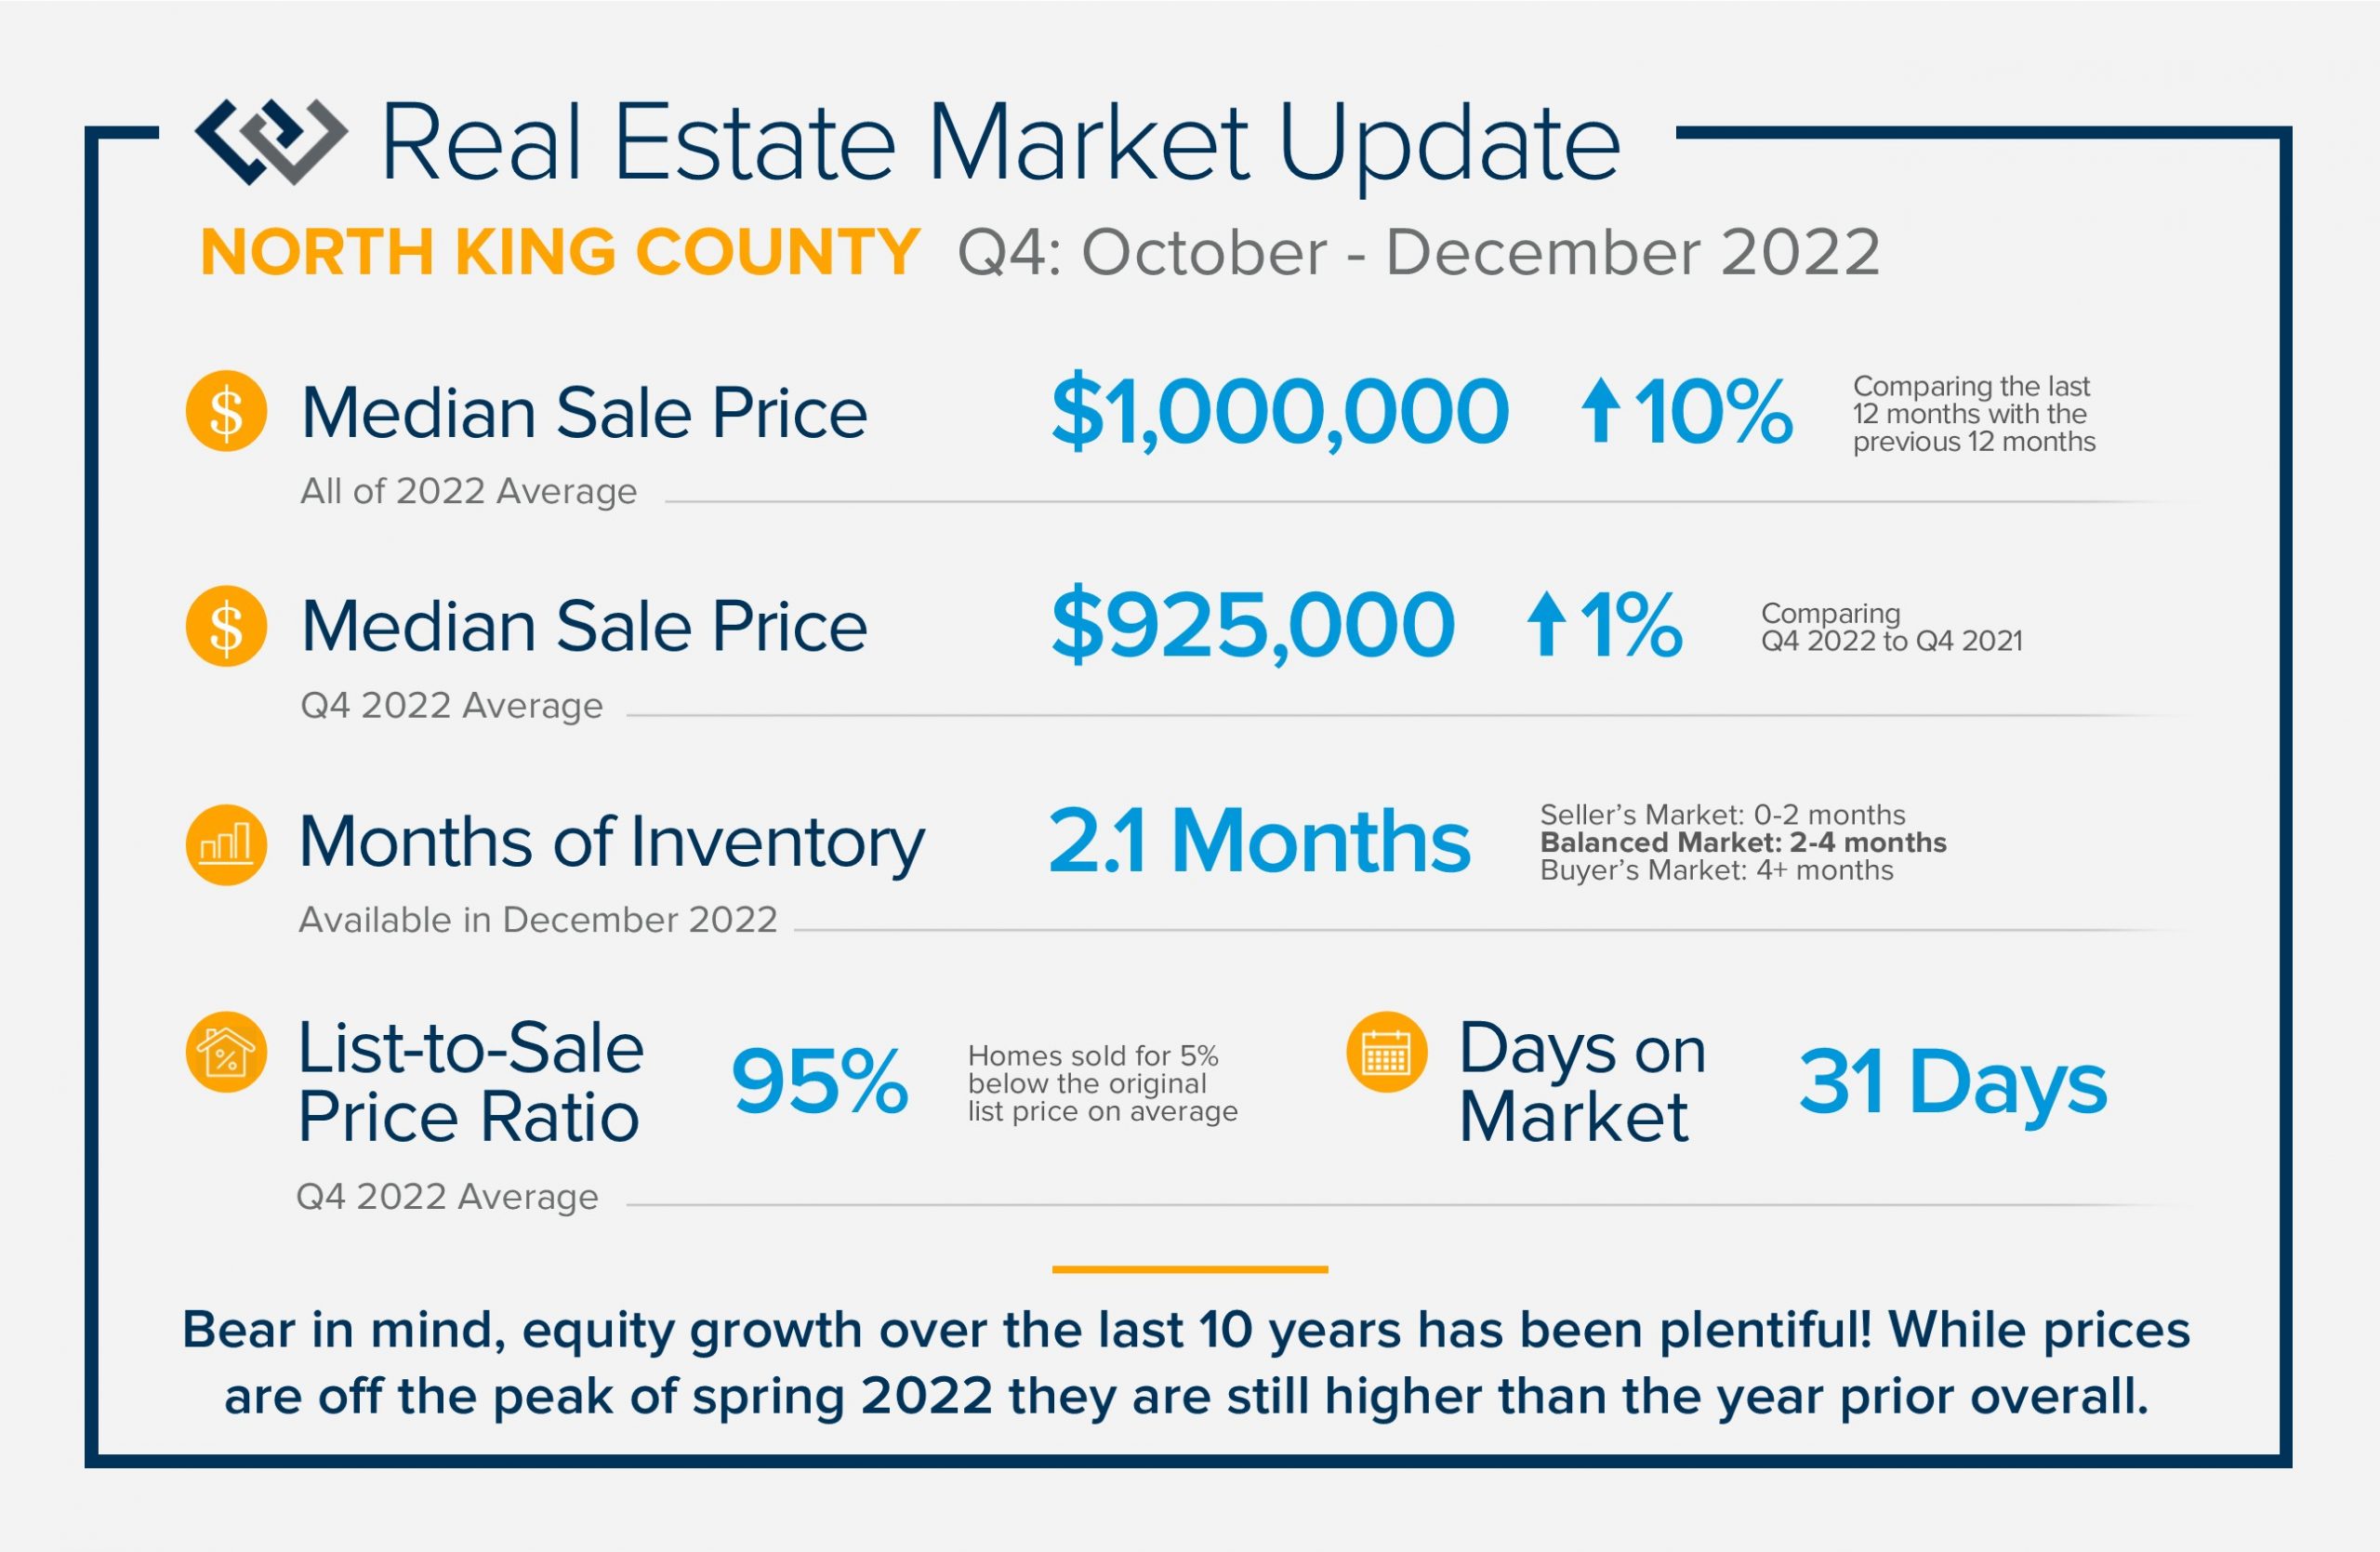 2022 was a transitional year for the real estate market that started off incredibly seller-centric and ended in balance. We started 2022 with interest rates hovering in the low 3%, peaked at 7% in late fall, and ended the year hovering in the mid 6%. This significant jump created a correction in home prices as the cost to finance a home affected affordability. Bear in mind, equity growth over the last 10 years has been plentiful! While prices are off the peak of spring 2022, they are still higher than the year prior overall. 2022 became a more traditional market with interest rates in line with historical averages, more available inventory, and the return of contract contingencies and concessions for buyers. This balance has increased days on market, highlighted the importance of accurate pricing, and made the best-prepared homes shine.
Experts anticipate rates to continue to improve throughout 2023 and buyer demand to grow. Buyers that are looking to enter the market should engage now. Price growth may be flat as we adjust to these norms and then should start to maintain historical annual appreciation rates closer to 2-5% year-over-year after years of double-digit annual growth. If you are curious about how the market affects your housing goals, please reach out. It is my goal to help keep my clients informed and empower strong decisions.
QUARTERLY REPORTS Q3 2022


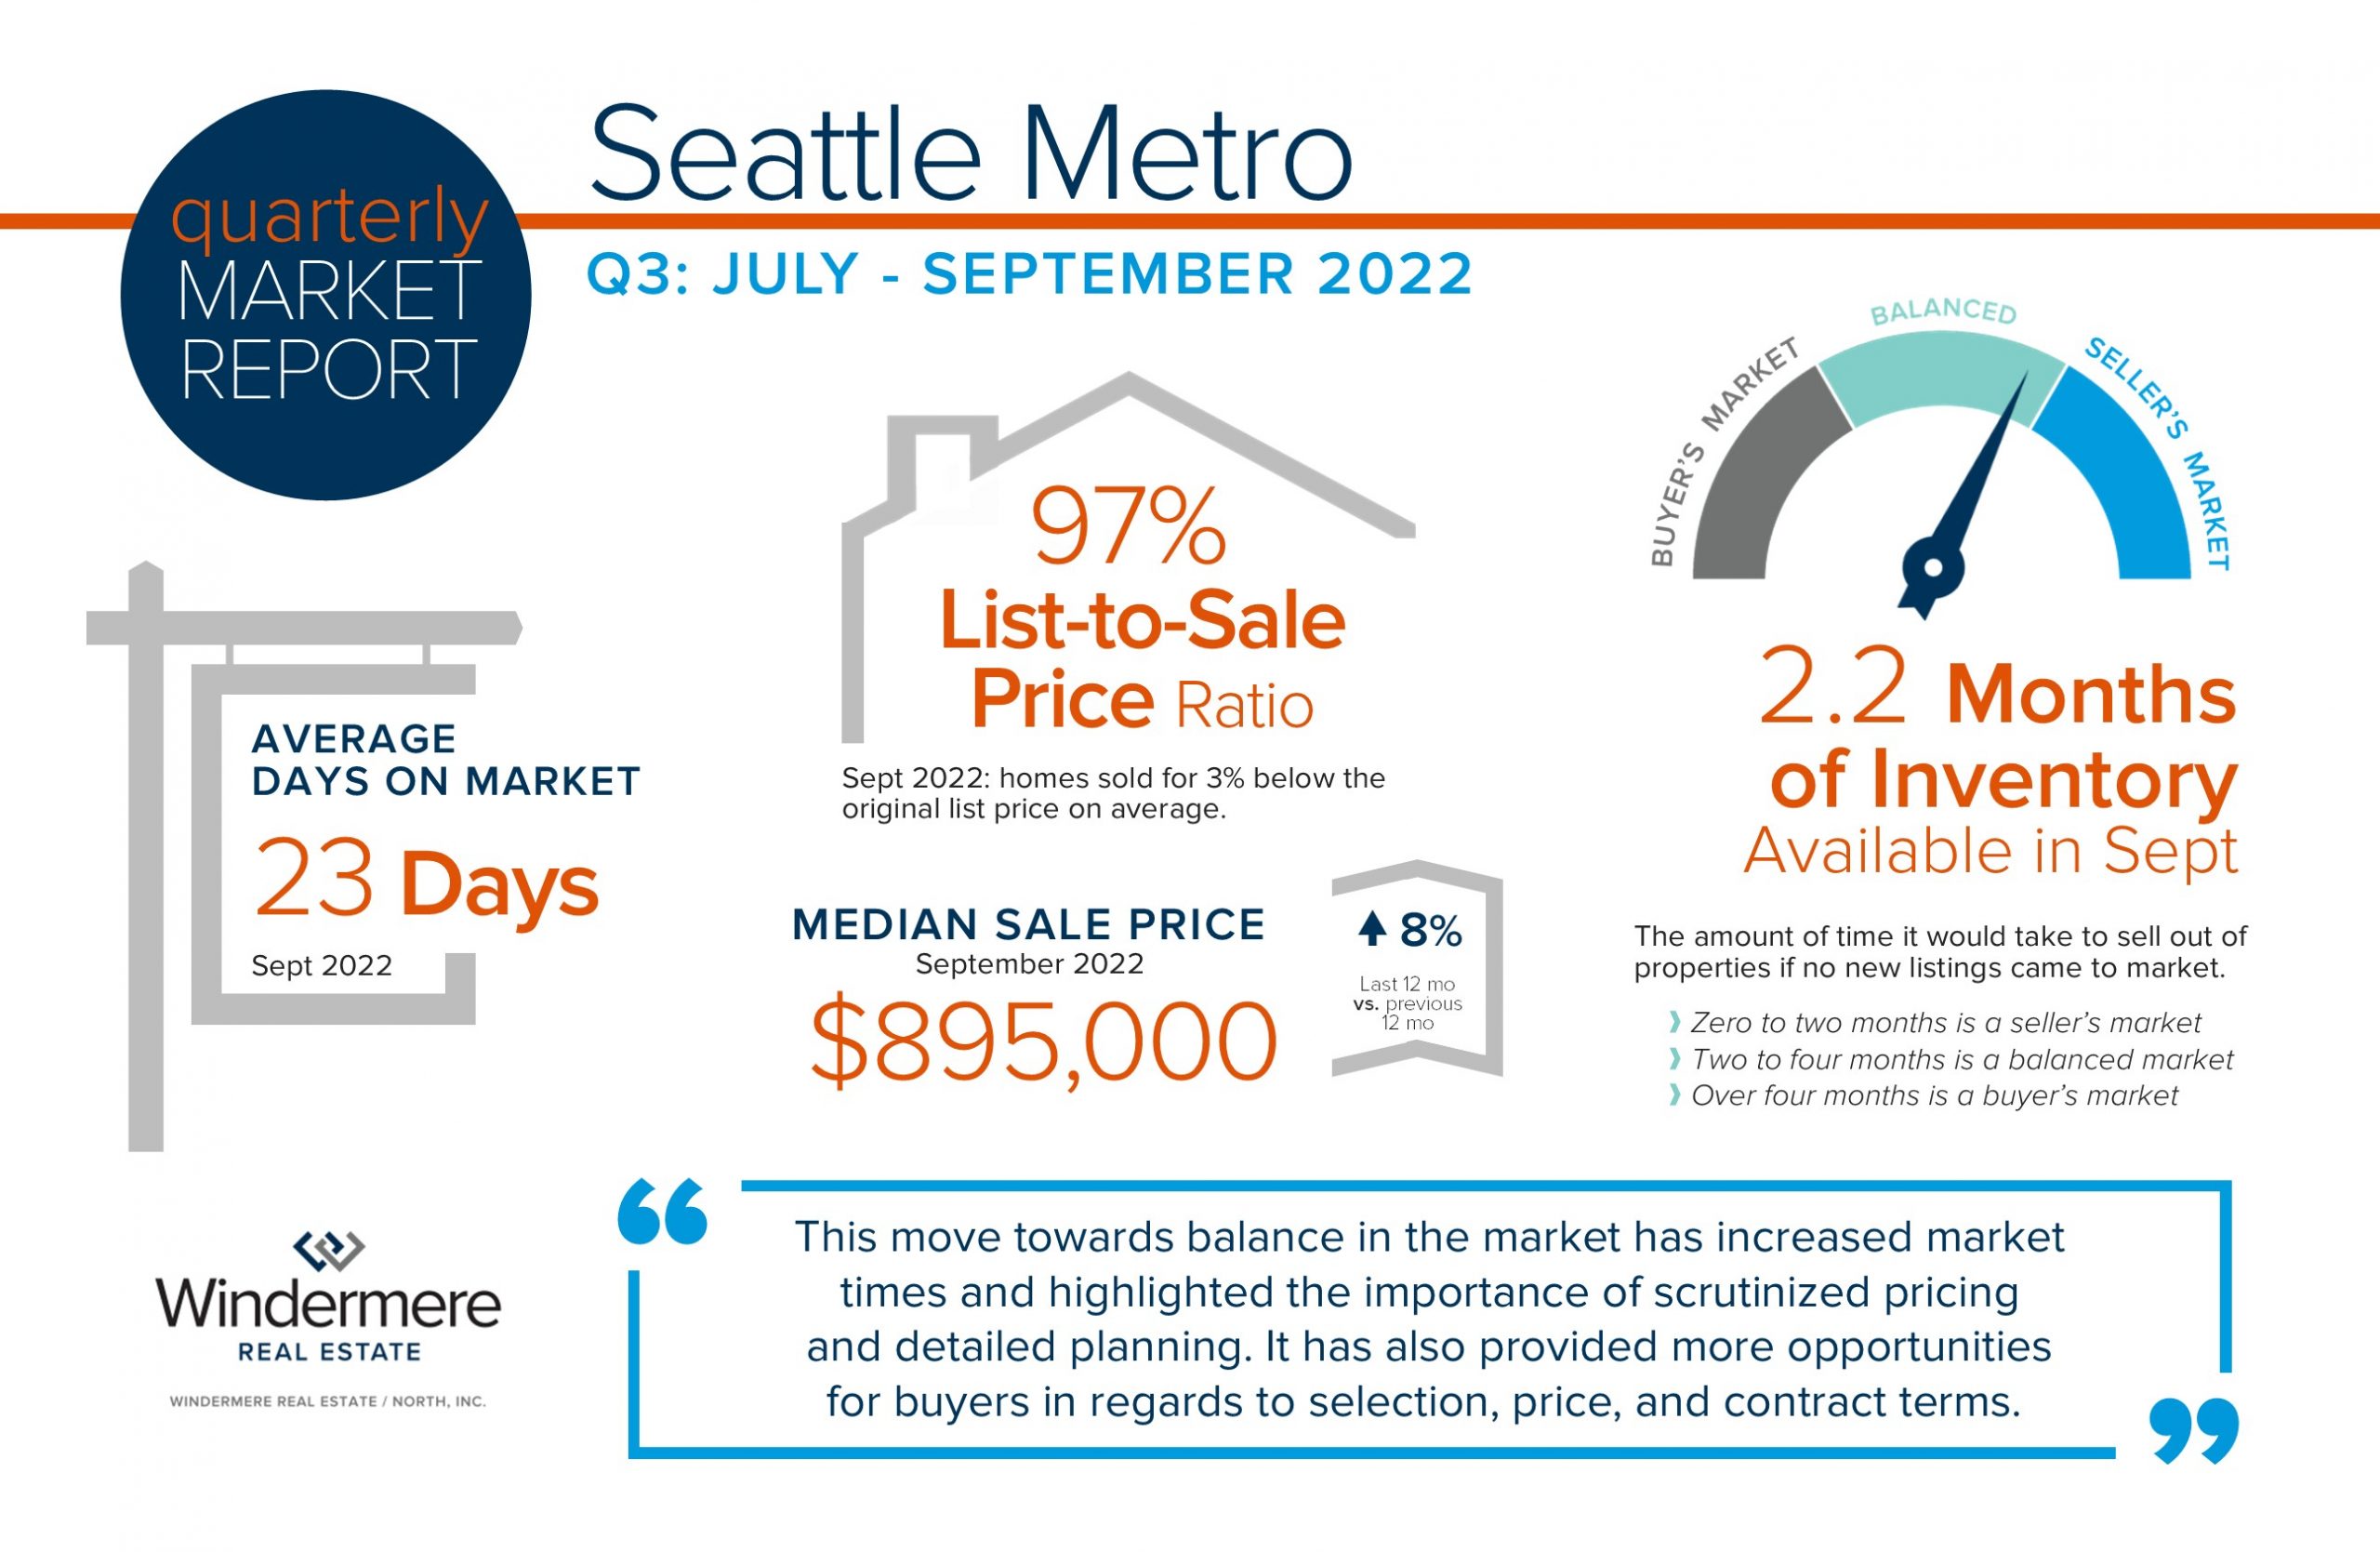
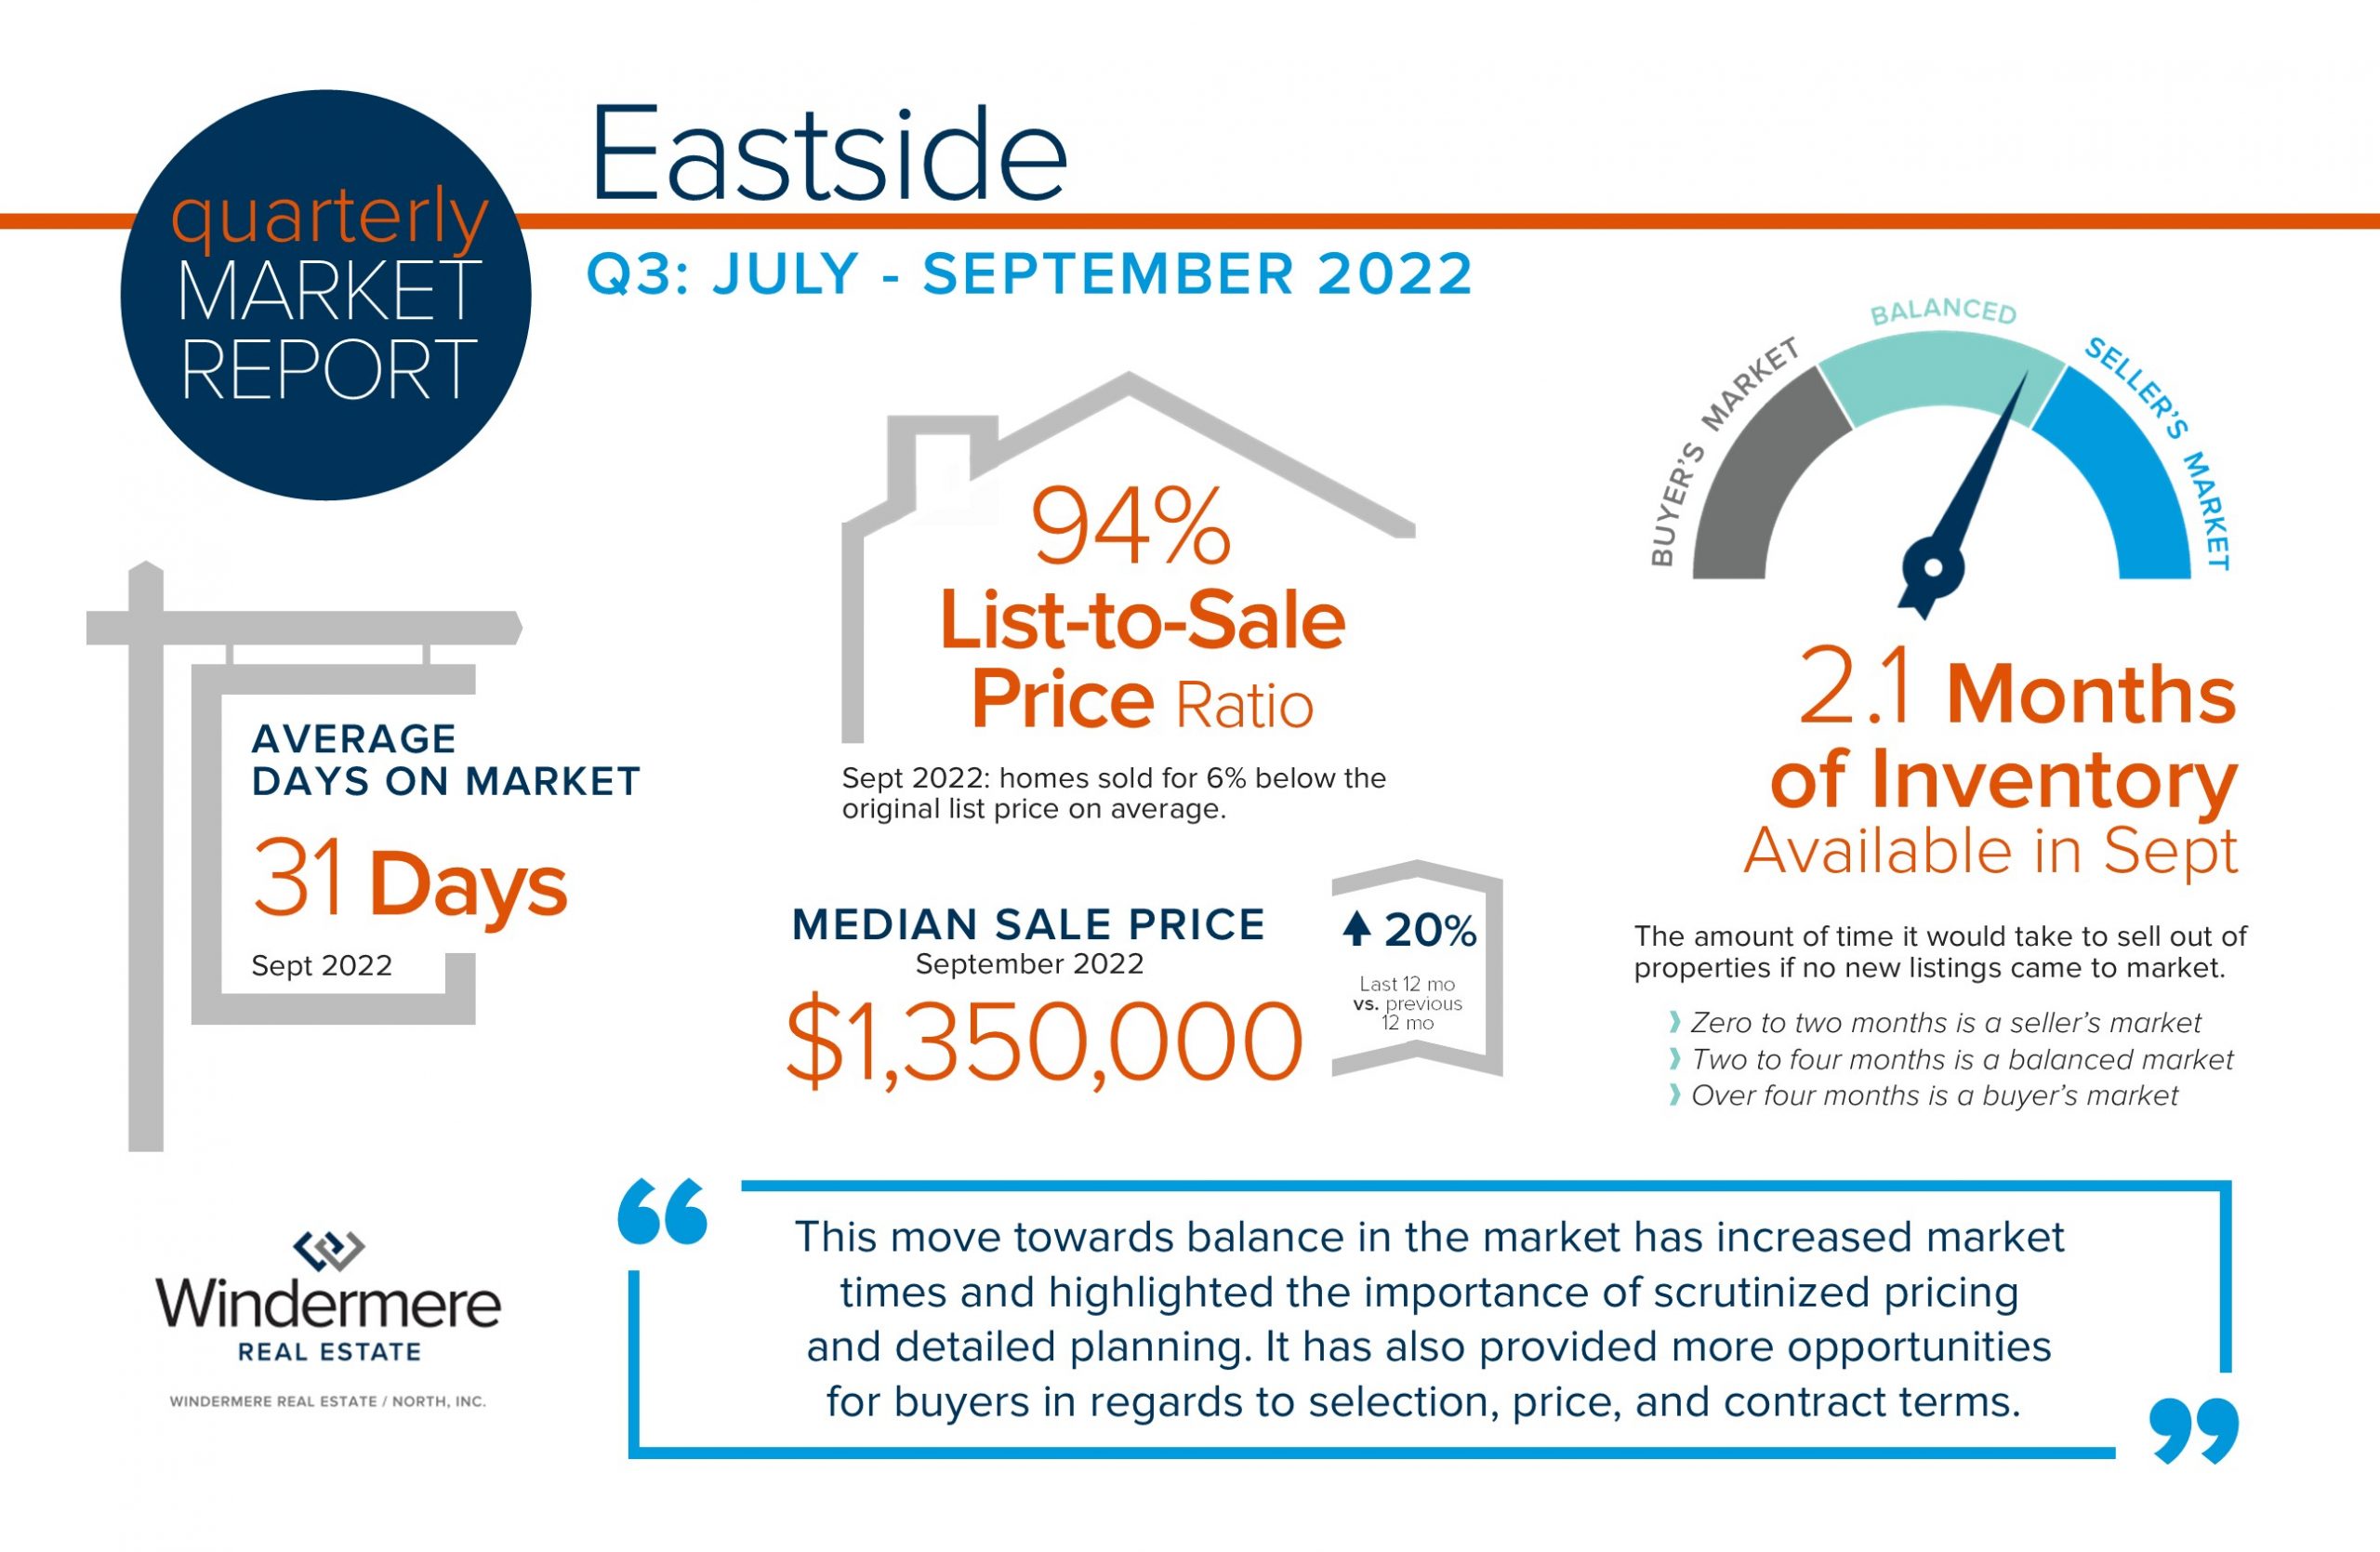
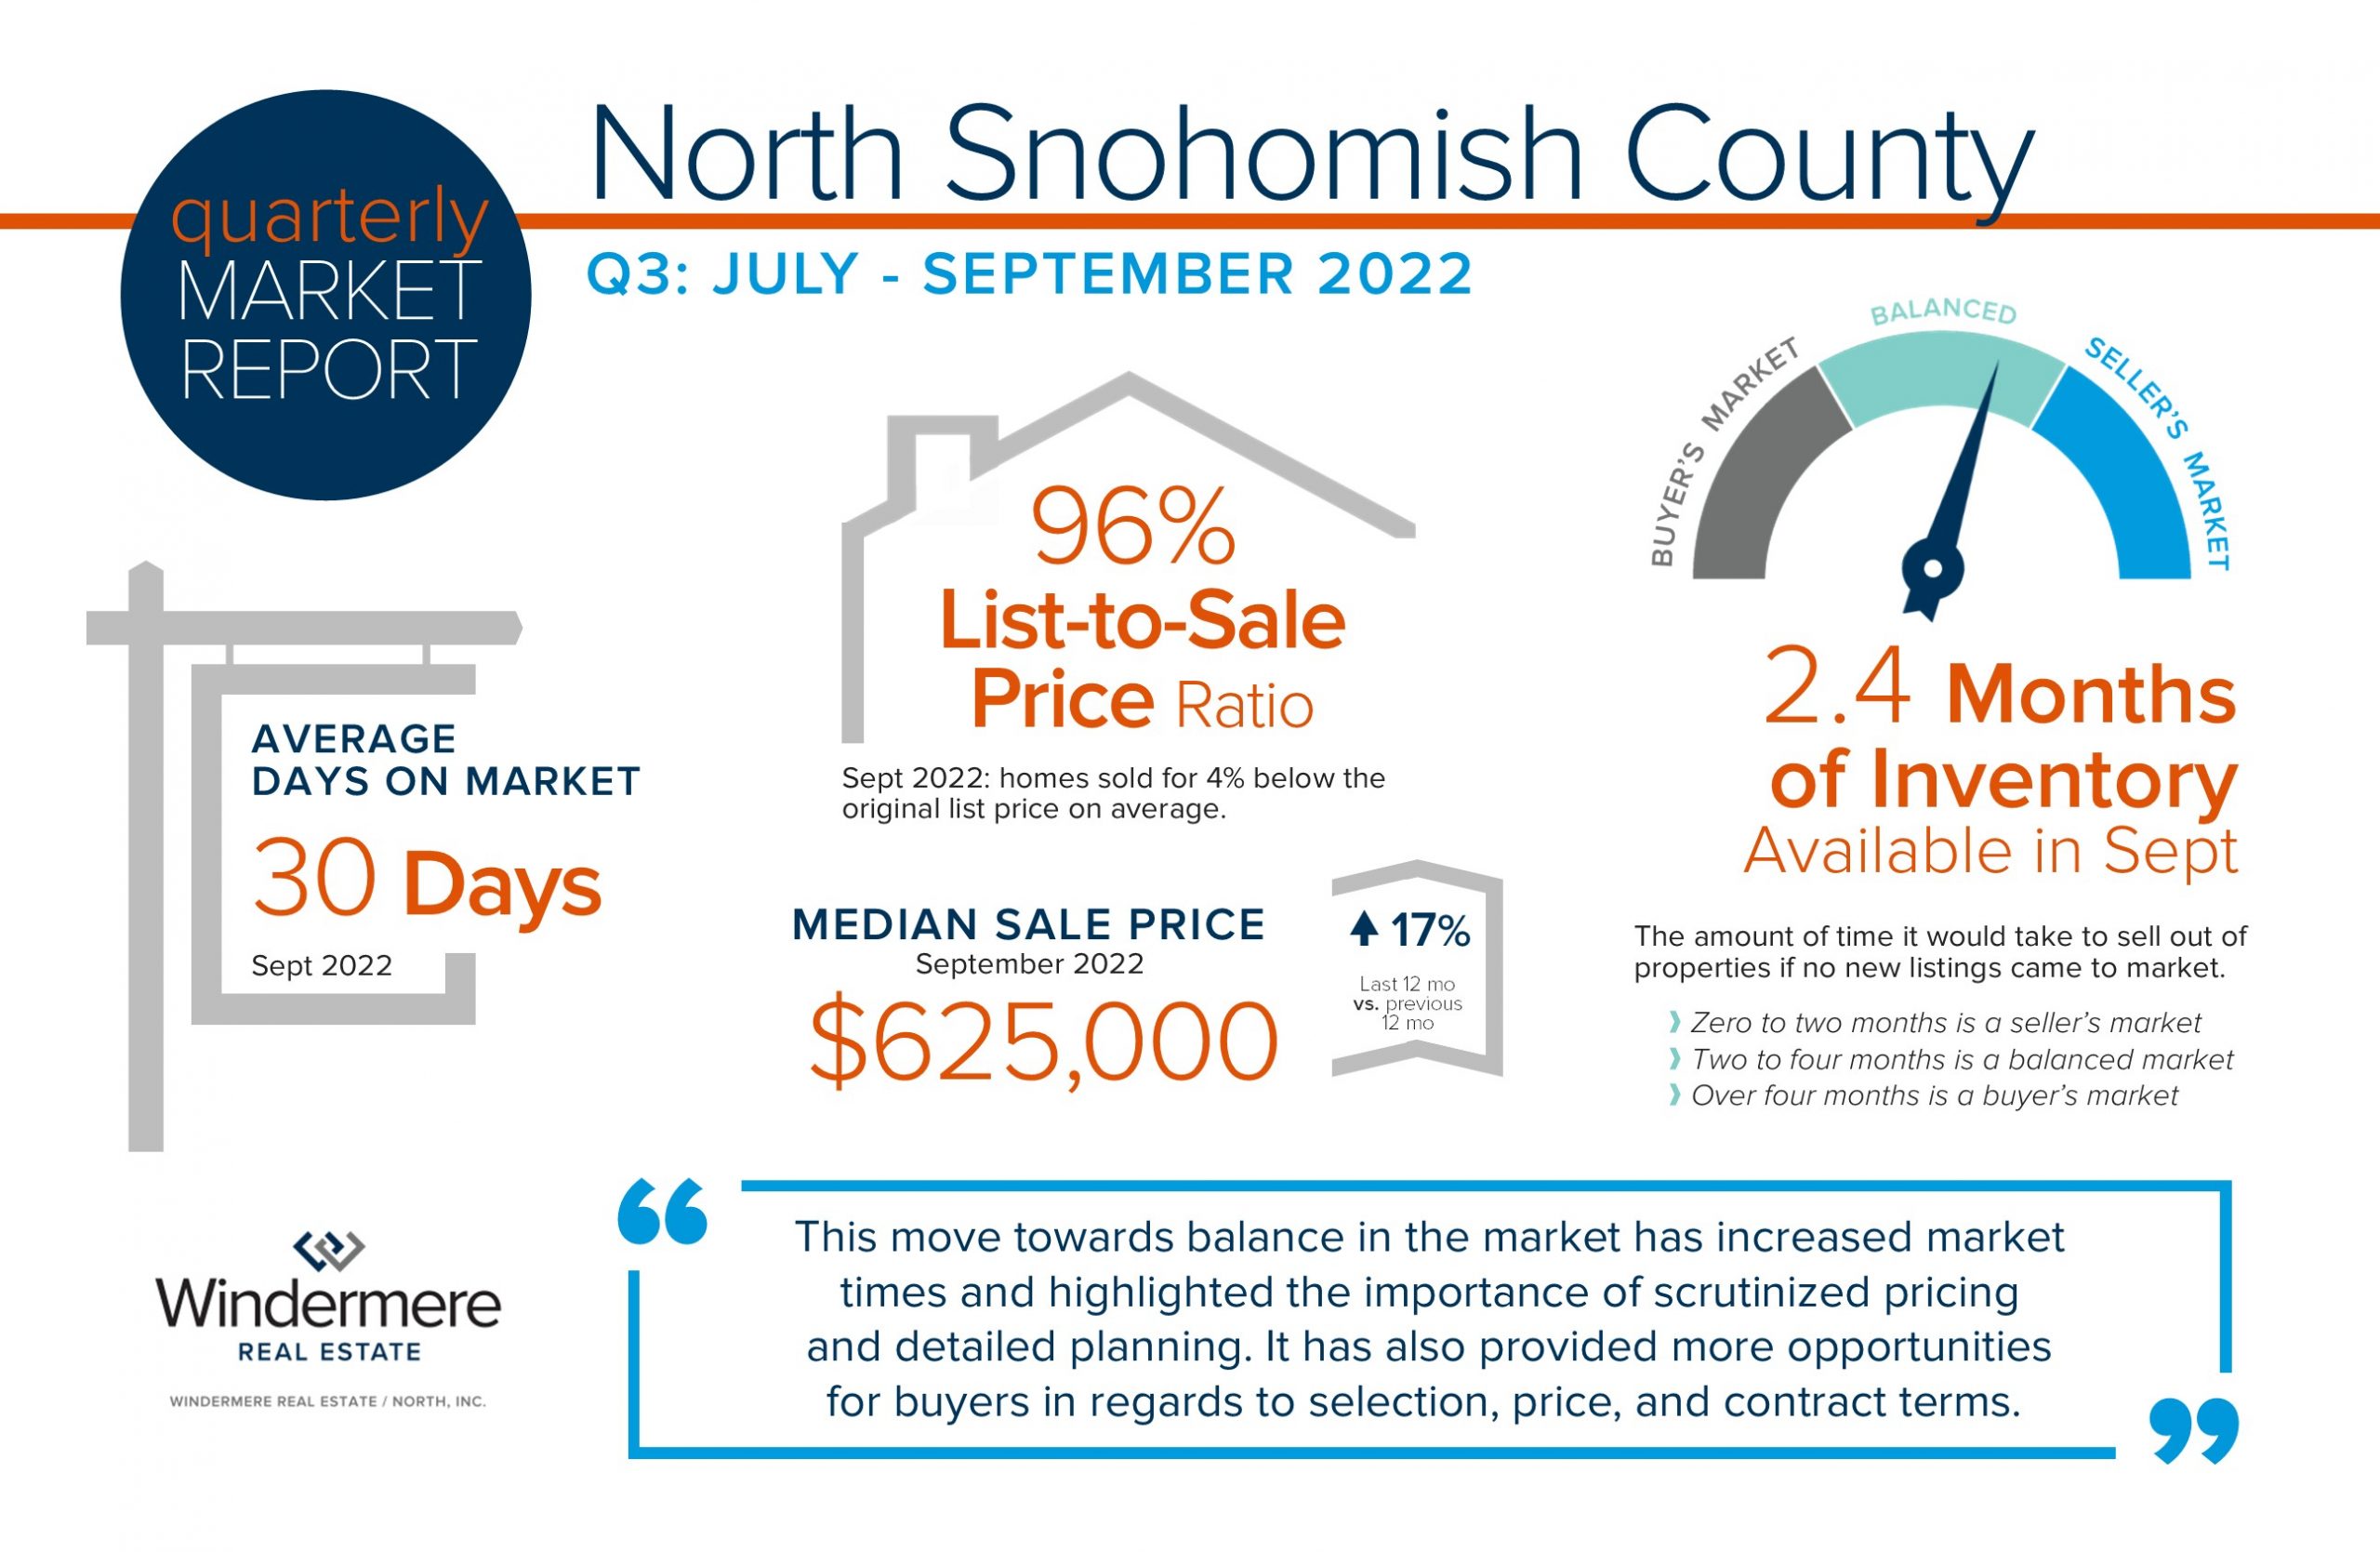
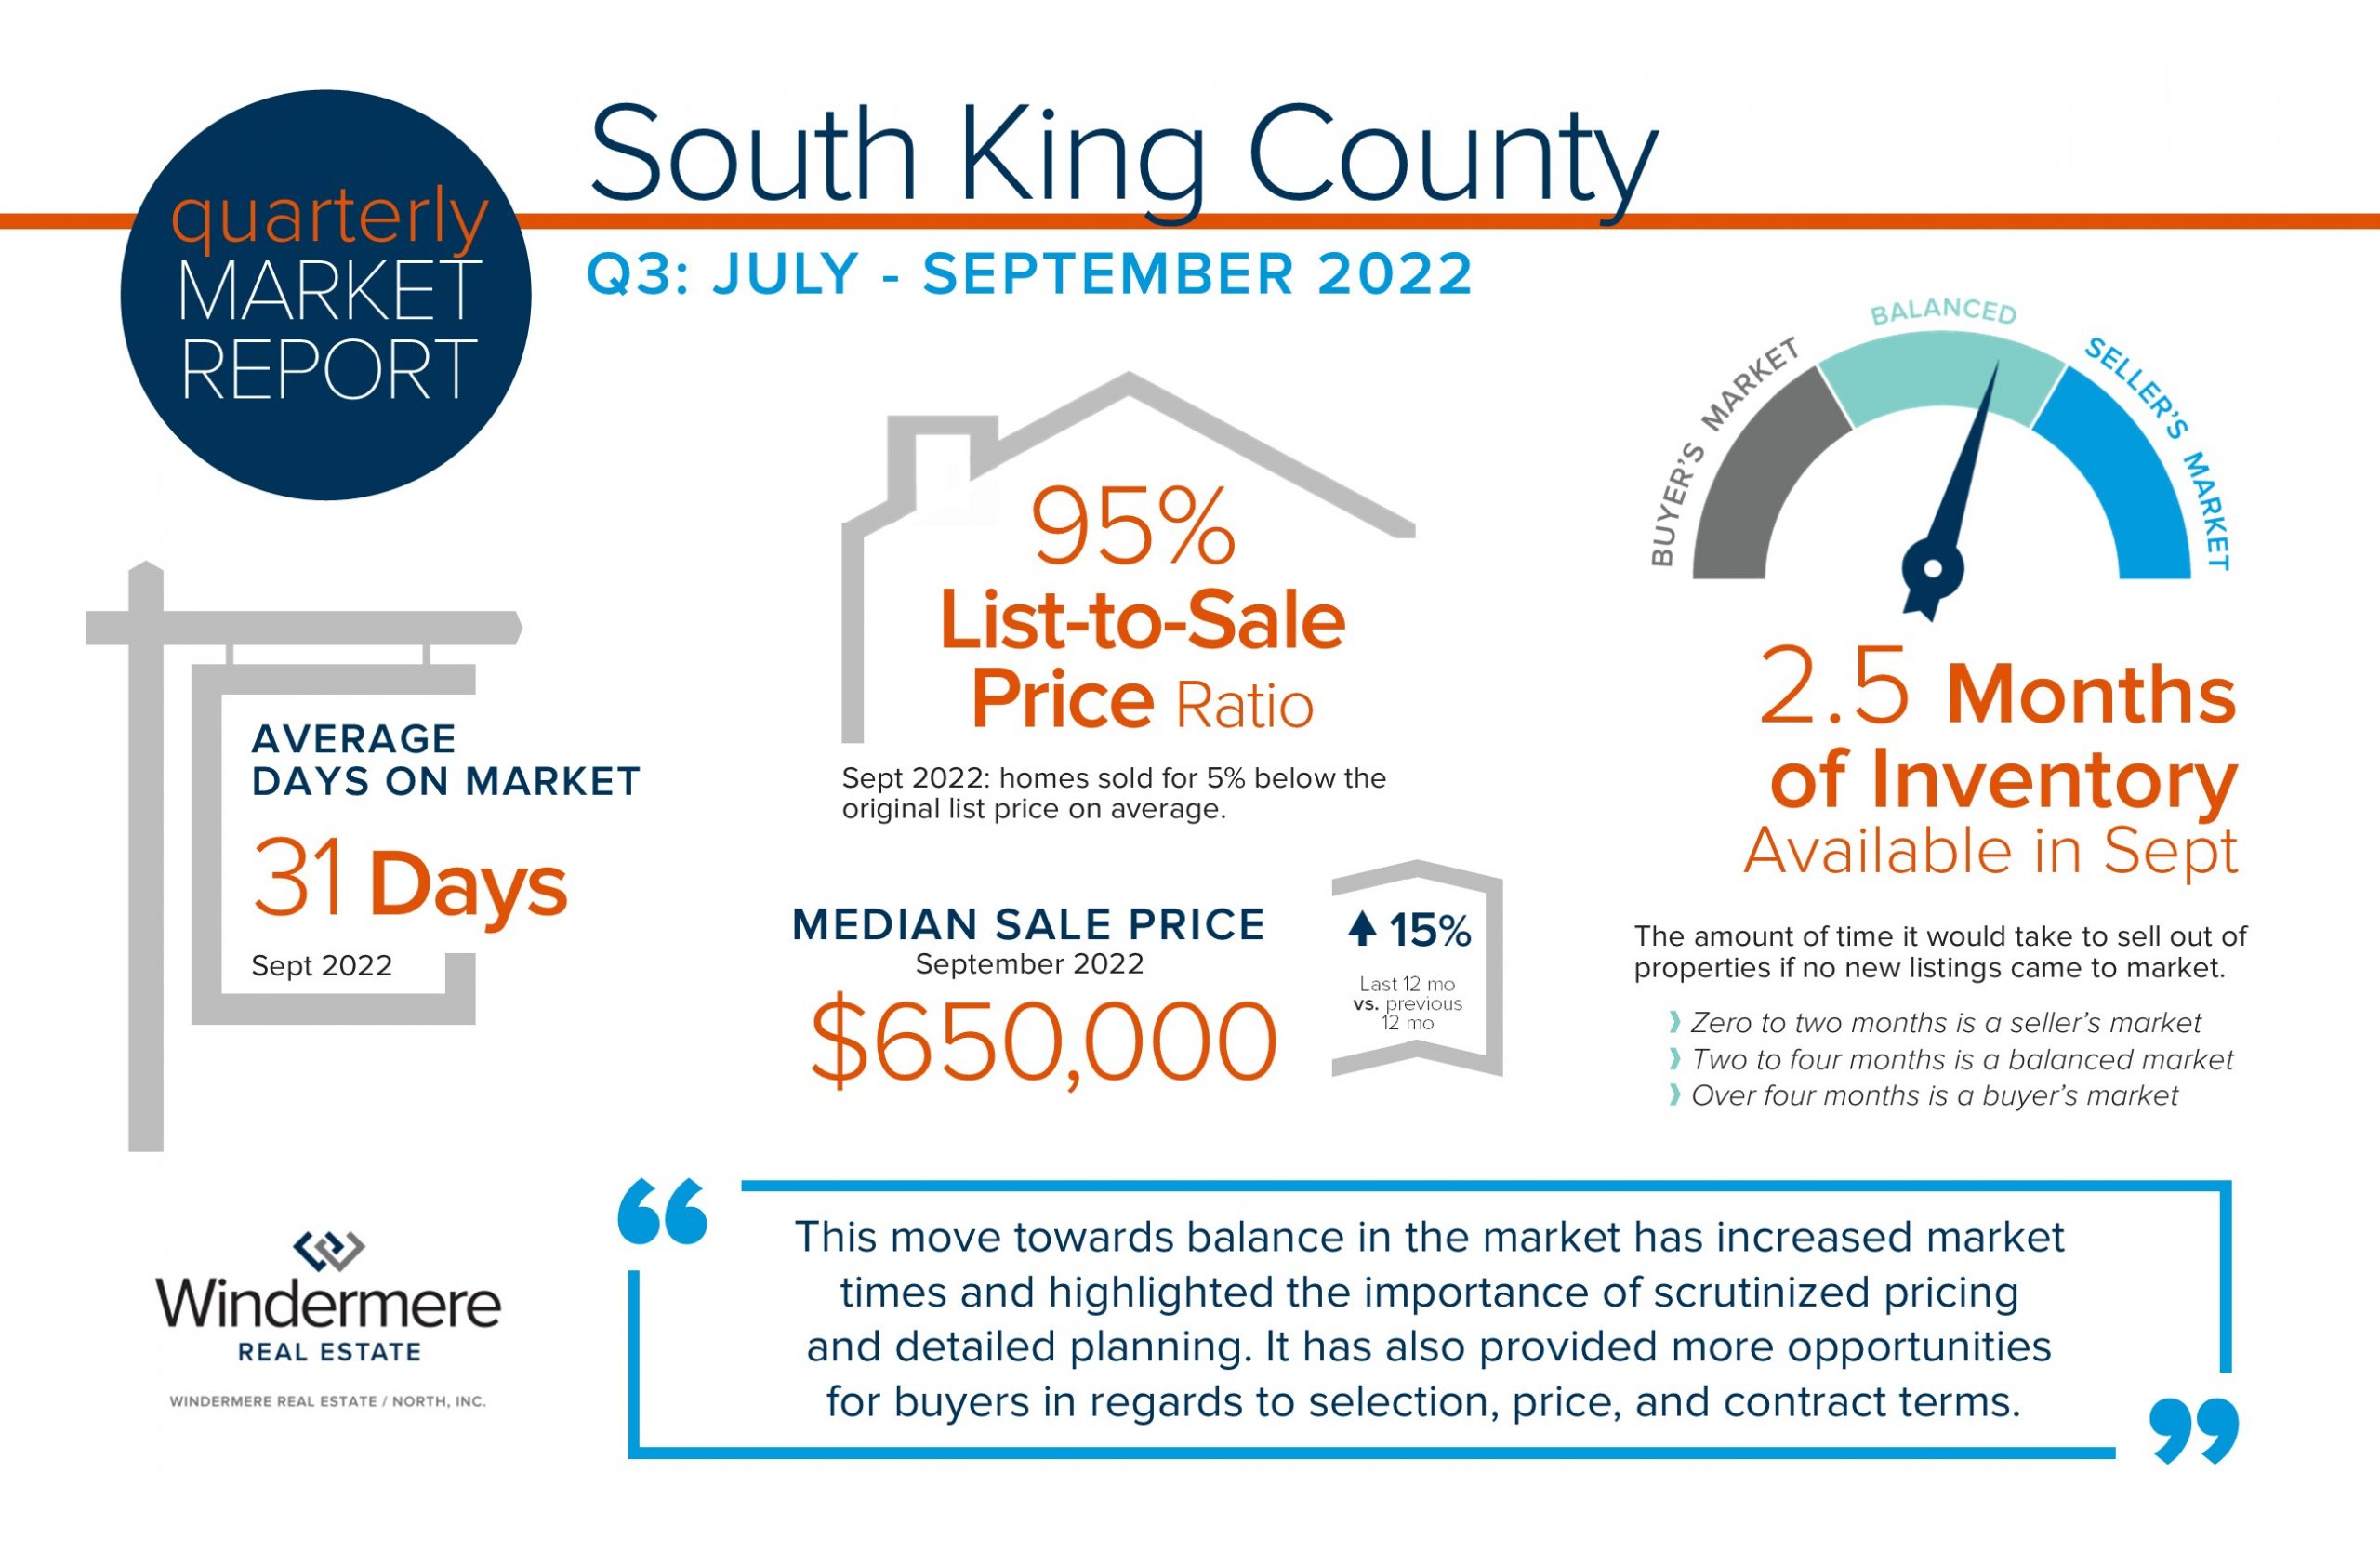
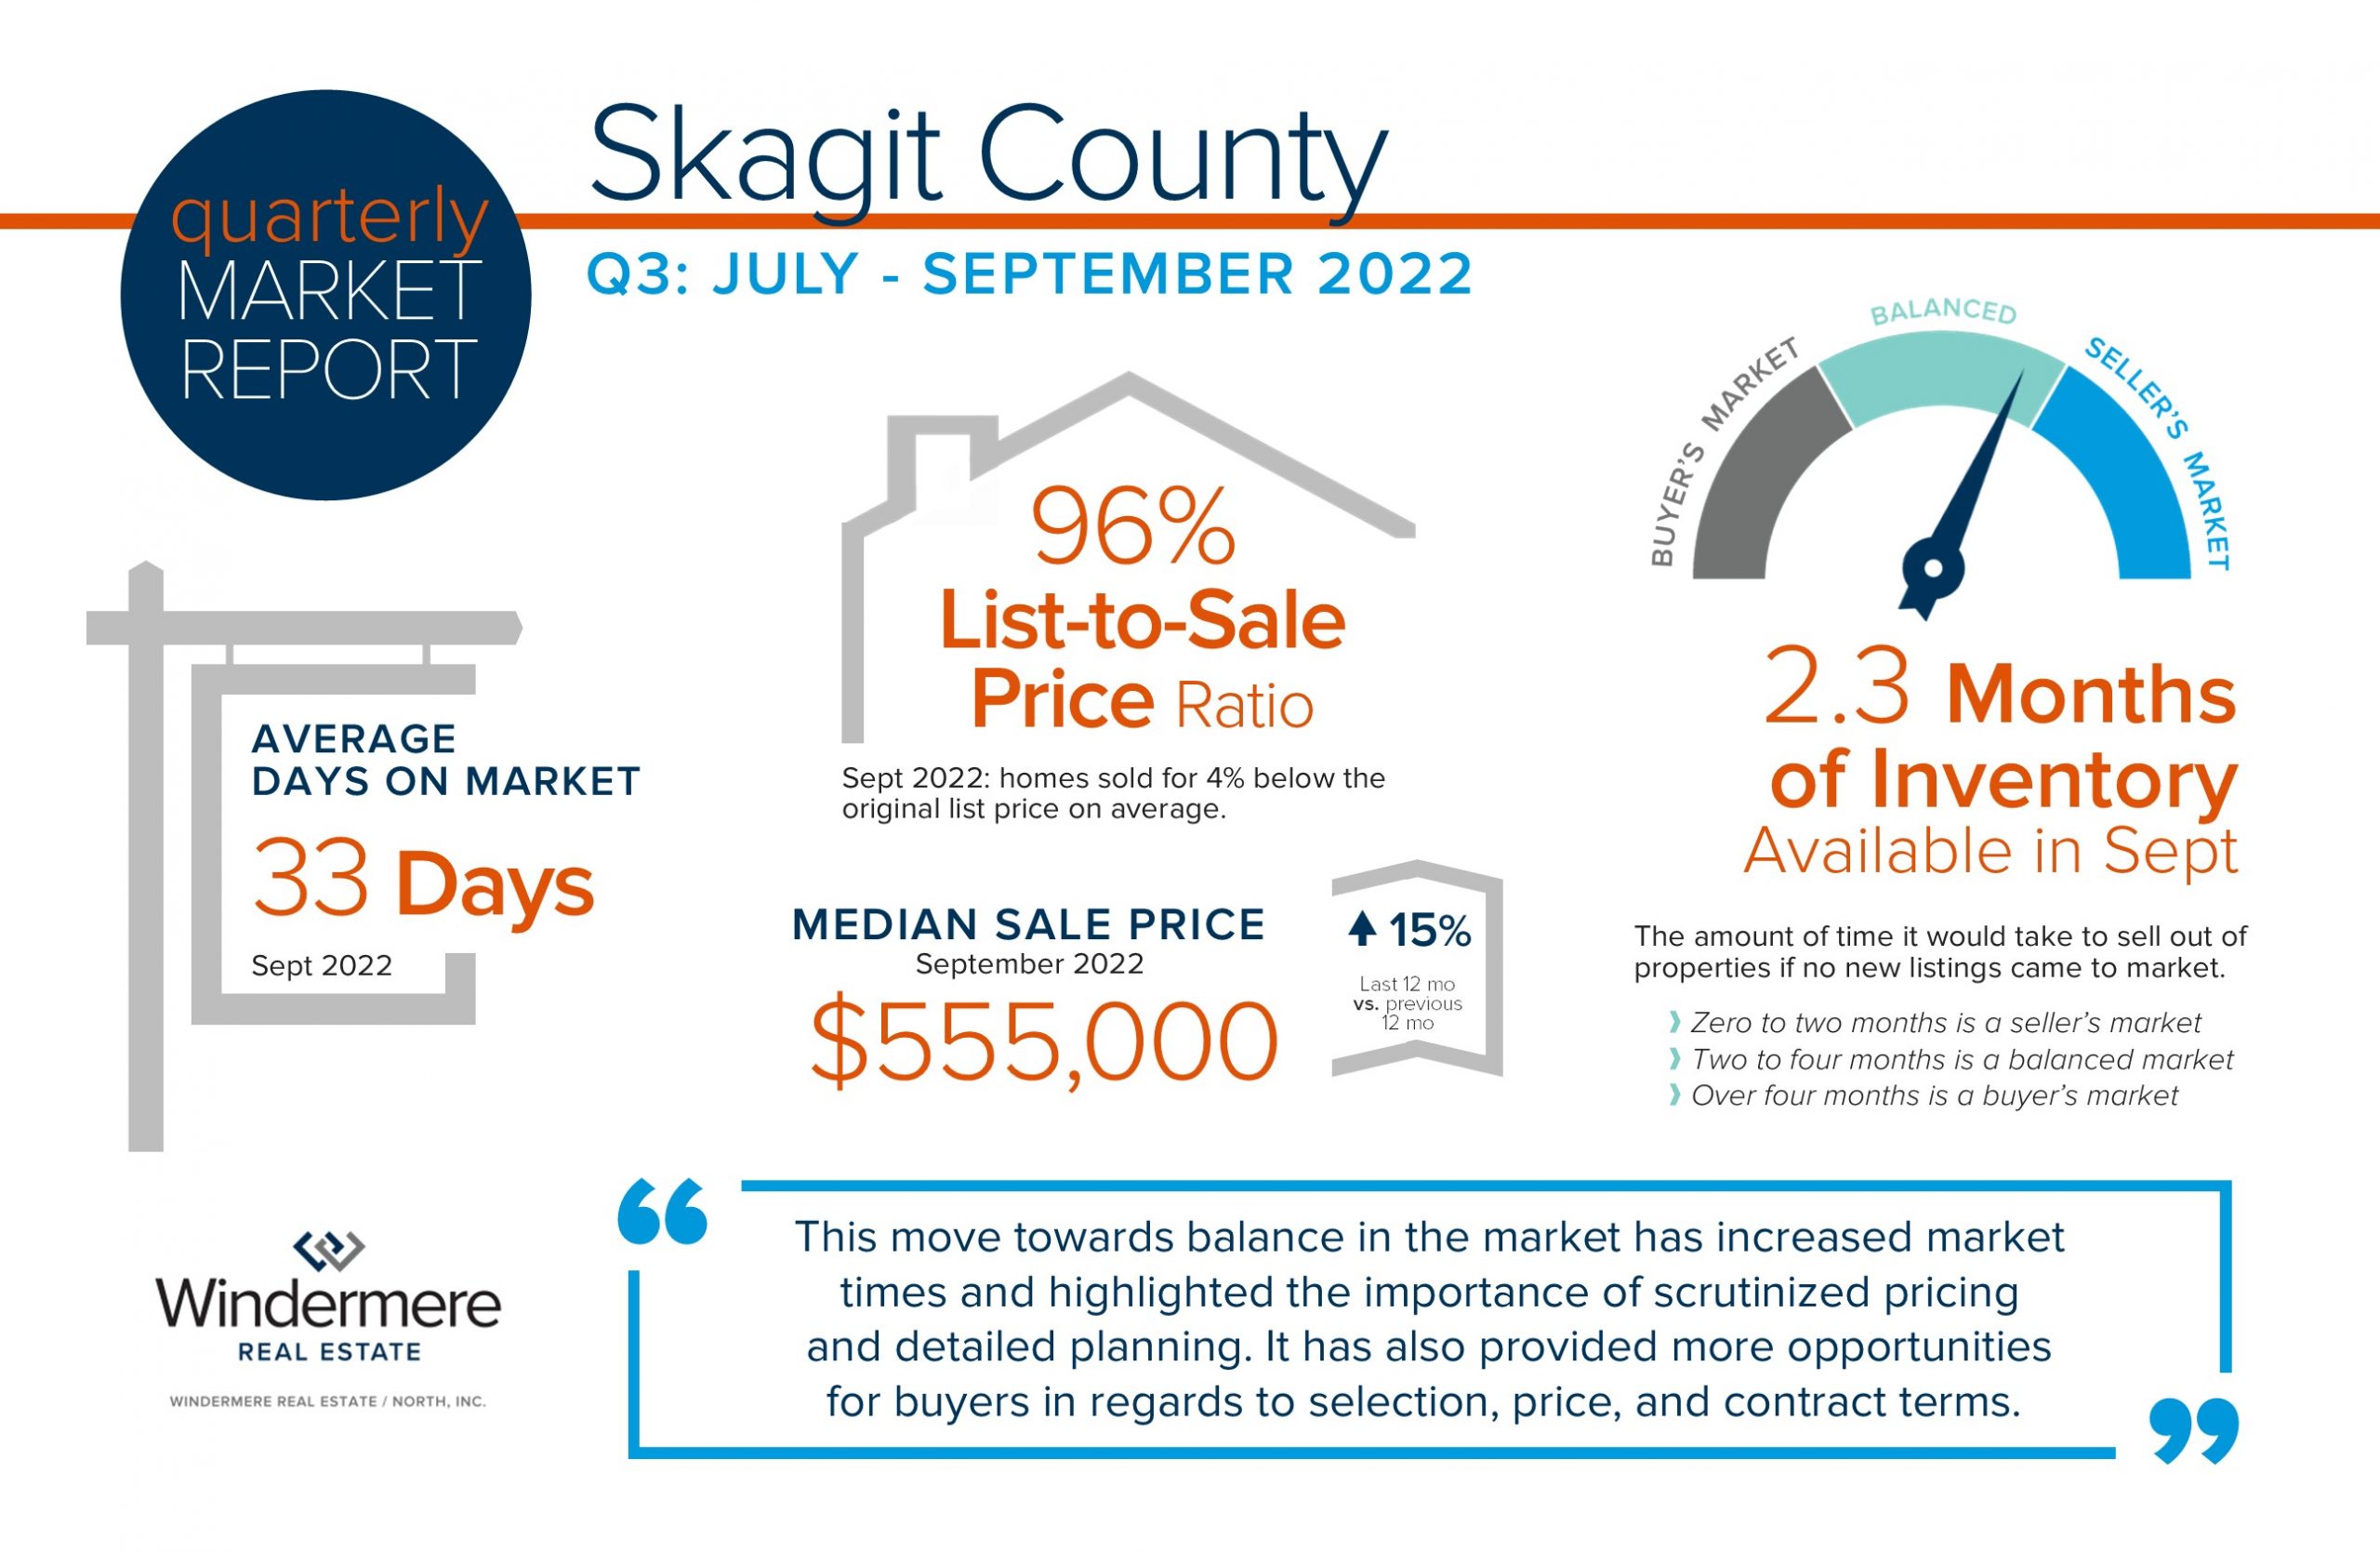
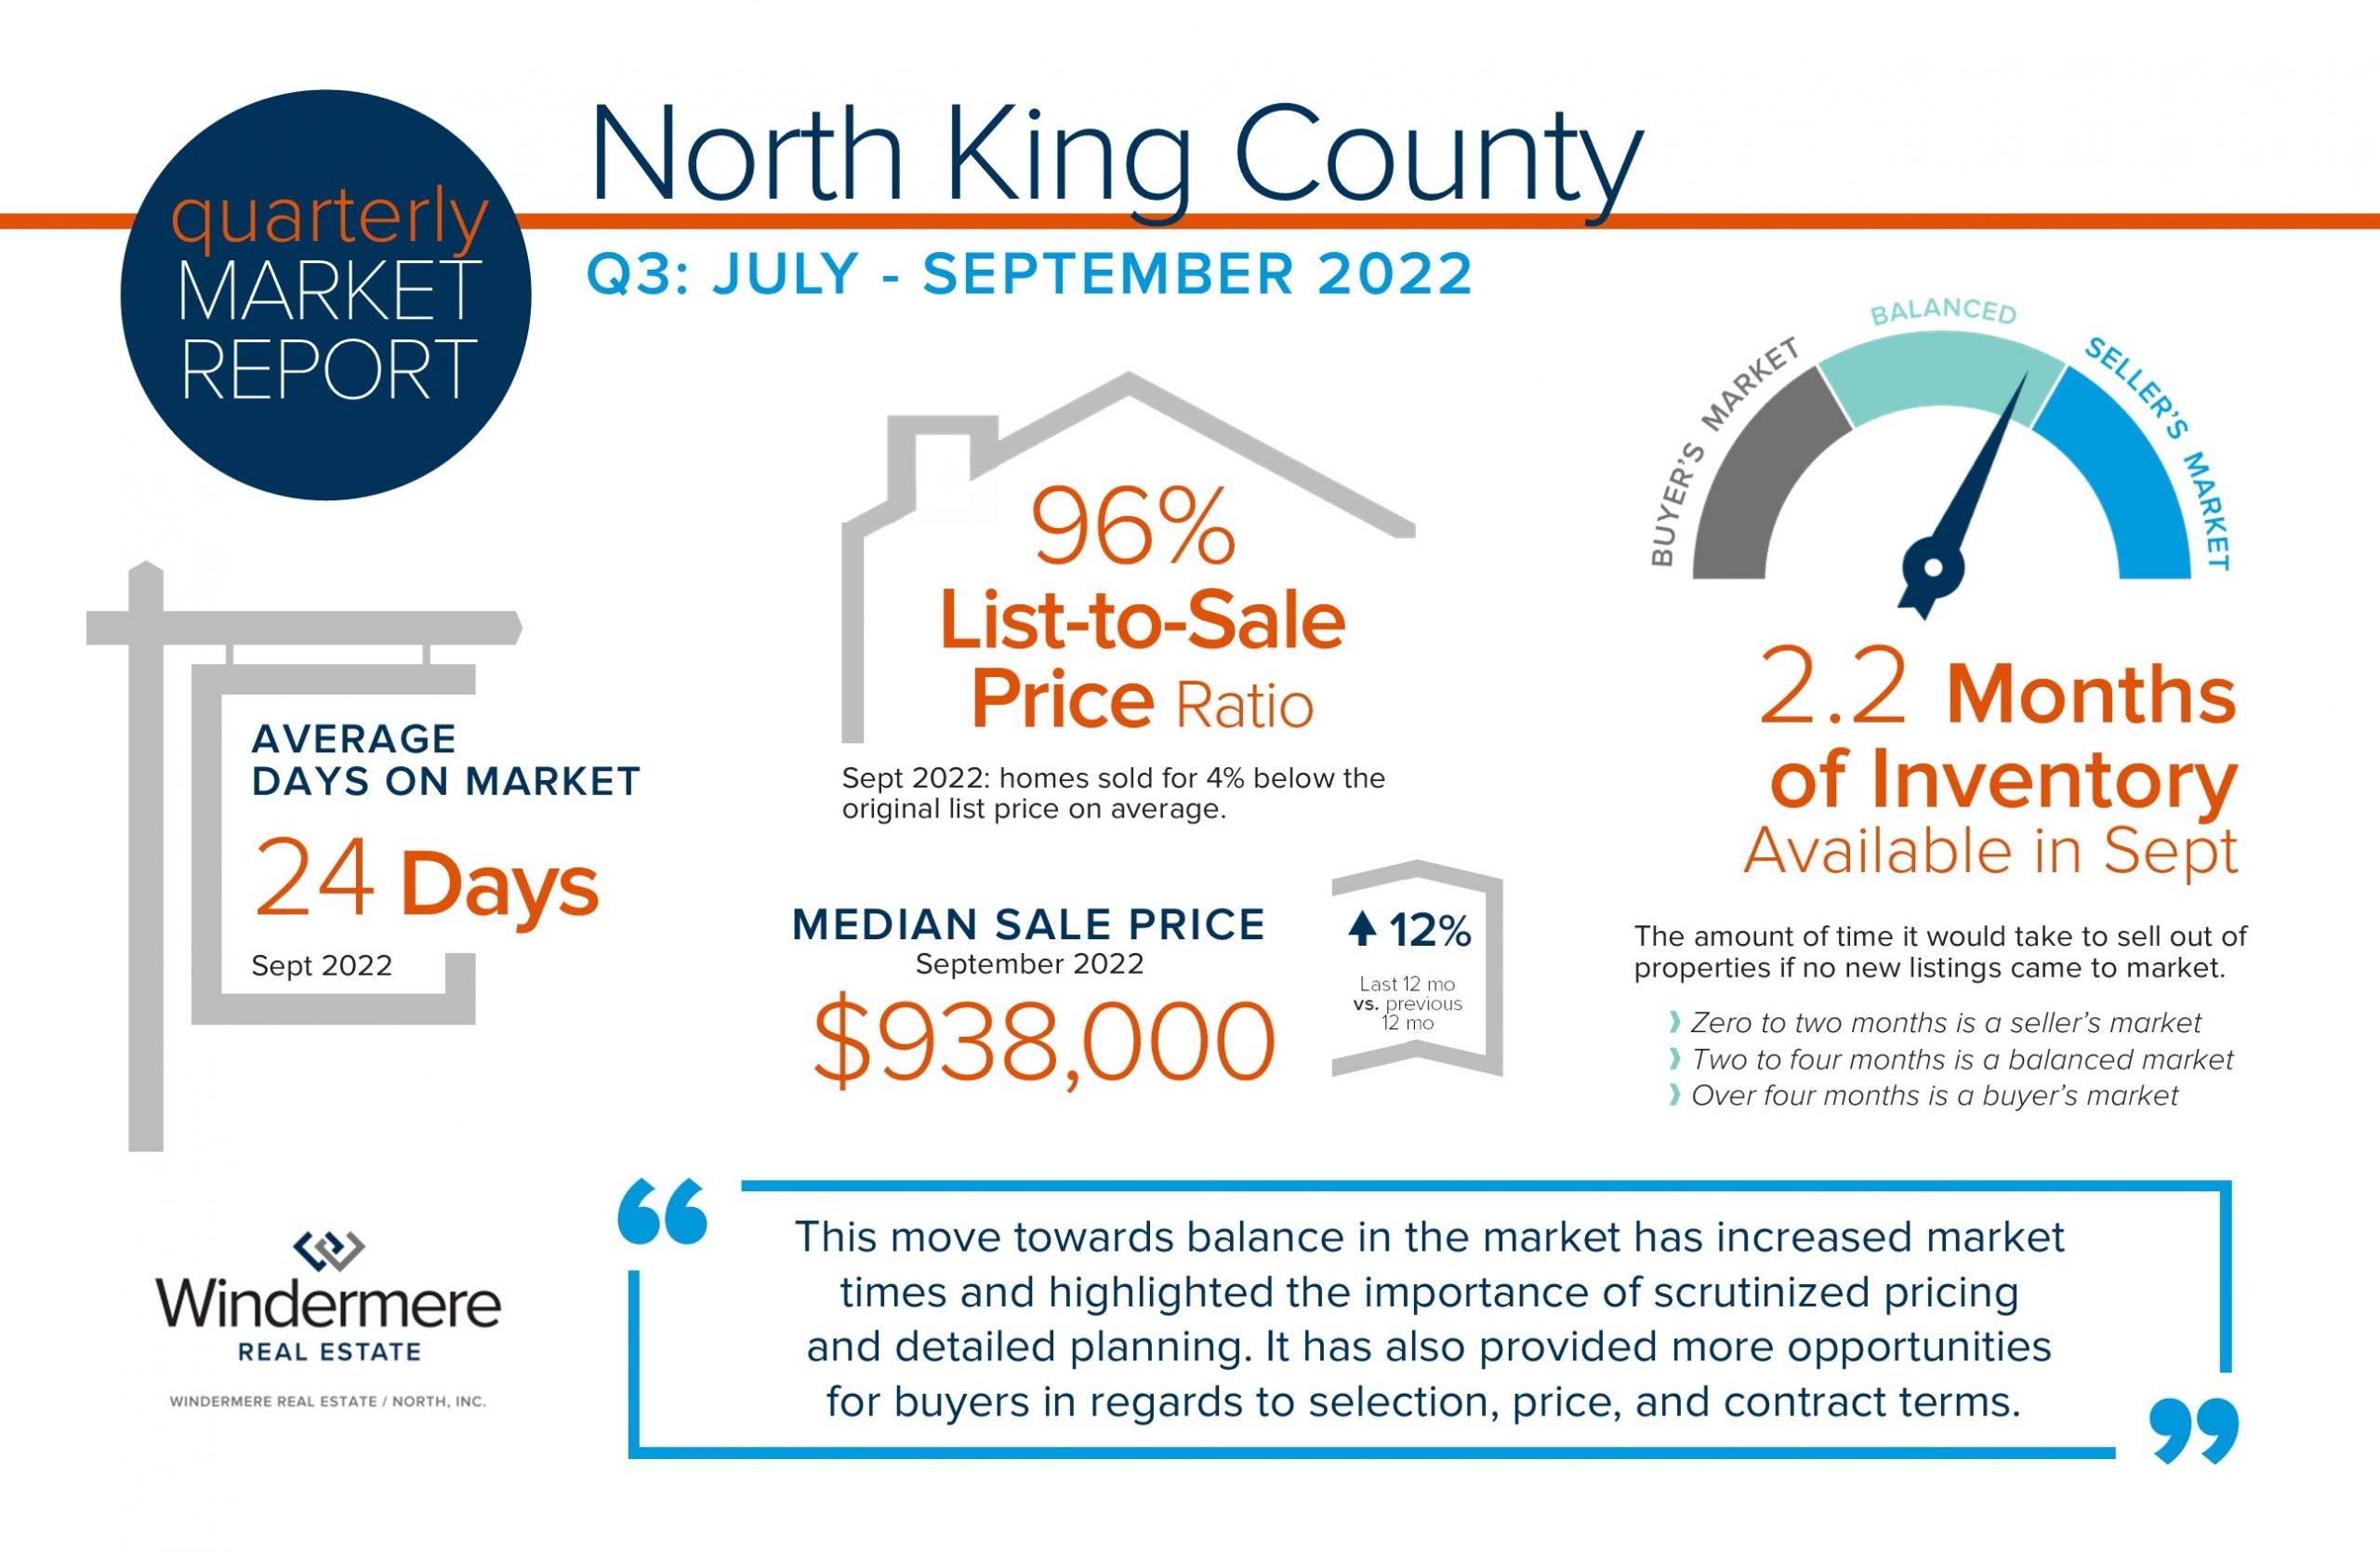 The real estate market is adjusting to new environmental factors as we round out 2022. Interest rates have been on an upward trend since the spring and have increased by 2 points since the first of the year. This has put downward pressure on the peak prices we saw in the spring as we return to more normalized, historical rates. We must keep in perspective the strong year-over-year price gains as these environmental factors settle out. Additionally, we are sitting on top of 10 years of price growth resulting in over 50% of homeowners in WA state with at least 50% home equity.
This move towards balance in the market has increased market times and highlighted the importance of scrutinized pricing and detailed planning. It has also provided more opportunities for buyers in regards to selection, price, and contract terms. This market requires keen analytical skills, strategic negotiations, creativity, and a higher level of customer care.
I welcome the balance and normalization and look forward to helping my clients make moves to match their needs in life! Please reach out if you are curious about how the market relates to your goals or know someone that needs my help.

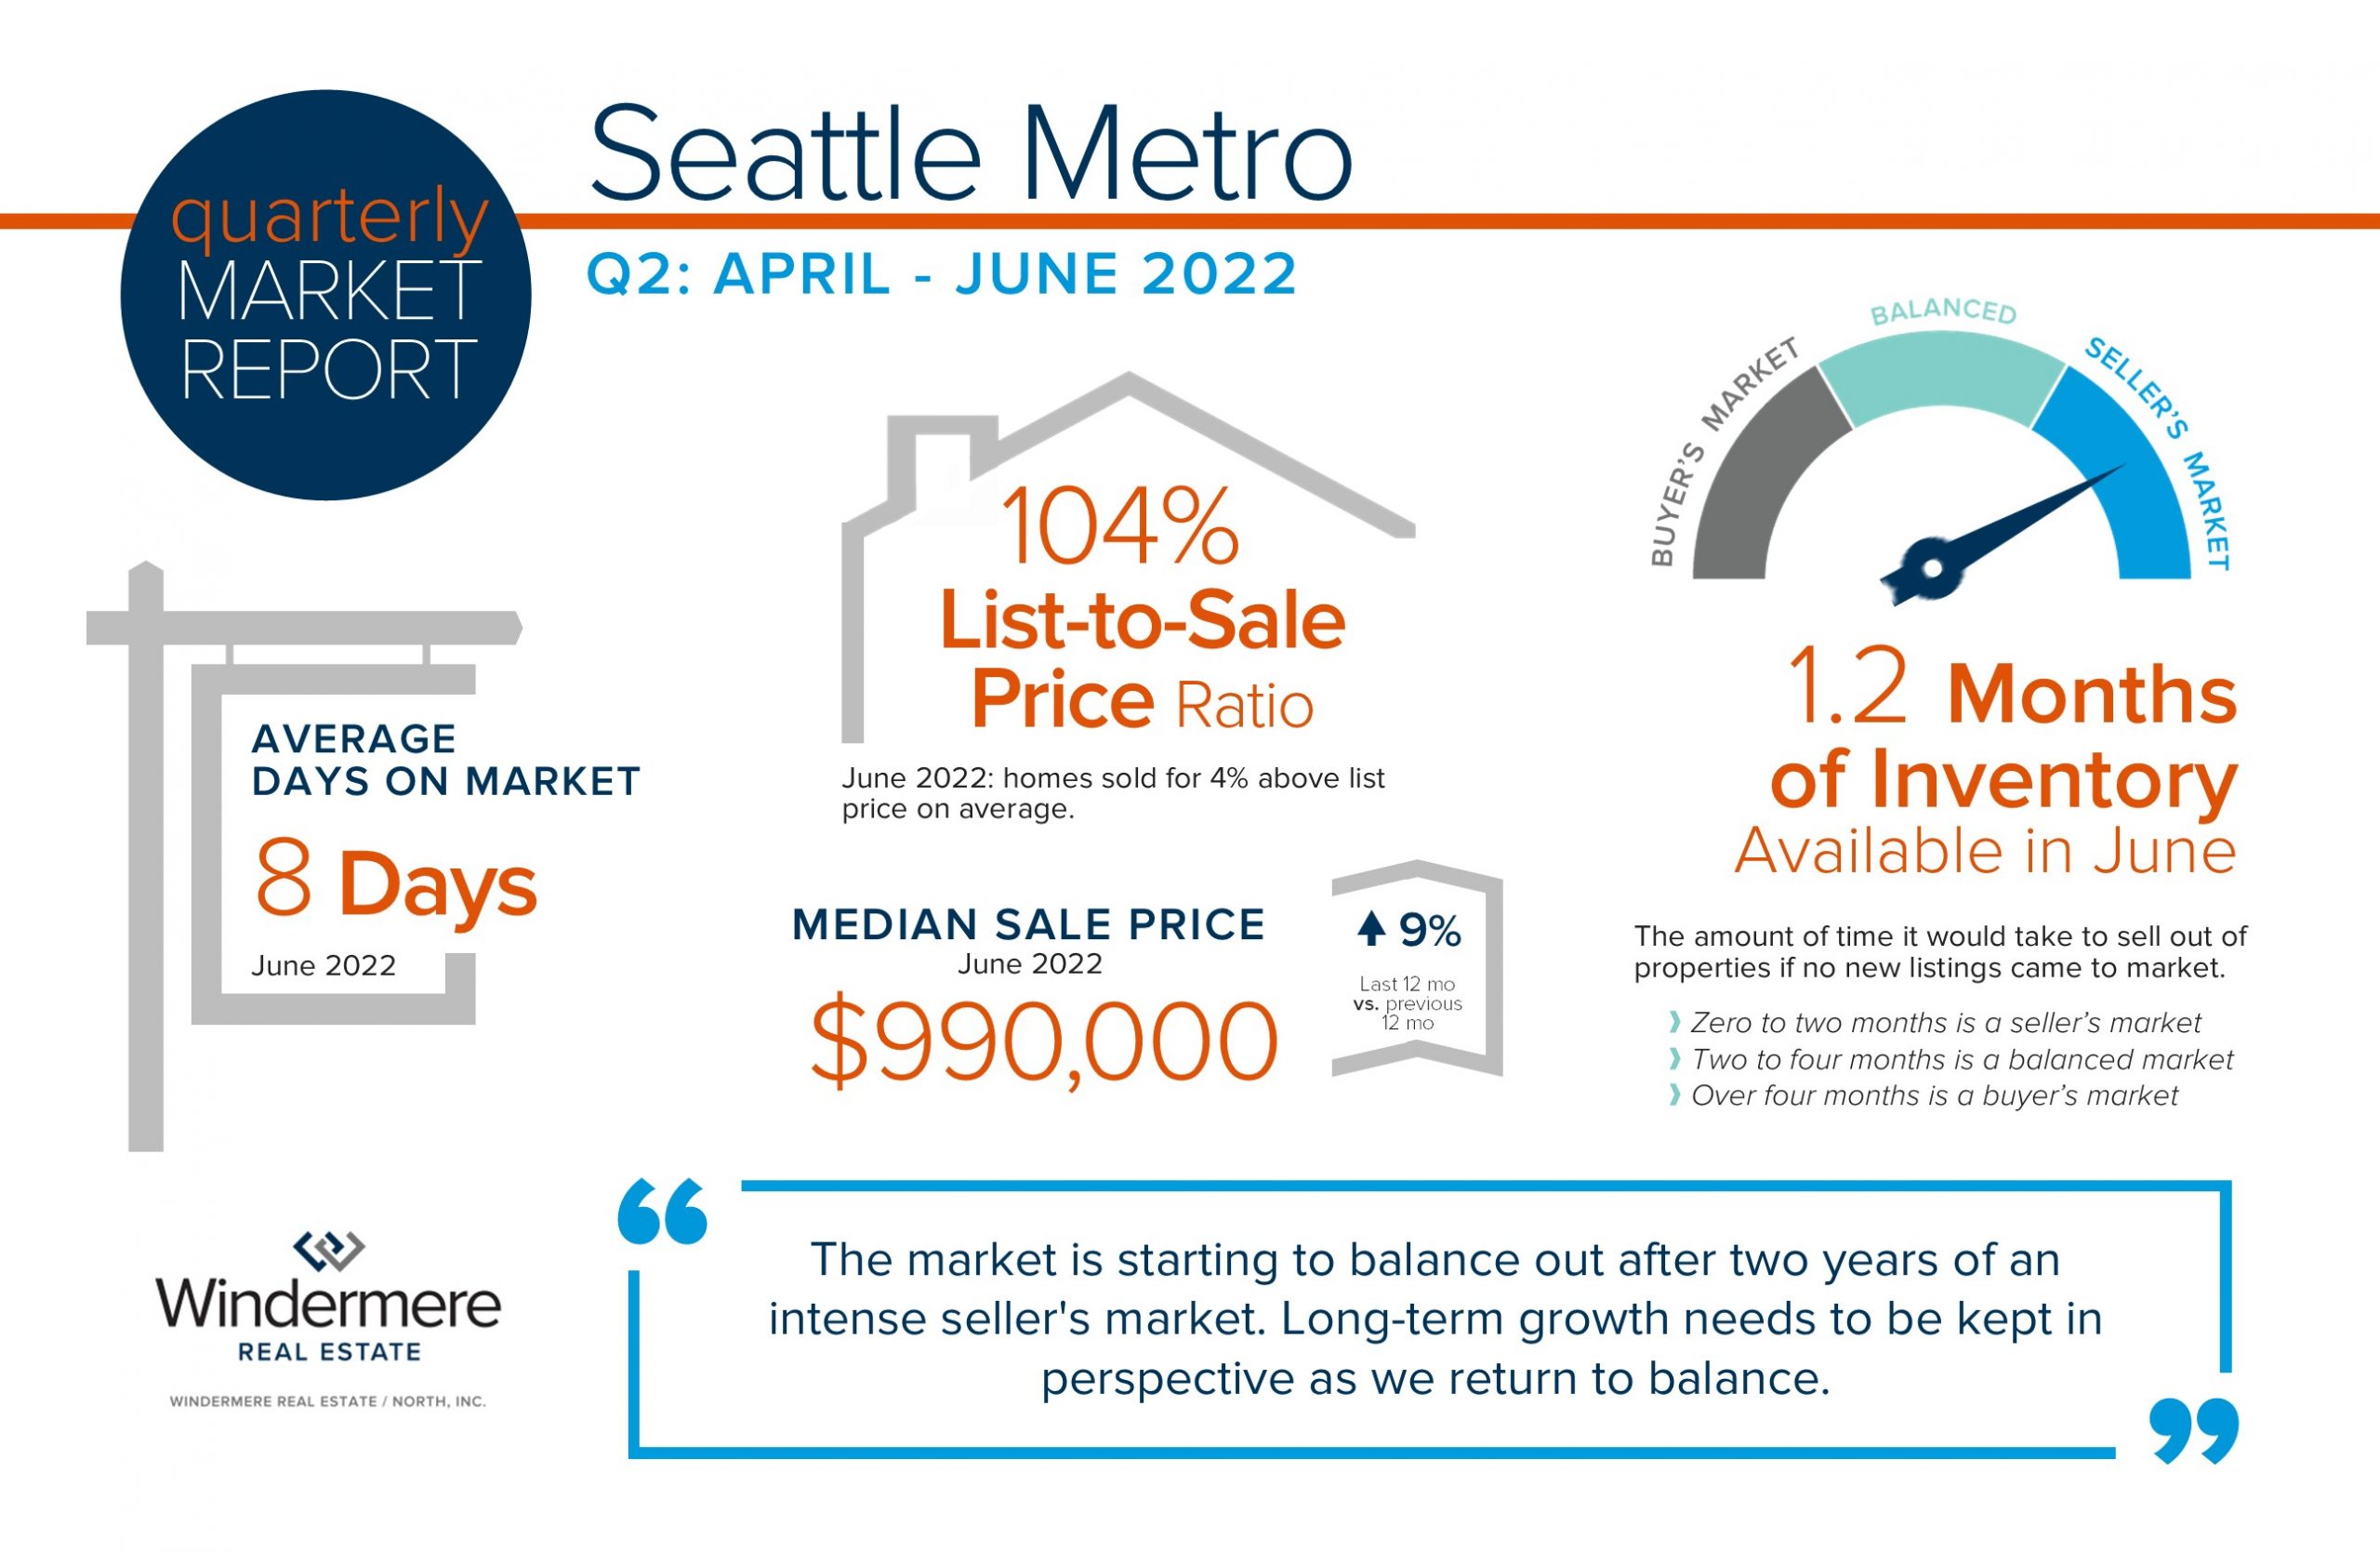
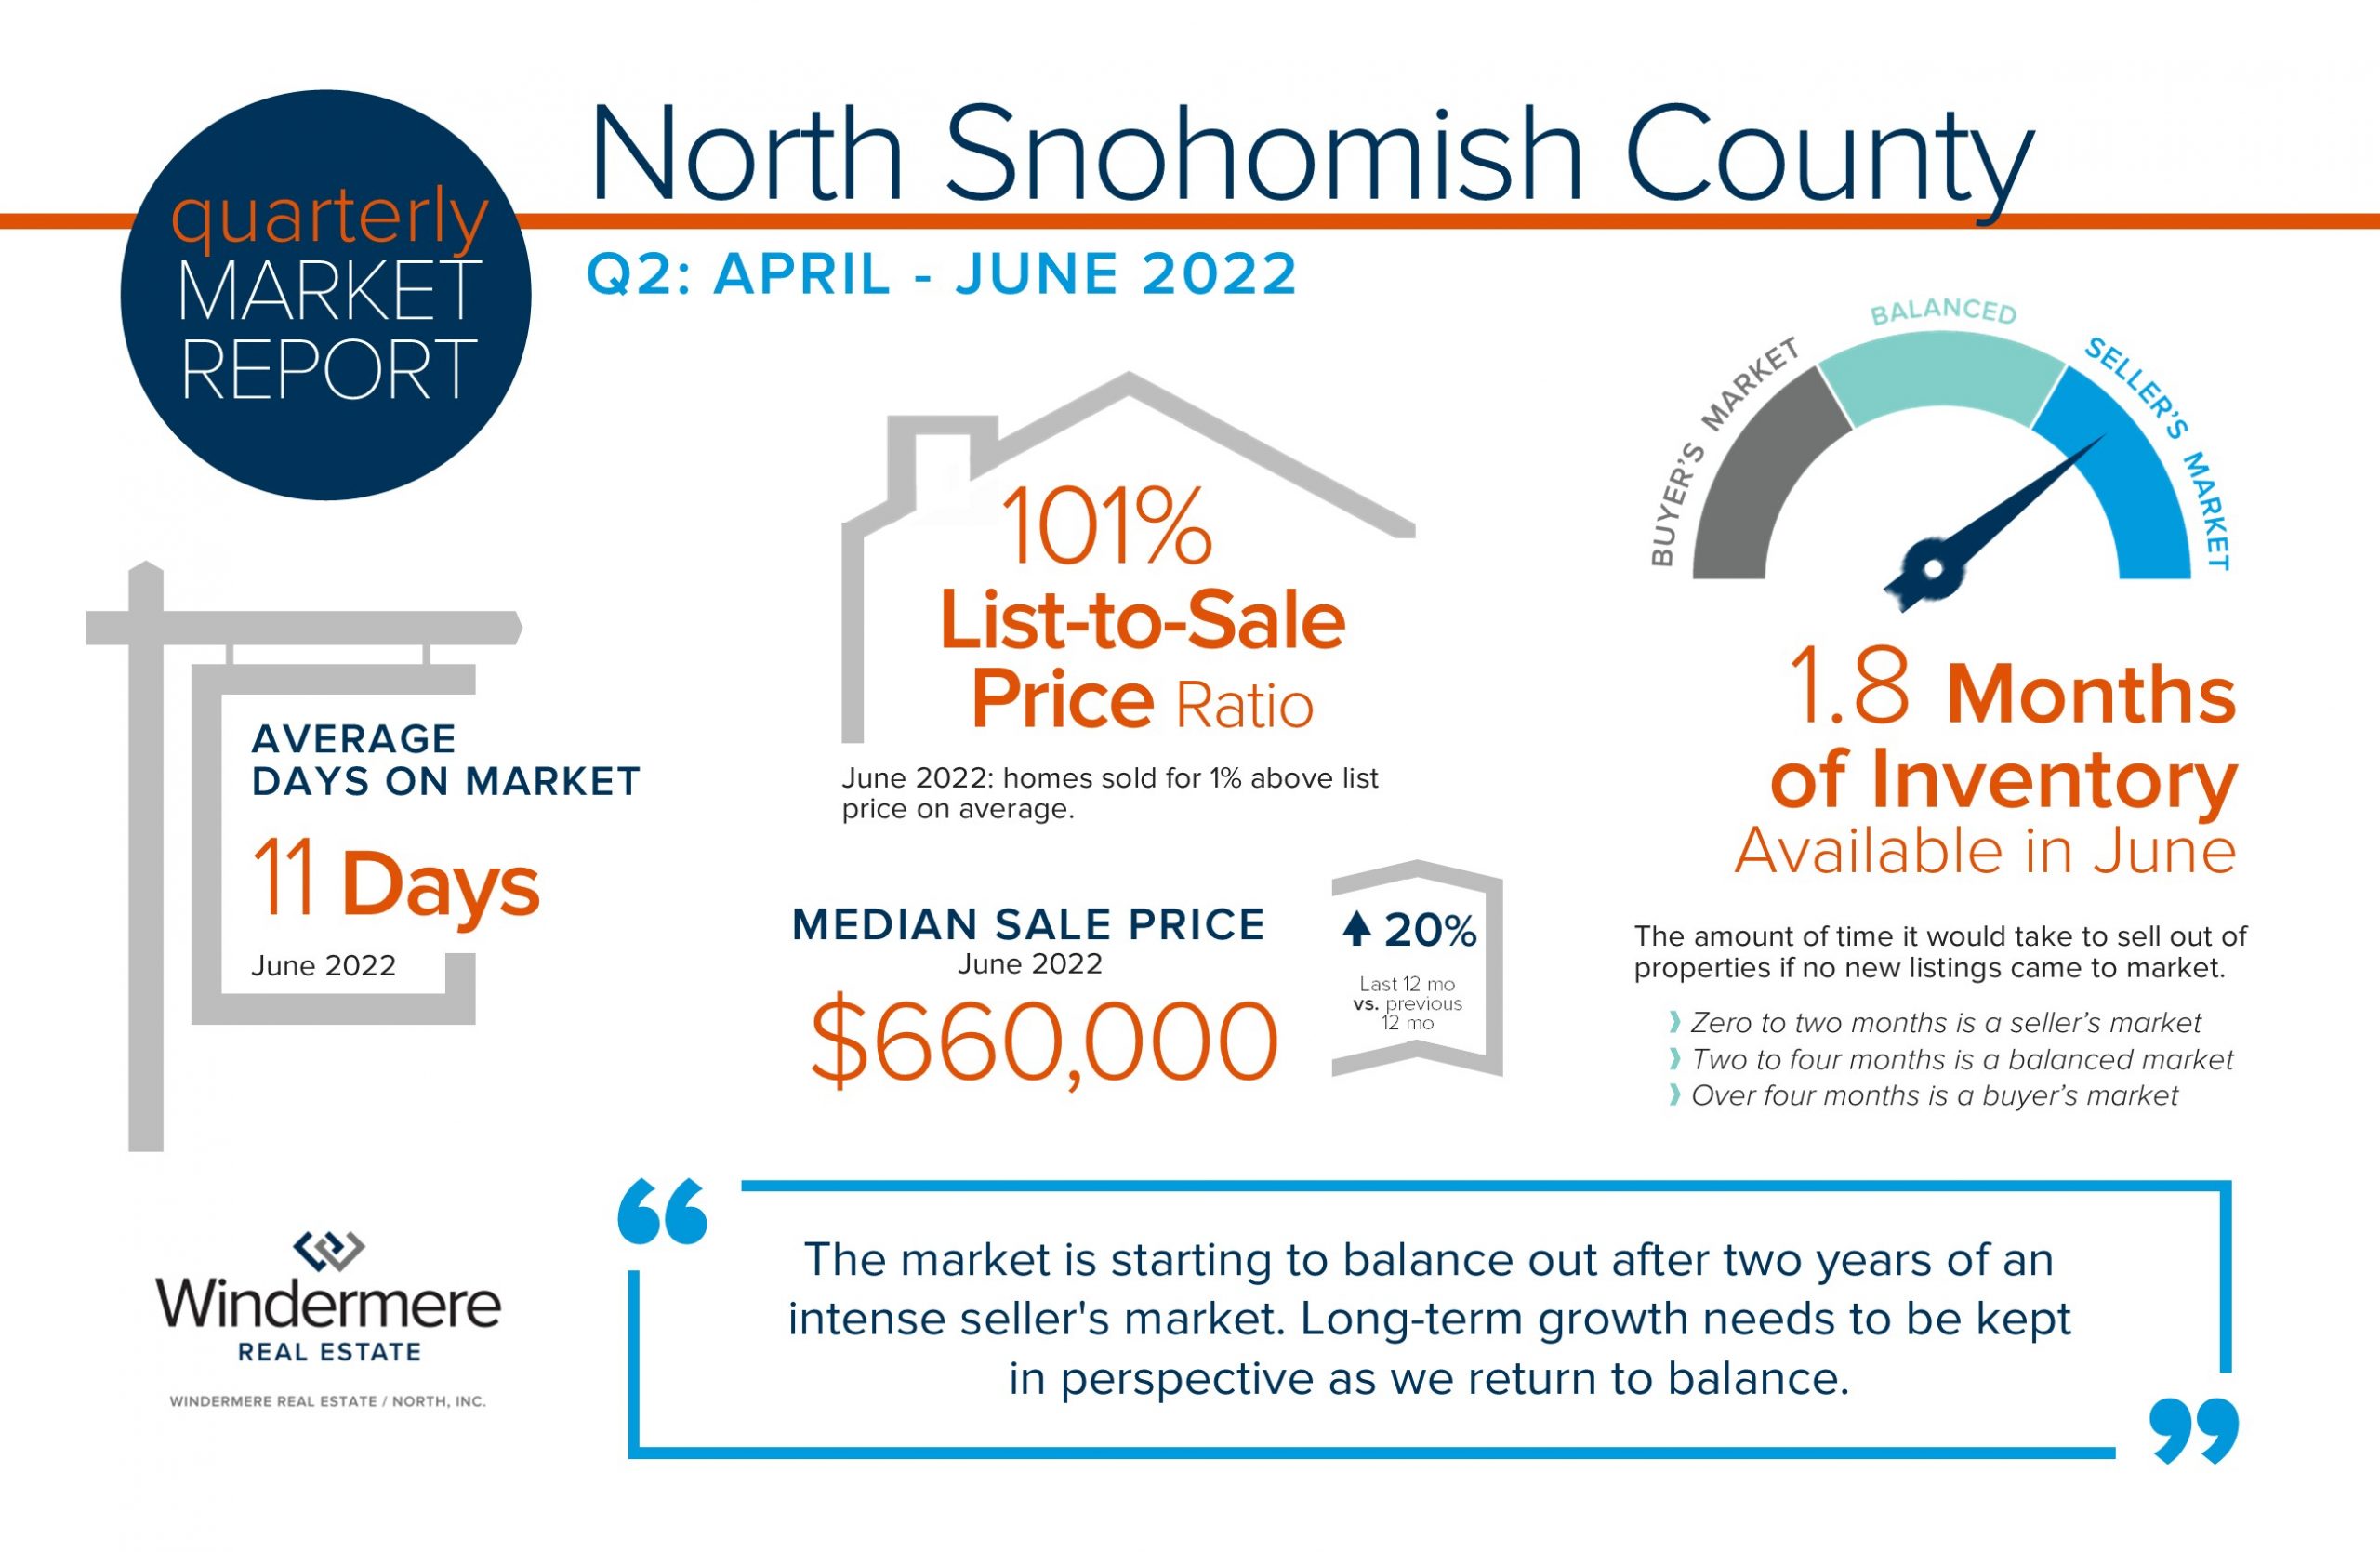
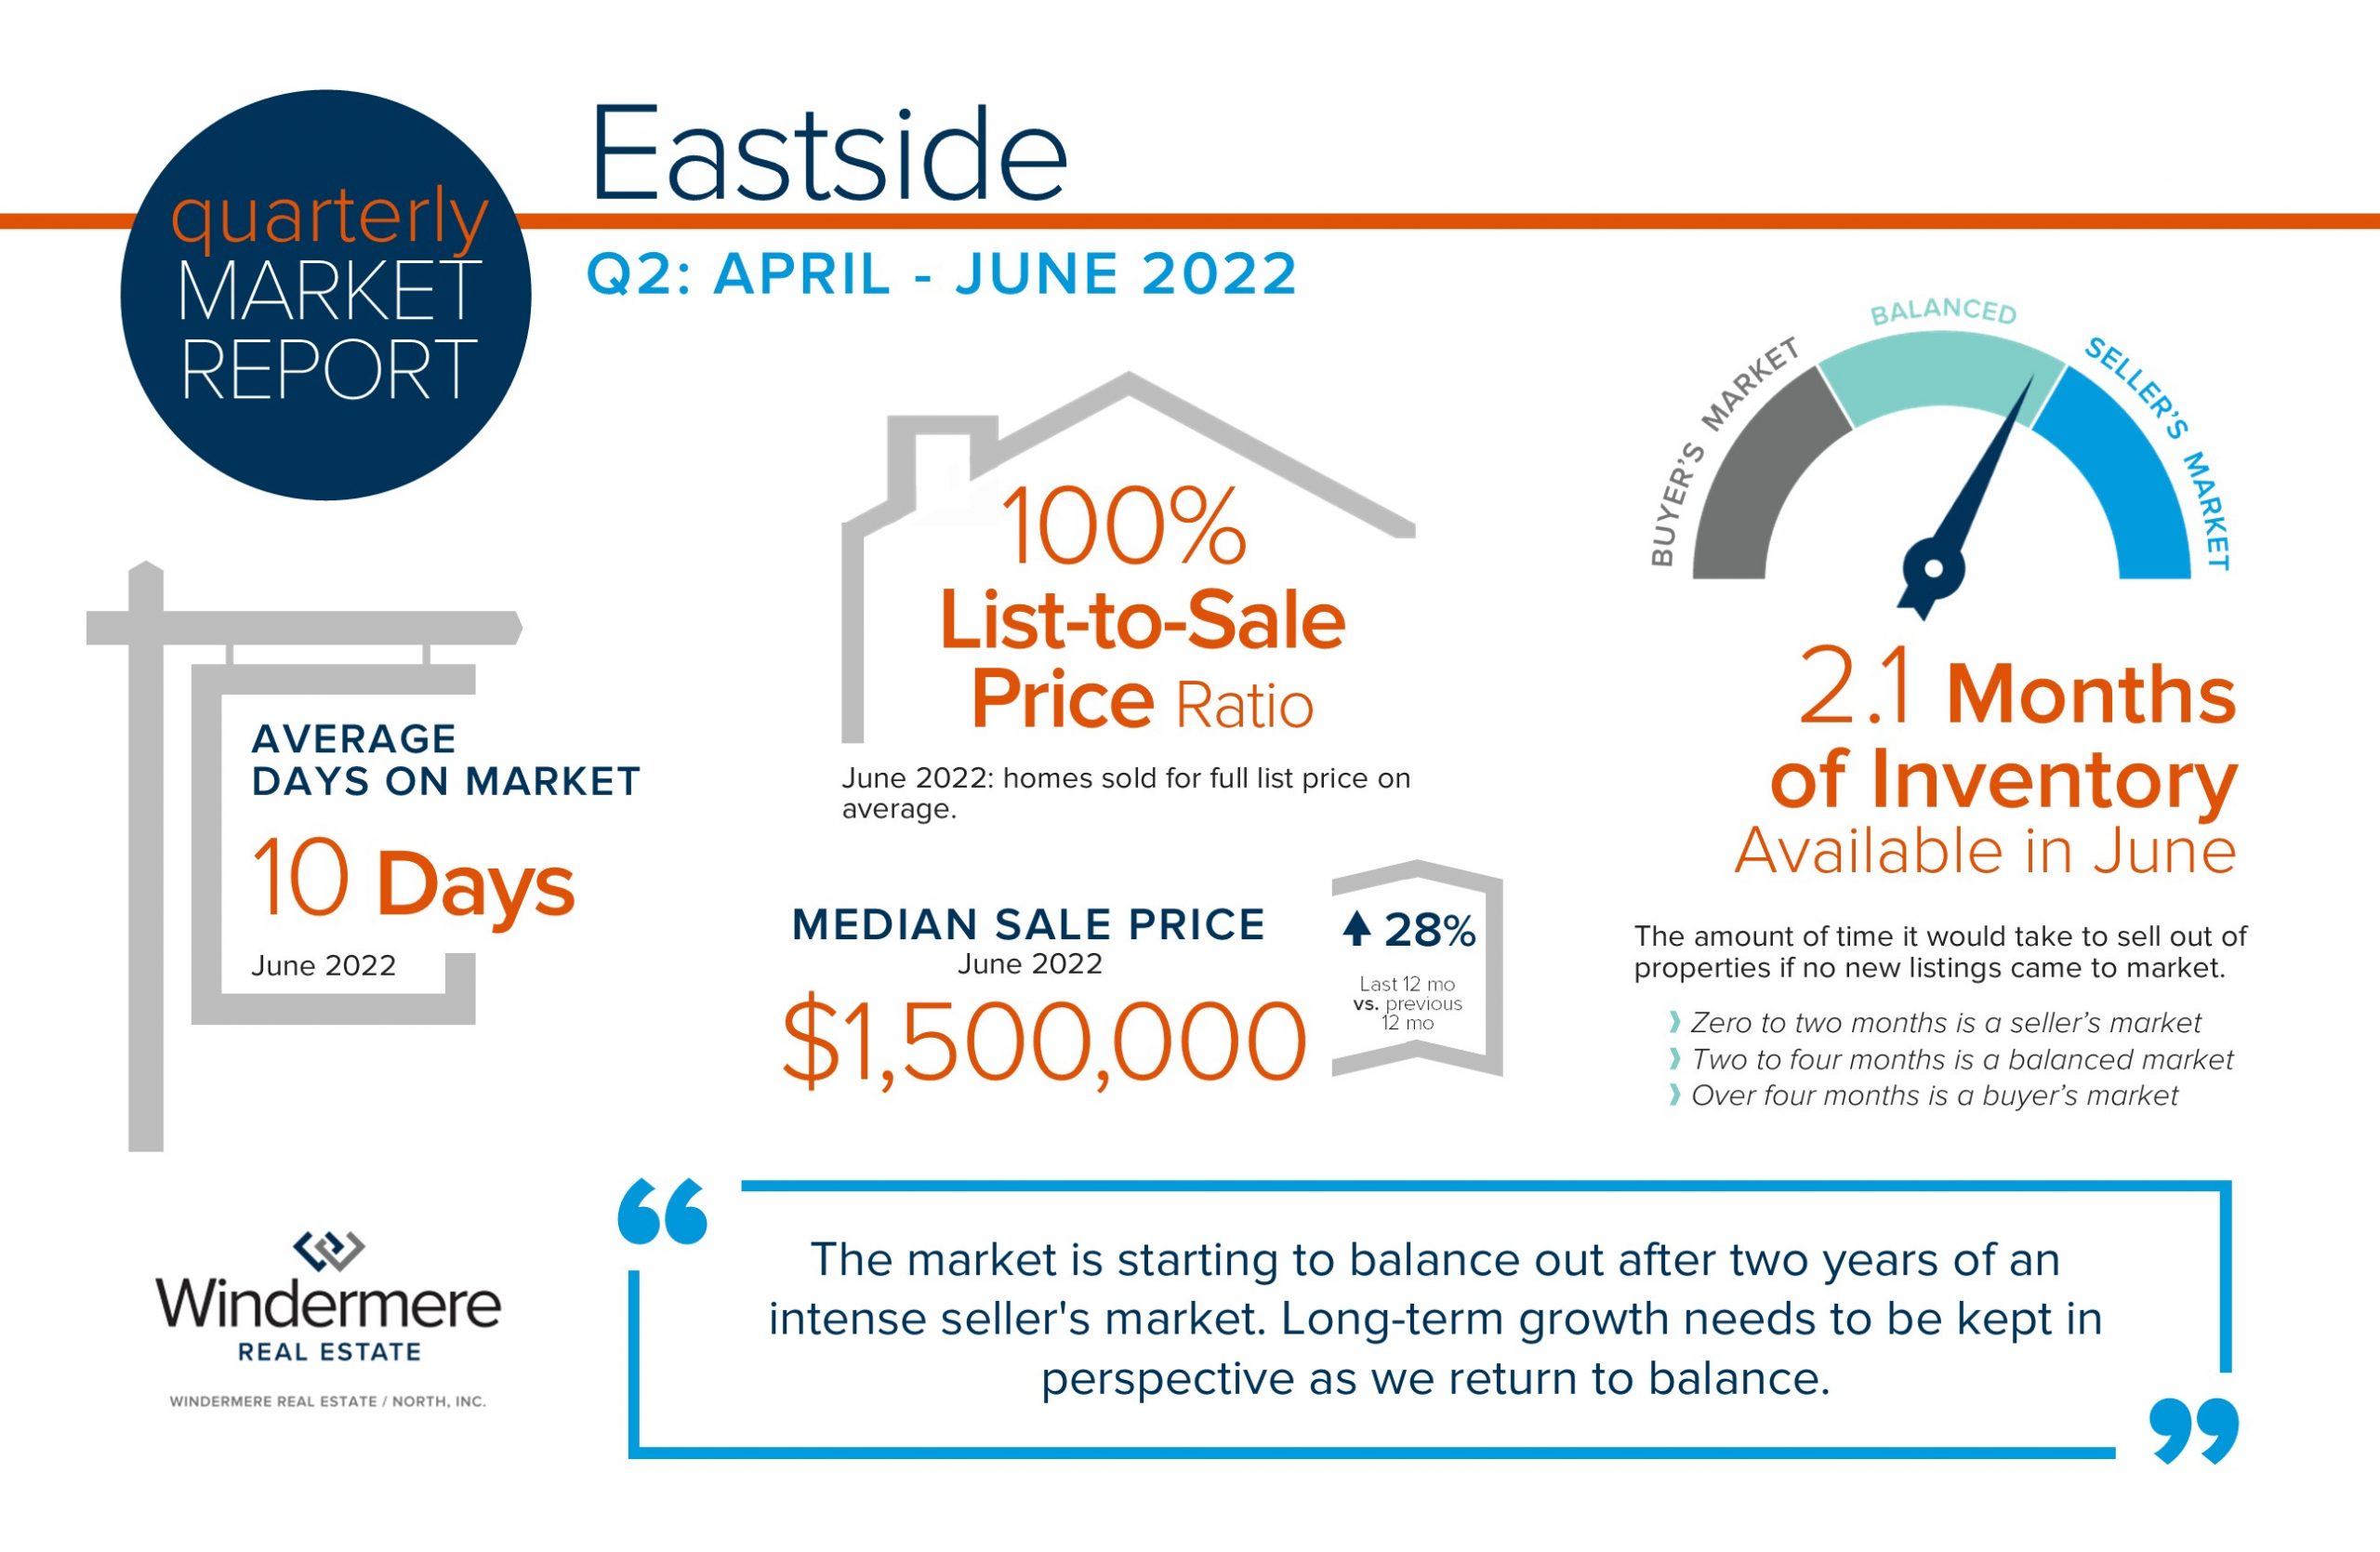
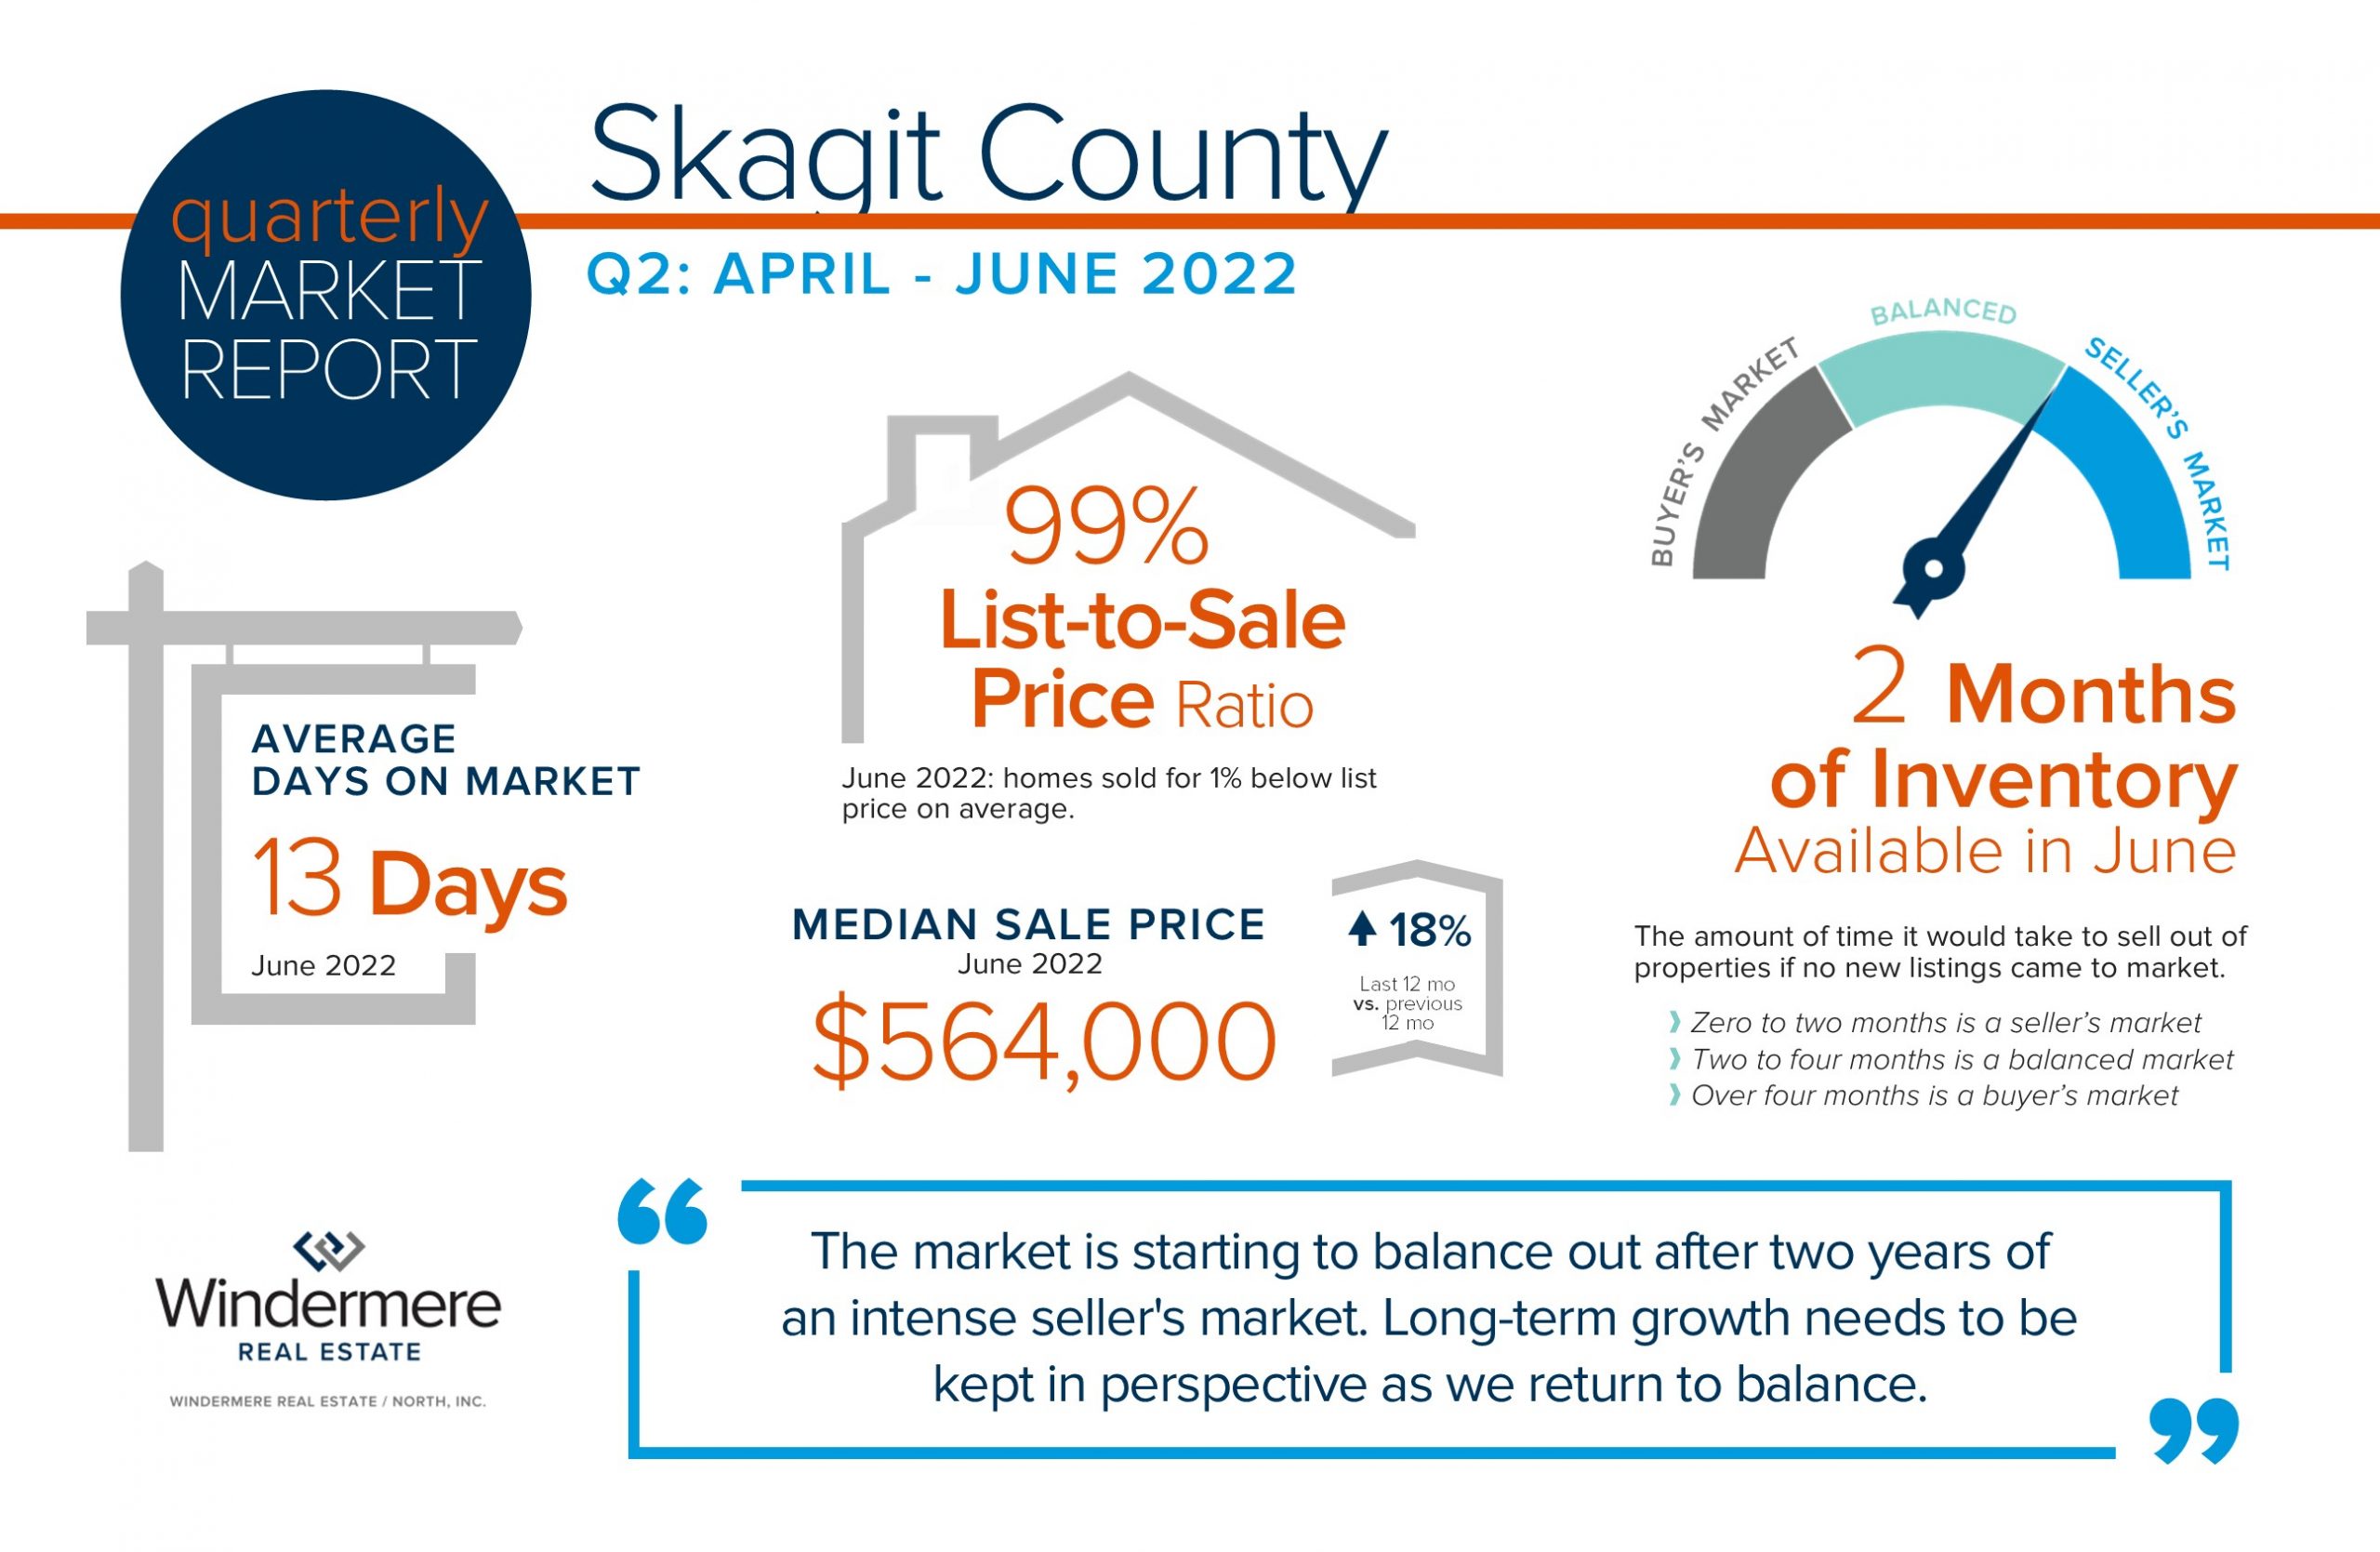
Quarterly Market Reports for Q2 2022
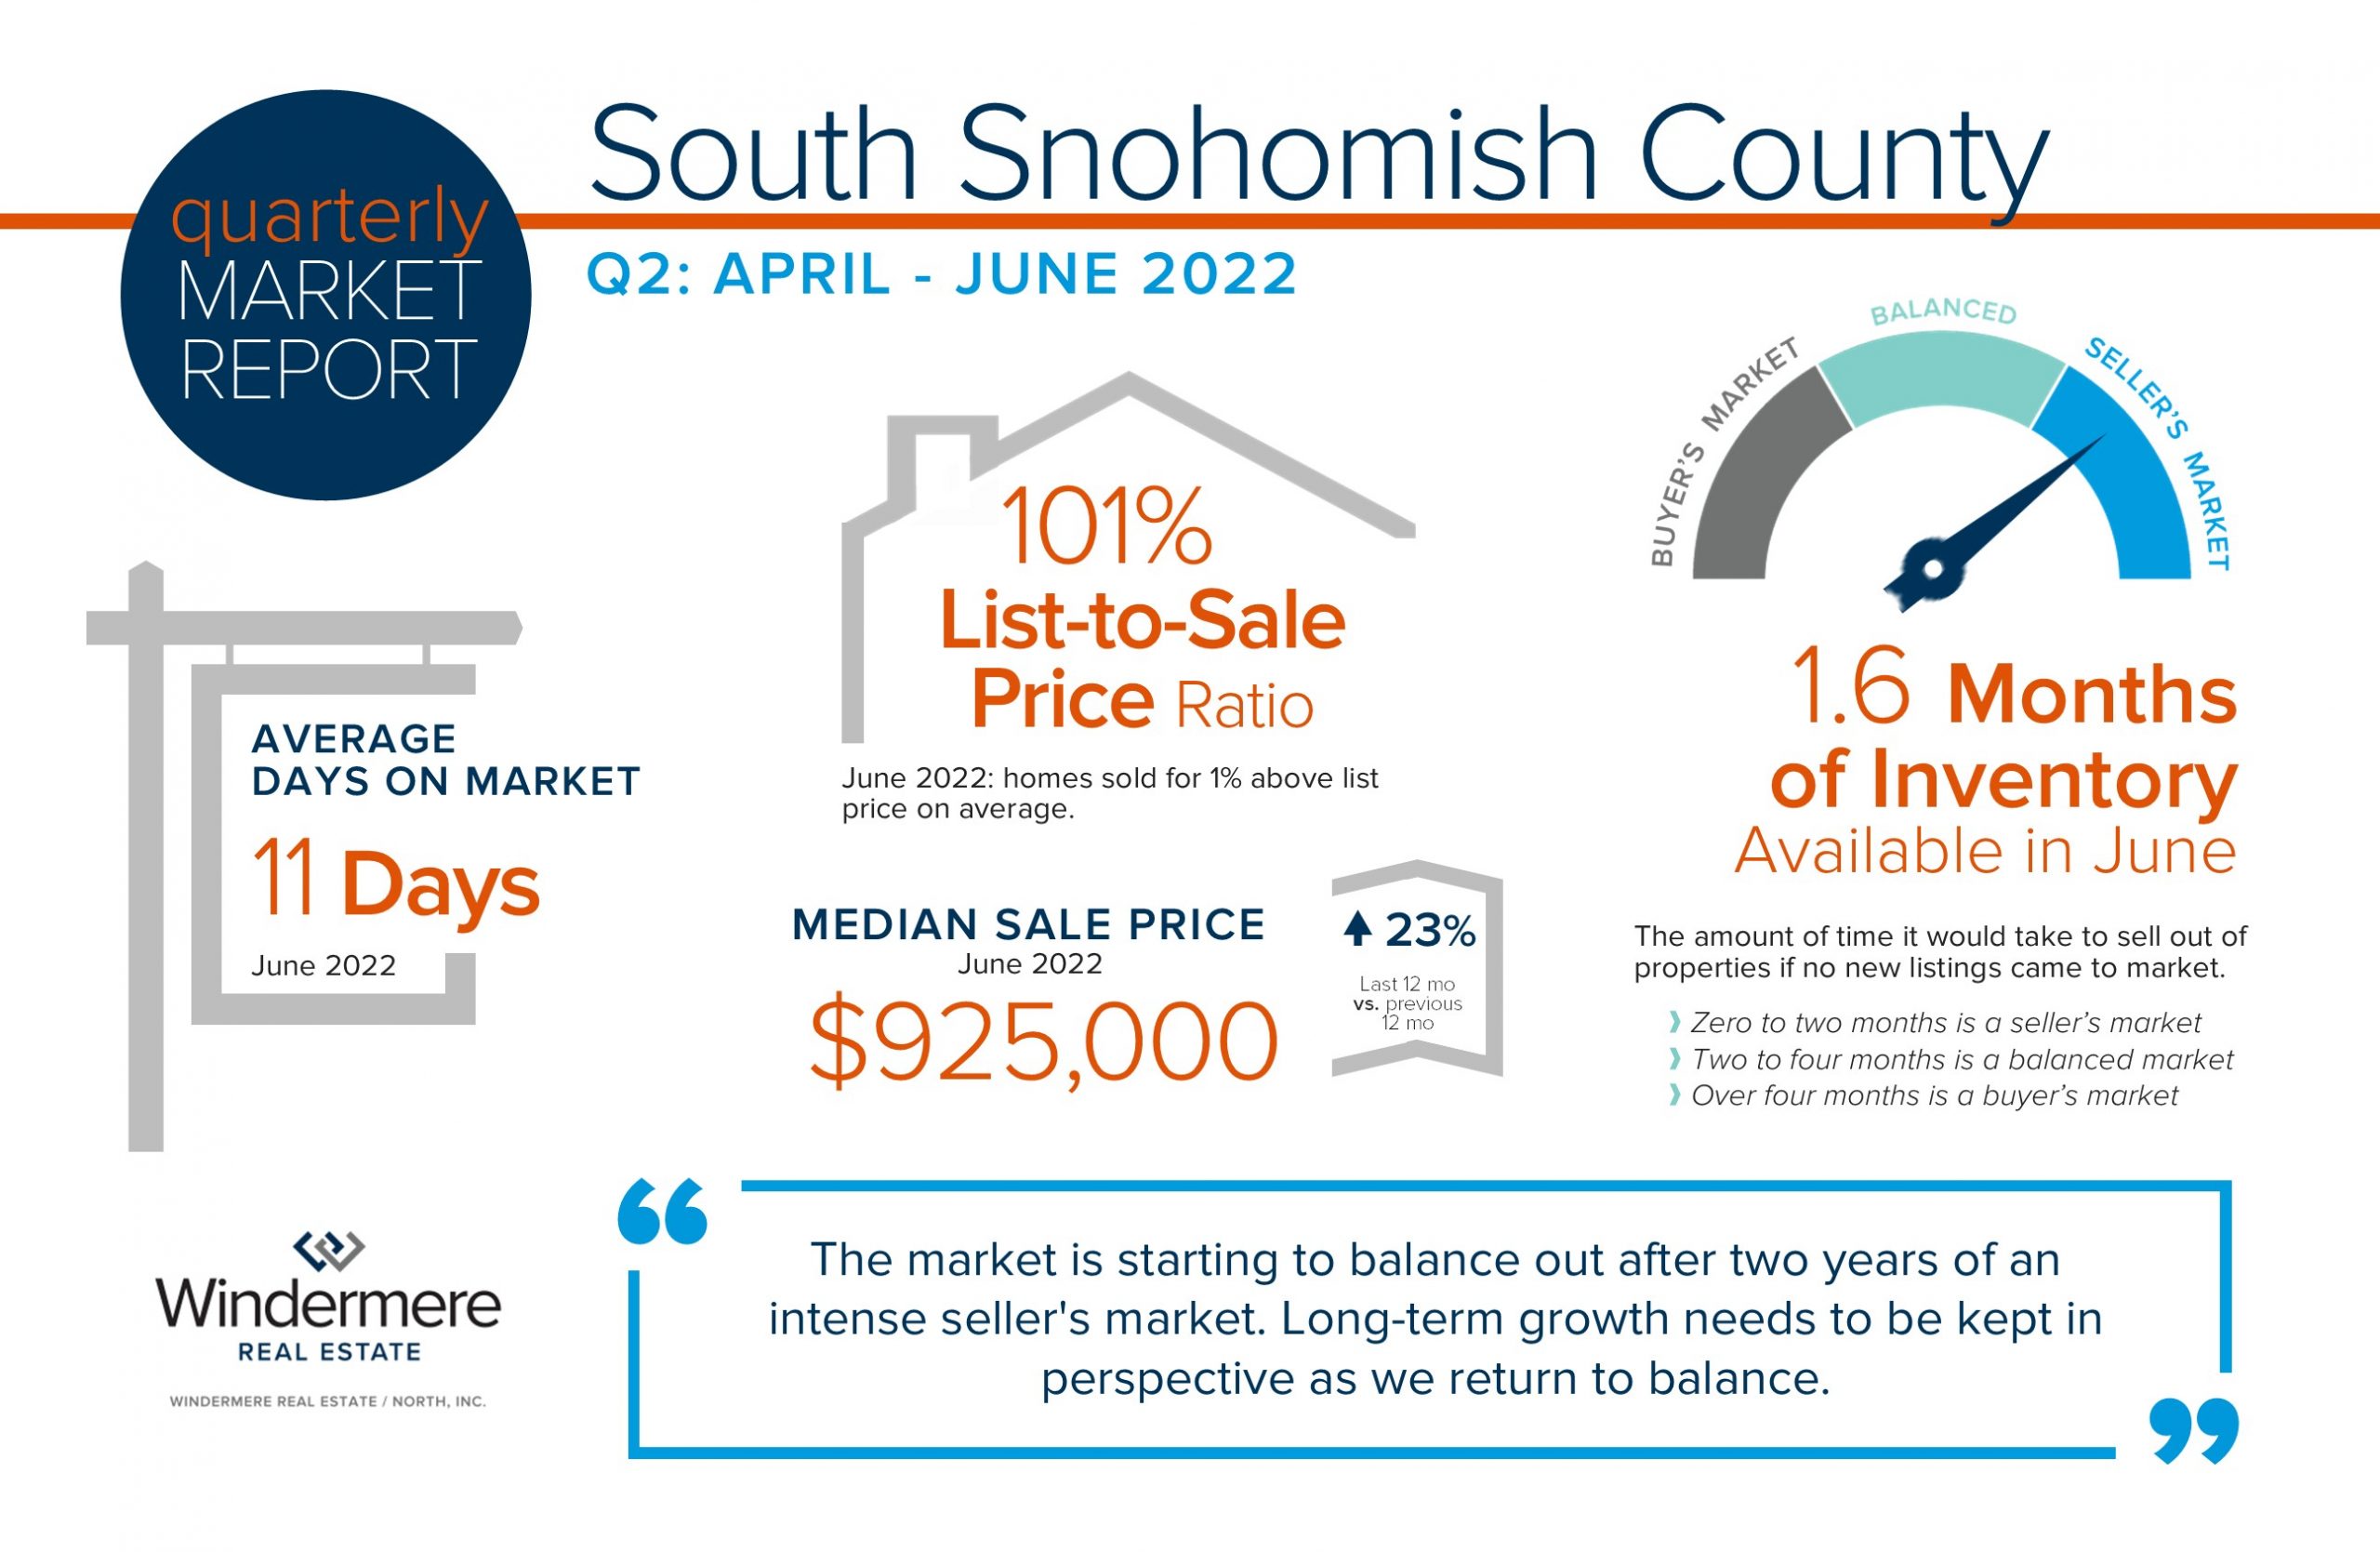
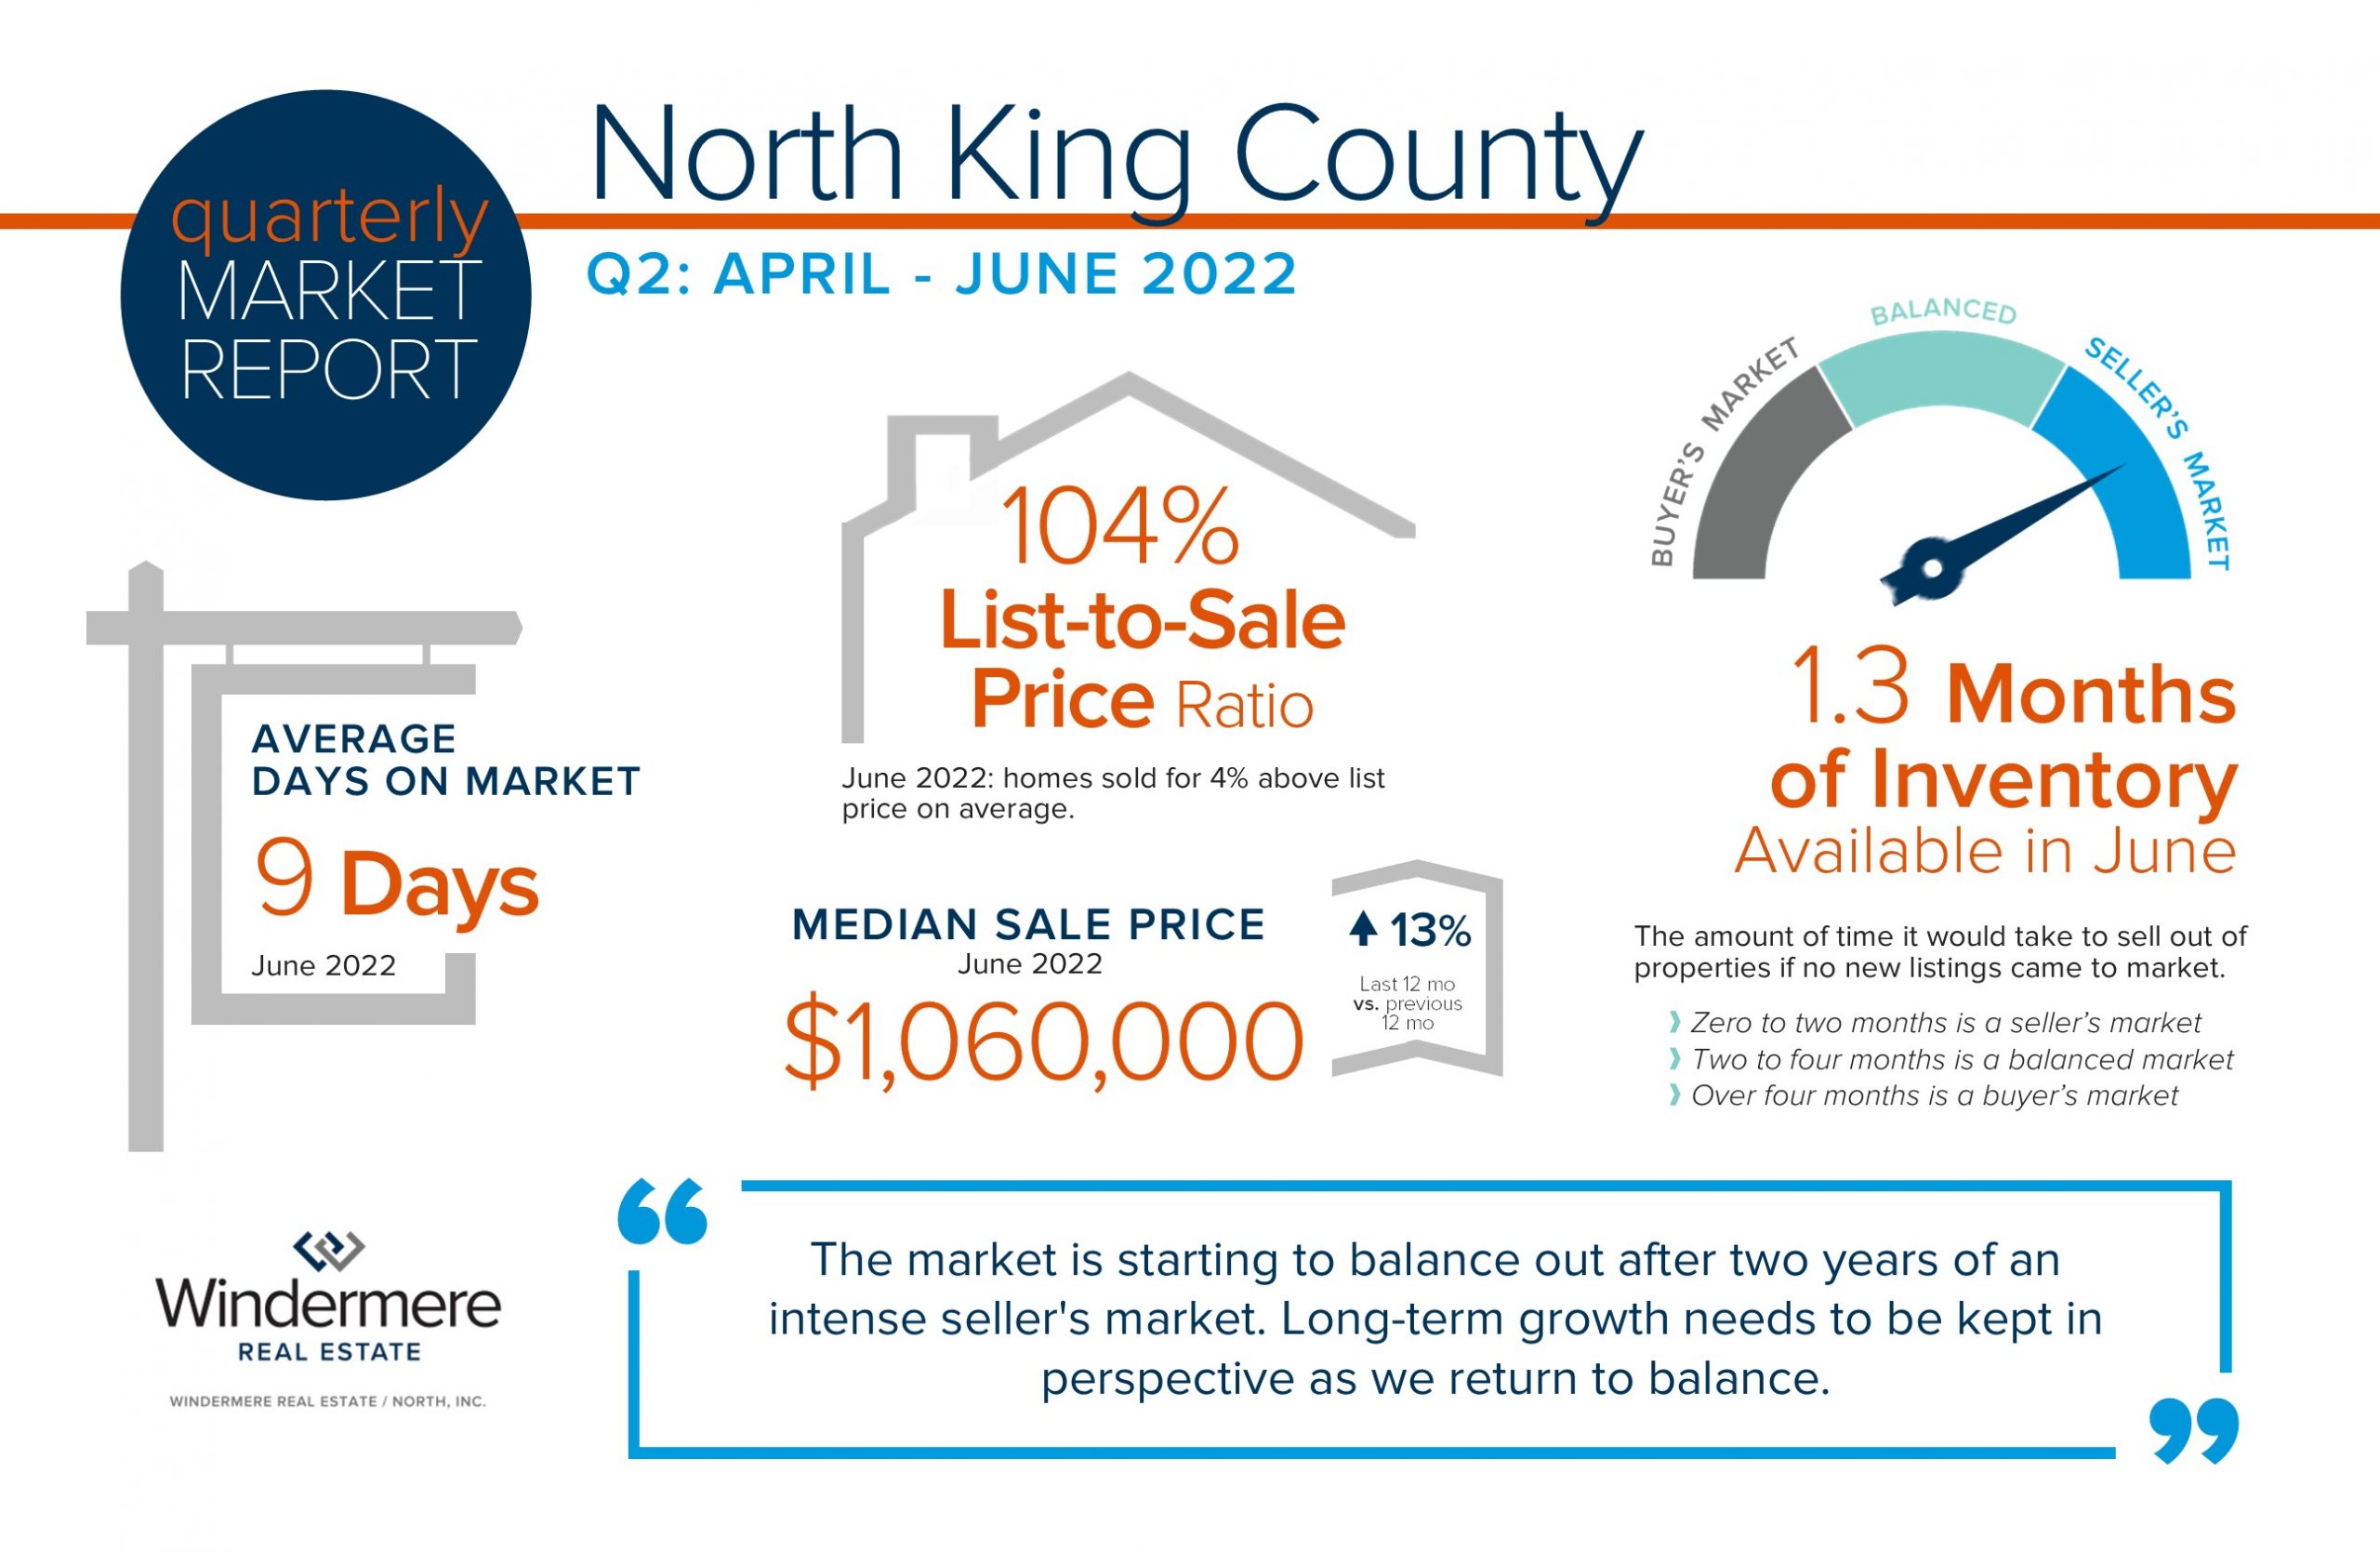
As we head into the second half of 2022, we are experiencing a shift in the real estate market. The market is starting to balance out after two years of an intense seller’s market. Q1 this year had the lowest amount of inventory we have ever seen, which put upward pressure on prices. With the addition of more homes coming to market in Q2 and a 2-point increase in interest rates since the beginning of the year, price appreciation is starting to decelerate. We are coming off the peak prices of Q1 due to these environmental adjustments but are still sitting on top of hefty year-over-year price gains.
Buyers have more selection to choose from, which has reduced the number of multiple offers and tempered price escalations. This has resulted in days on market becoming longer as buyers weigh their options. Sellers are still making huge returns as year-over-year price growth has been above average for the last decade. Long-term growth needs to be kept in perspective as we return to balance. If you are curious about how your real estate goals match up with the market, please reach out. It is my goal to help keep my clients informed and empower strong decisions.