
 Facebook
 X
X
 Pinterest
 Copy Link
4 Things You Need to Know About the Mountlake Terrace Transit Center
![]()
As a local hub of transit and convenience, Mountlake Terrace is a popular choice for those who want to live in a smaller city that’s still close to Seattle and the Eastside. The Mountlake Terrace Transit Center makes this all possible by connecting local, commuter, and regional busses with passengers.
“Mountlake Terrace has a great transit center!” confirms Shelly Katzer. “[Mountlake Terrace also offers] convenient access to the freeway, [and] commuting to work is easy.”
REALTOR® Brian Hayter agrees; “[The] transit center is used by tons of commuters on 6101 236th Street SW, [and] provides easy access to Seattle. Light Rail is eventually going to be coming to Mountlake Terrace,” Brian added.
![]()
If you’re moving to Mountlake Terrace or already live here and need some commuting tips, read on! Here are 5 things we think you need to know about the Mountlake Terrace Transit Center:
The Transit Center has the capacity for over 1,000 cars.
This include a 5-level parking garage with 900 spaces. Plus, there’s bike lockers and racks available as well! This means 1,000 fewer cars on the streets during rush hour. (Thank you, Transit Center!) Helping 40,000 passengers commute each day is an amazing feat, and as our region grows, the Transit Center will become an even more crucial part of our community.
Light Rail is coming to Mountlake Terrace in 2023!
This is a BIG deal for the community. Construction on the new light rail station and route is slated to begin in 2018, and expected to begin servicing the area in 2023. Take a look at this interactive map for a better understanding of the upcoming Link Light Rail expansion!
You can take a bus to Downtown Seattle, Everett, and beyond from the Transit Center.
For those who have to commute for work, the Transit Center is served by several commuter buses and express bus services. You can take a look at schedules and specific routes here.
DART (Dial-A-Ride-Transportation) offers those with disabilities transportation access.
Specially designed for those with health conditions and disabilities this service offers those who wouldn’t ordinarily have access to public transit the opportunity to get out and about in the community. Learn more about how to use this excellent service here.

3 Places That Mountlake Terrace Dog Owners Need to Know About
Whether you’re looking for a city that welcomes you and your furry best friend, or you already live in the Mountlake Terrace area and want to start exploring, you’re in luck! The Mountlake Terrace area has some excellent amenities for dog owners and their canine companions to enjoy, all while getting some exercise and enjoying the outdoors!
If you’re a dog owner in Mountlake Terrace, here are 3 places you need to know about:

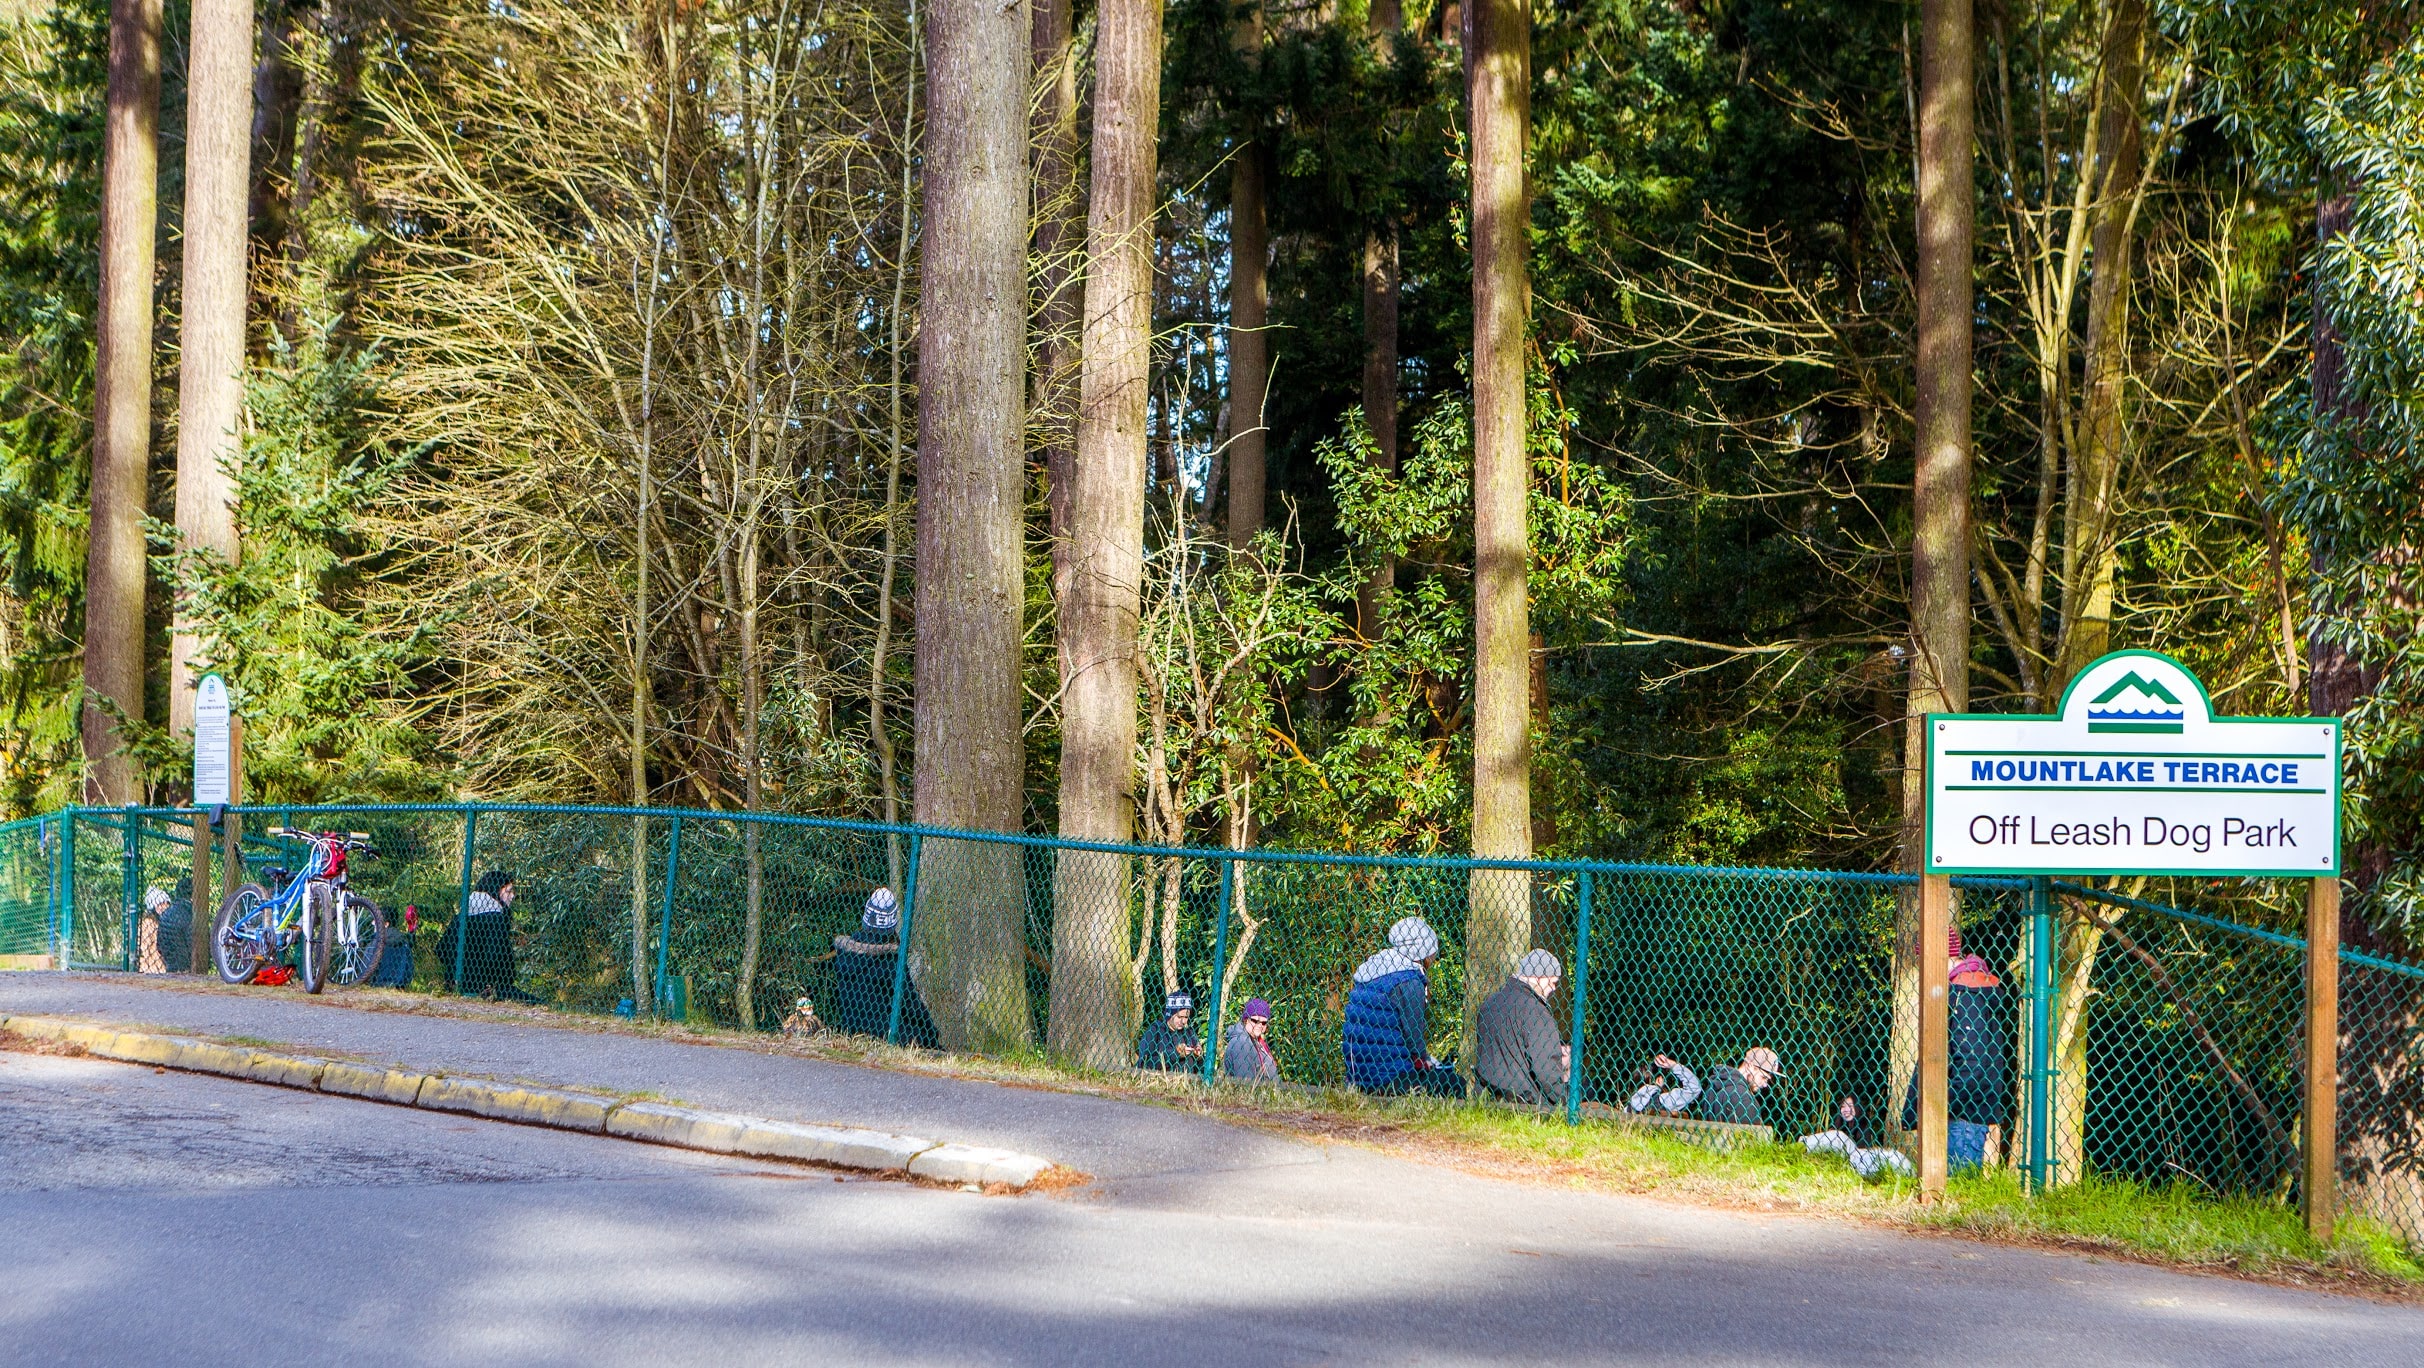
Mountlake Terrace Off-Leash Dog Park
Recommended by REALTOR® Brian Hayter and Shelly Katzer, the Mountlake Terrace Off-Leash Dog Park is located just northeast of the MLT Recreation Pavilion. Offering just under an acre of space in the shaded woods of Terrace Creek Park, this fenced area is a haven for dogs!
“We love to take our dog Dash for walks and let him run off leash in the park!” shares Shelly Katzer. Dogs can run and play within the double-gate system, and owners are welcome to relax on benches (or run and play, too!). Learn more about the park and read rules for visiting the dog park here.
Marina Beach Off-Leash Park
While this park technically isn’t in Mountlake Terrace, it is in the neighboring city of Edmonds (498 Admiral Way Edmonds WA 98020) and well worth the short 10-20 minute drive from MLT. As part of the larger Marina Beach Park on the Edmonds waterfront, this park offers a long list of amenities in addition to the off-leash area. A loop trail, playground, restroom, picnic tables, barbecue area, and much more set the scene.
As for the dog park portion, furry friends can frolic in the sand, splash in the surf, and stretch their legs as they meet other dogs in the cool ocean breeze. Click here to learn more about this Edmonds off-leash area.

Photo courtesy of the Pet Adventure Facebook page
Pet Adventure Shop
Located in the Cedar Plaza Shopping Center (22803 44th Ave. West Suite E-5 Mountlake Terrace, WA 98043), Pet Adventure Shop is a must-visit destination for local pet owners! Established in 2010 and owned and operated by locals, Pet Adventure Shop stocks its shelves with a huge range of food and supplies. Even the pickiest of pets are bound to find something delicious here—check out a list of the brands of cat and dog foods Pet Adventure Shop carries here.
In addition to supplies for cats and dogs, they also carry an eclectic variety of products for other animals including hamsters, birds, bunnies, fish, chickens, and horses.
Our 5 Favorite Things About the Mountlake Terrace Recreation Pavilion
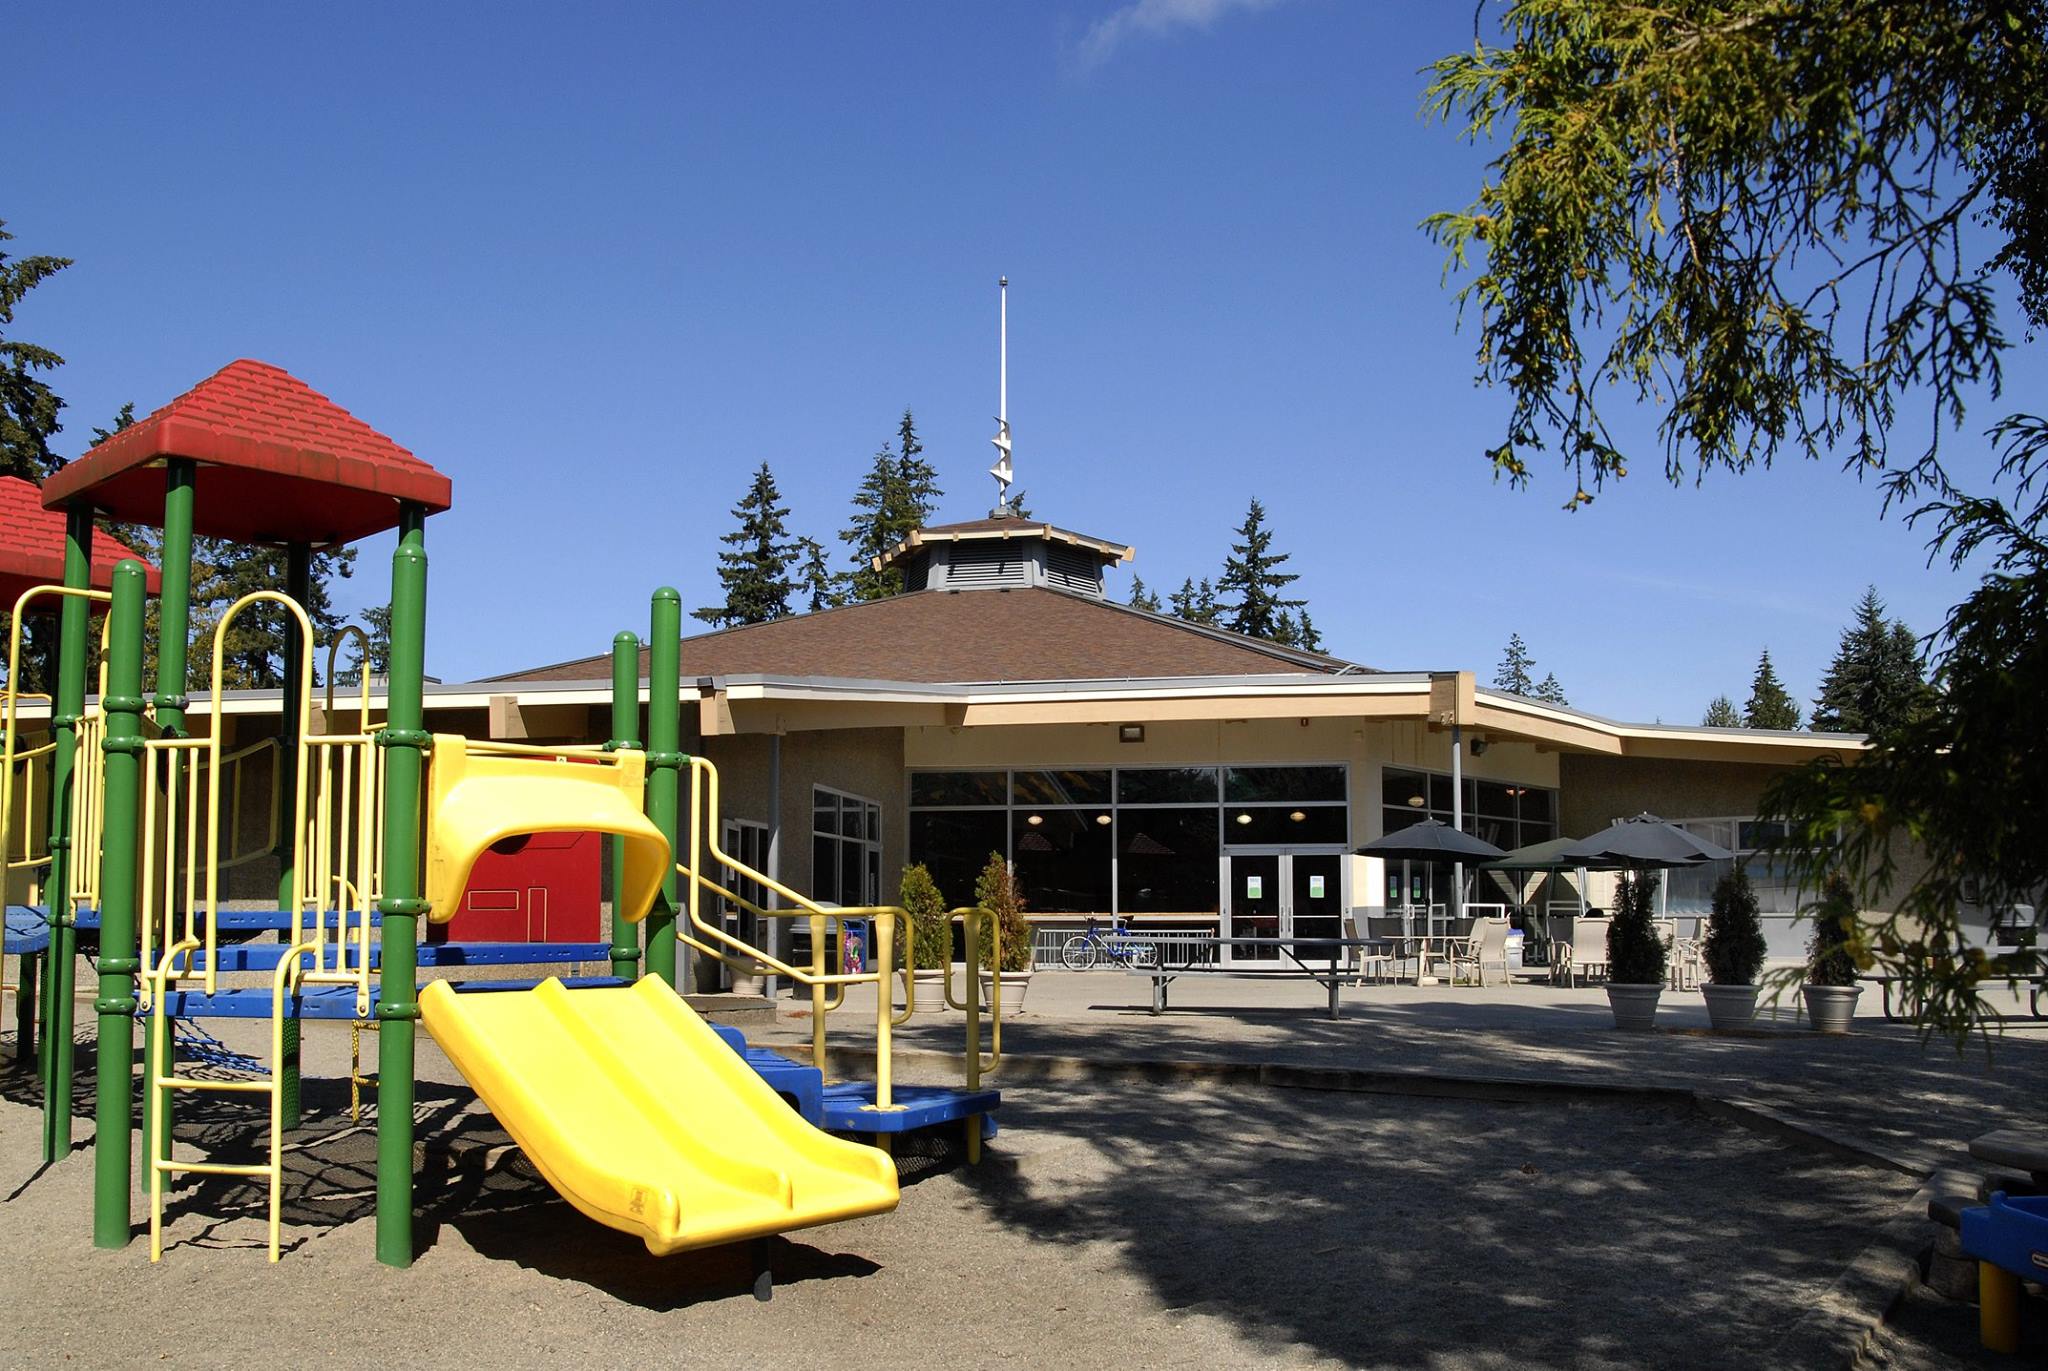
Nestled between Terrace Park School and the Mountlake Terrace Off-Leash Dog Park, the Mountlake Terrace Recreation Pavilion (5303 228th Street SW, Mountlake Terrace, WA 98043) is an incredible multi-purpose facility packed with amenities to take advantage of! When we asked REALTOR® Brian Hayter what people in MLT like to do for fun, the Recreation Pavilion was at the top of the list, and it also came highly recommended by Shelly Katzer as well!
“The MLT Pavilion offers great programs for all ages, including a great swimming program,” shares Shelly. “My kids enjoyed the pre-school programs, before and after school Kids Krew and summer camps.”
This dynamic community center offers so many amenities to the MLT community, and we wanted to share a few of our favorite things about the community center that are not to be missed!

Photo courtesy of the Mountlake Terrace Recreation & Parks Facebook page
The multi-purpose swimming pool.
This warm-water pool not only is home to swimming lessons and a range of classes, but it also includes a lazy river with a current, spray toys, a beach-like entry leisure pool, a therapy pool, handicapped access, a sauna, and more. Plus, you can even rent out the pool for parties!
Kids programs, like preschool, before & after school care, and summer camps!
Keeping kids busy is easy with this community center in your city’s backyard! There are 3 preschool options for kids ages 3 to 5, each program providing a unique set of offerings. Kids Krew offers before and after school care for kids ages 5 to 12, and a huge variety of summer camps include themes like swimming, dance, basketball, tennis, and general youth camps.
The huge variety of fitness classes and sports leagues.
Whether you’re into something super upbeat (like Turbo kick or Zumba) or something a little more low-key (like yoga and Tai Chi), the recreation pavilion has a large selection to choose from. If playing on a team is more your style, adults can participate in basketball, racquetball, softball, volleyball, and racquetball sports. Sign up with a friend and meet your neighbors!
The MLT Recreation Pavilion is open 7 days a week.
Whether you want a workout before work or the kids need to burn off some energy on a rainy Sunday, the pavilion is open and waiting to be used! Hours include Monday – Thursday 6am – 9:30pm, Friday 6am – 7:15pm, Saturday 7am – 8pm, and Sunday 8:30am – 7pm.
Mountlake Terrace residents get a discount.
Whether you’re using the pool, buying a pass, or taking a class, all MLT residents receive a discount on using this facility. You can view all 2017 fees here.
Check out the complete Recreation Program Guide here!
You Don’t Need Tulips for a Strong Home Sale
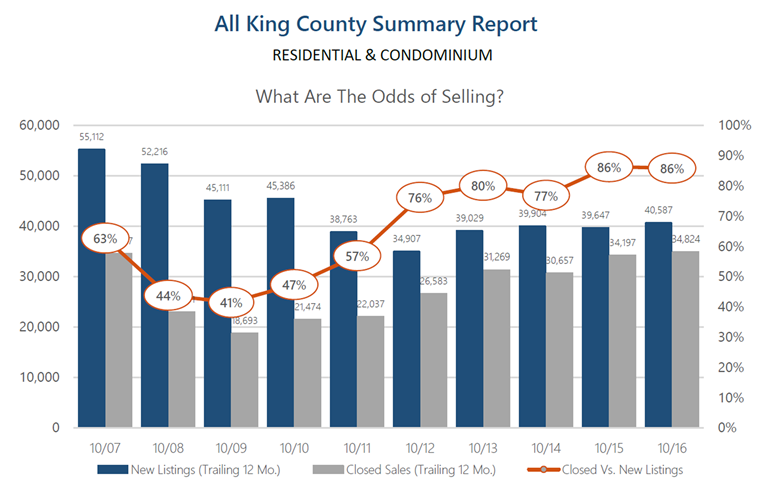
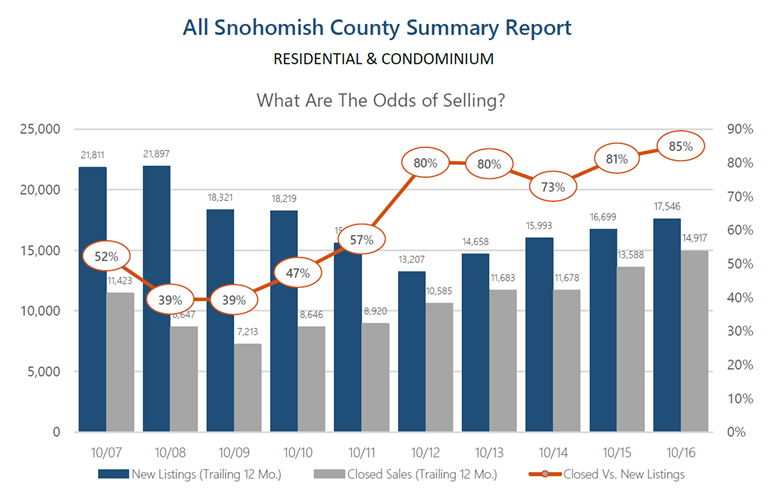 These graphs (click to view larger) above provide a 10-year history of the odds of selling in the month of October for both King and Snohomish Counties. As you can see, the odds of selling are at a 10-year high, hitting 86% in King and 85% in Snohomish. These are quite favorable odds for sellers and indicate what one might expect moving toward 2017.
Buyer demand remains very strong! In fact, pending sales reached peak levels in May of this year and continued with steady momentum throughout the summer and fall. Every month this year recorded a higher pending level than the same month the previous year. This illustrates strong buyer demand and is coupled with lower inventory levels than the year before. This combination has created very low months of available inventory, and we anticipate this continuing as we complete 2016 and head into 2017. For a potential seller, this means the market is in your favor, and waiting until the tulips bloom in April might have you lined up against more competition. Historically, we see inventory peak April through June, however pending sales have closely matched supply all throughout the year. With that said, one might consider bringing their home to market in the first quarter of the year versus the second, because they will have less competition, but still enjoy an engaged buyer audience.
Most recently we have seen interest rates bump up a bit, and this has created more urgency in the market. While still historically low, buyers are smart enough to know that cheap money is a huge long-term savings. Paying attention to all of these market factors will empower one to make the best real estate decisions. Please reach out if you are considering a move over the next year, and I’d be happy to apply this research and weigh in on your options.
Affordability: Commute Times & Interest Rates
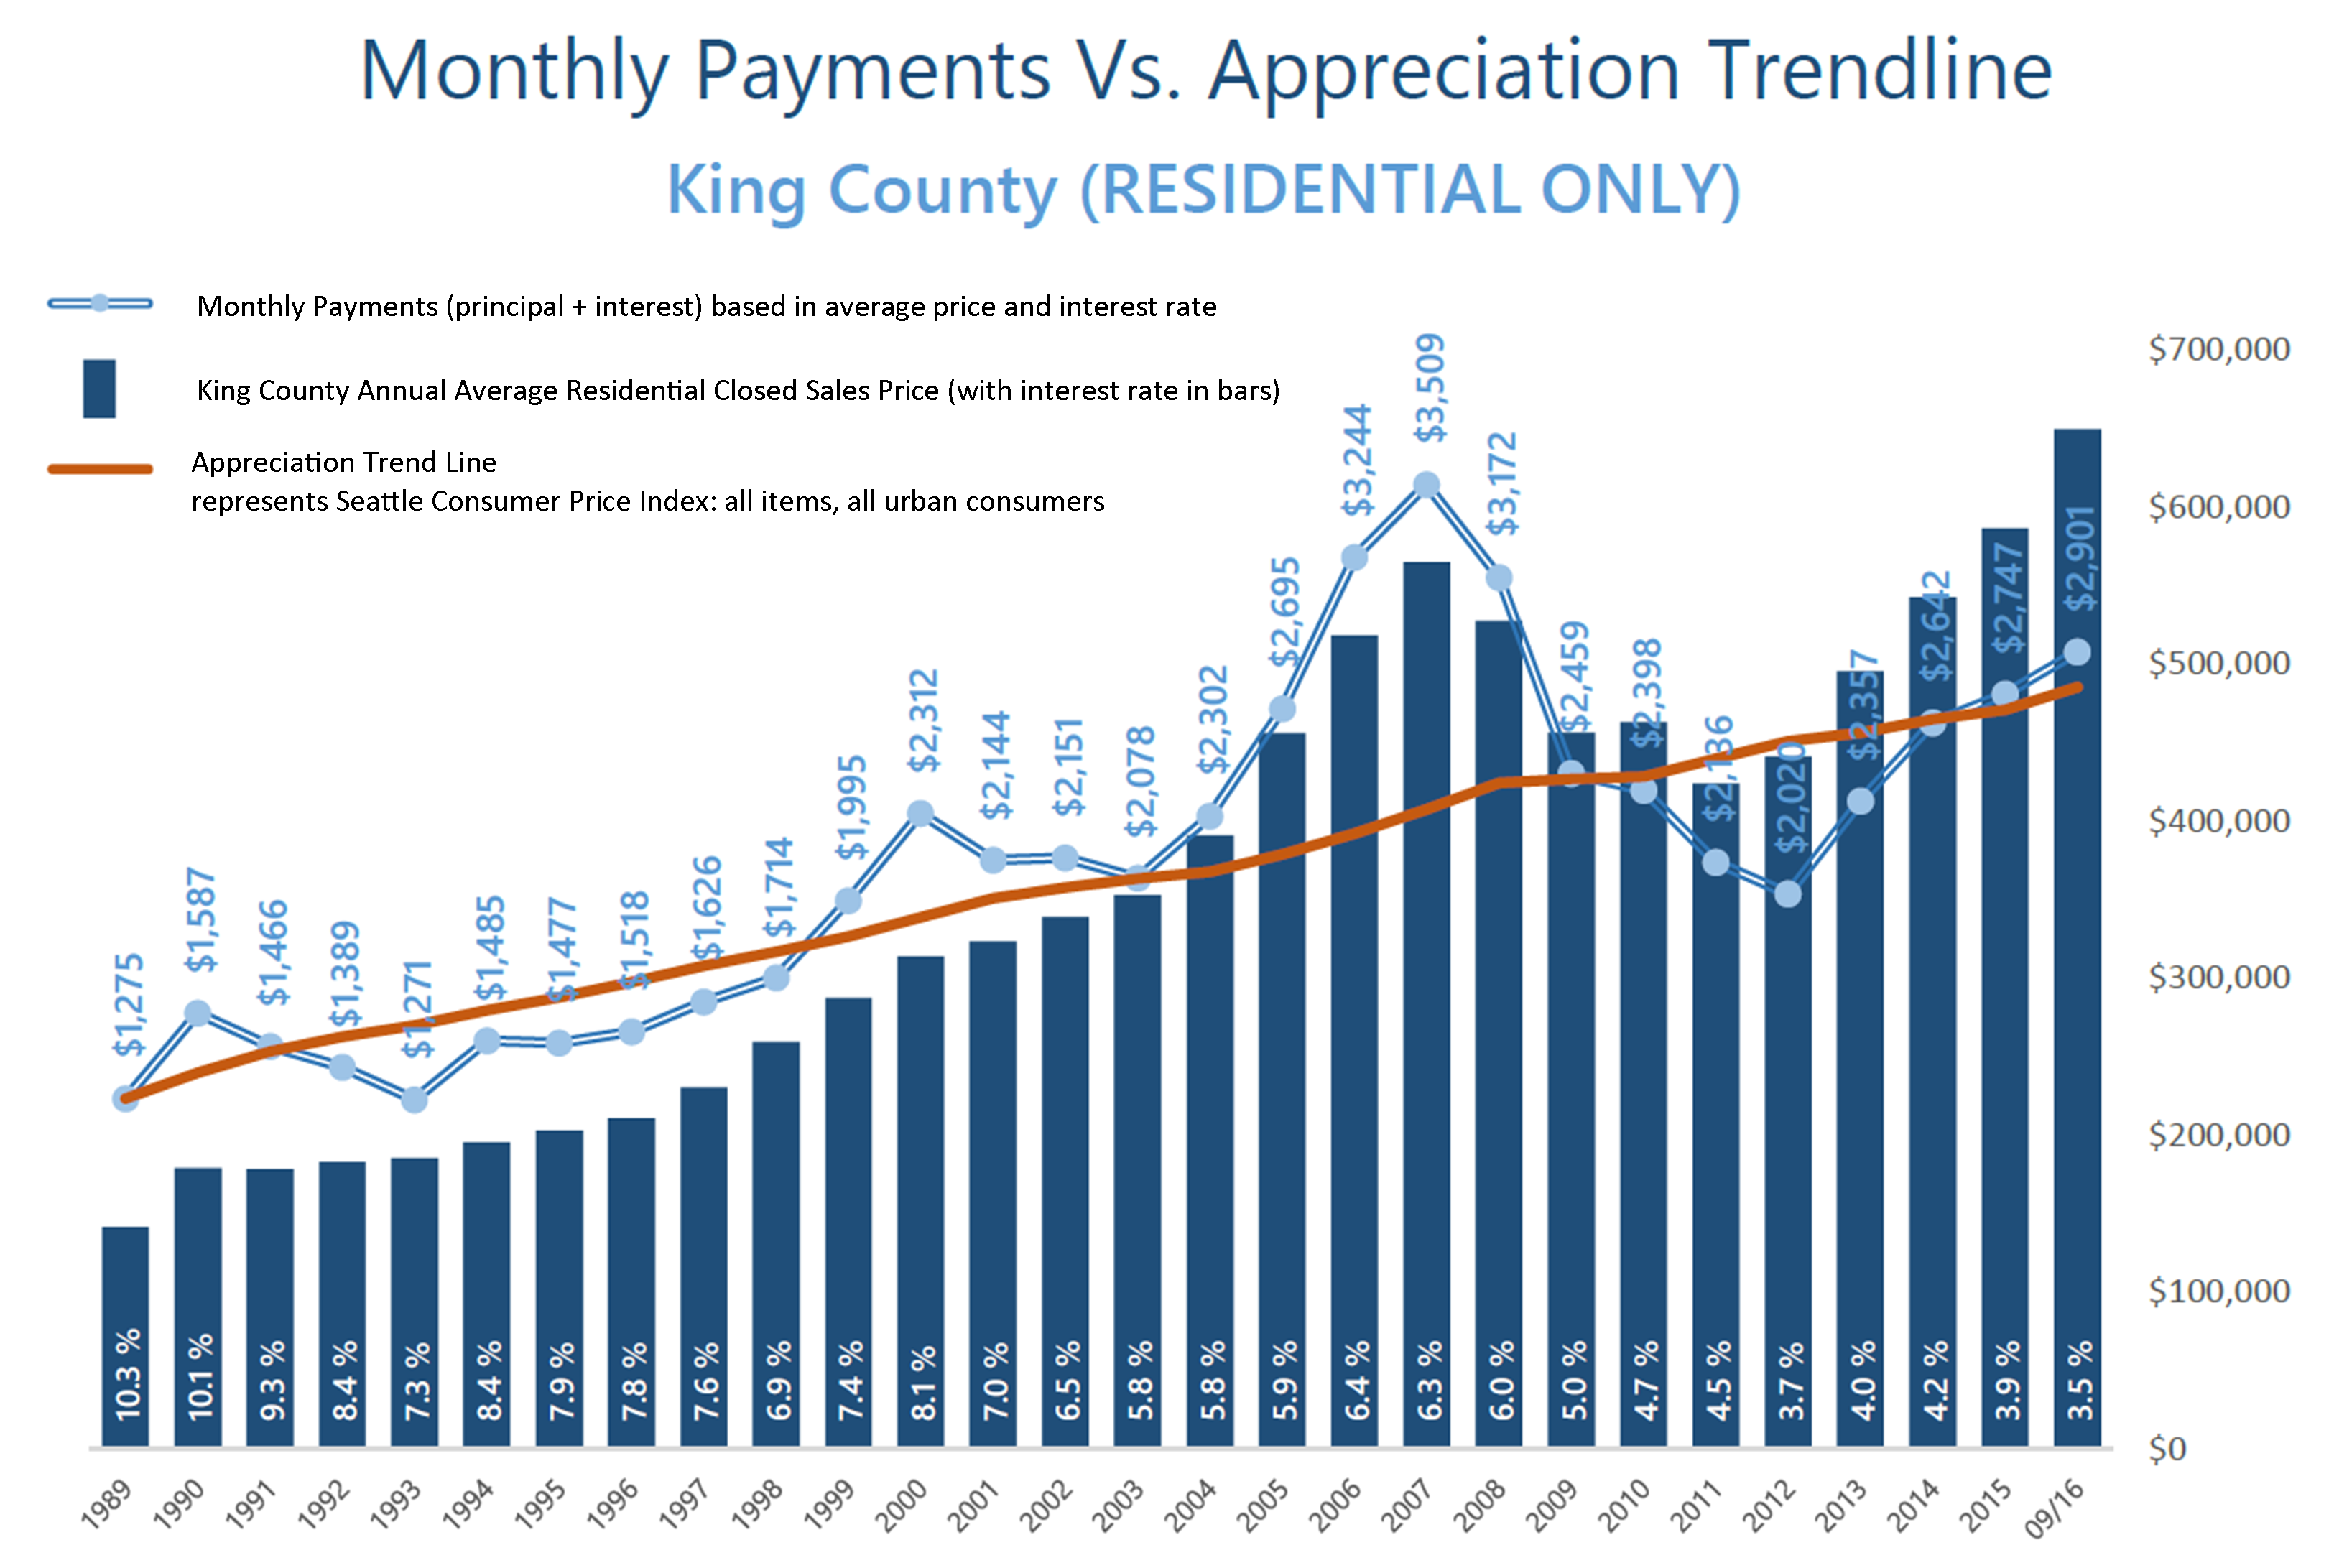
 These graphs illustrate the brass tacks of affordability between King and Snohomish Counties, measured by the average monthly payment. Most recently in September, the average monthly payment was 35% higher in King County compared to Snohomish County. What is fascinating, though, is comparing today’s average monthly payment to peak monthly payments back in 2007! In King County, monthly payments are currently 21% less than during the peak, and in Snohomish County, 36% less. That is a lot of saved monthly overhead. Note that this has everything to do with today’s historical interest rates, as average prices are higher now than in 2007. When one buys or refinances a house, they are not only securing the property, but securing the rate for the life of the loan.
Close proximity to the work place and affordability is often near the top of a buyer’s list of preferred features. 2016 has continued to be a year when commute times to major job centers widened the price divide between key market areas in the greater Seattle area. Over the last 12 months, the average sales price for a single-family residential home in the Seattle Metro area was $696,000! In south Snohomish County (Everett to the King County line), the average sales price for a single-family residential home was $471,000 – 48% less than Seattle Metro. Further, if you jump across Lake Washington to the Eastside, the average sales price for a single-family residential home was $881,000 – 27% more than Seattle Metro!
The “drive to qualify” mentality has been proven by the pending sales rate in south Snohomish County over the last 12 months. Pending sales are up 7% complete year-over-year, whereas in Seattle Metro pending sales are down 1%, and down 2% on the Eastside. We believe this is a result of affordability, more inventory choices in south Snohomish County, new construction options, lower taxes, strong school district choices, and manageable commute times. Newer transit centers and telecommuting have also opened up doors to King County’s little brother to the north as well. If you are curious about possible commute times, you can search for properties on our website based on commutes times, which is a feature provided by INRIX Drive Time. Also, we track the market in several ways, so if the graphs here are interesting to you, any of our agents would be happy to provide additional information relative to your specific neighborhood. Please contact us anytime, as it is our goal to help keep you informed and empower you to make strong real estate decisions.
Market Update – Q3
Inventory levels providing more choices for buyers; is the market starting to stabilize?
As we head into the fall and winter months after an incredibly eventful spring and summer, available inventory levels are starting to ease. It is still a seller’s market (3 months of inventory or less) in most areas, but one that is providing buyers increased options. The increase in available inventory is due to pent-up seller demand starting to come to market. The return of strong equity levels have brought sellers to market that have been waiting to jump in for some time. Continued buyer demand due to our flourishing job market and historically low interest rates have steadily absorbed new inventory, but we are finally starting to see a trend toward some more balance. This is good news! Additionally, lending requirements remain stringent and down payments are bigger, unlike the dreaded bubble market we experienced in 2007/2008. Educated pricing and sound condition is what will drive a buyer’s interest in a home. As the market stabilizes, it will be important for consumers to partner with a broker who closely follows the market to help them make informed decisions and develop winning strategies.
Read below for market details from Snohomish County down through south King County.
Snohomish County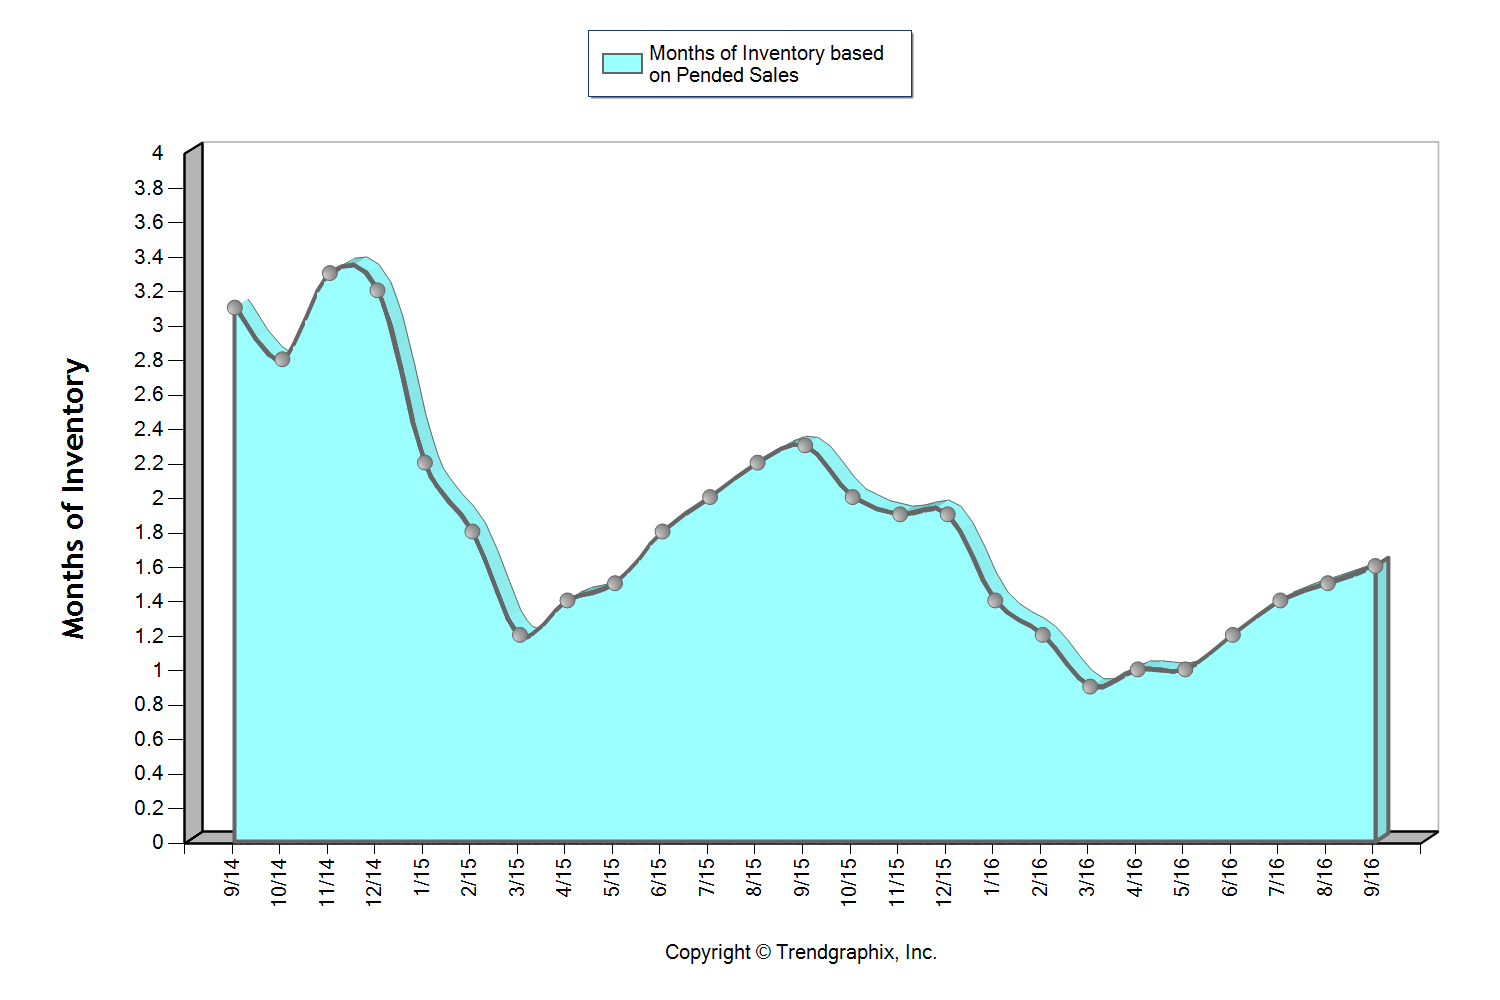
This graph shows that we currently sit at 1.6 months of inventory based on pending sales, which is the highest level we have seen in all of 2016! It is still a seller’s market (3 months or less), but one that is providing buyers increased options. The average cumulative days on market reached 28 days in September, which was up 8% over August. Median price peaked in August at $401,000 and settled at $397,000 in September after hovering between $380,000 and $400,000 since April. For the first time since February, the average list to sale price ratio was 99% after sitting at 100-101% over the last six months.
The return of strong equity levels have brought sellers to market that have been waiting to jump in for some time. In fact, average prices have grown just over 20% over the last two years, freeing up sellers to make the moves they have been waiting for. Continued buyer demand due to our flourishing job market and historically low interest rates have steadily absorbed new inventory, but we are finally starting to see a trend toward some more balance. This is good news! We are still seeing multiple offers and quick market times, but not quite the frenzy that we experienced earlier this year.
All of these factors indicate that we may finally be headed towards a more stabilized market with positive attributes for both buyers and sellers.
South Snohomish County 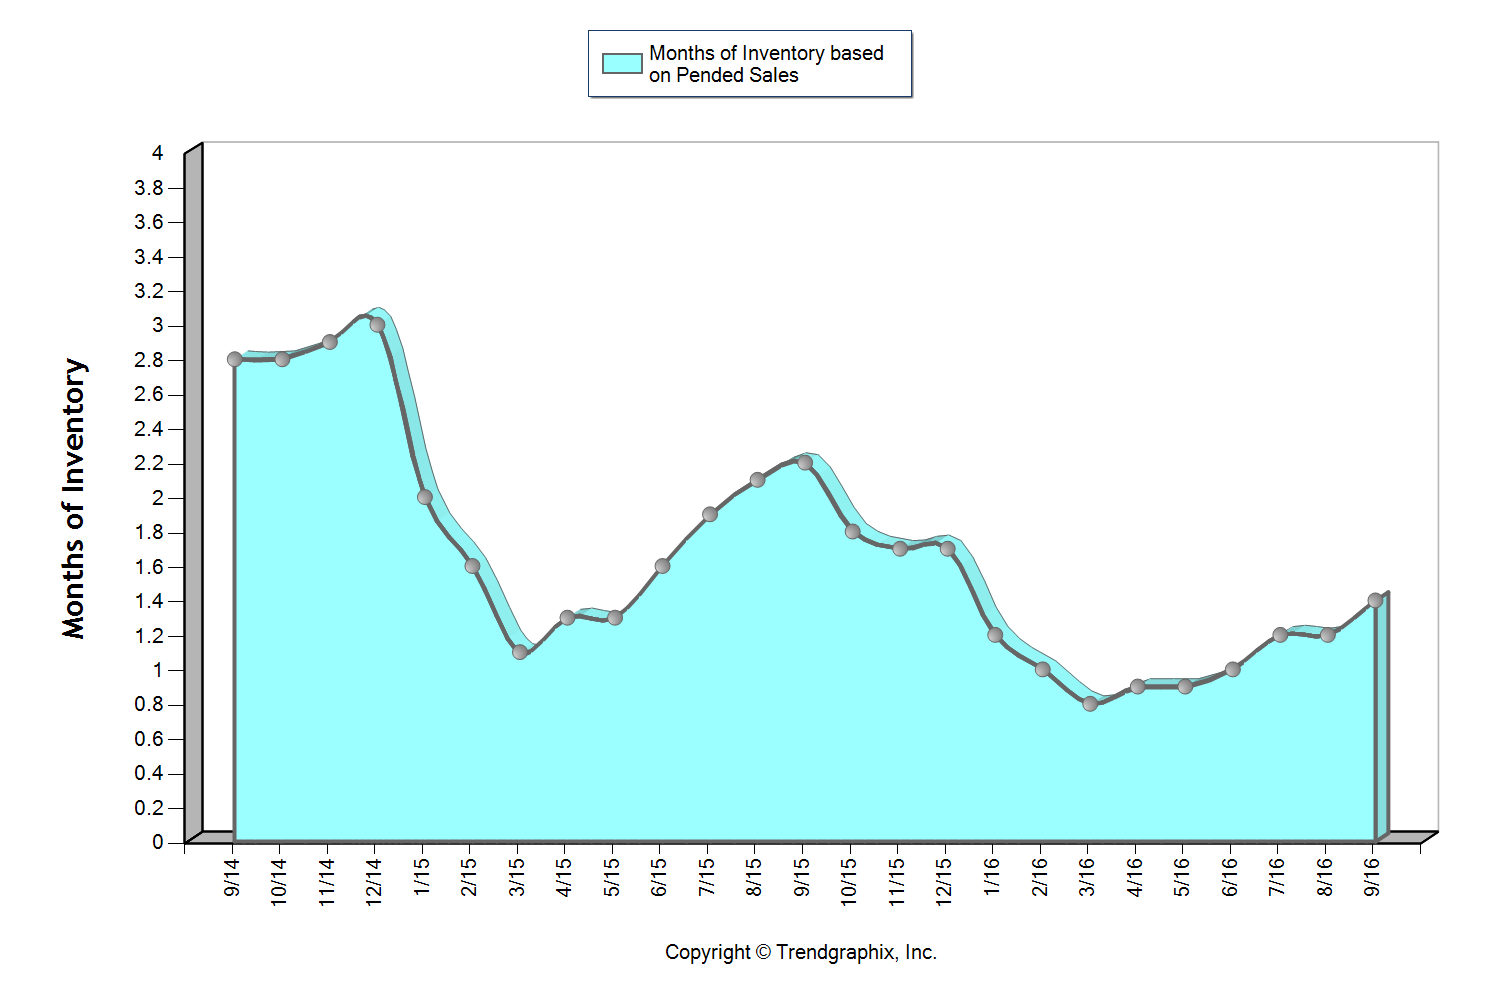
This graph shows that we currently sit at 1.4 months of inventory based on pending sales, which is the highest level we have seen in all of 2016! It is still a seller’s market (three months or less), but one that is providing buyers increased options. The average cumulative days on market reached 24 days in September, which was up 14% over August. Median price peaked in August at $453,000 and settled at $440,000 in September after hovering between $440,000 and $450,000 since March. For the first time since February, the average list to sale price ratio was 99% after sitting at 100-101% over the last six months.
The return of strong equity levels have brought sellers to market that have been waiting to jump in for some time. In fact, average prices have grown just over 20% over the last two years, freeing up sellers to make the moves they have been waiting for. Continued buyer demand due to our flourishing job market and historically low interest rates have steadily absorbed new inventory, but we are finally starting to see a trend toward some more balance. This is good news! We are still seeing multiple offers and quick market times, but not quite the frenzy that we experienced earlier this year.
All of these factors indicate that we may finally be headed towards a more stabilized market with positive attributes for both buyers and sellers.
North King County 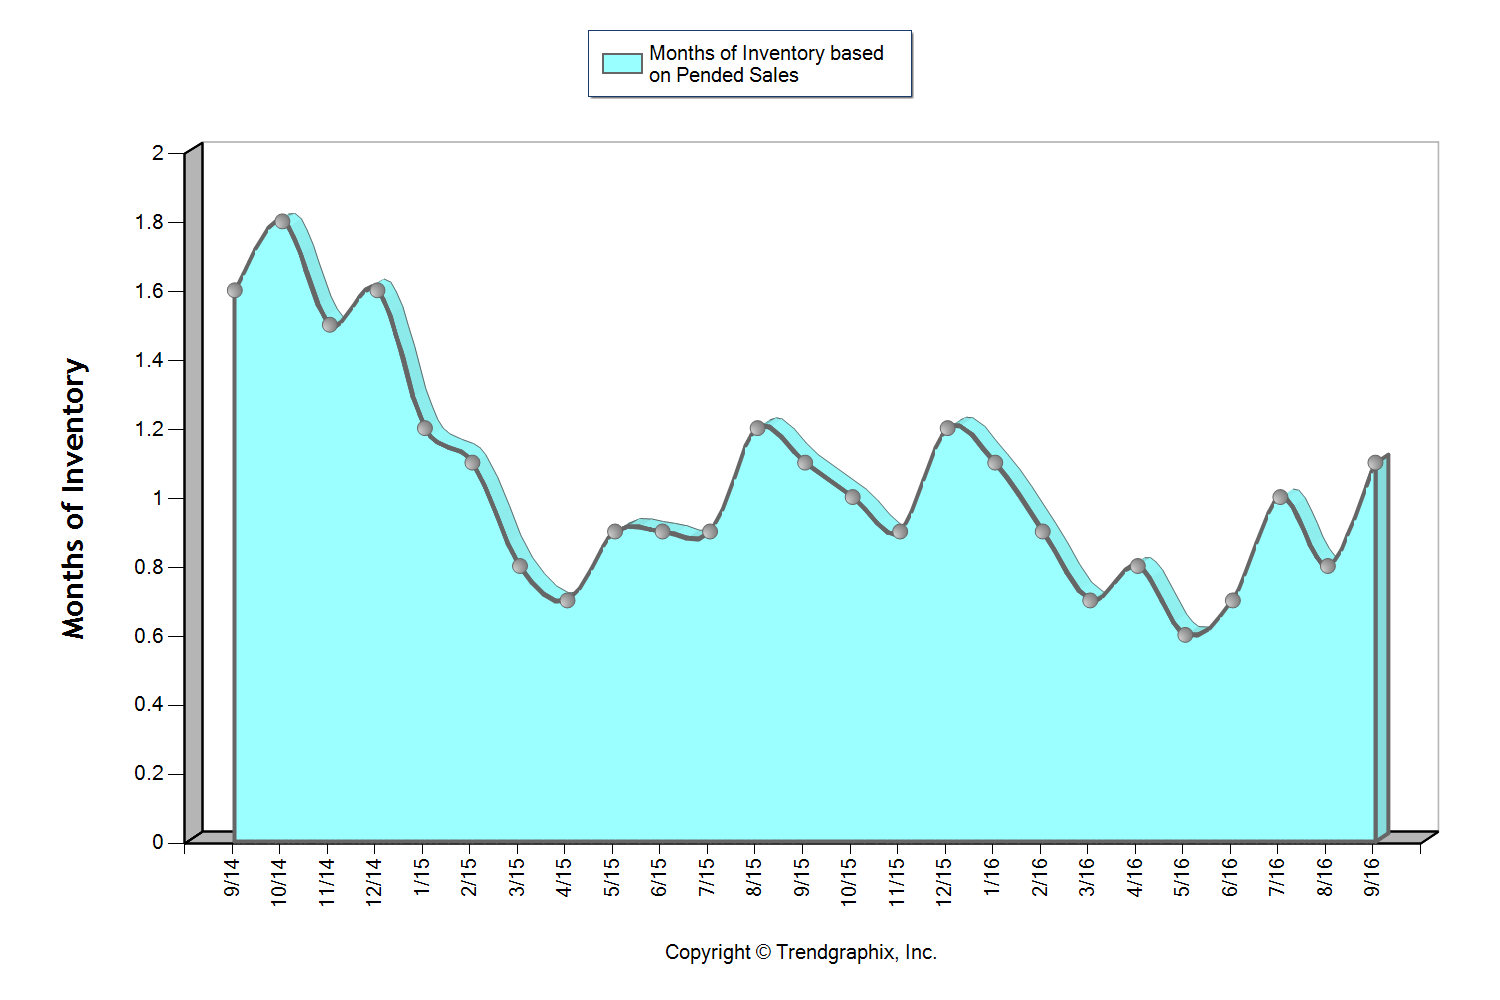
This graph shows that we currently sit at 1.1 months of inventory based on pending sales, which is the highest level we have seen since January! It is certainly still a seller’s market (3 months or less), but one that is starting to provide buyers increased options. In fact, we saw a 13% jump in new listings month-over-month. The average cumulative days on market reached 20 days in September, which was up 18% over August. Median price peaked in June at $650,000 and settled at $600,000 in September after hovering between $605,000 and $650,000 since March. In June, there were 95% more home sales above $1M over September. For the first time since February, the average list to sale price ratio was 101% after sitting at 102-104% over the last seven months.
The return of strong equity levels have brought sellers to market that have been waiting to jump in for some time. In fact, average prices have grown 21% over the last two years, freeing up sellers to make the moves they have been waiting for. Continued buyer demand due to our flourishing job market and historically low interest rates have steadily absorbed new inventory, but we are finally starting to see a trend toward some more balance. This is good news! We are still seeing multiple offers and quick market times, but not quite the frenzy that we experienced earlier this year.
All of these factors indicate that we may finally be headed towards a more stabilized market with positive attributes for both buyers and sellers.
Eastside 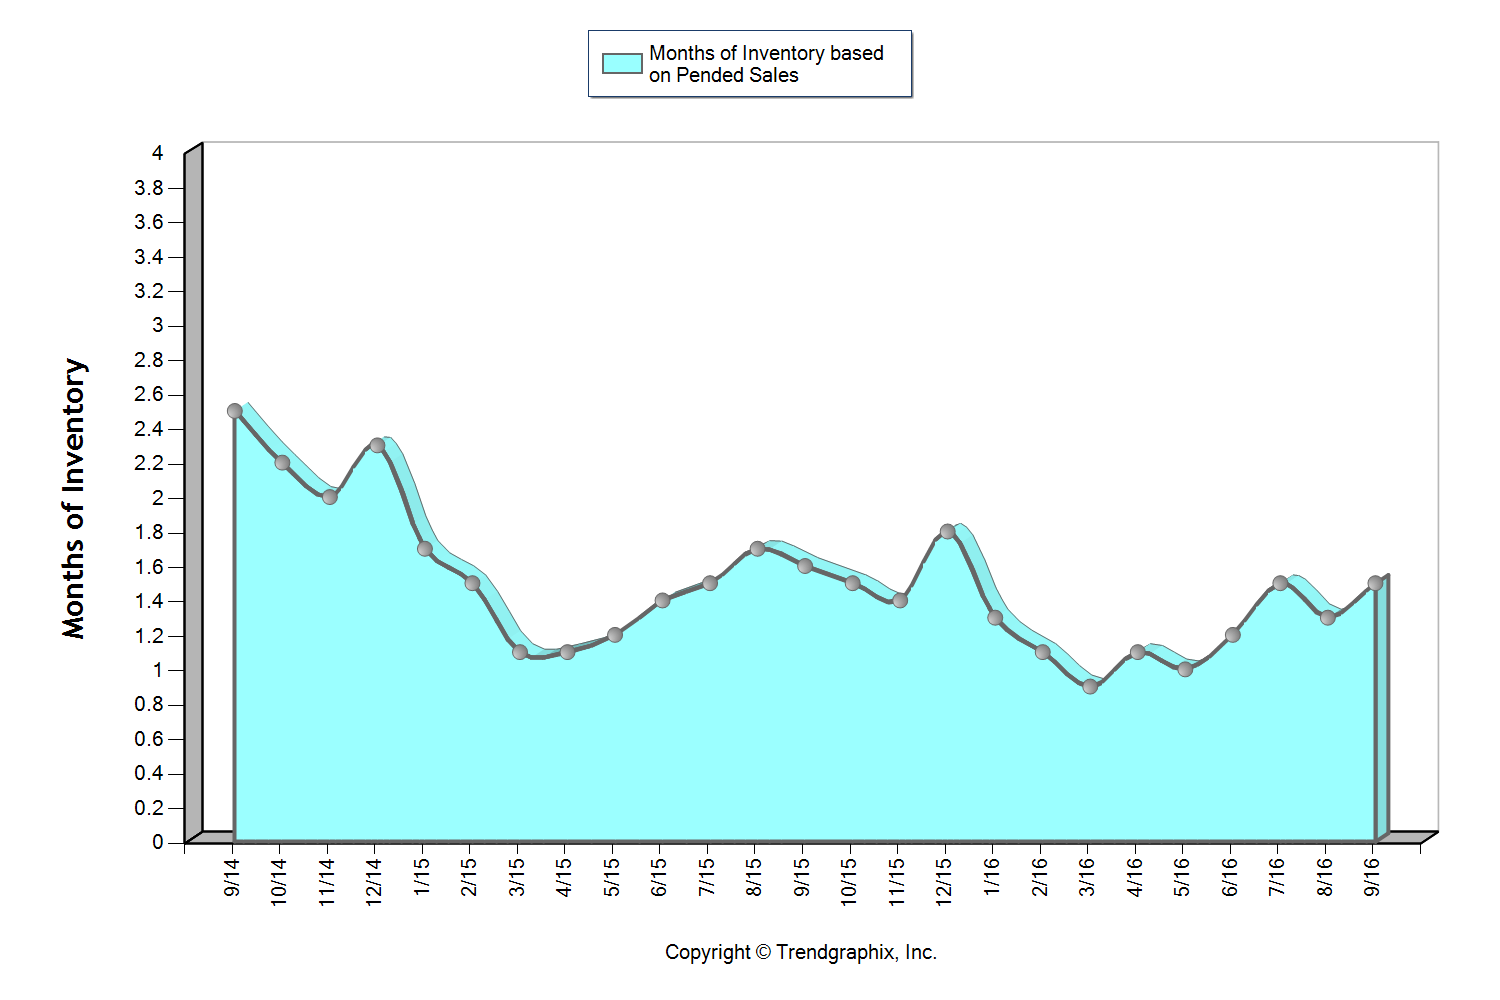
This graph shows that we currently sit at 1.5 months of inventory based on pending sales, which is the highest level we have seen in all of 2016! It is still a seller’s market (3 months or less), but one that is starting to provide buyers increased options. The average cumulative days on market reached 31 days in September which was up 24% over August. Median price peaked in August at $770,000 and settled at $750,000 in September after hovering between $737,000 and $770,000 since March. In June, there were 18% more home sales above $1M over September. Over the last two months, the average list to sale price ratio was 99% after sitting at 101-102% over the five months prior.
The return of strong equity levels have brought sellers to market that have been waiting to jump in for some time. In fact, average prices have grown 25% over the last two years, freeing up sellers to make the moves they have been waiting for. Continued buyer demand due to our flourishing job market and historically low interest rates have steadily absorbed new inventory, but we are finally starting to see a trend toward some more balance. This is good news! We are still seeing multiple offers and quick market times, but not quite the frenzy that we experienced earlier this year.
All of these factors indicate that we may finally be headed towards a more stabilized market with positive attributes for both buyers and sellers.
Seattle Metro 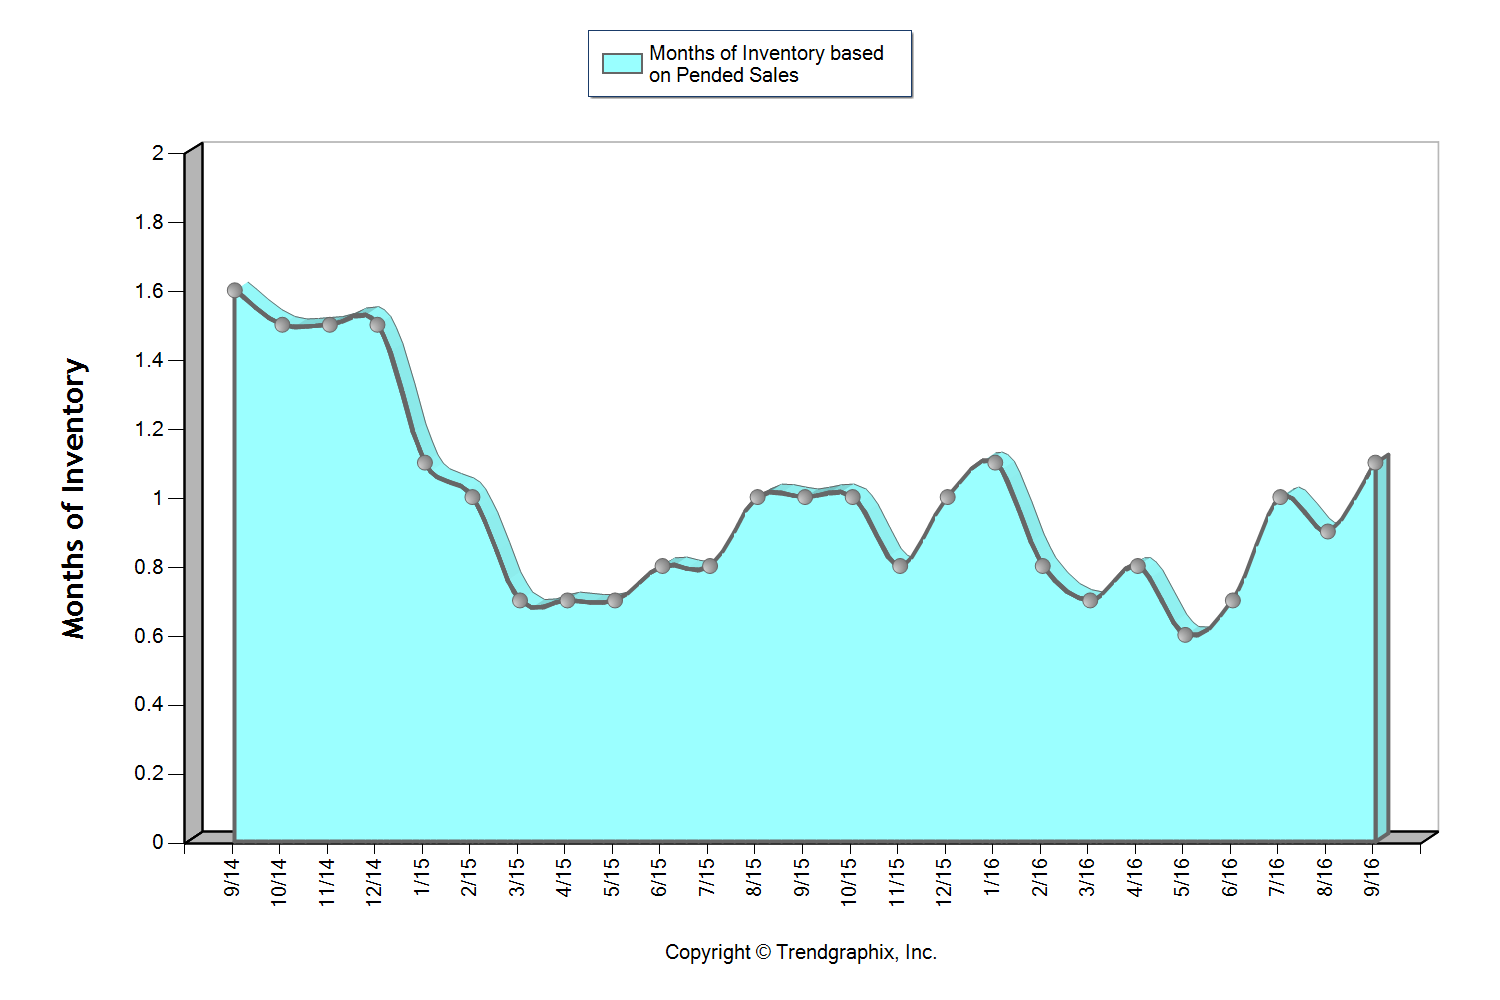
This graph shows that we currently sit at 1.1 months of inventory based on pending sales, which is the highest level we have seen since January! It is certainly still a seller’s market (3 months or less), but one that is starting to provide buyers increased options. In fact, we saw a 16% jump in new listings month-over-month. The average cumulative days on market reached 21 days in September, which was up 31% over August. Median price peaked in June at $650,000 and settled at $605,000 in September after hovering between $608,000 and $650,000 since March. In June, there were 23% more home sales above $1M over September. For the first time since February, the average list to sale price ratio was 101% after sitting at 102-104% over the last seven months.
The return of strong equity levels have brought sellers to market that have been waiting to jump in for some time. In fact, average prices have grown 22% over the last two years, freeing up sellers to make the moves they have been waiting for. Continued buyer demand due to our flourishing job market and historically low interest rates have steadily absorbed new inventory, but we are finally starting to see a trend toward some more balance. This is good news! We are still seeing multiple offers and quick market times, but not quite the frenzy that we experienced earlier this year.
All of these factors indicate that we may finally be headed towards a more stabilized market with positive attributes for both buyers and sellers.
South King County 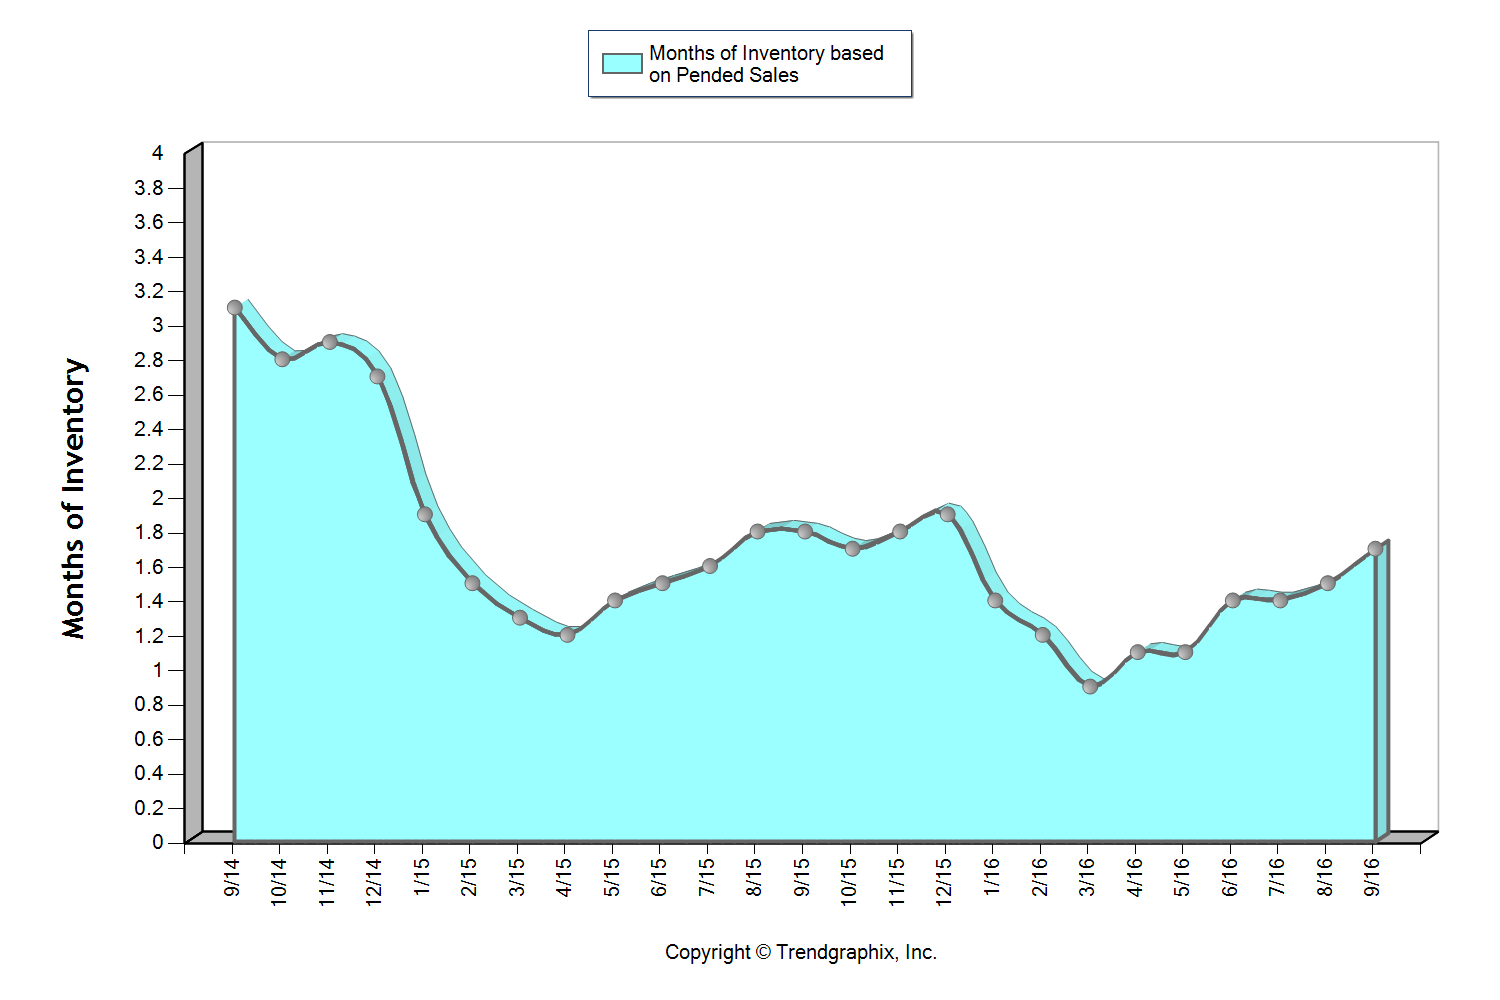
This graph shows that we currently sit at 1.7 months of inventory based on pending sales, which is the highest level we have seen in all of 2016! It is still a seller’s market (3 months or less), but one that is providing buyers increased options. The average cumulative days on market reached 27 days in both August and September, which was up 23% over July. Median price peaked in June at $371,000 and settled at $360,000 in September after hovering between $350,000 and $371,000 since March. For the first time since March, the average list to sale price ratio was 99% in August and September after sitting at 100-101% the prior four months.
The return of strong equity levels have brought sellers to market that have been waiting to jump in for some time. In fact, average prices have grown 16% over the last two years, freeing up sellers to make the moves they have been waiting for. Continued buyer demand due to our flourishing job market and historically low interest rates have steadily absorbed new inventory, but we are finally starting to see a trend toward some more balance. This is good news! We are still seeing multiple offers and quick market times, but not quite the frenzy that we experienced earlier this year.
All of these factors indicate that we may finally be headed towards a more stabilized market with positive attributes for both buyers and sellers.
These are only snapshots of the trends in our area; please contact one of our agents if you would like further explanation of how the latest trends relate to you.
Interest Rates and Your Bottom Line
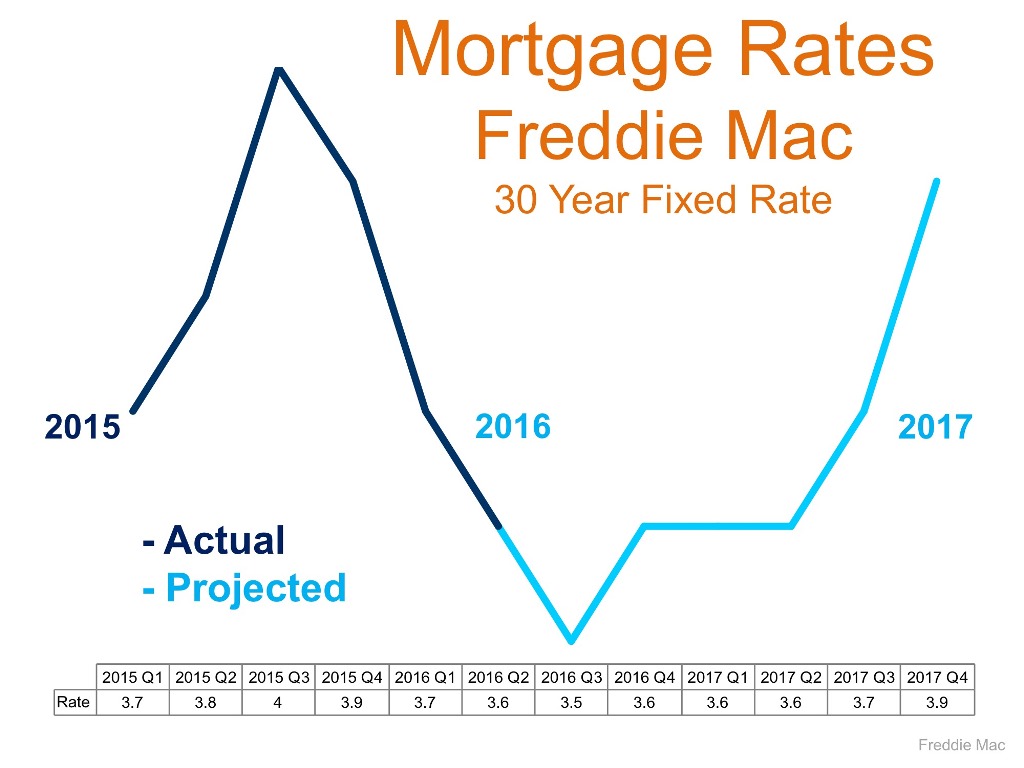 Wow, just wow! The interest rate levels that we have experienced in 2016 are seriously unbelievable. Currently we are hanging around 3.5% for a 30-year fixed conventional mortgage, almost a half a point down from a year ago. This is meaningful because the rule of thumb is that for every one-point increase in interest rate a buyer loses ten percent in buyer power. For example, if a buyer is shopping for a $500,000 home and the rate increases by a point during their search, in order to keep the same monthly payment the buyer would need to decrease their purchase price to $450,000. Conversely, for every decrease in interest rate, a buyer can increase their purchase price and keep the same monthly mortgage payment.
Why is this important to pay attention to? Affordability! If you take the scenario I just described and apply it to the graph on the right, you can see that the folks who jumped into the market this year enjoyed an interest cost savings when securing their mortgage. This cost savings is doubly important because we are in a price appreciating market. In fact, the median price in King County has increased by 13% complete year-over-year and 10% in Snohomish County. Interest rates are helping to keep payments more manageable in our appreciating market. Most recently we have started to see a slight increase in inventory compared to the spring/summer market, which is a plus for buyers and something to be taken advantage of.
Will these rates last forever? Simply put, no! The graph above provided by Freddie Mac shows a prediction for rates to start rising. While still staying well below the 30-year average of 7.65%, increases are increases, and securing these rates could be downright historical. Just like the 1980’s when folks were securing mortgages at 18%, the people that lock down on a rate from today will be telling these stories to their grandchildren. Another factor to consider is that it is an election year, and rates historically remain level during these times. What 2017 and beyond hold for rates will likely not mirror these historical lows under 4%. Note the 30-year average – one must think that rates closer to that must be in our future at some point.
So what does this mean for you? If you have considered making a move, or even your first purchase, today’s rates are a huge plus in helping make that transition more affordable. If you are a seller, bear in mind that today’s interest rate market is creating strong buyer demand, providing a healthy buyer pool for your home. As a homeowner who has no intention to make a move, now might be the time to consider a refinance. What is so exciting about these refinances, is that it is not only possible to reduce your monthly payment, but also your term, depending on which rate you would be coming down from.
If you would like additional information on how today’s historical interest rates pertain to your housing goals, please contact any of our agents. We would be happy to educate you on homes that are available, do a market analysis on your current home, and/or put you in touch with a reputable mortgage professional to help you crunch numbers. Real estate success is rooted in being accurately informed, and it is our goal to help empower you to make sound decisions for you and your family.
What is the State of the Condominium Market in the Greater Seattle Area?

We often speak about the Single Family Residential (SFR) market, but we thought it would be interesting to take a deep dive into the Condominium (condo) market in the Greater Seattle area. Condos can provide a more affordable option and have grown in popularity as SFR home prices have gone up.
 Much like the SFR market the condo market has been inventory starved. In fact, condo inventory is down 31% in both King and Snohomish Counties complete year-over-year. While inventory has shrunk sales have increased! In King County, sales are up 14% over the last twelve months compared to the previous twelve months, and up 23% in Snohomish County. These figures indicate quite a bit of demand for this product. The good news is new listings are slighting increasing, with 3% more new listings in King County and 7% in Snohomish County. This increase in new listings is due to some new construction, condo development, and more and more re-sale owners regaining their equity position and making moves.
Prices are on the rise too! An important aspect to measure in regards to condos is price per square foot, and in King County the price per sq. ft. is up 20% complete year-over-year and up 12% in Snohomish County, which is a big jump. The average cost per square foot in King County in July 2016 was $413 per square foot, and $207 in Snohomish County. This illustrates the affordability difference between both counties, which is why the increase in sales in Snohomish County is markedly up. Condos provide a more affordable option for buyers, and if one is looking to land in Snohomish County, condos can be the most affordable housing purchase option available.
The good news for condo sellers is that days on market are down by 40% in King County, and 31% in Snohomish County. In July, the average days on market was 16 days in King County and 19 days in Snohomish County. The average sale price in July in King County was $446,000 and $291,000 in Snohomish County – up 17% and 12% respectively. Months of inventory is tight in both markets, sitting at one month of available inventory, meaning that if no new inventory came to market we would sell out of condos in one month!
There has been some new condo development, and that has been swooped up quickly, especially buildings going up in the downtown urban core. In fact, according to the recently released Washington State Condominium Report, the median price for a new condo in Seattle was $683,590 – just under Los Angeles and well under San Francisco.
So what does all of this mean? The condo market is much like the SFR market in regards to demand, price appreciation and the affordability divide between King and Snohomish Counties. It is a great market for sellers to realize a positive return and buyers who can't afford or don't want the maintenance of a SFR can find opportunity with condos. If you or anyone you know would like more information on the Greater Seattle condo market, please contact any one of our agents. It is always our goal to help keep you informed.
Many Factors to Consider When Choosing to Rent vs. Own
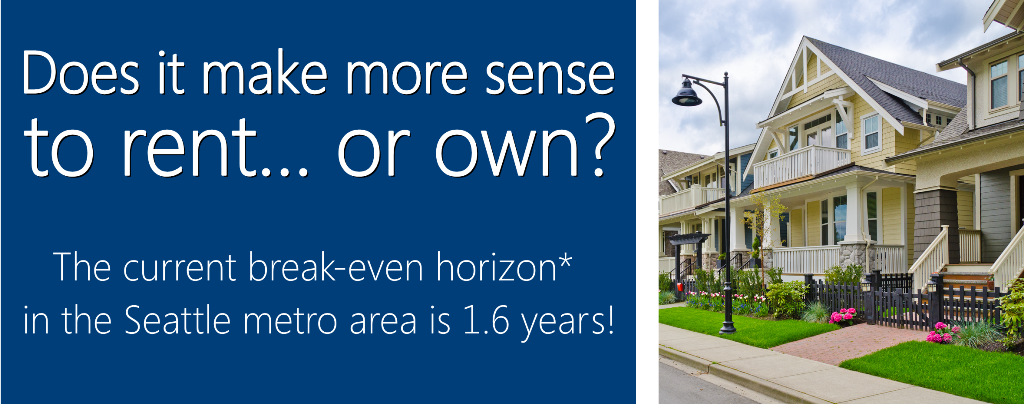
*The amount of time you need to own your home in order for owning to be a superior financial decision.
There has been a lot of talk lately about the cost of living in the Greater Seattle area. Whether it has to do with home prices or rental rates the story is the same: it is becoming more and more expensive by the month. With rising rental rates, historically low interest rates, and home prices on the rise, the advantage of buying vs. renting has become clear for folks that have a down payment saved, good debt to income ratios and strong credit. In fact, Seattle is now the 10th most expensive city to rent in the country according to a new study from Zumper.com. The average monthly rental price for a one-bedroom apartment in the city of Seattle is $1,740! Snohomish County has seen an increase in apartment growth and rising rental rates as well. Currently, the breakeven horizon in the Greater Seattle area (the amount of time you need to own your home in order for owning to be a superior financial decision versus renting) is 1.6 years according to Zillow research.
There are several factors to consider that will lead you to make the best decision for your lifestyle and your financial bottom line. One of the biggest factors is interest rates! Currently, the rate for a 30-year fixed, conventional, conforming loan is hovering around 3.5%. That is amazingly and historically low, making the advantage of securing a mortgage huge. What is nice about having a mortgage is that the payment stays the same over the term of the loan. With renting, rates can be increased at any time, and you are paying down someone else's asset, not your own. Owning gives the homeowner control over their overhead while getting to make their house their home. What is also so great about owning is that once you have hit the breakeven horizon, every month that ticks away thereafter is building your nest egg in value. Did you know that American homeowners’ net worth is 36 times the amount of renters? The long term benefits of owning are abundant. These are important factors to consider for everyone, but especially the younger folks that are enjoying the benefits of Seattle’s attractive job market and competitive wages.
Where folks are having to compromise most due to affordability is commute times and settling in less urban neighborhoods. Some people, mainly millennials, have not been willing to give up living in the more core urban neighborhoods that have high walk scores and shorter commute times. That should be apt to change as rents are rising fastest in those areas. The advantages of moving out a little further and securing a home will start people on the track of building long term wealth. If you or anyone you know is currently renting and is considering a change, please let us know, as we would be happy to get your questions answered to help you make an informed decision.
A Thirteen-Year Overview of Inventory Levels- Where’s the Balance?
The two graphs here illustrate a thirteen-year overview of inventory levels in both King and Snohomish Counties, highlighting the 2007 crash. Inventory levels are measured by the months of available inventory. For example, if there were 60 homes available in July and 30 homes sold in July, you would be left with two months of inventory; meaning that if no new homes came to market, the demand of 30 homes per month would absorb the 60 available homes in two months. A buyer's market is defined by 6+ months of inventory, a balanced market, 3-6 months and a seller's market, 0-3 months. From March to June of this year we averaged 1.1 months of inventory in King County and 1.2 months in Snohomish County, both extreme seller's markets.
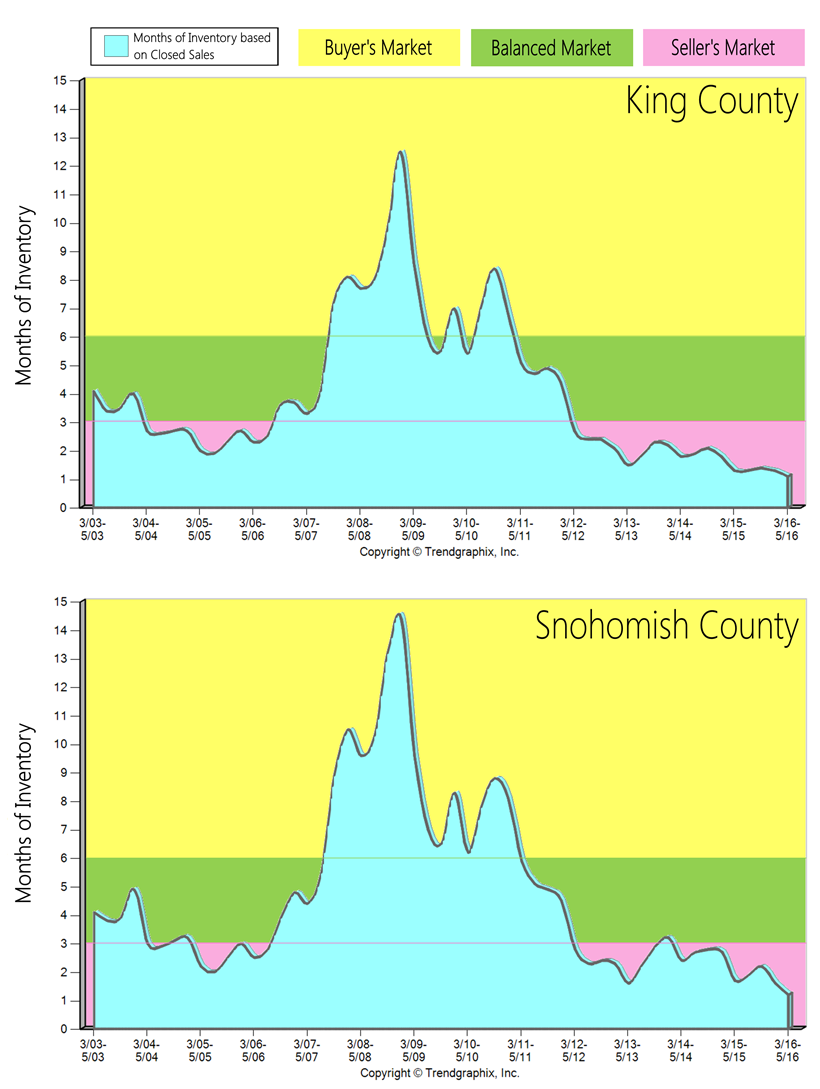 In King County over the last 13 years we saw three years of a buyer's market, which happened during the biggest economic downturn since the Great Depression, after the crash of the housing market in 2007. This economic fallout was a result of predatory lending practices, which created a large population of buyers who were not truly qualified to purchase a home. This oversaturated the market and then led it to its crash when those lending practices were shut down. These severe influences on the market led to quick jumps from a seller's to a buyer's market and then a buyer's to a seller's market. It only took one short year to transition from the seller's market of 2004-2006 to the three-year long buyer's market after the housing crash. Once the sub-prime lending options were shut down in July 2007, it eliminated many buyers, creating an extreme buyer's market. It also only took one short year to transition out of the downturn and back to a seller's market as the economy started to recover. It has been a seller's market in King County since May of 2012 – four years!
In Snohomish County over the last 13 years we saw four years of a buyer's market. Snohomish County was hit a bit harder by the Great Recession than our neighbor to the south, as it took longer to recover. It has been a seller's market in Snohomish County since May of 2012, except for one quarter of a balanced market in the beginning of 2014, when we saw a surge of new construction come to market due to the national builders releasing some neighborhoods they had acquired in the downturn.
Interestingly, the market shifts were brief because the downturn was so severe, which changed the market environment quickly. In order to clean up the predatory lending mistakes of 2004-2007, the market essentially had to come to a standstill and flush out all of the bad loans via foreclosure and short sales, which took five years. The only time we found ourselves in such an extreme buyer's market, was after one of the biggest economic fallouts of the last century. Once that corrected itself we quickly returned to a seller's market due to many positive factors.
Our available housing stock is affected by the limited land left to build on, a thriving job sector (especially in tech), historically low interest rates and the Greater Seattle area being a nice place to live. All four of these indicators have shrunk inventory and put upward pressure on prices. Sellers continue to enjoy great market returns, and buyers continue to fight to secure a home with a 4% interest rate, and not too far from their workplace. Additional inventory would be more than welcomed, it is very clear that we have the demand to absorb it. If you are curious about the value of your home in today's market or securing a purchase please contact one of our agents. We are always happy to help educate you on how this market can benefit your bottom line.
