Facebook
 X
X
 Pinterest
 Copy Link
How to Take Advantage of Edmonds’ Thriving Art Scene
We are so thankful for Edmonds’ commitment to the arts! As a result of members of the community making the arts a priority, there are some truly excellent and enriching opportunities to enjoy the arts all year long. Whether you’re looking to appreciate some art in a gallery or museum setting or just want to immerse yourself in beauty at a laid-back festival or art walk, Edmonds has opportunity for it all!
We asked locals how to best take advantage of this artistic city, and they gave us an inside look:
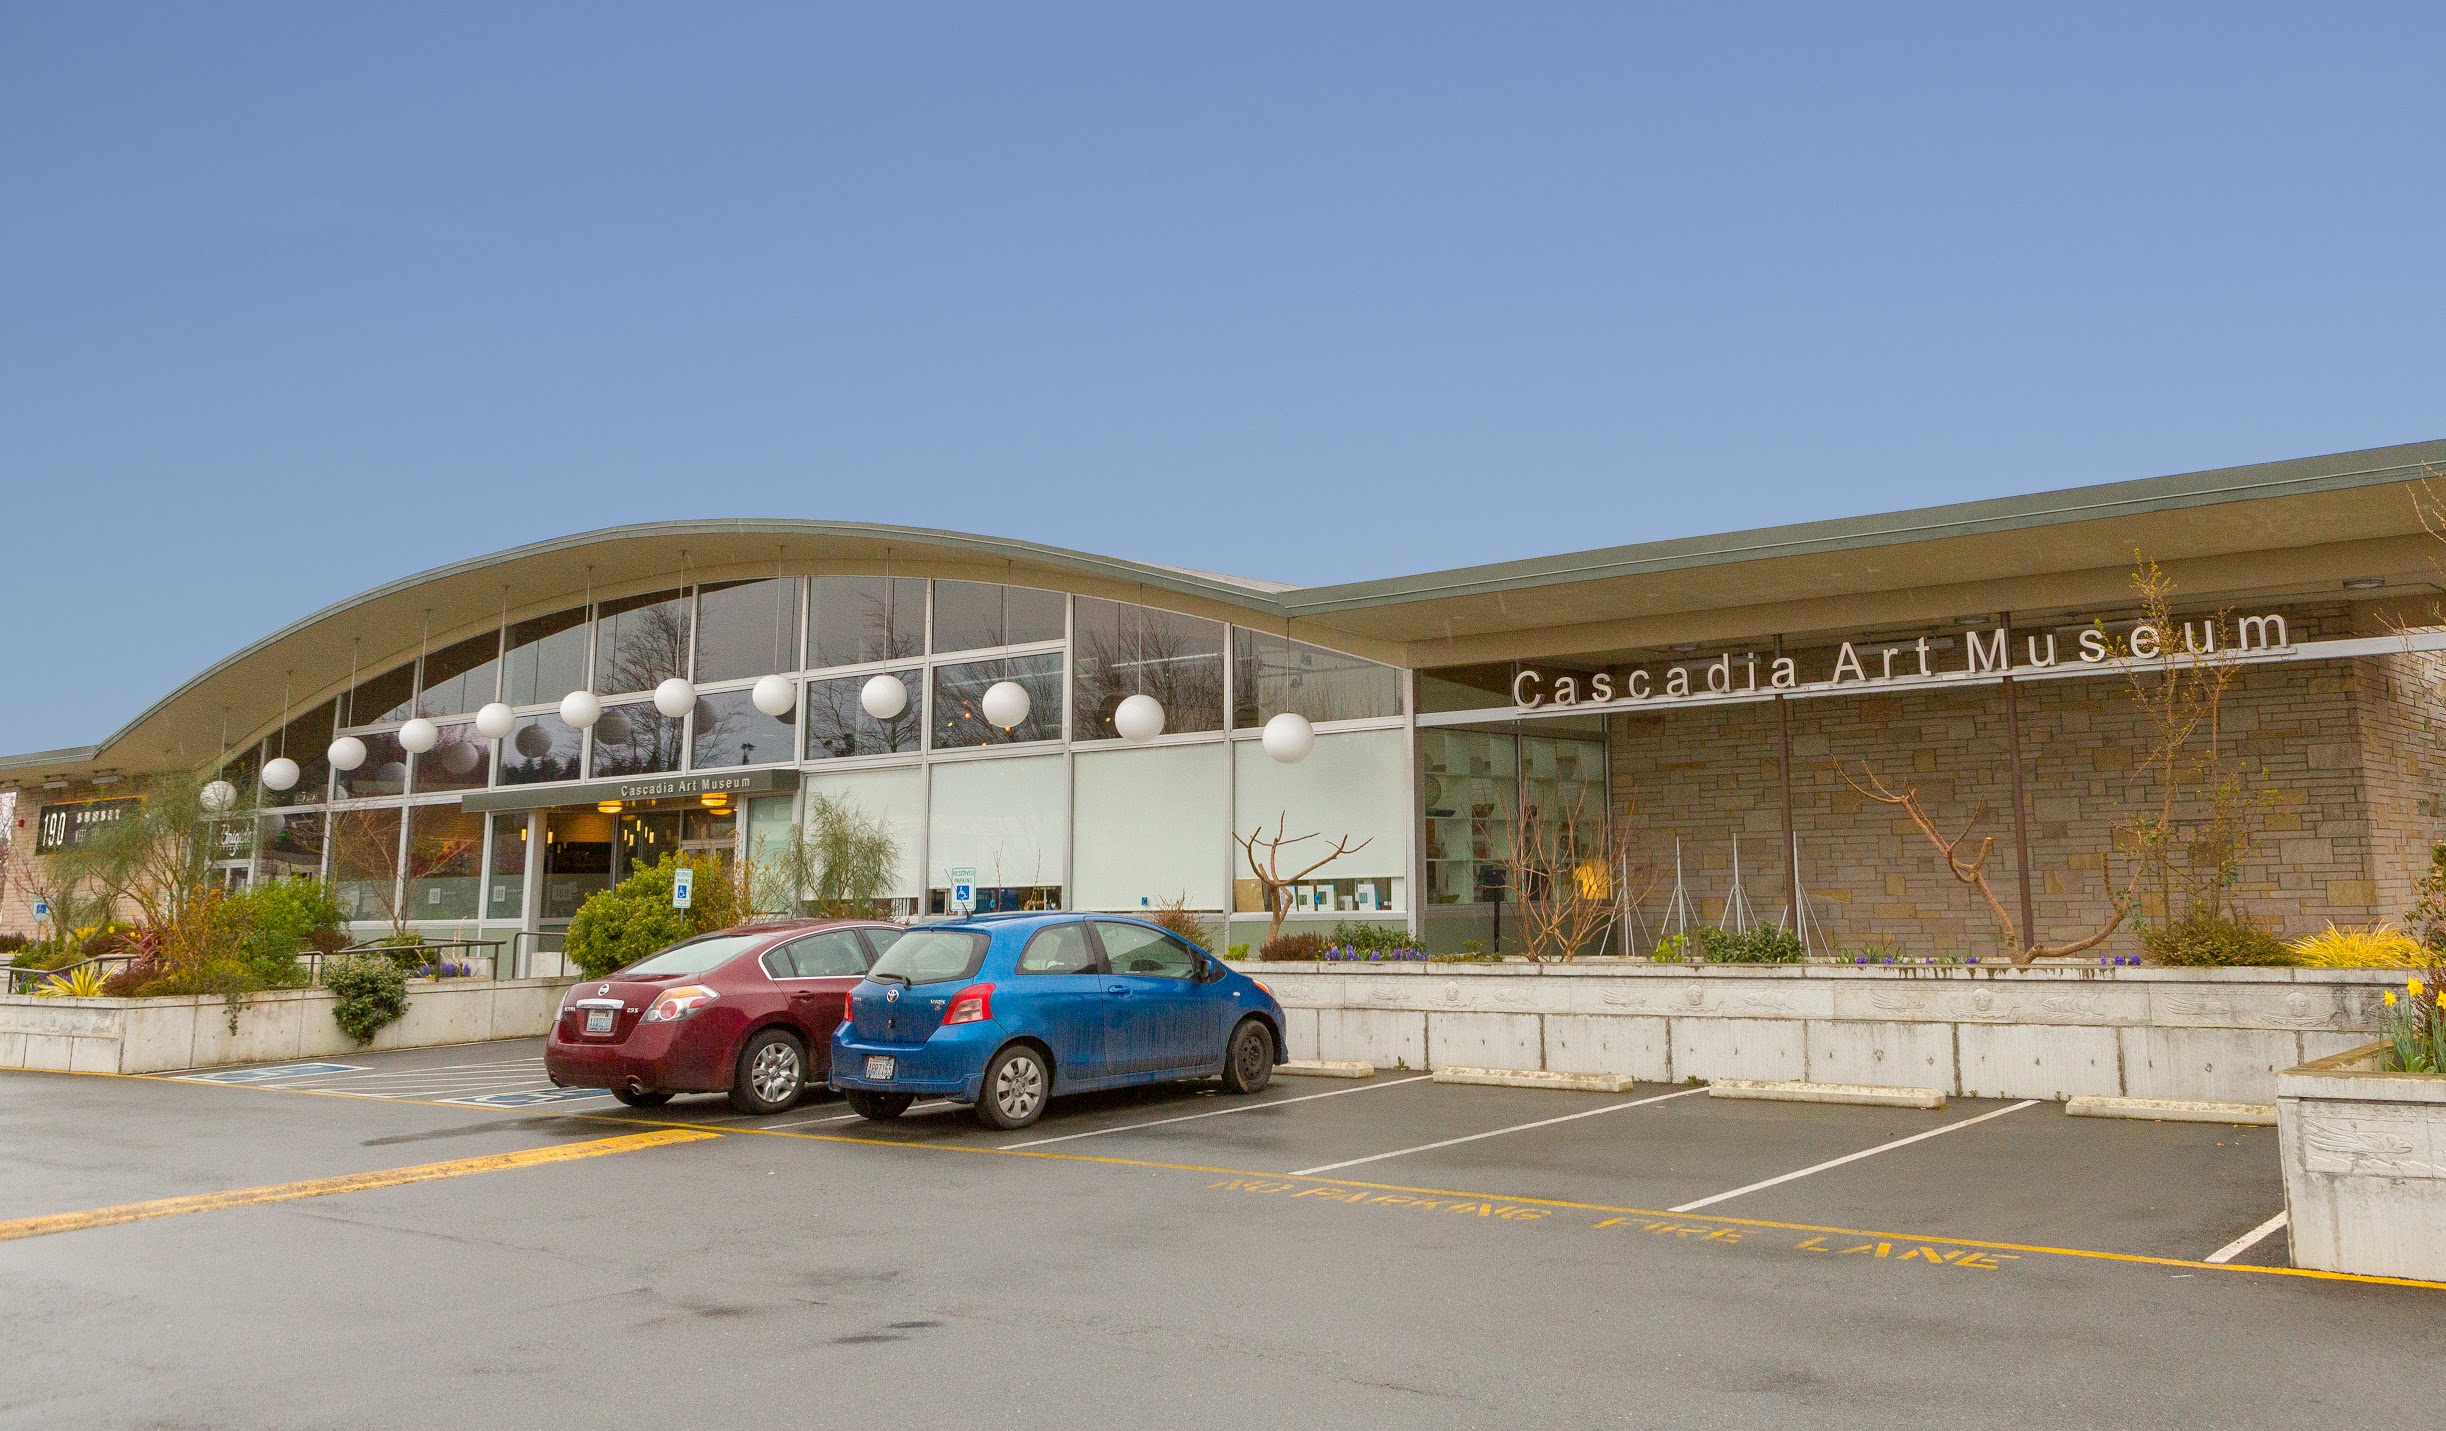
Cascadia Art Museum
Located at 190 Sunset Ave. #E Edmonds, WA 98020
“Cascadia Art Museum is a regional art museum which focuses specifically on NW artists of the mid 19th to mid 20th century,” shares local Lynette Hensley. “The museum opened in Sept 2015 at Salish Crossing, formerly a grocery store, and an antique mall. Repurposed into an art museum with rotating collections, it reflects the city of Edmonds’ commitment to the arts.”
Cascadia Art Museum offers a diverse range of exhibitions, ensuring there’s always a reason to head back! We recommend following the museum on Facebook so you can receive updates on new exhibits and events.
Monthly Art Walk
“The monthly art walk brings the town alive on the third Thursday of the month,” shares Lena Wood Maul. “Businesses stay open until 8 pm to showcase art from local artist and sometimes even serve wine and treats. The restaurants get a little extra kick that night too from all of the walking traffic. This is a super fun way to check out some local art and support our local businesses.”
Great tips, Lena! You can check out a detailed map on the Art Walk Edmonds website so you can plan your third Thursday. You can also follow them on Facebook to make sure you don’t miss out on special events happening at the art walks!
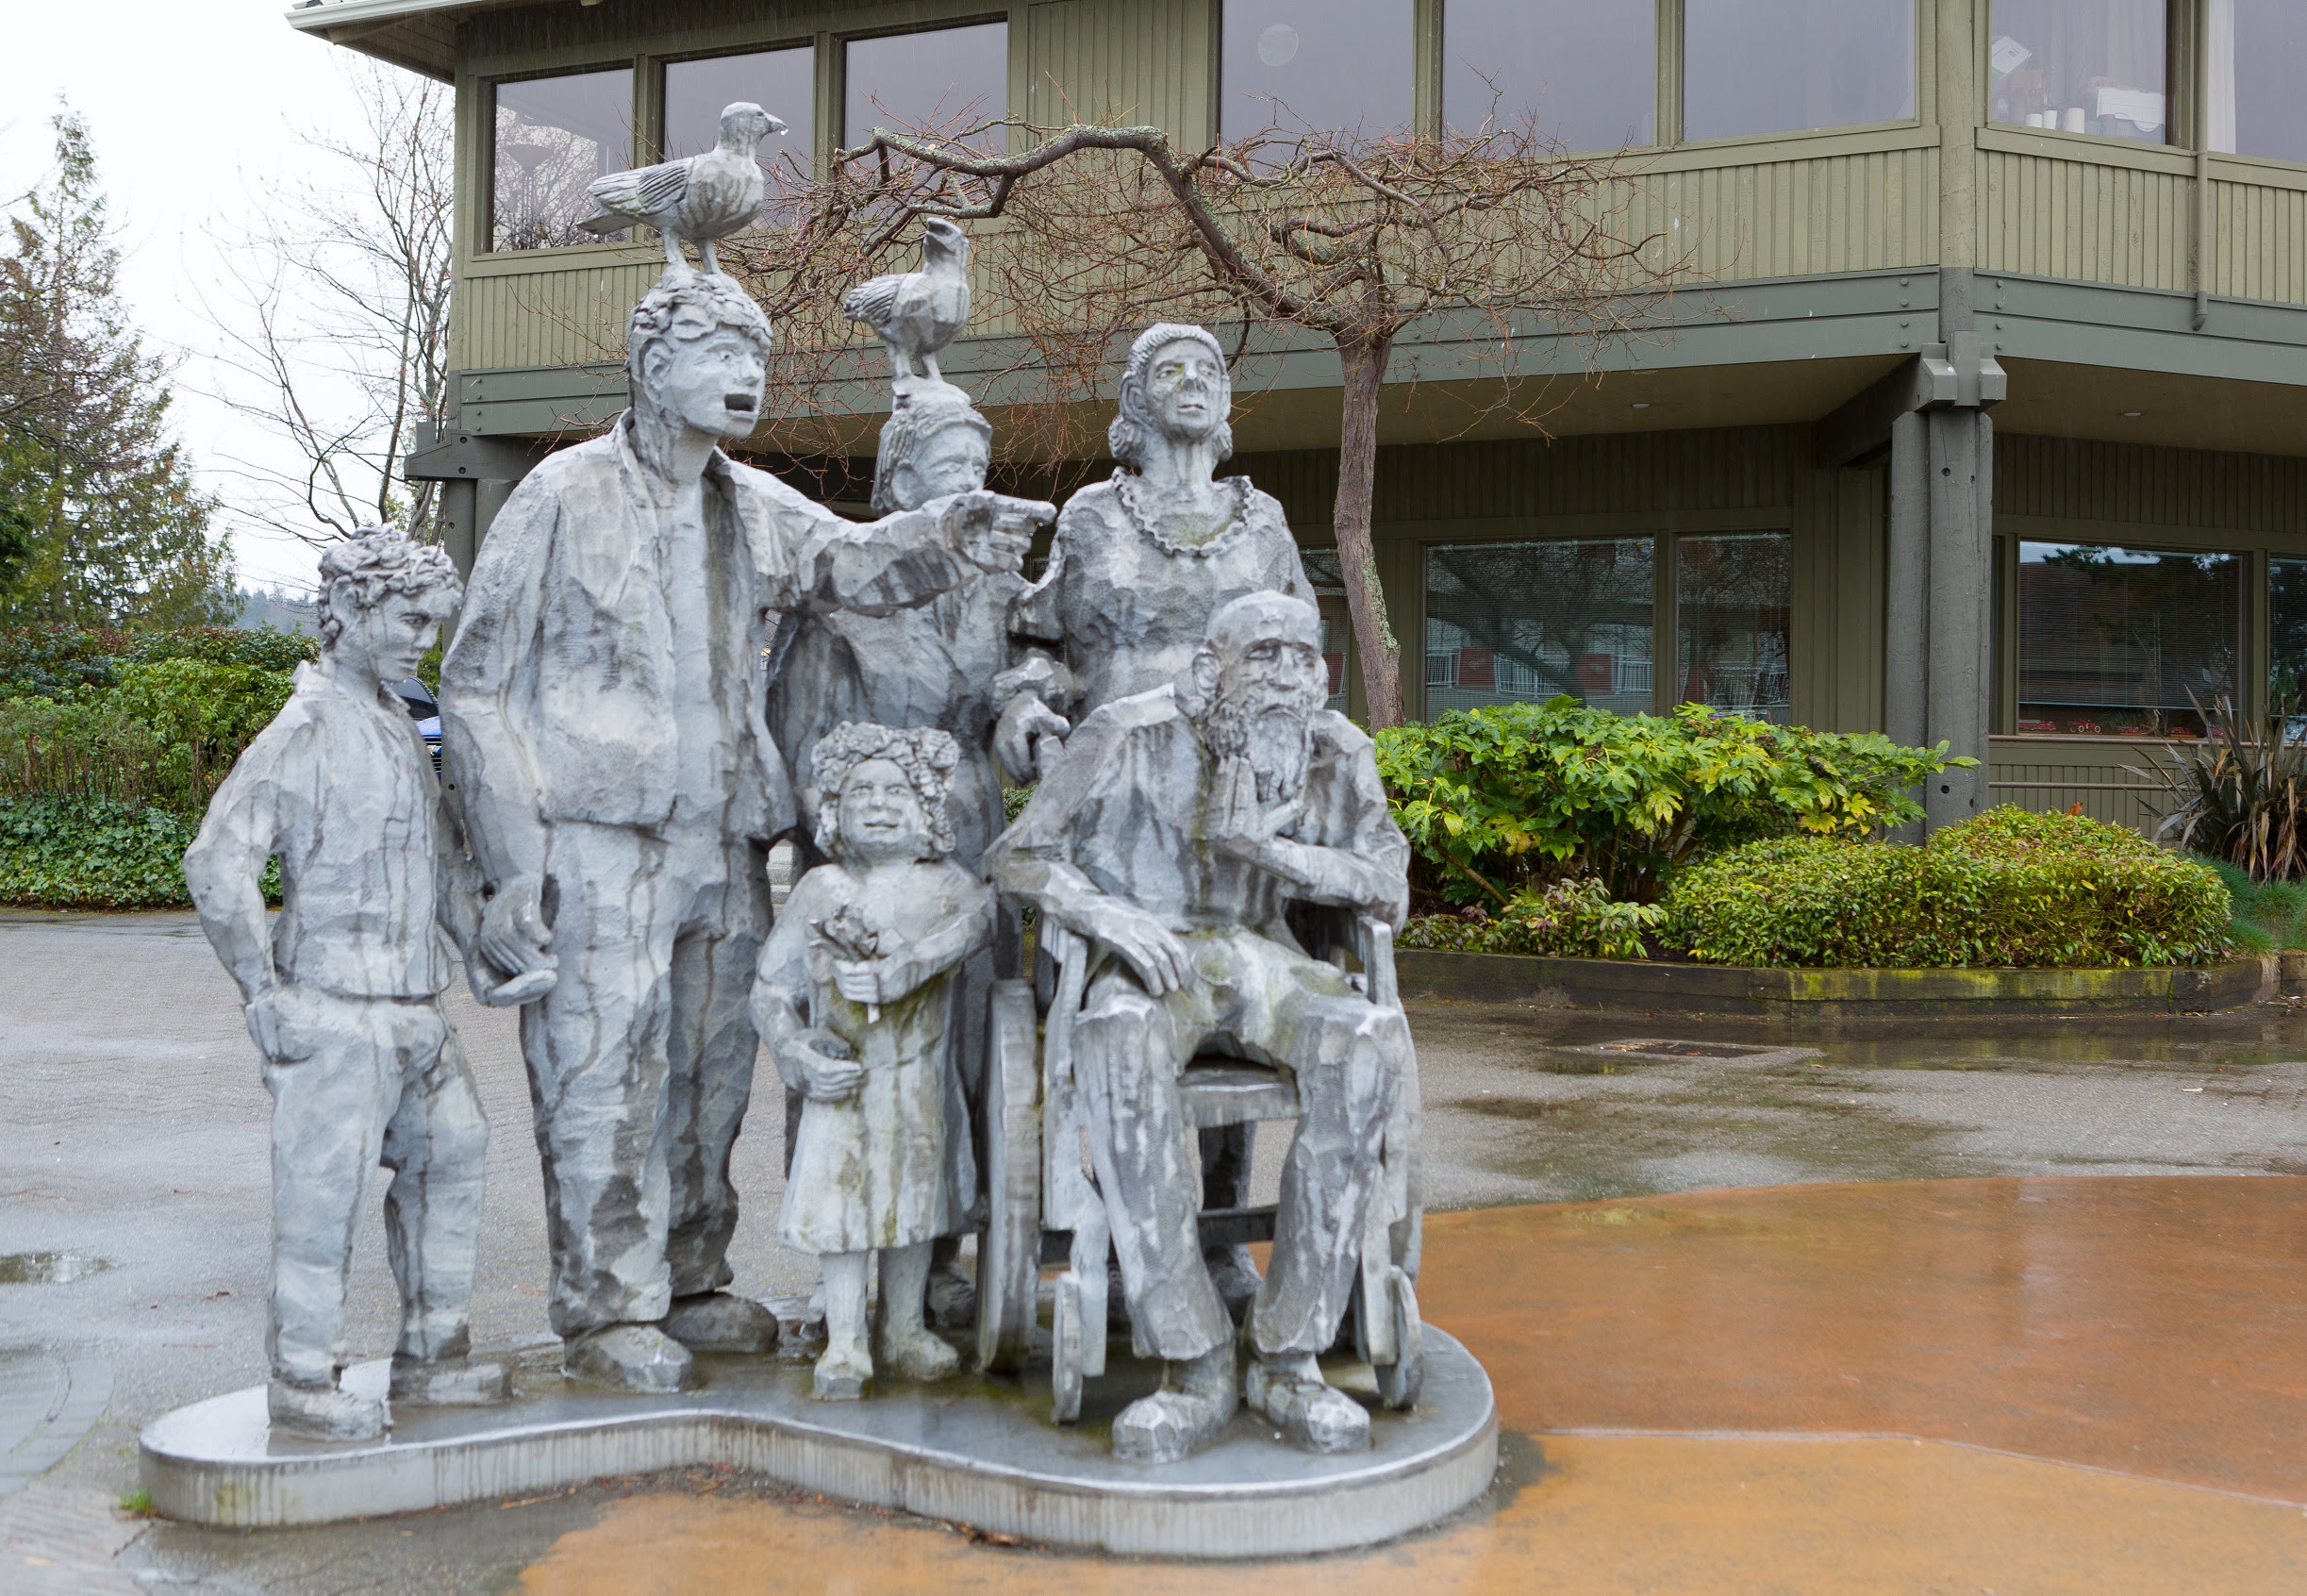
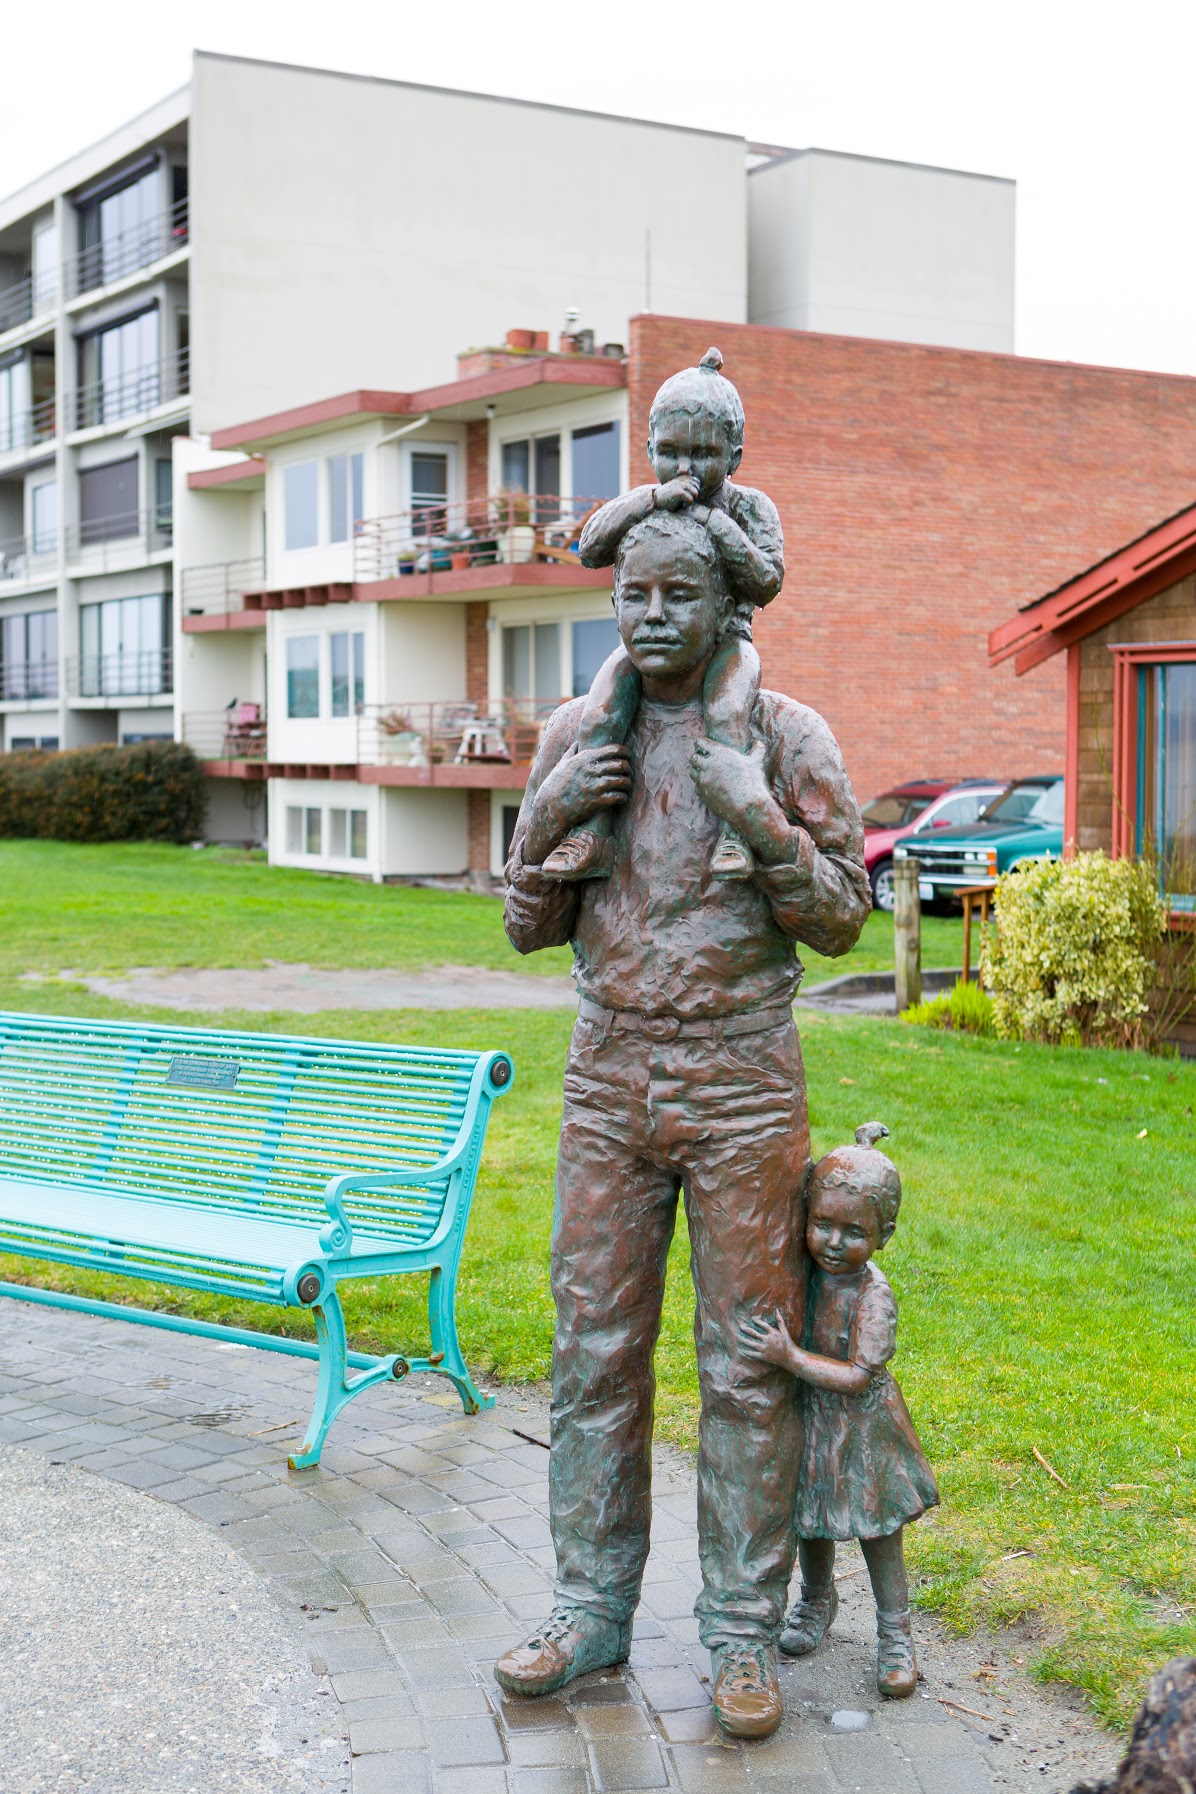
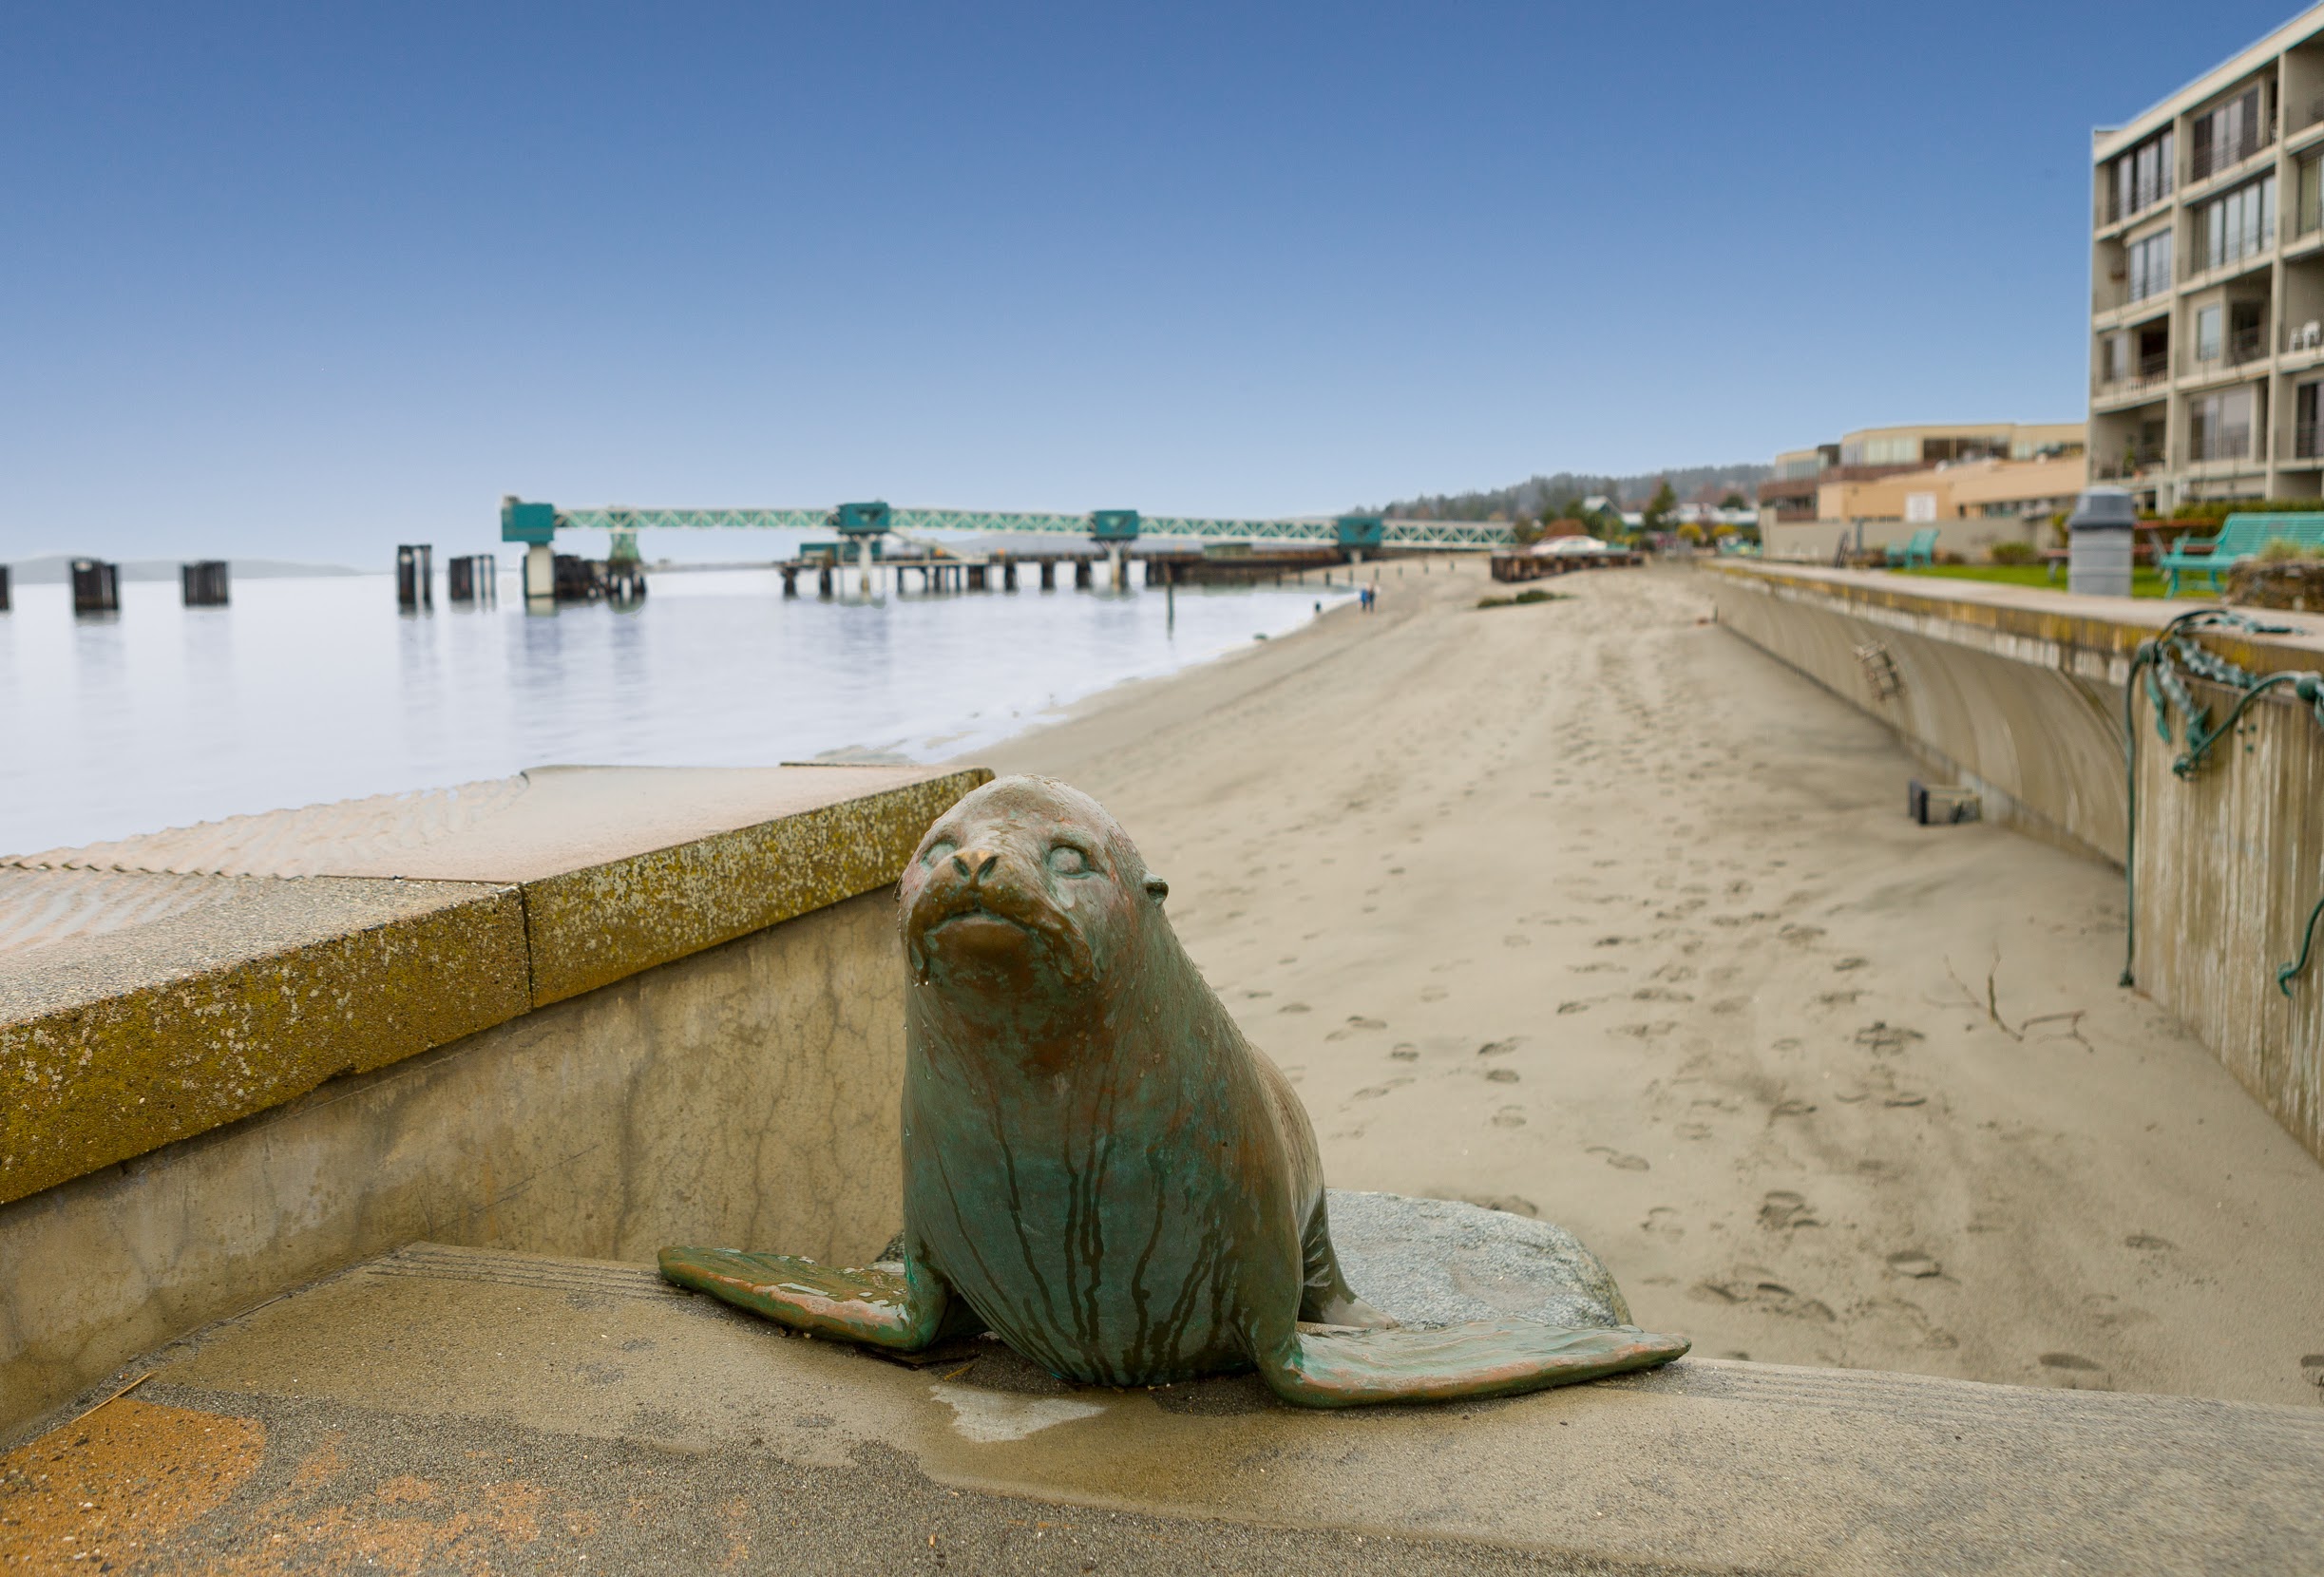
Public Art
One of the wonderful things about Edmonds is that you don’t have to head to a museum to enjoy art—you’re surrounded by it! “Check out the sculptures big and small along the waterfront walk, from the ferry to the fishing pier,” advises Lynette Hensley.
Sculptures on the waterfront include the Friendship Tree, and you can also check out an interactive map of public art in Edmonds here.
Edmonds Art Festival
Located at Frances Anderson Center 700 Main Street Edmonds, Washington
“Edmonds Art Festival is a major regional art festival, attracting artists from all over the country to show and sell at the Frances Anderson center between Dayton and Main at 7th,” says Lynette. “The festival takes place over Father’s Day weekend and is a big deal. It’s so big, it’s challenging to find parking during the most popular hours. There are two outdoor booth exhibit areas with artists lined up along ‘roads’ such as Van Gogh Place and DaVinci Avenue. Live music and food vendors keep the mood party-like, and a very inclusive student exhibit ensures participation from all ages. But the juried galleries are my favorite. As an artist myself, I’ve had work accepted in two categories. The categories include painting and drawing, 3D, photography and miniatures. Prizes are awarded, and sales are made within the galleries which benefit the Edmonds Art Festival Foundation as well as the artist.”
To learn more about participating or volunteering, check out the Edmonds Art Festival’s website!
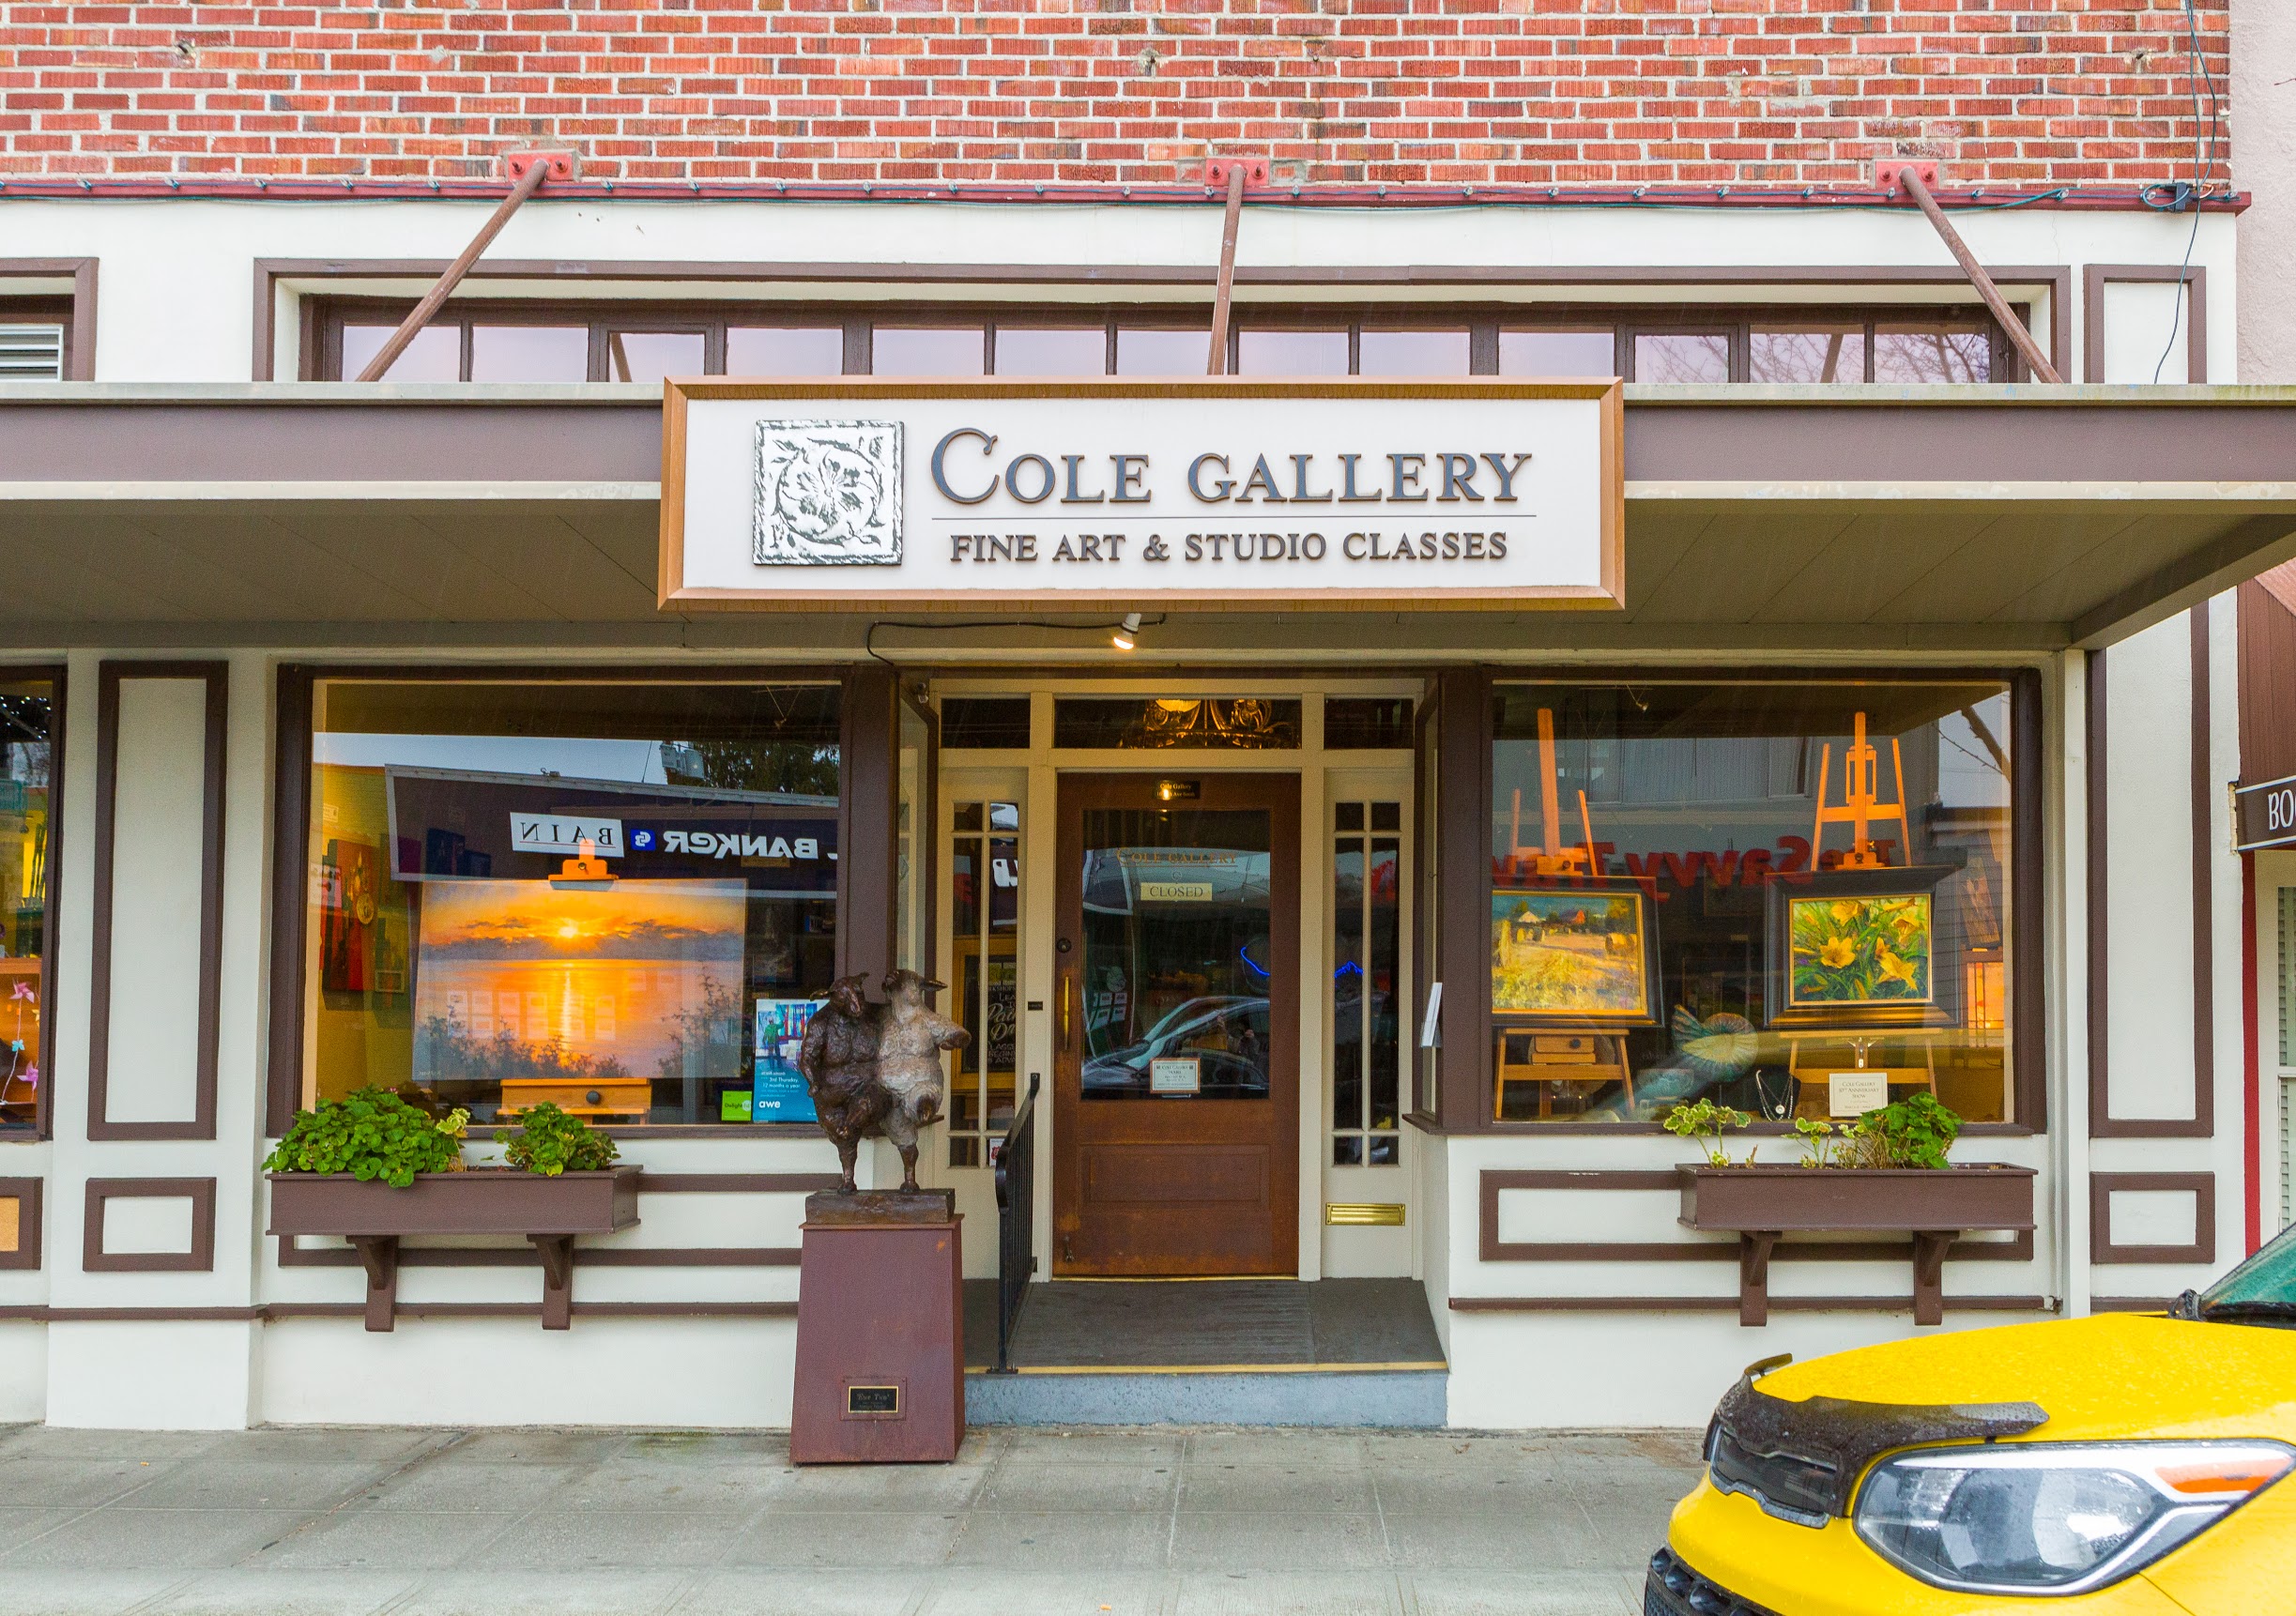
 Galleries
 Galleries
Local Lynette Hensley provided us with a list of some must-see galleries, so the next time you’re on an art walk or just out exploring Edmonds, be sure to stop by these art galleries:
- Cole Gallery (fine art gallery with emphasis on realistic subject matter)
- Gallery North (a Co-op gallery with member artists that place their work and serve as sales crew as well)
- Aria Gallery (Joan Archer, watercolor artist)
- MaJe Gallery (jewelry and adornment primarily)
Artists Connect Meeting at Artworks
“Artists Connect is affiliated with Edmonds Art Festival Foundation, and meets monthly at 2nd and Dayton at the ArtWorks building,” says Lynette Hensley. “Artists Connect began with the purpose of supporting local artists, connecting them to each other and creating a space and time for ongoing conversations and support. Twelve years ago, Edmonds Art Studio Tour began because of the connections between members of Artists Connect!”
This wonderful organization helps bring artists from all over the region together. They work to help each other out with whatever another member may need help with, whether it’s sharing resources, creating opportunities to share each others’ work, learning how to grow as an artist, and more. Learn more here!
Studio Tours
“Edmonds Art Studio Tour happens the third weekend every September. Roughly 25 or so Artist participants and some galleries open their home studios all weekend to the public for touring, viewing, some demos, and sales of course,” says Lynette Hensley.
“Many studios have guest artists along with the host artist. The art offered for view is diverse, including bronze sculptures, oil and acrylic paintings, pottery and clay work, jewelry, and anything the creatives of Edmonds and the surrounding areas can cook up.” Learn more about which studios will be participating in the next tour here! We also recommend following the Edmonds Art Studio Tour on Facebook for event updates and reminders, videos from artists, and info on the Edmonds arts scene.
ARTspot Edmonds
This top-notch art store is not only packed with art supplies, but it also offers a wide range of classes and demonstrations as well! Both kids and adults can take art classes here whether you’re interested in learning how to use pastels, finger paint, watercolor, draw, oil paint, etc. Their diversity of offerings is impressive—check out their website to learn more about upcoming classes and events.
Tips For Exploring Edmonds’ Scenic Waterfront & Beautiful Parks
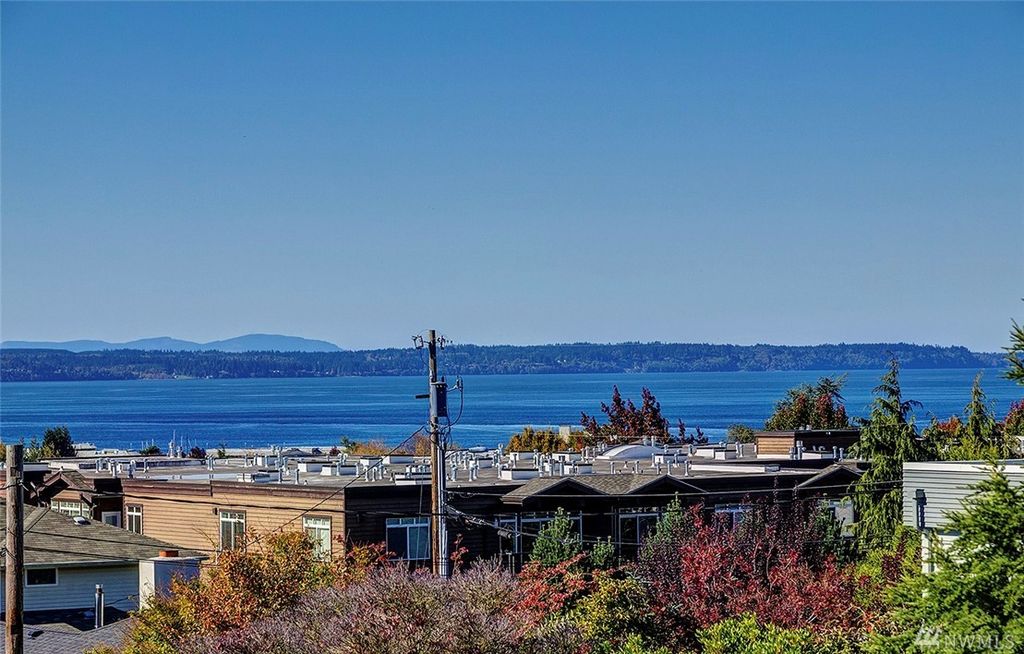
Located right along the Puget Sound, Edmonds features a long list of scenic opportunities for exploring the outdoors! From picturesque parks to its iconic waterfront, there’s a variety of activities to choose from, whether you’re just looking for a day at the playground or wanting to spend a sunny day by the sea.
When the sun comes out and you’re ready to head outside for some fresh air, make sure you have this list of tips for exploring Edmonds on hand:
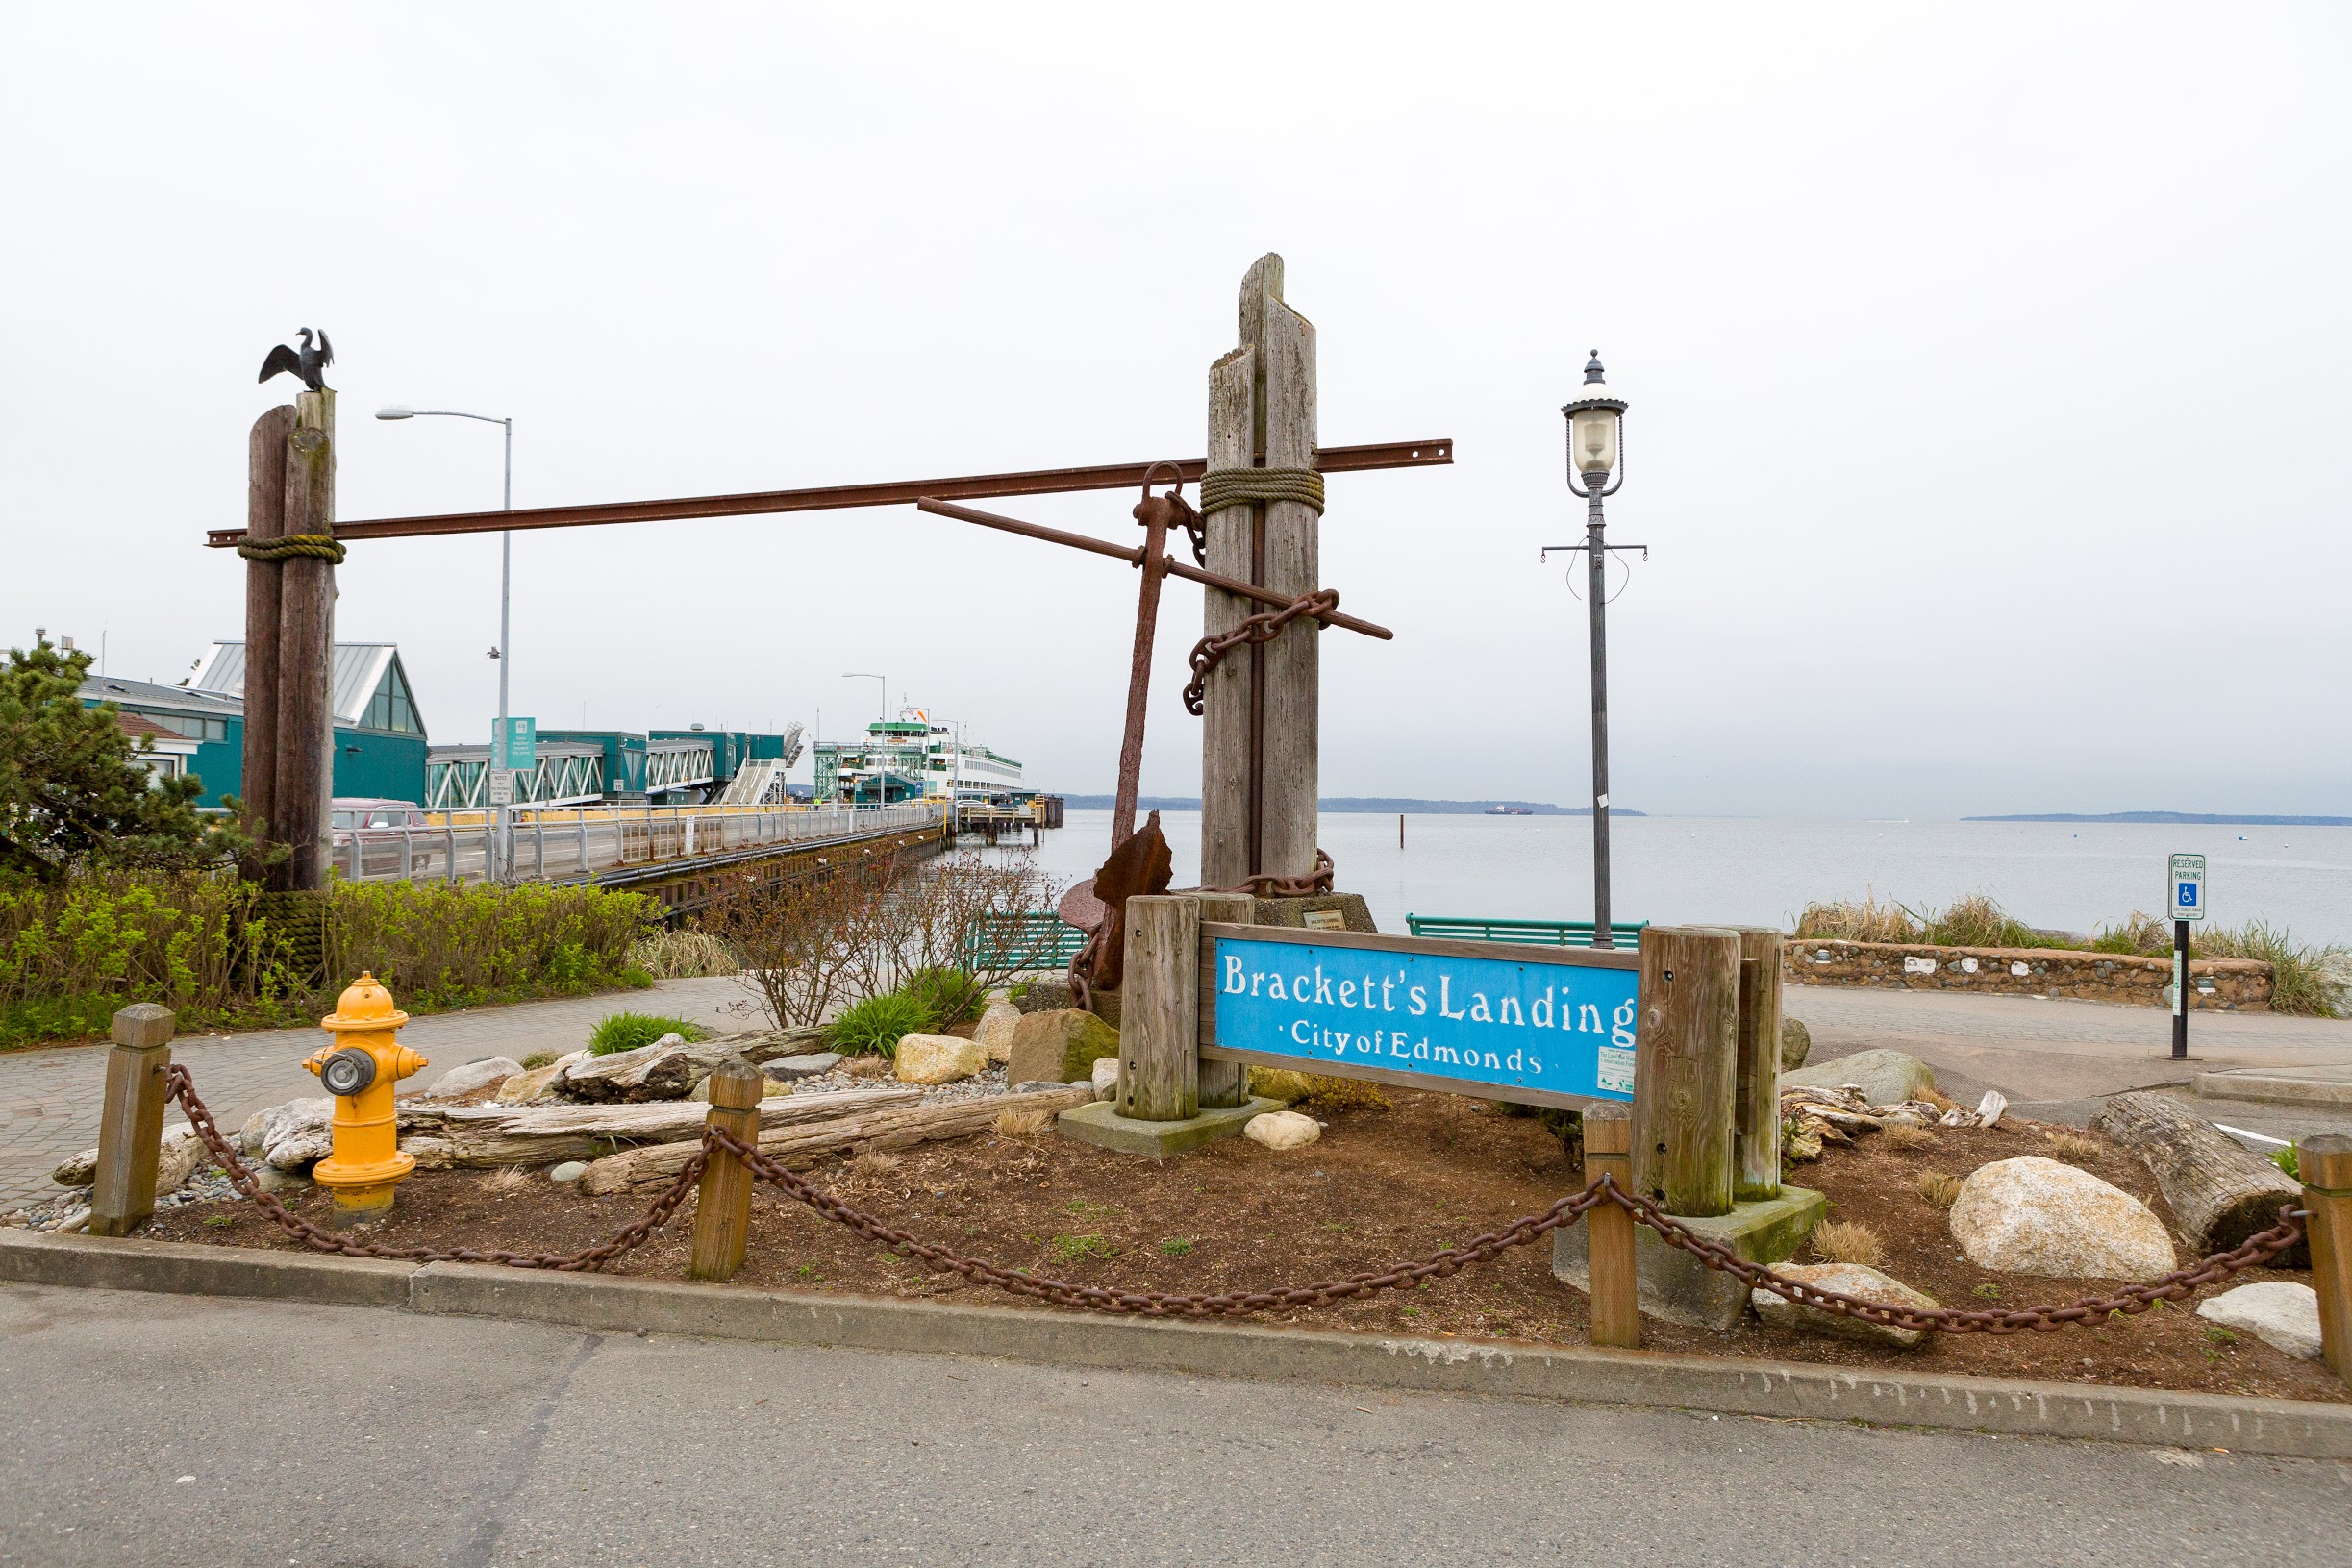
 Brackett’s Landing South & Brackett’s Landing North
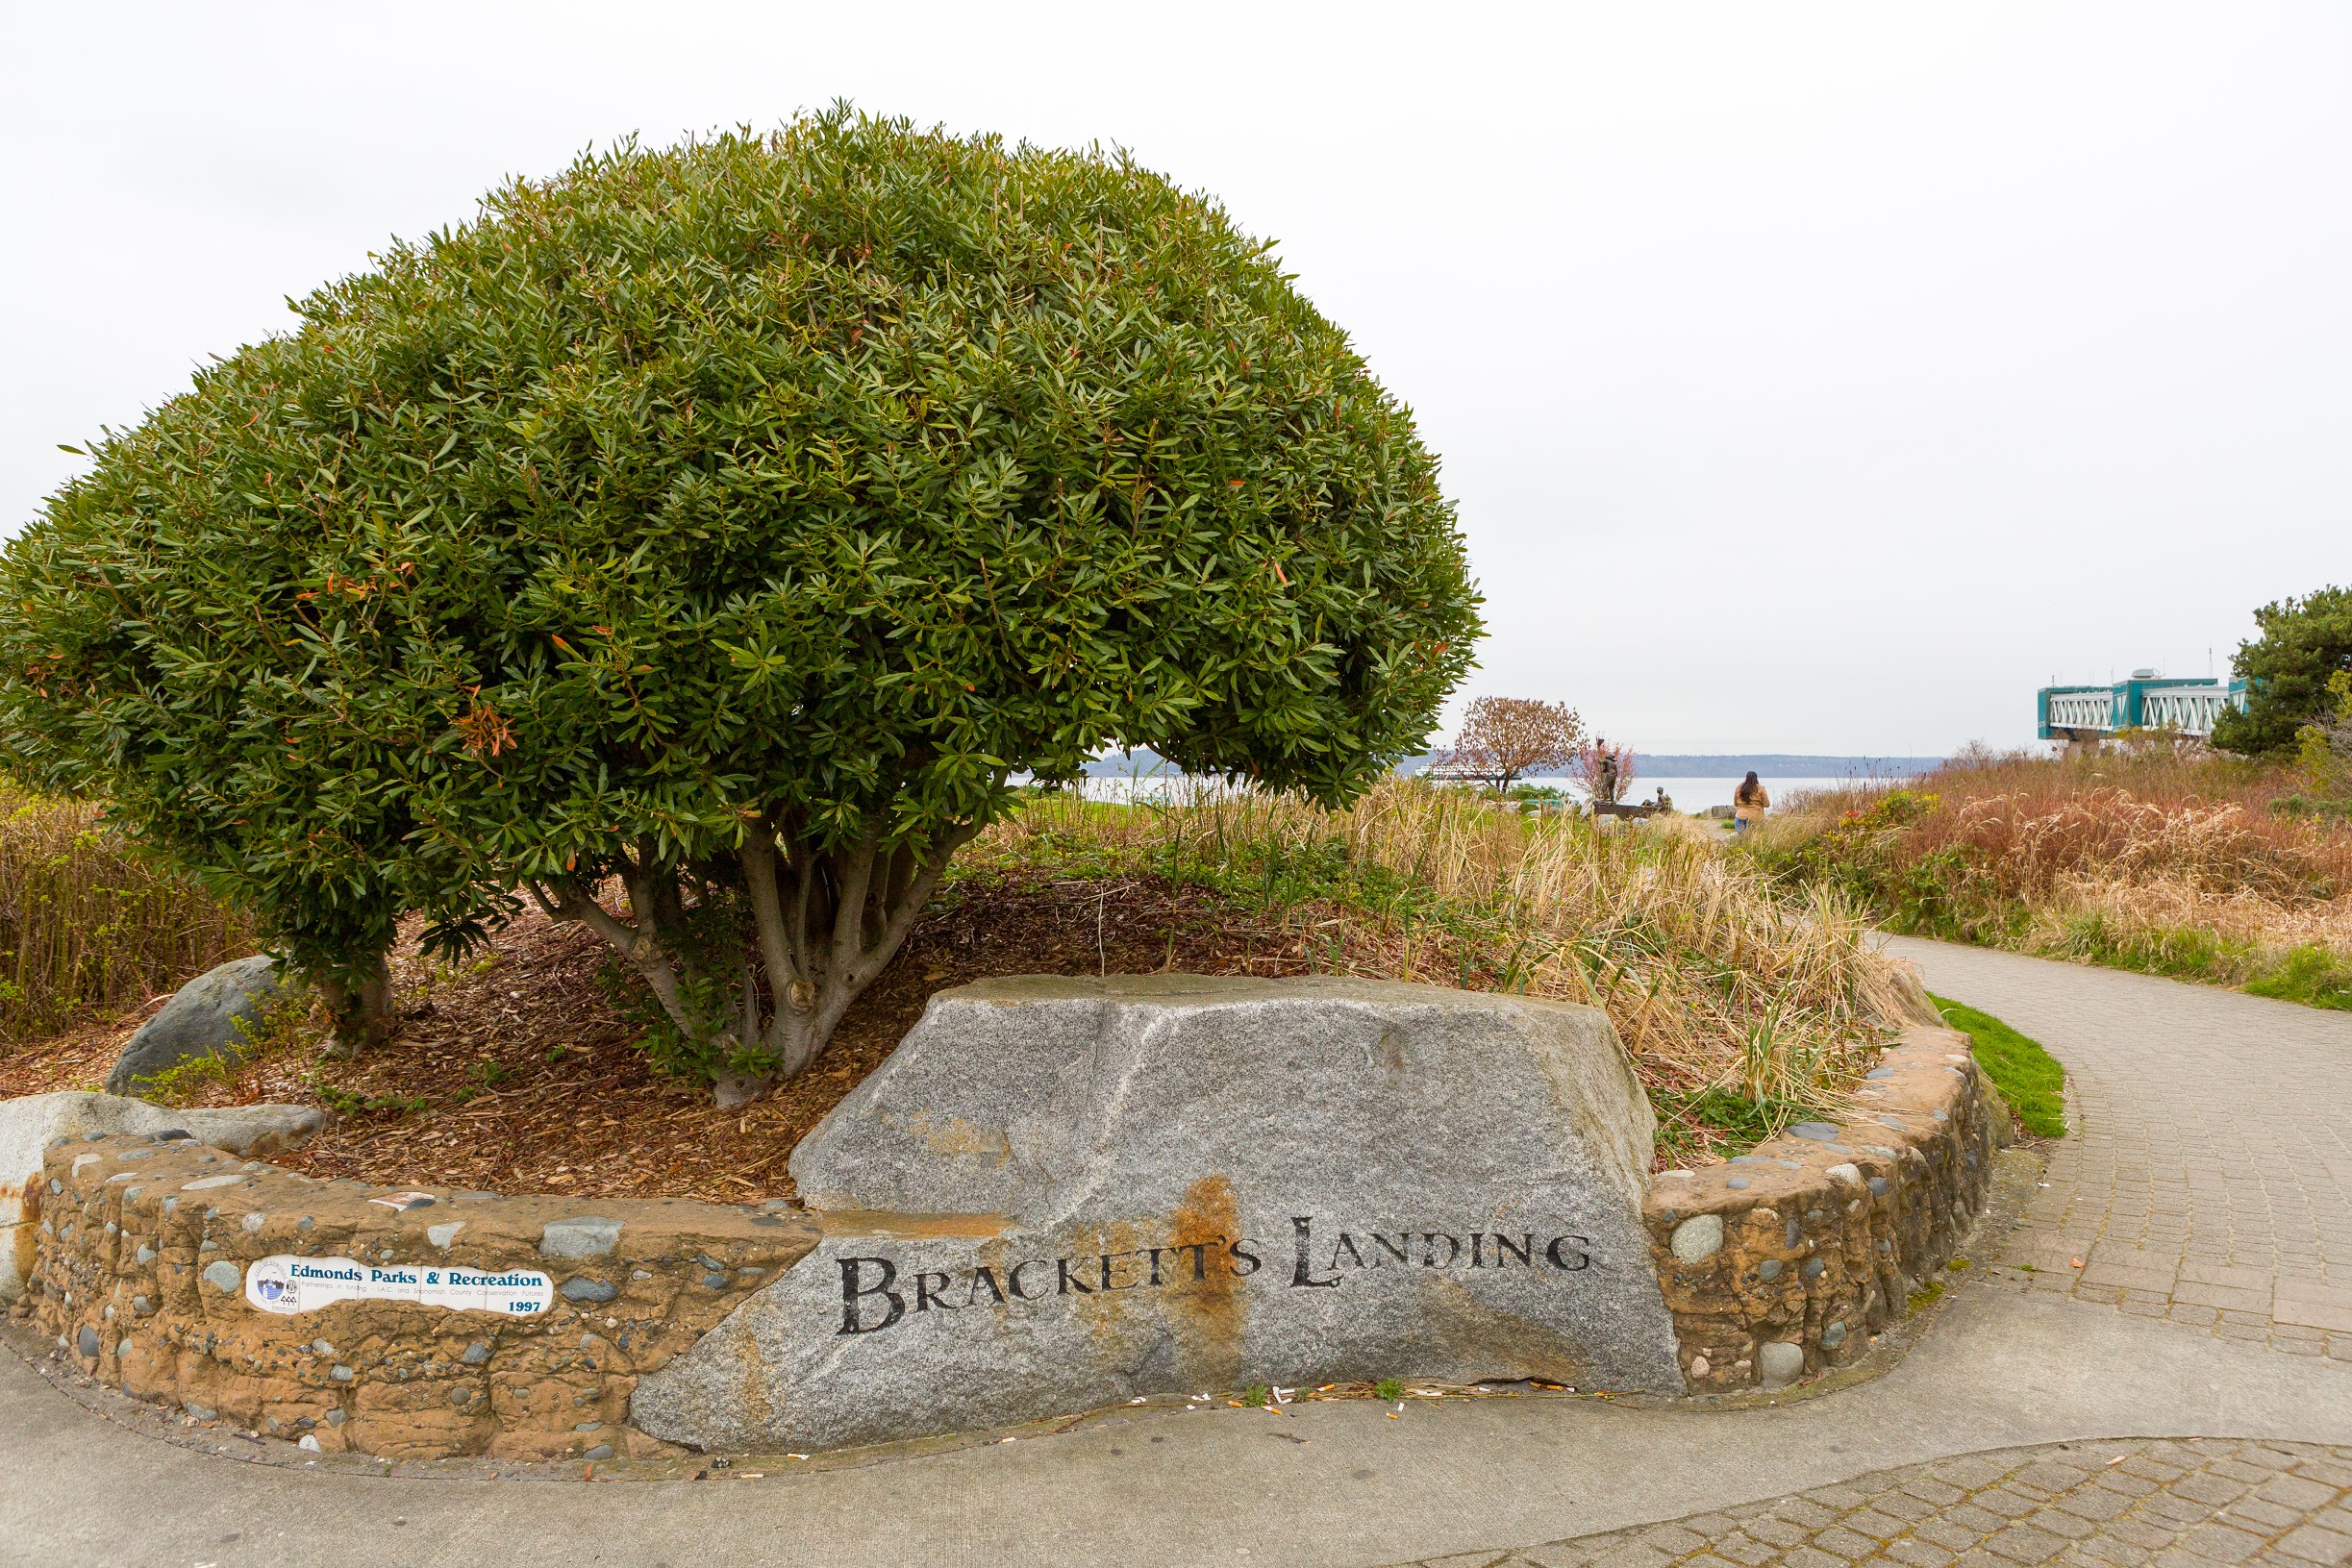 Brackett’s Landing South & Brackett’s Landing North
- Backett’s Landing North: 50 Railroad Ave N
- Backett’s Landing South: 100 Railroad Ave S
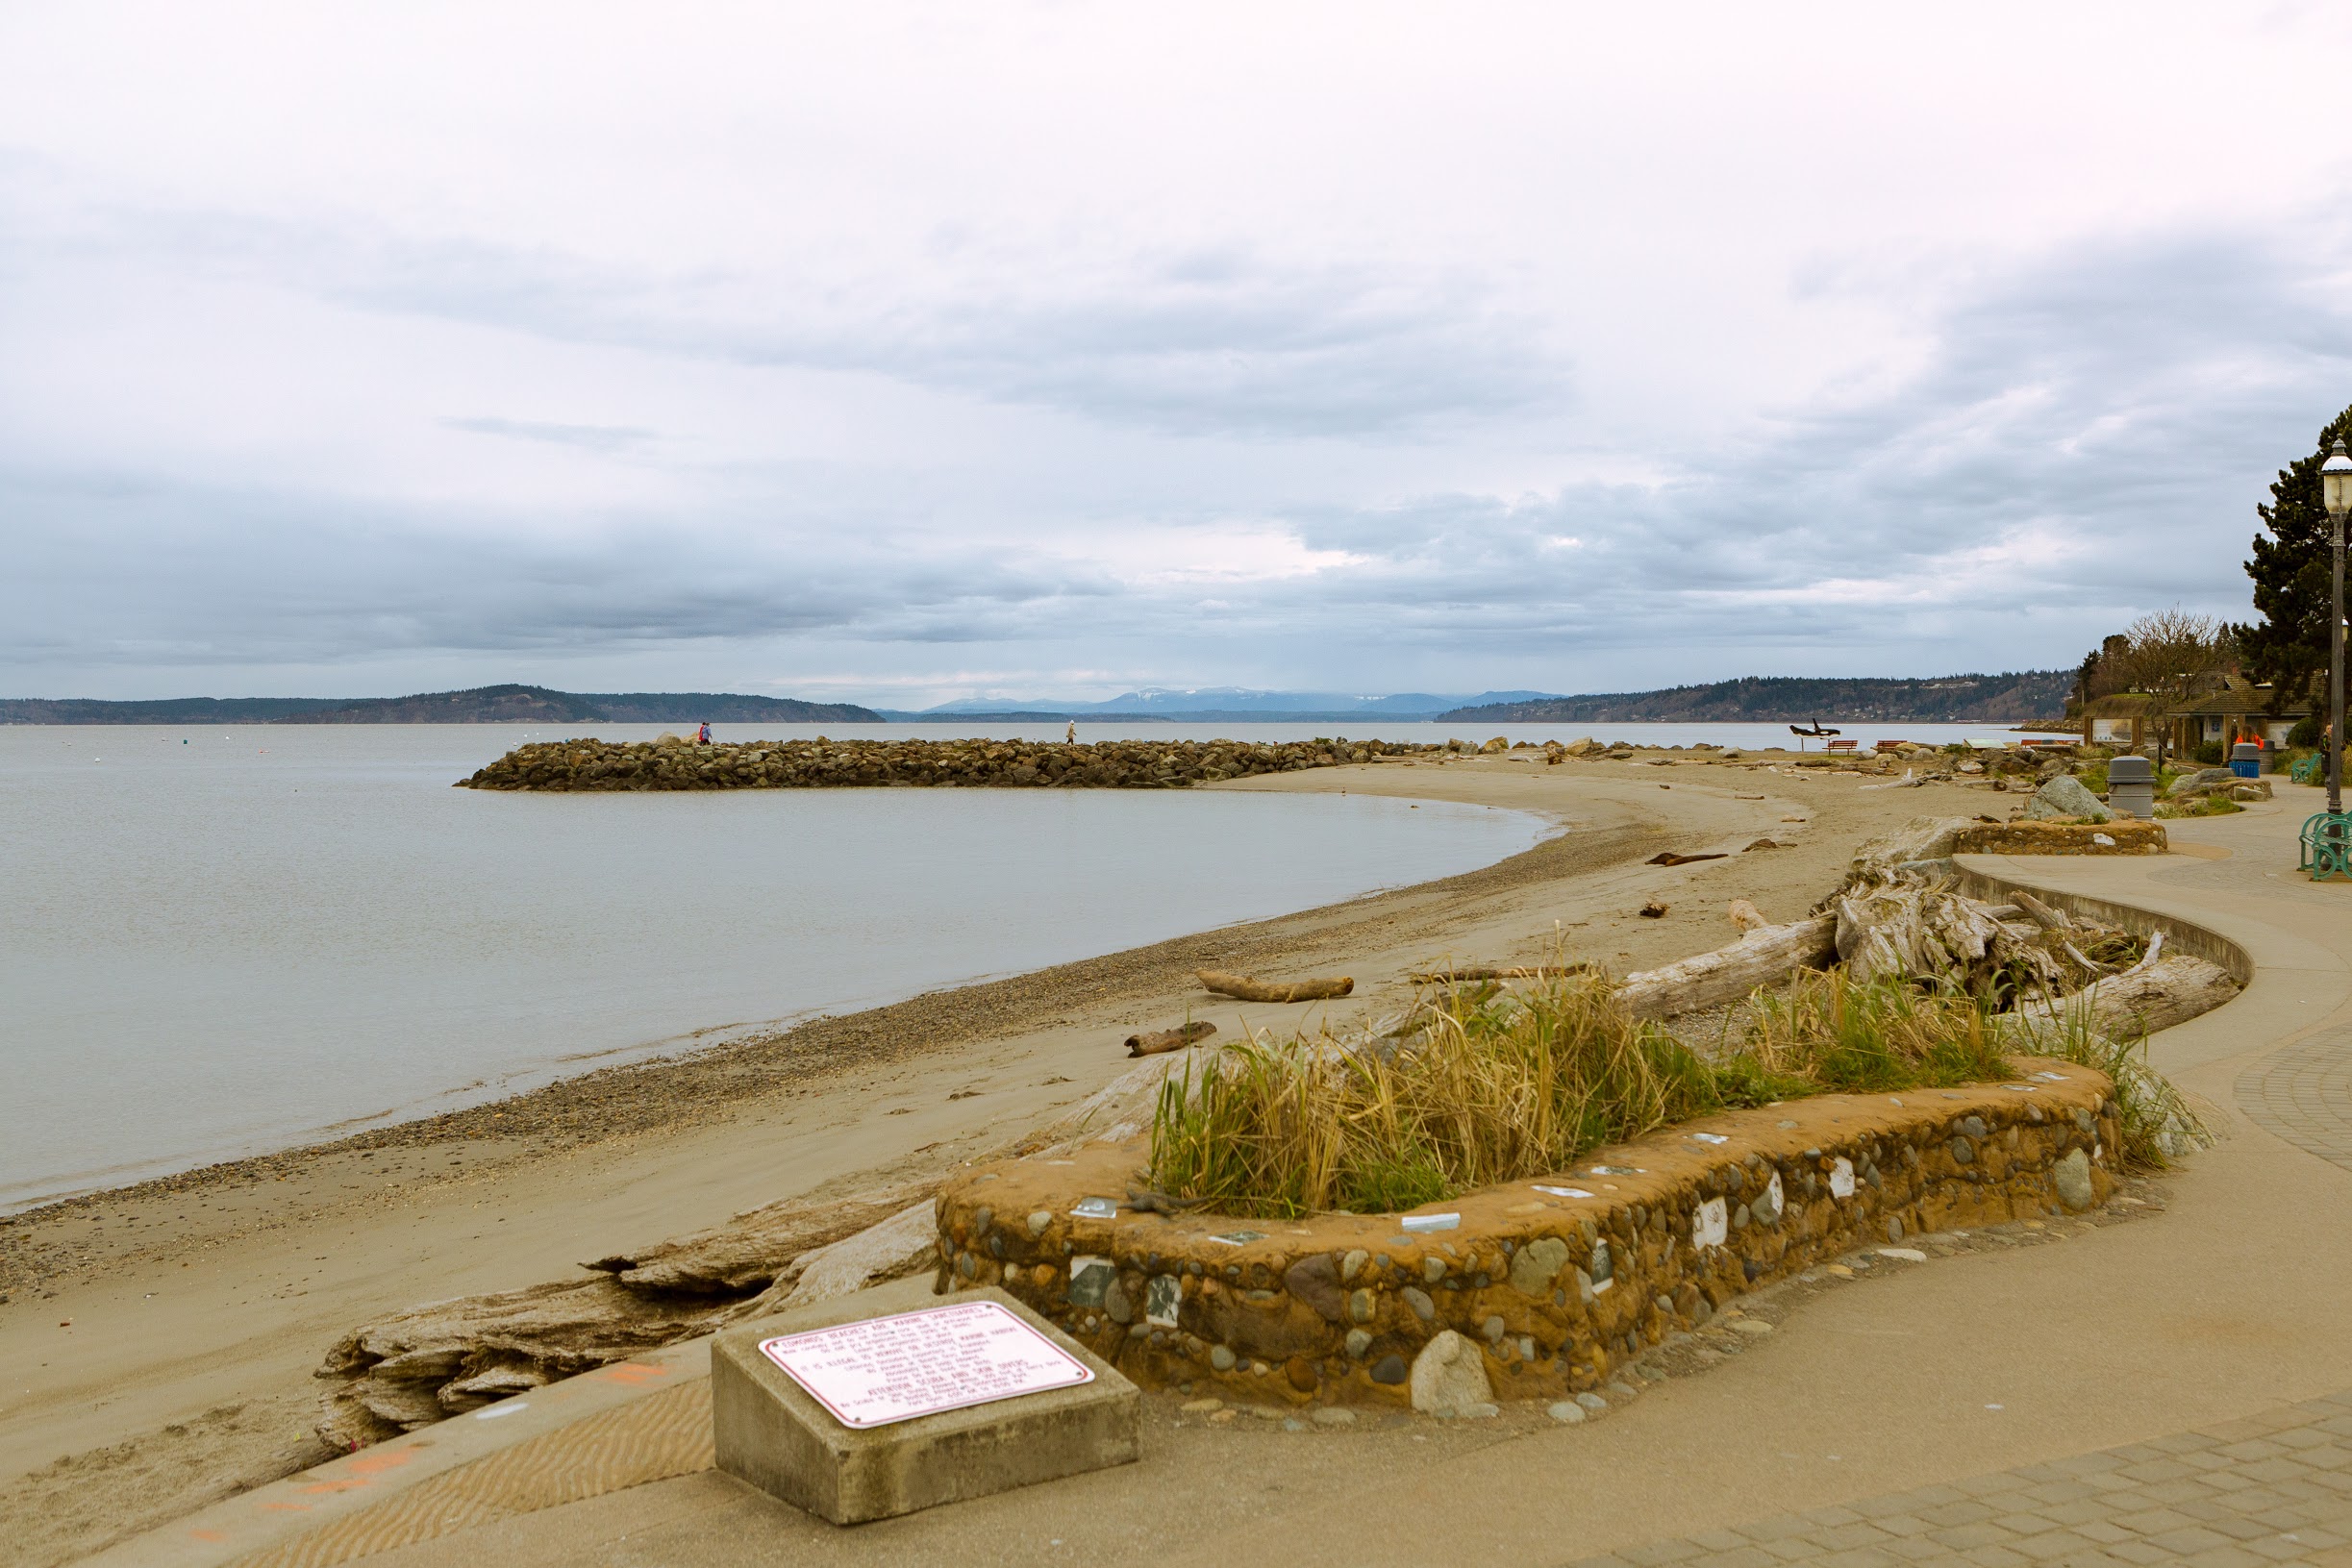
Located on either side of the Edmonds/Kingston Ferry Dock, Brackett’s Landing South and Brackett’s Landing North are both popular destinations! These locals have some excellent tips on how to make the most of this beautiful setting:
“We love to play in the saltwater and build sandcastles with our preschooler on the sandy beach at Brackett’s Landing. Watching the coming and going of the ferries and trains nearby adds to his delight. On an especially warm day, we’ll head home via Canarino Gelato for cones. Beach and gelato—what more could a kid, or one at heart, ask for?!” – REALTOR® Claudette Meyer
“My kids and I love to collect sea glass along Brackett’s Landing and then have dinner at Anthony’s Beachfront Cafe and watch the ferries come and go.” – REALTOR® Andrea Wetzel
“Walking the beaches is a favorite thing to do—especially on those rare, sunny days. When the sun is out, it is a blessing to live so close to the coast with all its beauty. Storm watching from Sunset Ave is a great way to take a break and refresh!” – REALTOR® Barbara Clark
“The annual polar plunge on New Year’s Day that takes place at Brackett’s Landing is a super fun community event. [You can also] stroll along the waterfront where you can pop into the Beach Cafe for a bit and watch the boats go in and out of the Marina.” – Windermere North Owner Lena Wood Maul
Edmonds Underwater Park
Part of Brackett’s Landing North include the Edmonds Underwater Park, an incredible expanse of 27 acres of tide and bottom lands. There are features and trails developed especially for divers, and about 25,000 scuba divers visit and take advantage of this park each year!
Marina Beach Park (Including Off-Leash Area Edmonds)
Located at 470 Admiral Way Edmonds, WA
Marina Beach Park is brimming with things to do and see! Stunning views of the water and mountains set the gorgeous scene, and there’s a playground, picnic tables, a loop trail, open turf area, volleyball net, restroom, a car top boating launch, and even a special off-leash dog area at the south end of the park! “There is a great off-leash dog park just beyond the Marina that is a great place to let your four-legged friends run and play,” shares Lena Wood Maul.
Heading to this park with your pup? REALTOR® Casey Bui has an extra tip for you: “For dog owners, the Harbor Square complex down on the waterfront also houses Blue Collar Dog House, a dog sitting business that also offers grooming and training. It’s a nice complement to the off-leash dog park at Edmonds’ Marina Beach.”
Edmonds City Park
Located at 600 3rd Ave S, Edmonds, WA 98020
Offering about 10 acres of park-like space, this Edmonds gem is brimming with top-notch outdoor amenities! A spray park, playground, ballfield, gazebo, fire pits, trails, picnic tables, and more await. Plus, leashed dogs are allowed in the southeast wooded area of Edmonds City Park.
Meadowdale Beach Park
Located at 6026 156th St SW, Edmonds, WA 98026
Spanning a generous 108 acres, Meadowdale Beach Park is home to an old forest, a scenic stream that leads to the Puget Sound, and lovely beaches. This park is a popular spot to observe wildlife from, whether you’re enjoying the forest or spending time down by the water. Plan your trip here!
Hickman Park
Located at 23700 104th Ave W Edmonds, WA
This expansive park is ready for playtime! Beautifully maintained and a joy to spend time in, this park features a trail that winds through a wooded area, a picnic shelter, basketball court, restroom, playground, baseball field, and more. Plus, leashed dogs are allowed on the paths at Hickman Park.
Pine Street Playfield
Located at 6th and Pine Street Edmonds, WA
“Pine Street Playfield is simple but does have a little league ball field,” shares Casey Diep Bui. This smaller park is perfect for a sunny picnic and a day spent playing on the playground! Pine Street Playfield’s residential setting makes it a lovely spot to head to with little ones.
Lyndale Park
Located at 18927 72nd Ave W, Lynnwood, WA 98036
While this park is technically in next door Lynnwood, it’s too good not to mention! Boasting over 30 acres of beautiful outdoor space, this park includes a native forest, several sport fields and courts (including baseball fields, a soccer field, 4 tennis courts, basketball courts), play equipment, a skate park, walking trails, an amphitheater, an off-leash dog area, and more! Plan your trip here!

5 Gorgeous Home Listings in Edmonds (Don’t Miss Out on the Water Views!)
Interested in living in Edmonds? Whether you’re searching for a condo or a spacious luxury retreat, Edmonds offers homebuyers a wide variety of real estate to choose from. You can find everything from mid-century beauties to new construction, and many homes even come with fabulous views of the shimmering Puget Sound!
These 5 single-family home listings all show off some of Edmonds’ lovely current real estate listings—take a moment to explore each one:
1. Vacation-Worthy 4-Bedroom, 3.5-Bath Masterpiece w/Elevator, 1,000-Bottle Wine Cellar, & Stunning Views

- Located at 540 Holly Dr Edmonds, WA 98020
- Listed for $1,400,000
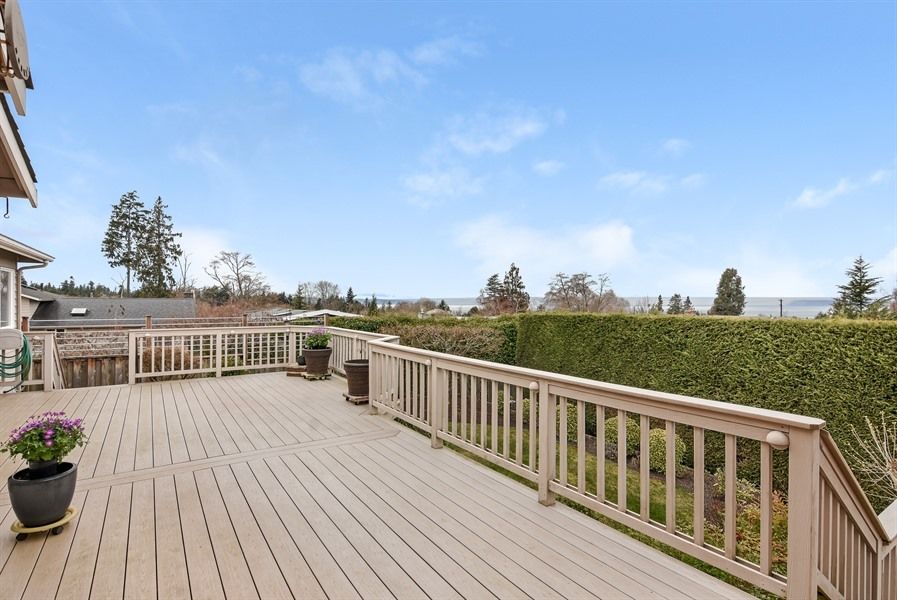
This gorgeous 2003-built custom home is tucked away on a rare private lot just steps away from 5th Ave! Whether you’re relaxing outside on the expansive deck or enjoying a cozy fire in the living room, this home offers captivating views of the shimmering sound and majestic mountains in the background. Click here to take a tour of this one-of-a-kind 3,939-square-foot home!
Would you like to learn more about this home or living in Edmonds? You can contact Barbara Clark at bclark@windermere.com or give her a call at (425) 218-2754!
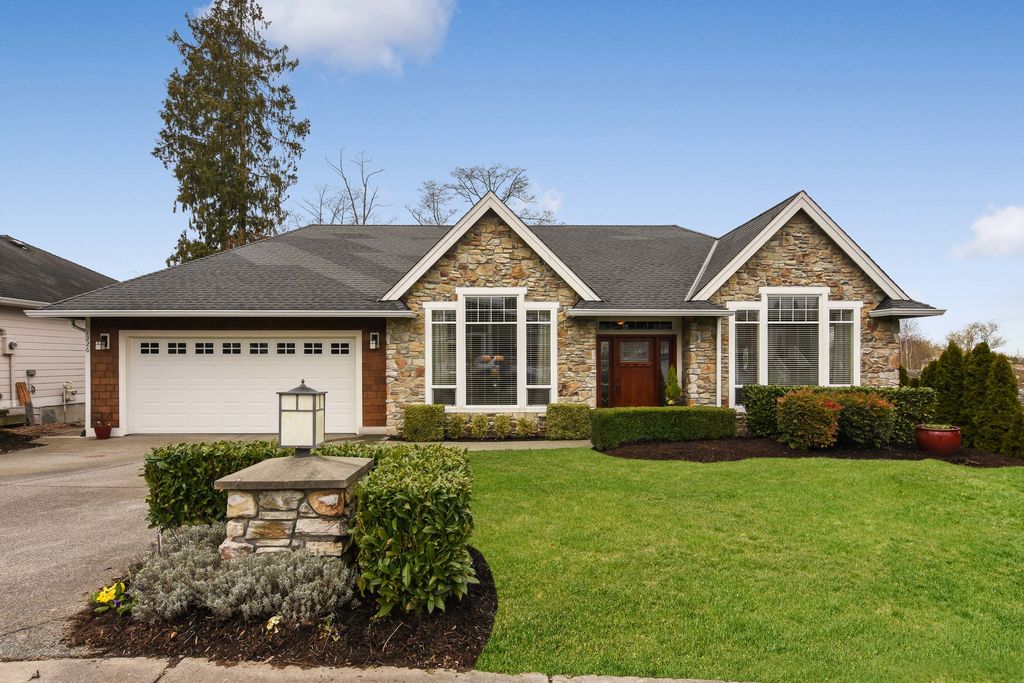
- Located at 1226 7th Ave S Edmonds, WA 98020
- Listed for $750,000
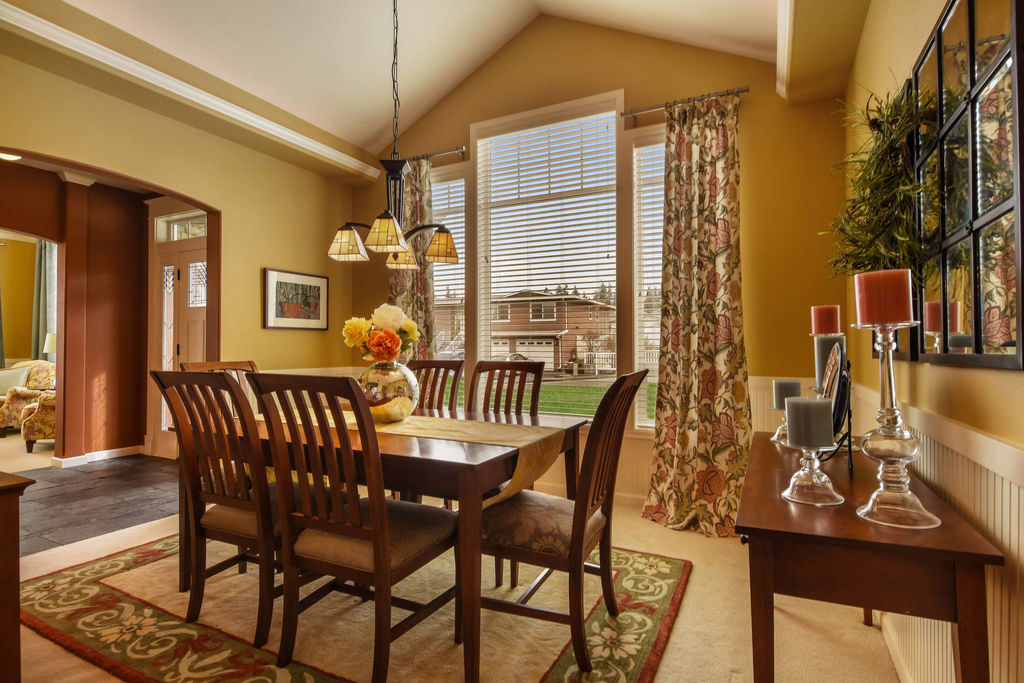
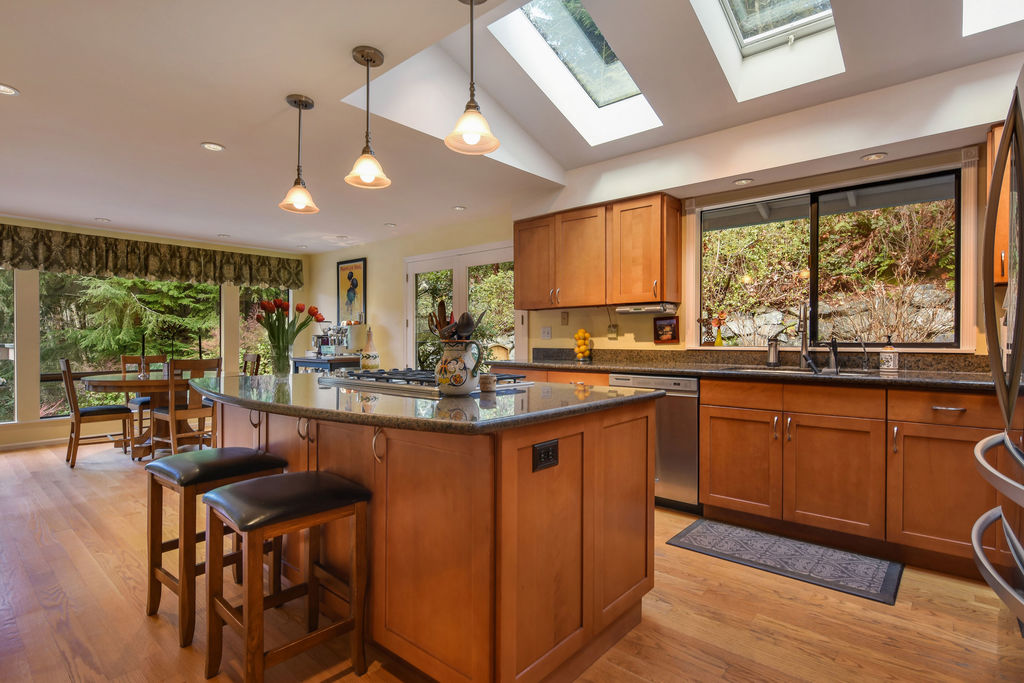
Beautifully maintained, this pristine, magazine-worthy residence offers exquisite style alongside premium amenities. Discover a fabulous 3,336-square-foot floorplan that includes an incredible master retreat, a private deck, a spa-like bath, and much more. This home is also in a highly desired location, just blocks to parks and less than 1 mile to Downtown Edmonds’ shops, restaurants, pubs, and other attractions.
Would you like to learn more about this home or living in Edmonds? You can contact Melody Benton at melodybenton@windermere.com or give her a call at (206) 948-9080.
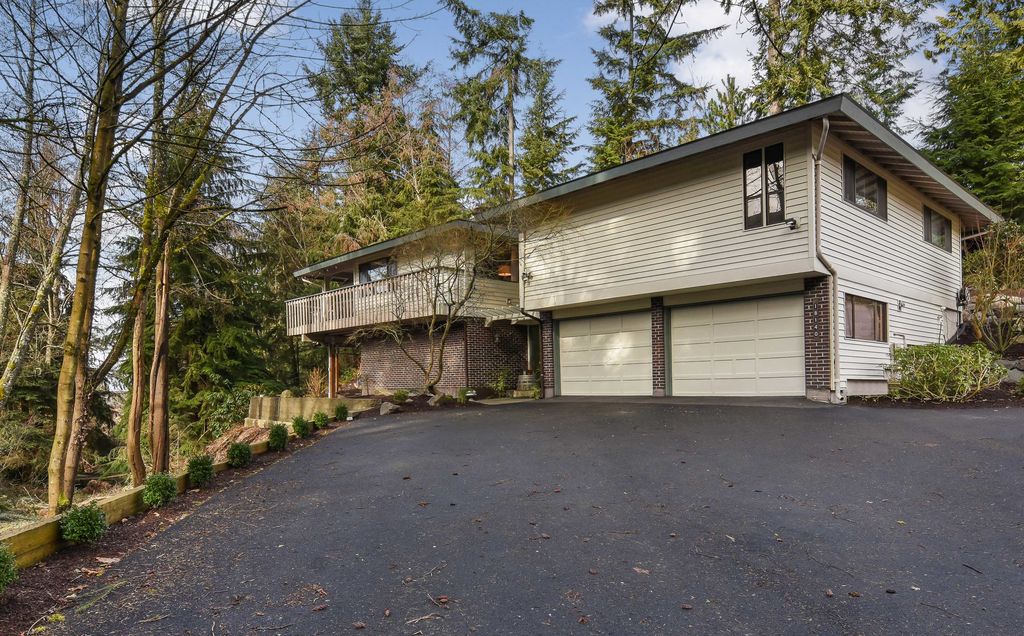
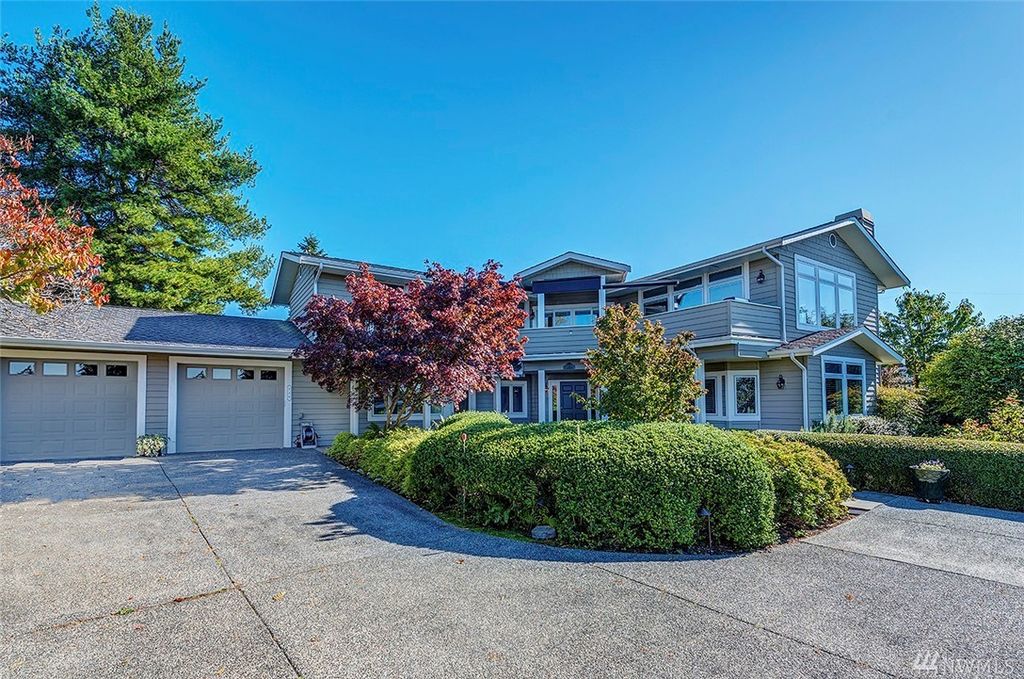
- Located at 18140 84th Ave W Edmonds, WA 98026
- Listed for $695,000
Showing off top-notch craftsmanship throughout, this 2,320-square-foot beauty features a spacious layout and thoughtful details in each room! Enjoy a sun-drenched kitchen, fireplaces in each common room, remodeled bathrooms, a multi-level deck, garden spaces, a circle driveway, and much more.
Would you like to learn more about this home or living in Edmonds? You can contact Casey Bui at CaseyBui@windermere.com or give him a call at (206) 234-5611.
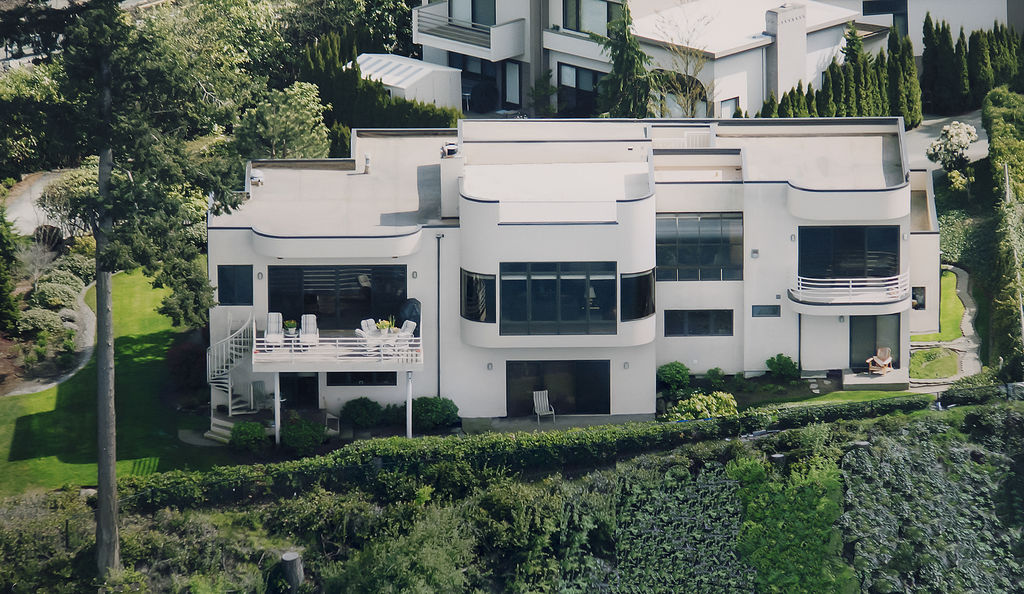
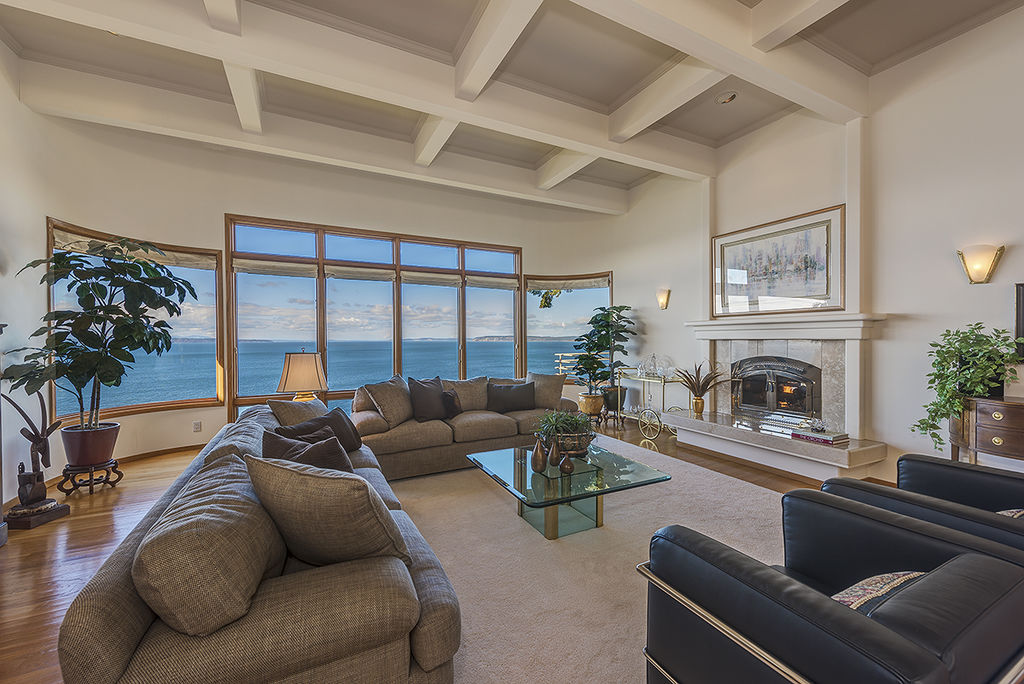
- Located at 9233 Olympic View Dr Edmonds, WA 98020
- Listed for $2,195,000
Discover graceful Streamline Moderne architecture with this 4,842-square-foot masterpiece! This rare waterfront residence offers jaw-dropping views of the Sound and Olympic Mountains from nearly every room. Whether you’re entertaining a house filled with guests or simply enjoying quiet time in this vacation-worthy space, this home offers a truly fabulous lifestyle, all while being just 2 miles to the heart of Edmonds!
Would you like to learn more about this home or living in Edmonds? You can contact Barbara Clark at bclark@windermere.com or give her a call at (425) 218-2754!
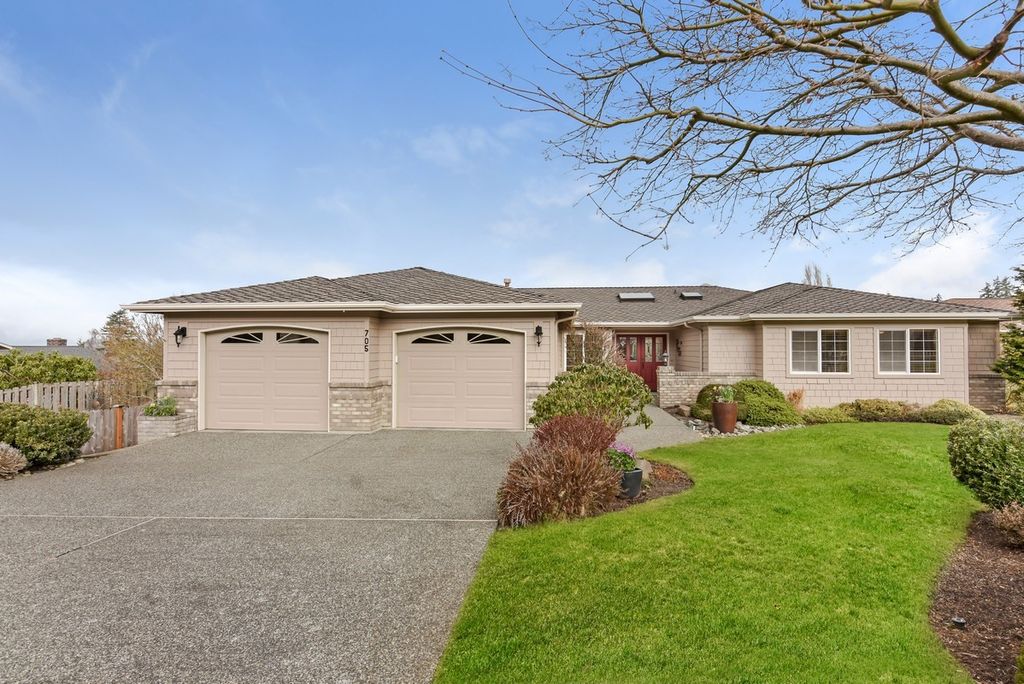
- Located at 705 Birch Place Edmonds, WA 98020
- Listed for $970,000
Wonderfully move-in ready, this expansive 2,660-square-foot gem offers ultimate comfort and convenience! Located just blocks to downtown and boasting Sound and Mountain views, this gorgeous haven is ready for entertaining. This home’s huge master suite, palatial deck, and light-filled kitchen are especially of note.
Would you like to learn more about this home or living in Edmonds? You can contact Melody Benton at melodybenton@windermere.com or give her a call at (206) 948-9080.
Click here to keep exploring Edmonds real estate!
Does it Make More Sense to Rent… or Own?
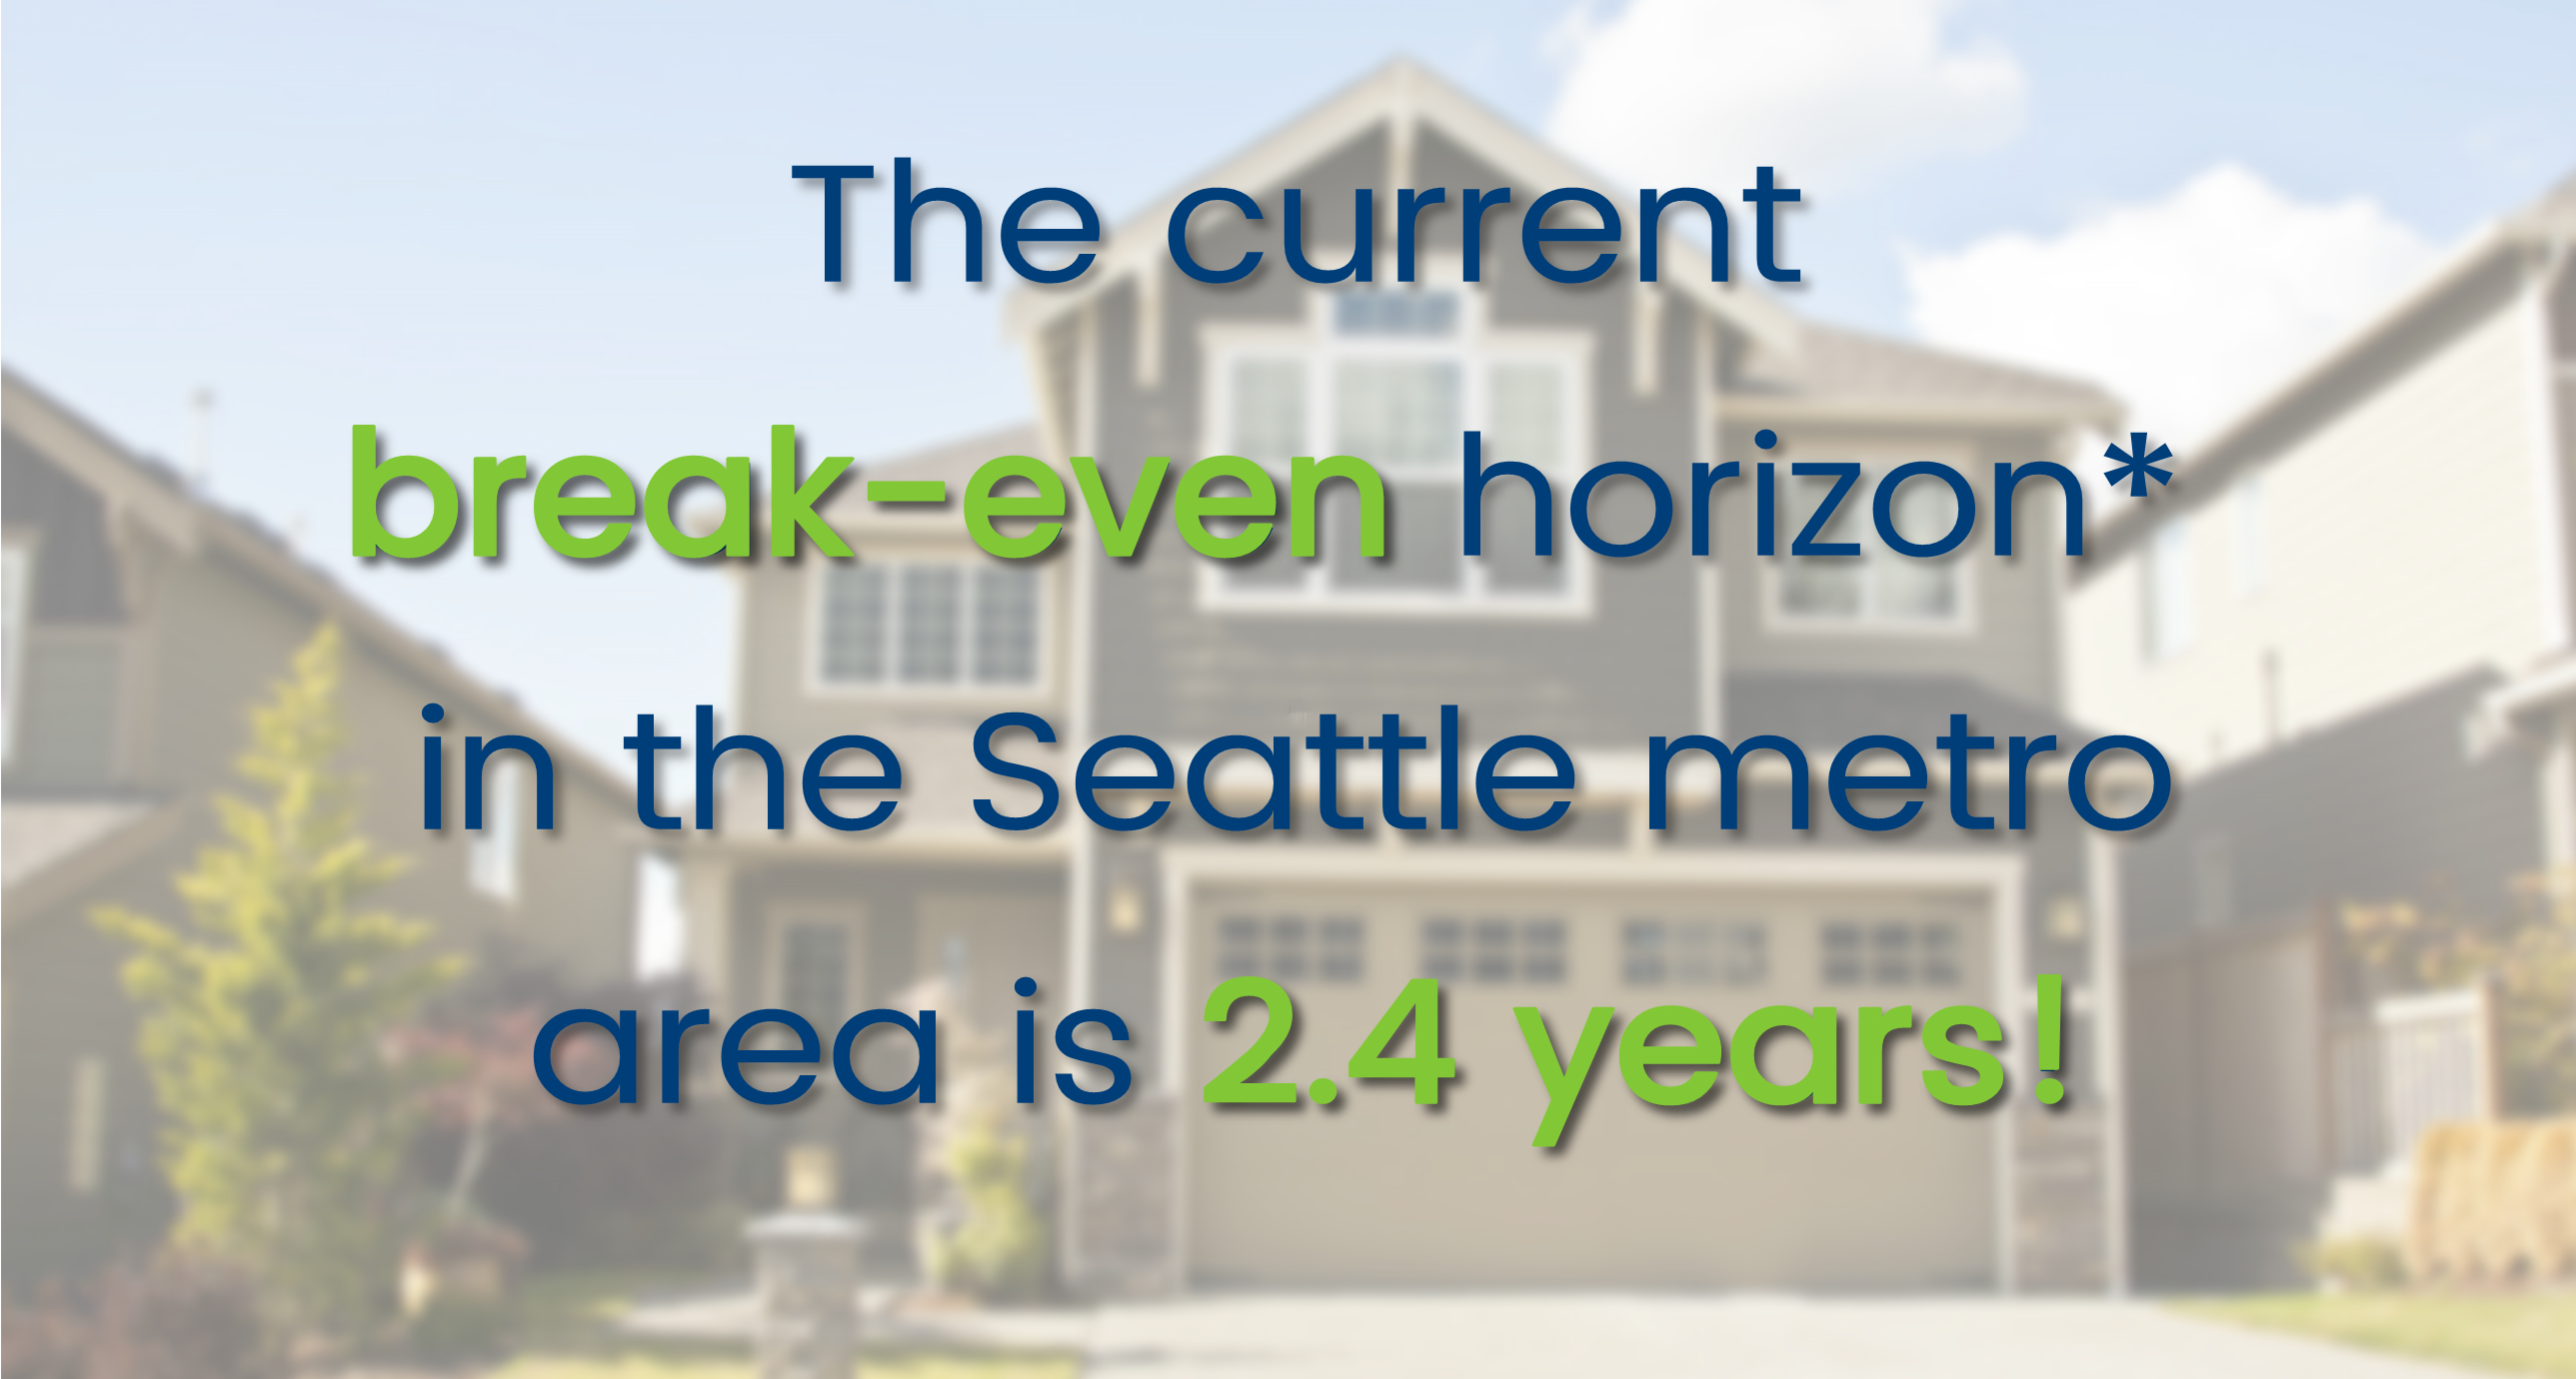

*The amount of time you need to own your home in order for owning to be a superior financial decision.
With Seattle’s robust job market and high housing costs, there has been a lot of talk lately about the cost of living in the Greater Seattle area. In fact, Seattle is now the 5th most expensive city to rent in the country according to a new study from Nested.com. The average monthly rental price for a one bedroom apartment in the city of Seattle is $1,790 according to Zumper.com, up 8.5% year-over-year; and a two bedroom is $2,470, up 6% year-over-year! With rising rental rates, still historically low interest rates, and home prices on the rise, the advantage of buying versus renting has become clear for folks who have a down payment saved, good debt-to-income ratios and strong credit. Currently, the breakeven horizon (the amount of time you need to own your home in order for owning to be a superior financial decision vs. renting) in the Greater Seattle area is 2.4 years according to Zillow research.
An additional study by Nested.com outlines the monthly rental costs for a single person or a family of four, as well as the yearly income required. In Seattle, it costs the average single person $1,288.76 a month to rent, which requires an annual income of $53,328.00. The average family of four costs $2,665.34 for monthly rent, and an annual income of $101,186.48. That is a lot of money one would be paying towards someone else’s investment.
 There are several factors to consider that will lead you to make the best decision for your lifestyle and your financial bottom line. One of the biggest factors is interest rates! Currently, the rate for a 30-year fixed, conventional, conforming loan is hovering around 4.25%. That is amazingly and historically low, making the advantage of securing a mortgage huge. What is nice about having a mortgage is that the payment stays the same over the term of the loan. With renting, rates can be increased at any time, and you are paying down someone else’s asset, not your own. Owning gives the homeowner control over their overhead while getting to make their house their home. What is also so great about owning, is that once you have hit the breakeven horizon, every month that ticks away thereafter is building your nest egg in value. The long-term benefits of owning are abundant, including the stability of not being asked to move. These are important factors to consider for everyone, but especially the younger folks who are enjoying the benefits of Seattle’s attractive job market.
Where folks are having to compromise most due to affordability is commute times, and settling in less urban neighborhoods. Worth pointing out, is the average home price in South Snohomish County is 46% less than Seattle Metro – that is a huge savings! Some people, mainly millennials, have not been willing to give up living in the more core urban neighborhoods that have high walk scores and shorter commute times. That should be apt to change as rents are rising fastest in those areas. The advantages of moving out a little further and securing a home will start people on the track of building long term wealth.
If you or anyone you know is currently renting and is considering a change, please let us know as we would be happy to get their questions answered to help them make an informed decision.
Unique Ways to Stay Active in Bothell: Bike Trails, Trampolines, & Water Sports
Feeling a bit tired of heading to the gym as usual? Need some inspiration? Staying fit and healthy doesn’t have to be boring, and luckily for Bothell residents, there are plenty of unique ways for staying active!
While Bothell is definitely home to some great gyms (Jen Bowman recommends Orange Theory and Fusion Hot Yoga in Canyon Park for major calorie-burning workouts!), we also recommend checking out these other options for something that’s extra fun, entertaining, and active:
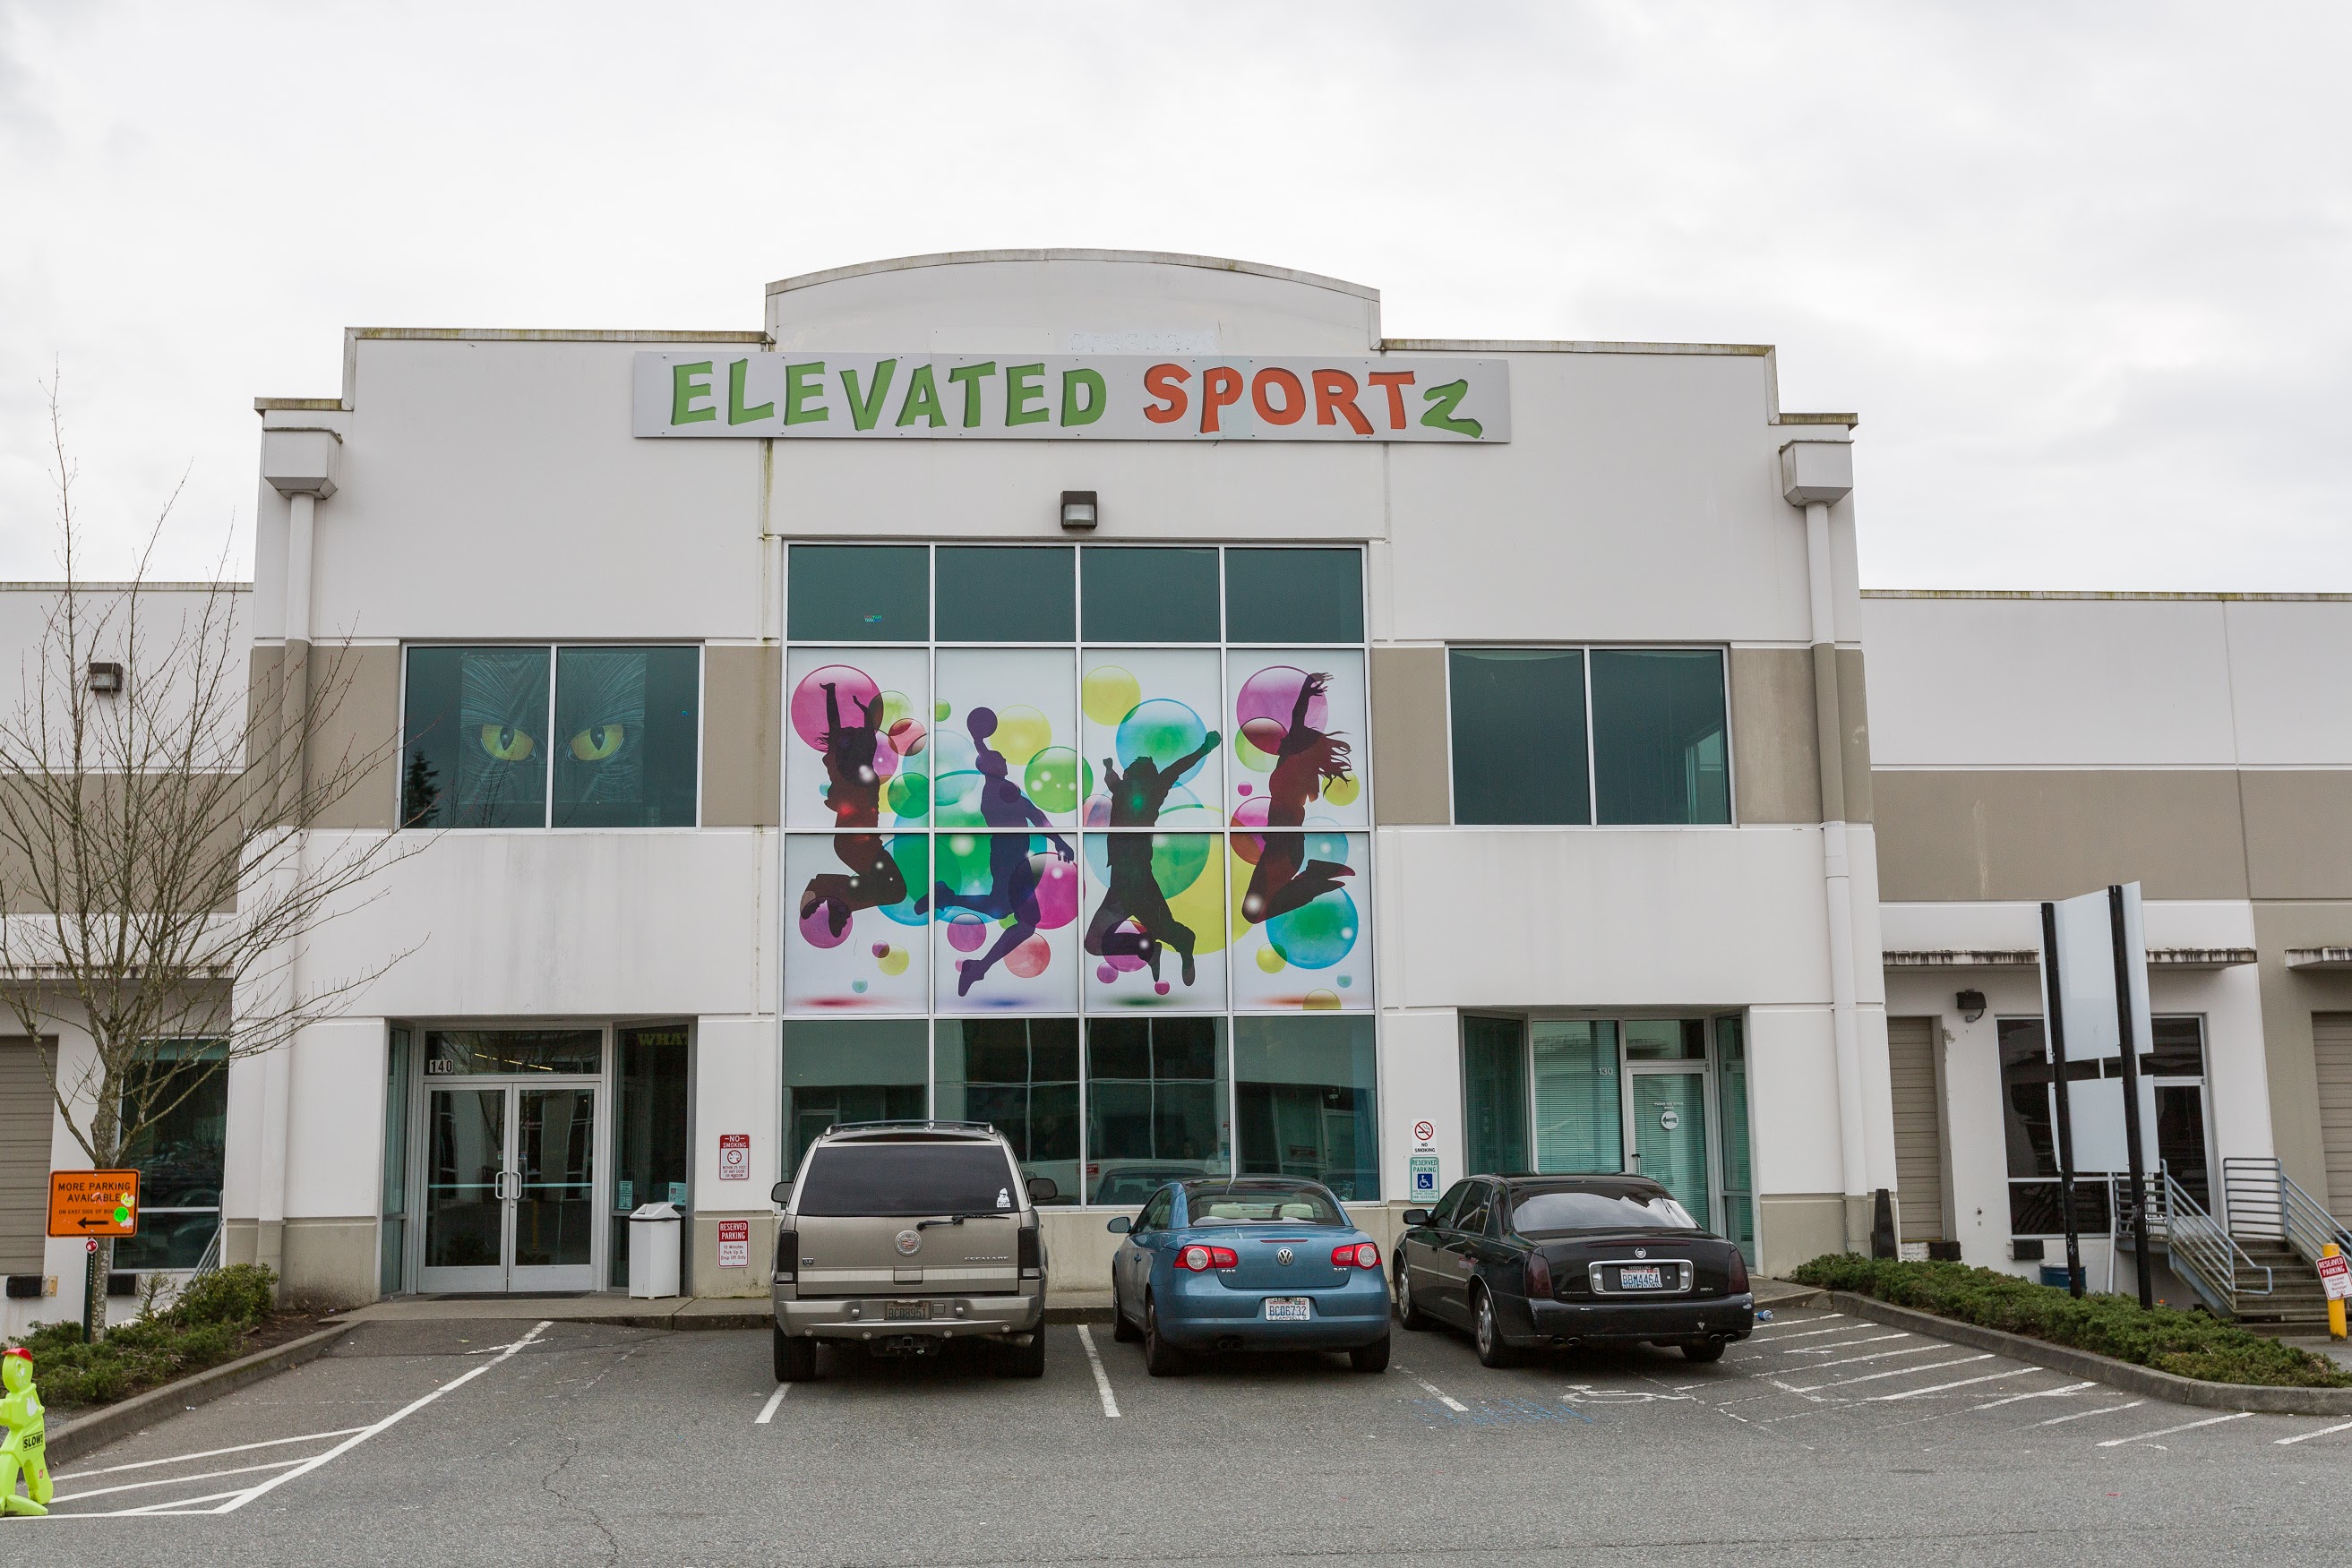
Elevated Sportz
Located at 18311 Bothell Everett Hwy Suite 140, Bothell WA 98012
“Elevated Sportz in North Bothell is the best rainy day exercise you can get,” says Jen Bowman. “Their weekly schedule offers variety of activities for kids and adults. Trampoline dodgeball anyone? They have a food counter where you can fuel up, too. Even better yet, NO MEMBERSHIP required. My toddler loves the daily 10am-12:30pm Hoppy Hour in the three level Adventure Zone that’s perfect for little kids to explore and play in a padded environment!”
Kids and adults alike love Elevated Sportz, and their dynamic range of offerings ensures there’s always something new to check out! In addition to the events that Jen mentioned, Elevated Sportz hosts a Lazer Club Night for teens, an all-ages Cosmic Night laser party, Lazer Maze Challenge, homeschool meetups, Special Needs days, and more! Plus, you can host birthday parties, team parties, or even rent out the entire facility for your special event.
Check out pricing and take a look at the different play areas offered here.
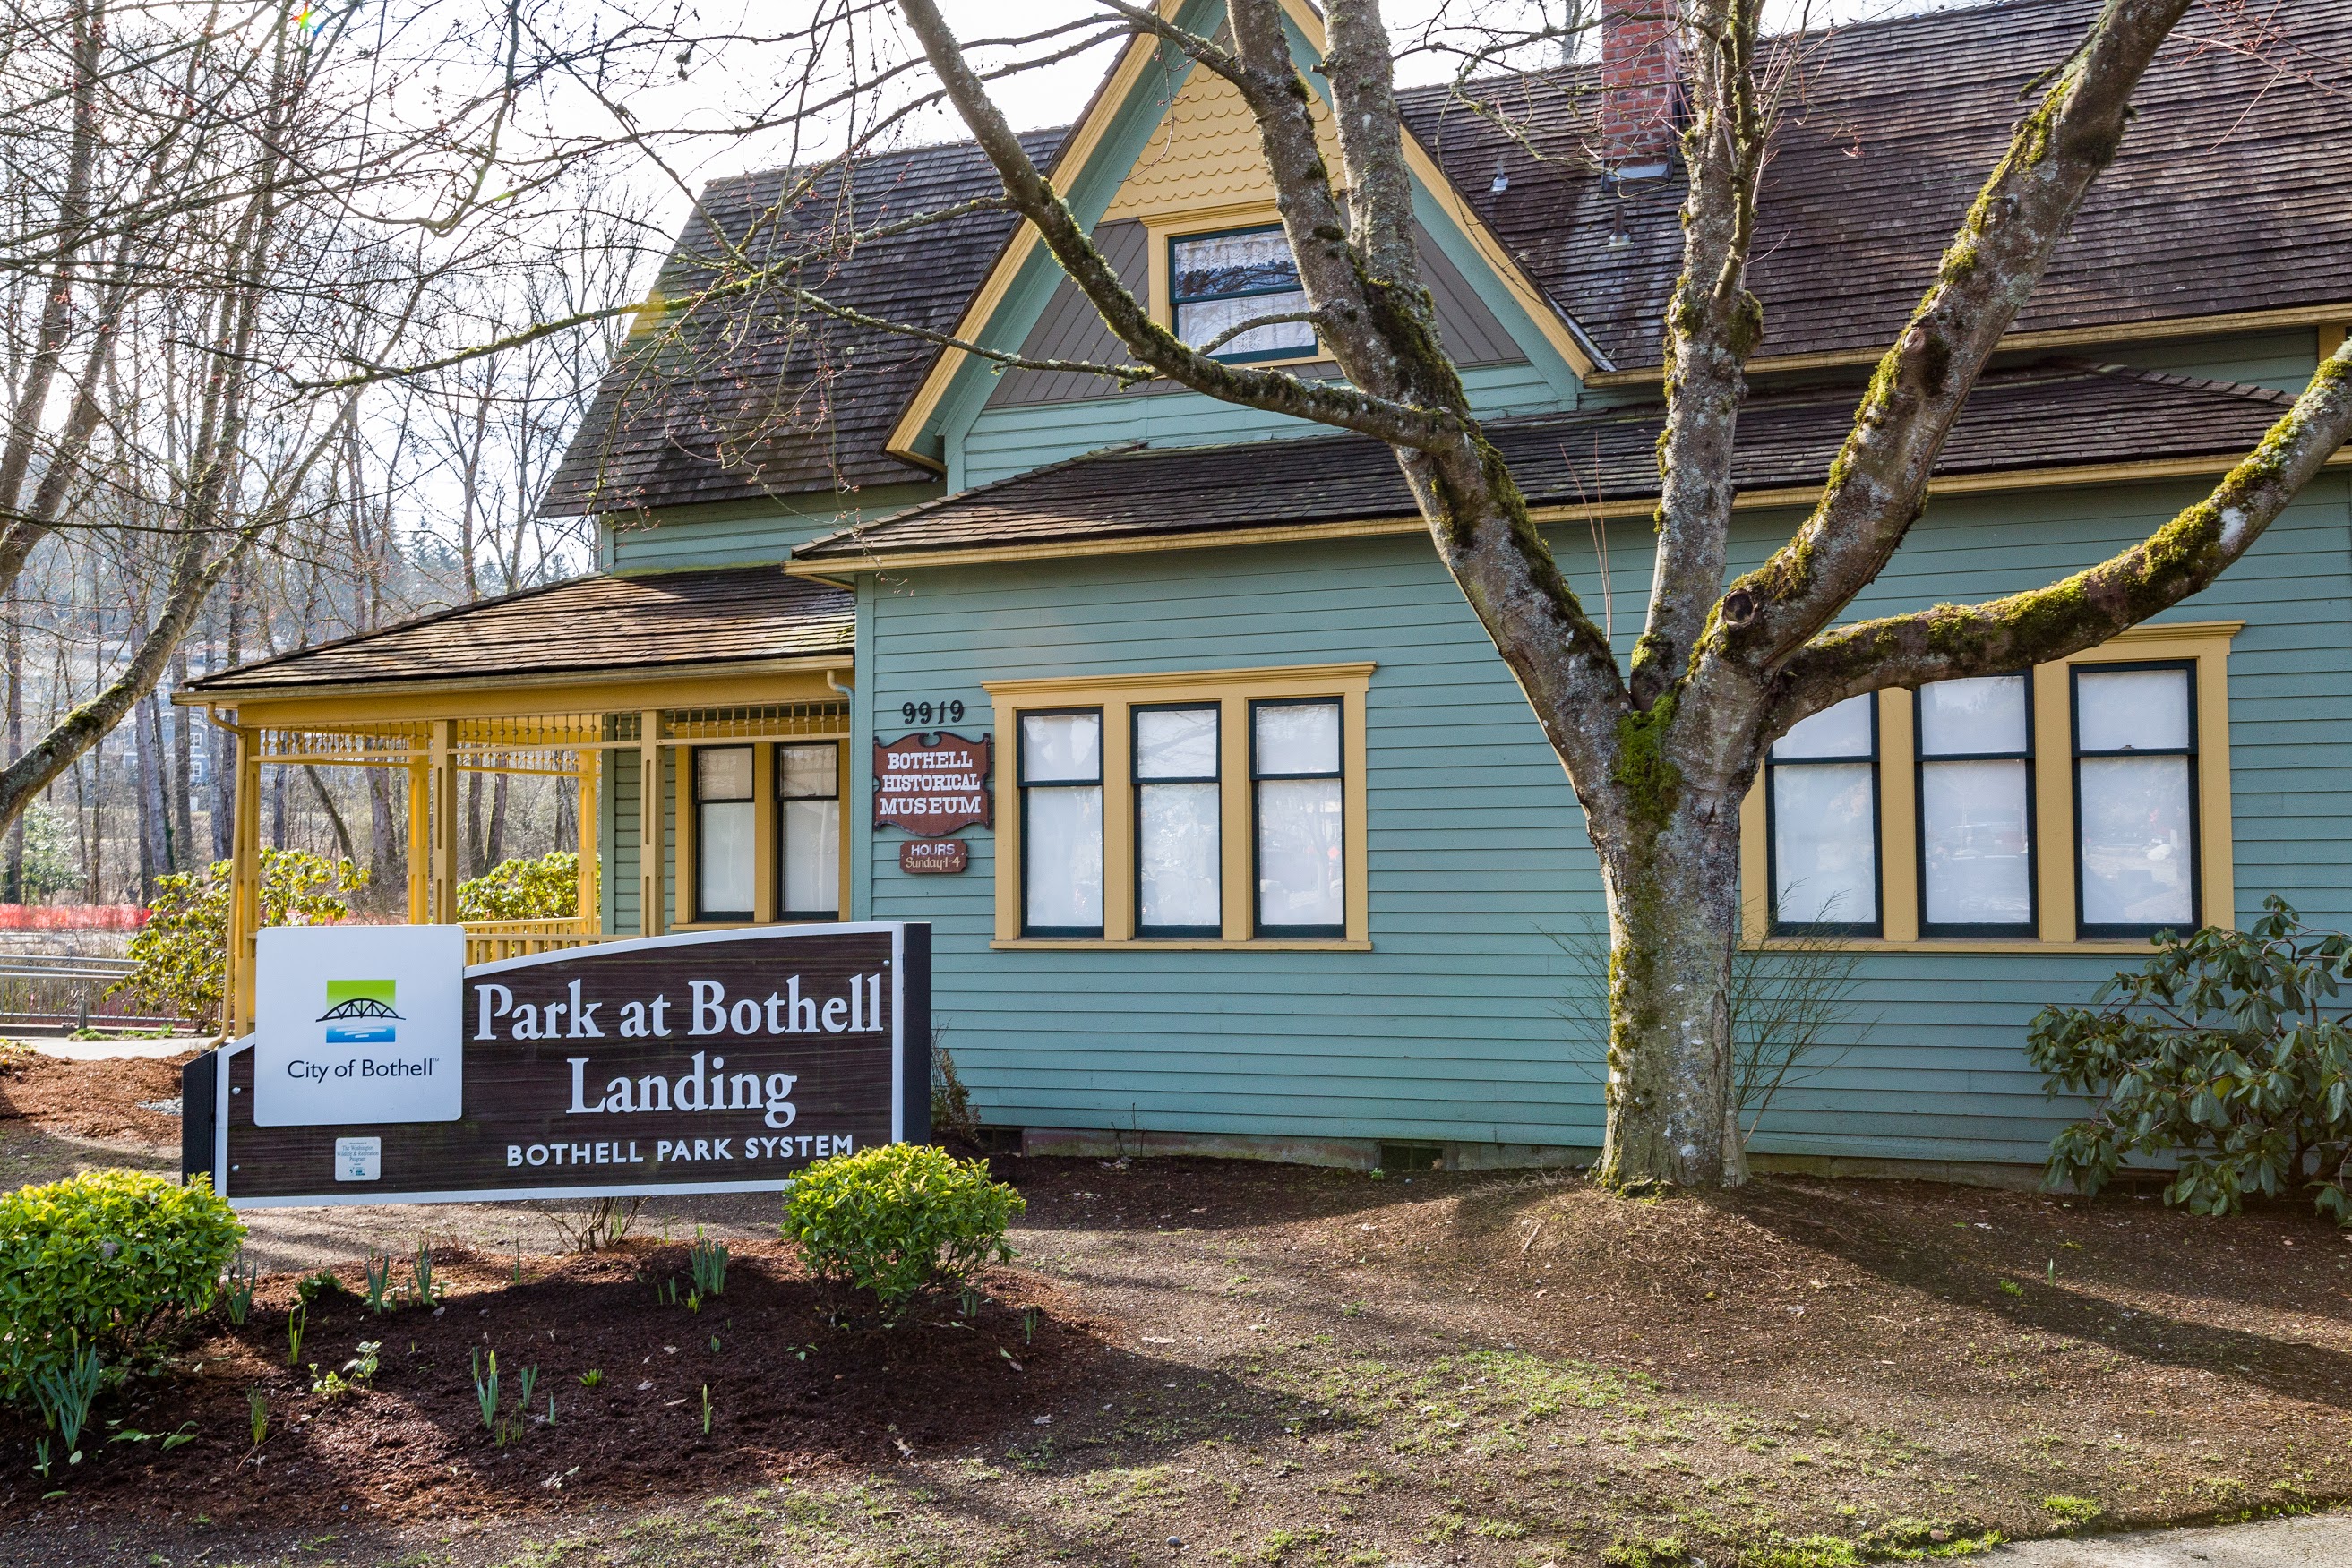
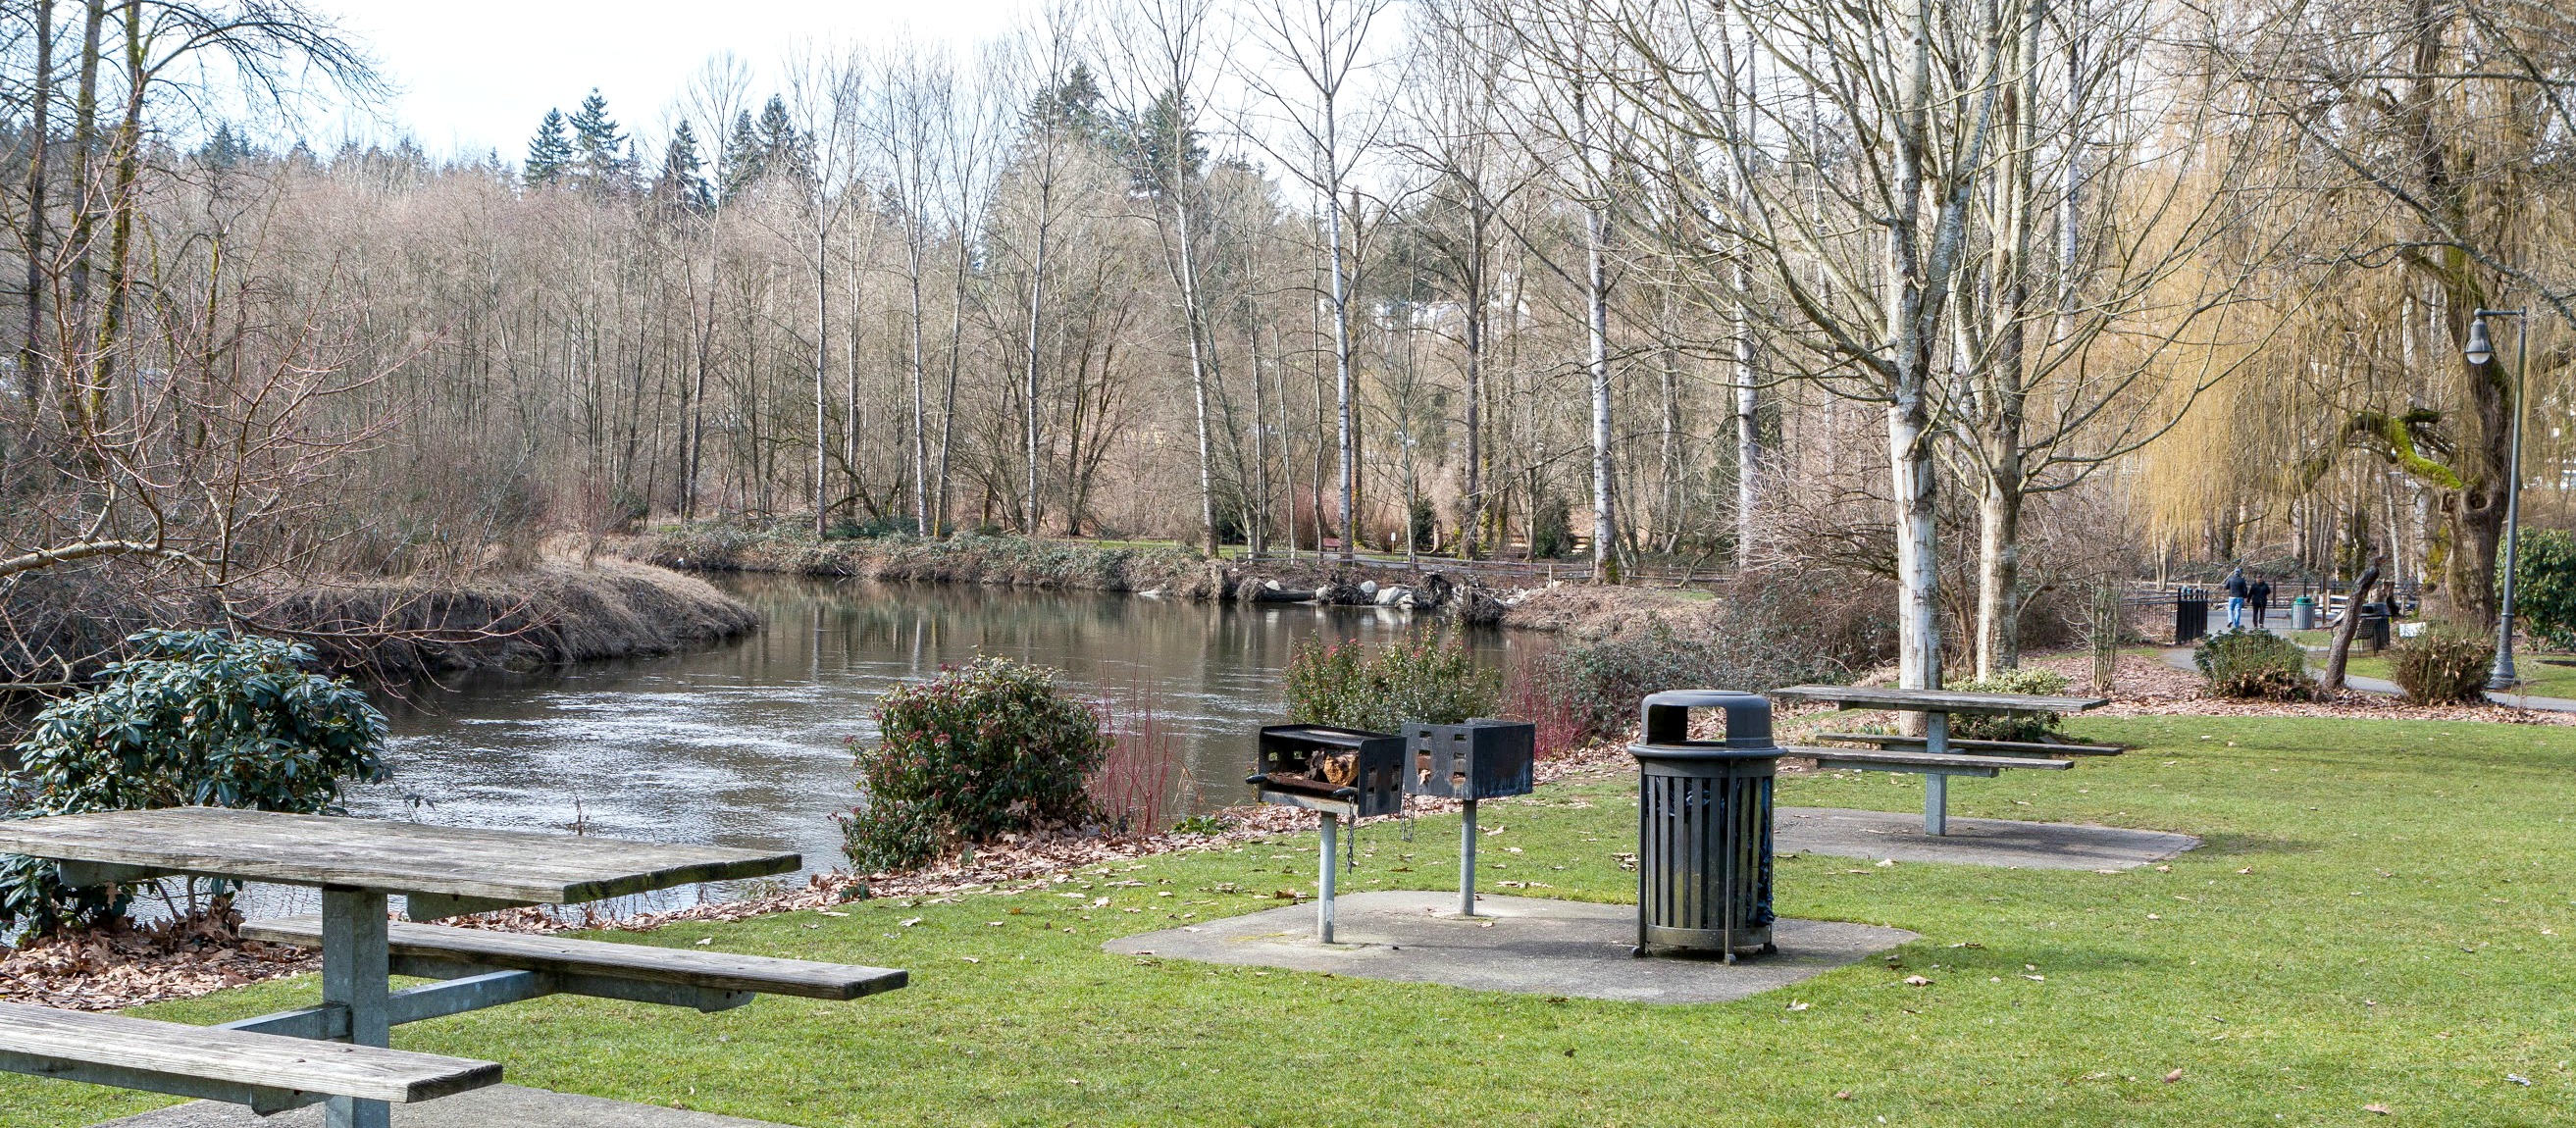
The Park at Bothell Landing
Located at 9919 NE 180th St Bothell, WA 98011at N Bothell Way
“The Park at Bothell Landing offers a little known boat launch along the Sammamish River, where you can put in your kayak, canoe or paddle board to take advantage of an outdoor ‘gym’ that will cost you nothing,” recommends Claudette Meyer. “Whether your goal is an energizing early morning paddle, an after work recharge, or an all-day workout, you’ll burn calories surrounded by beautiful scenery. Head west if your destination is Lake Washington. For a much longer paddle, you can head southeast to Lake Sammamish, maybe with a pit stop at Redhook Brewery along the way.”
Great tips, Claudette! Not only does The Park at Bothell Landing offer the opportunity to stay active, but it’s also a lovely place to spend time with family or friends at. Pack a picnic and make a day of it!
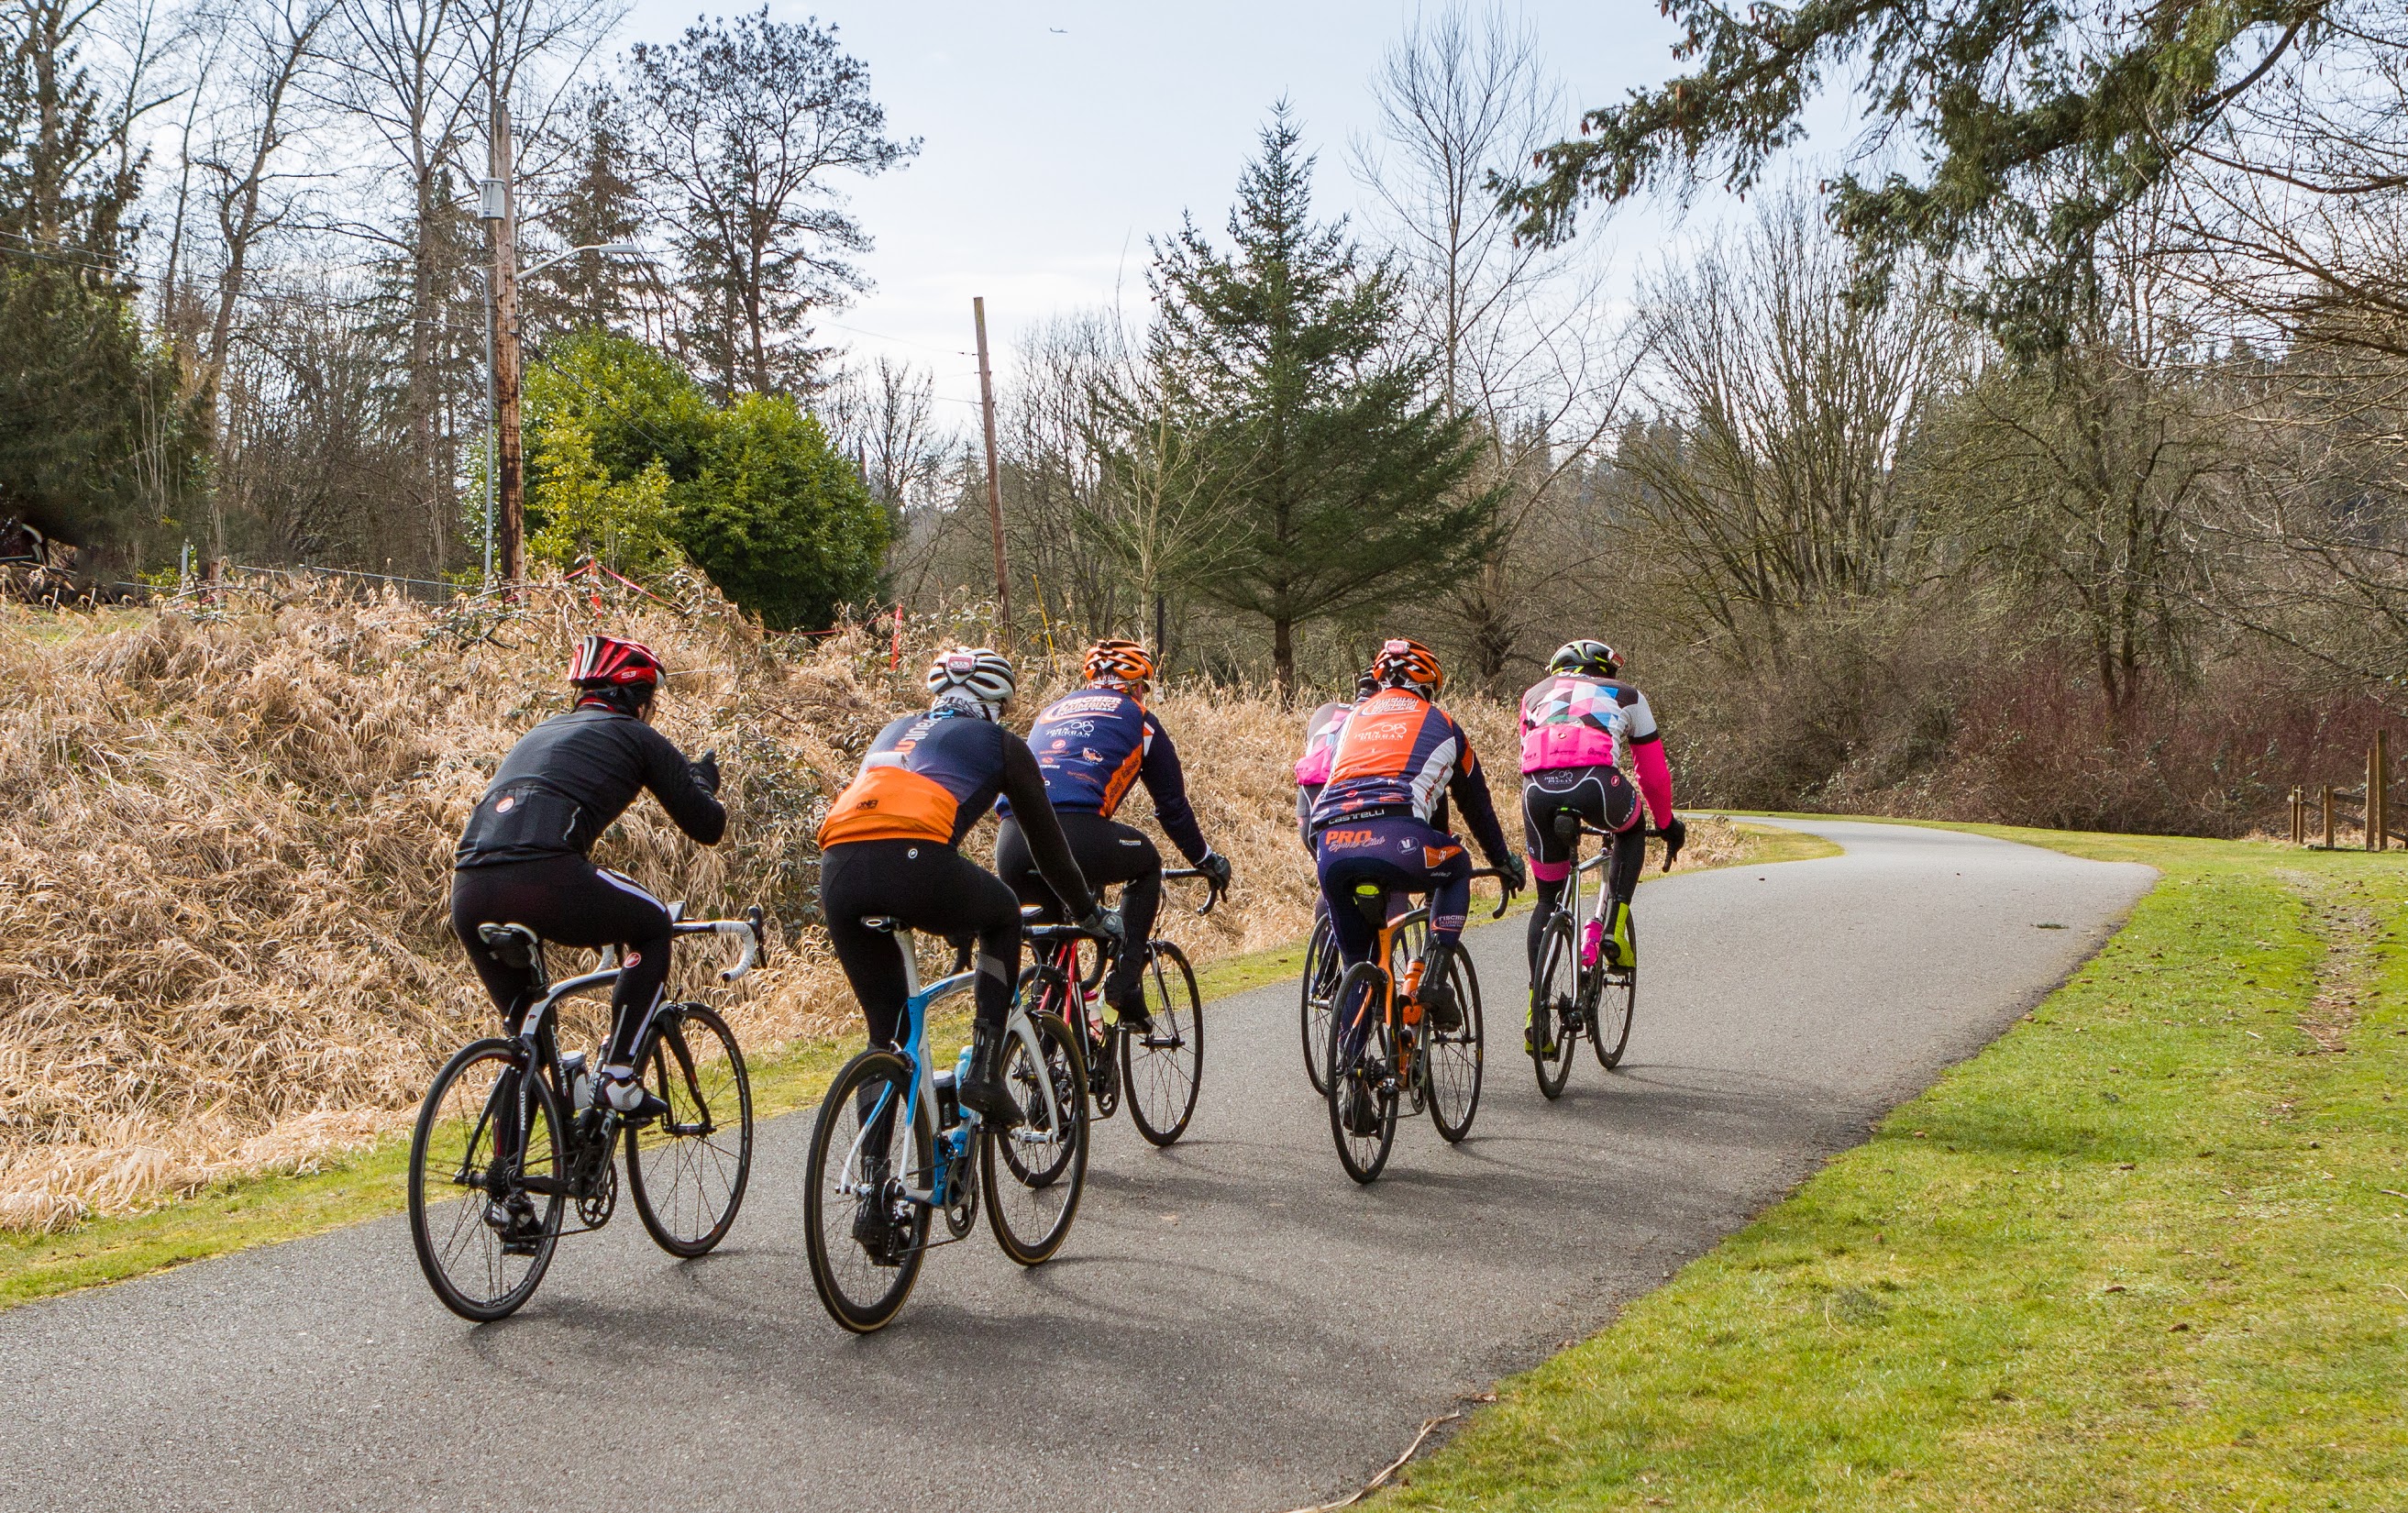
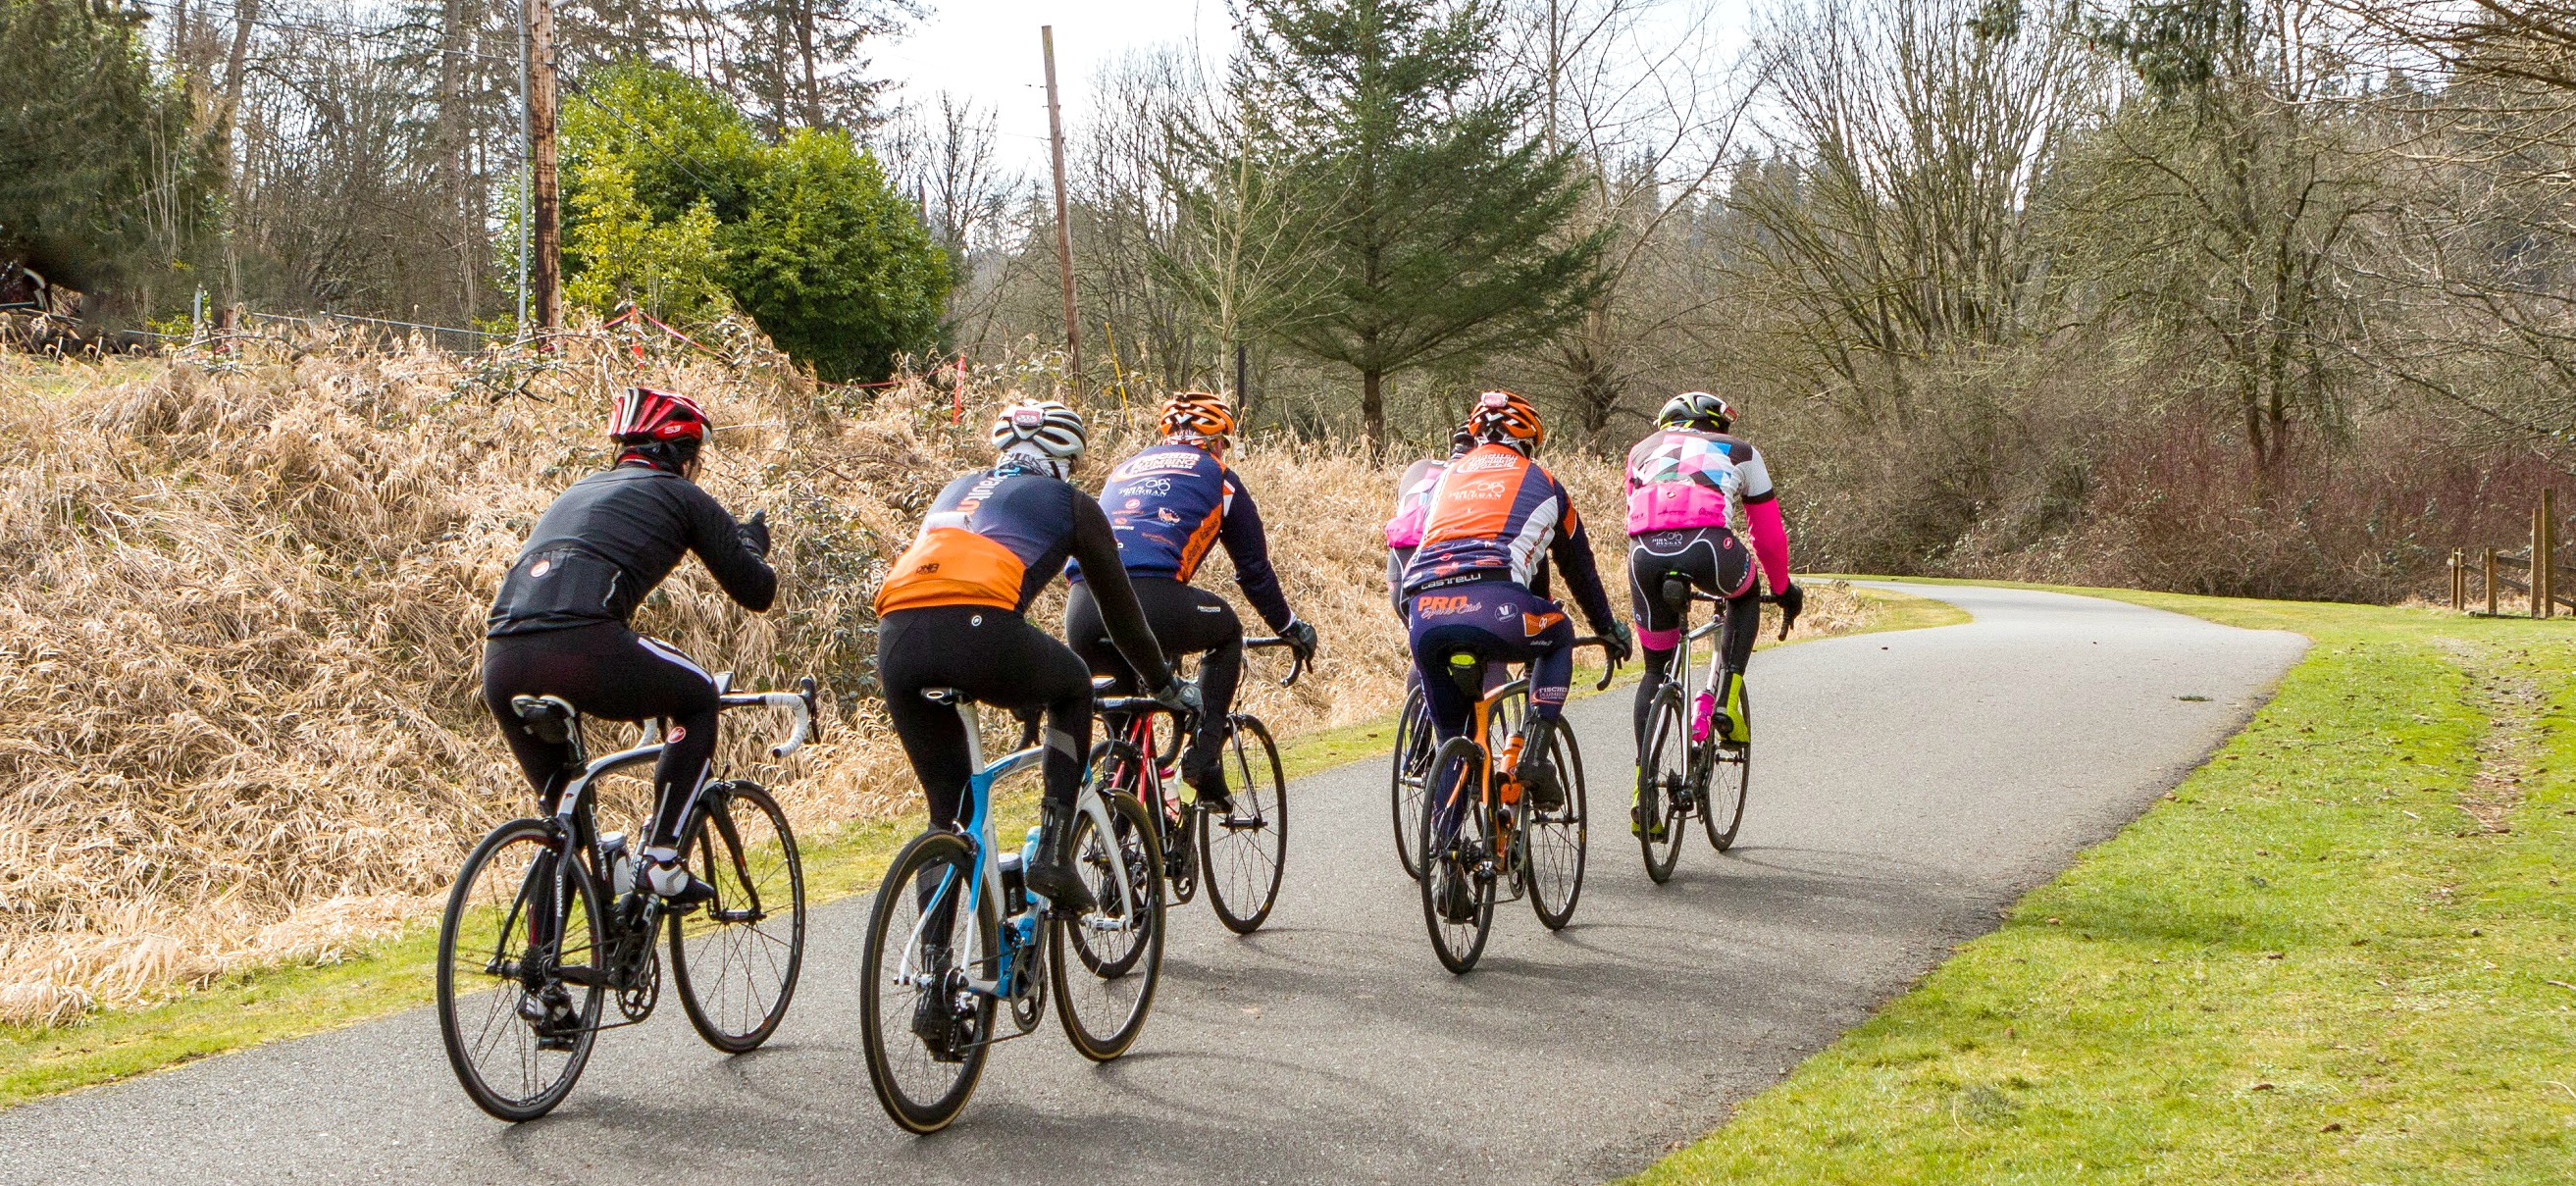
Burke-Gilman Trail
More than 18 miles long, the Burke-Gilman Trail extends from Shilshole Bay in Seattle all the way to the City of Bothell. This incredible amenity not only offers a paved surface for joggers, walkers, skaters, strollers, and bikers, but it’s also a popular commuting option as well!
Recently, the trail has be undergoing some updates, and Melissa Huddleston has the details:
“In addition to the Burke Gilman Trail, the North Creek Trail expansion will connect the North Creek Park in Bothell to the Burke Gilman Trail. The new expansion will extend from 183rd St SE to SR 524 and will include an elevated walkway 20-40 feet above ground,” shares Melissa.
“This section of the trail will be located between Sprague Drive and 192nd St SE. The timeframe of completion according to the Snohomish County website is still to be determined. I’m very excited as this trail will literally be steps from my home. On warm summer days, you’ll be able to find me riding my bike from my house to Woodinville Wine Country!”
You can view a map of the entire trail here, complete with information on road access points. We recommend planning your trip ahead of time and stopping at one of the beautiful, scenic parks along the way!
4 Fabulous Ways to Spend a Weekend in Bothell
A destination for locals and out-of-towners alike, Bothell’s wide variety of opportunities for fun and entertainment make it a top choice for those looking for a memorable weekend experience! Nestled in a prime location that’s surrounded by beautiful outdoors and some of the most popular attractions in the region, it’s not hard to be entertained in Bothell.
Check out our 4 ideas for how to spend a fabulous weekend in Bothell:
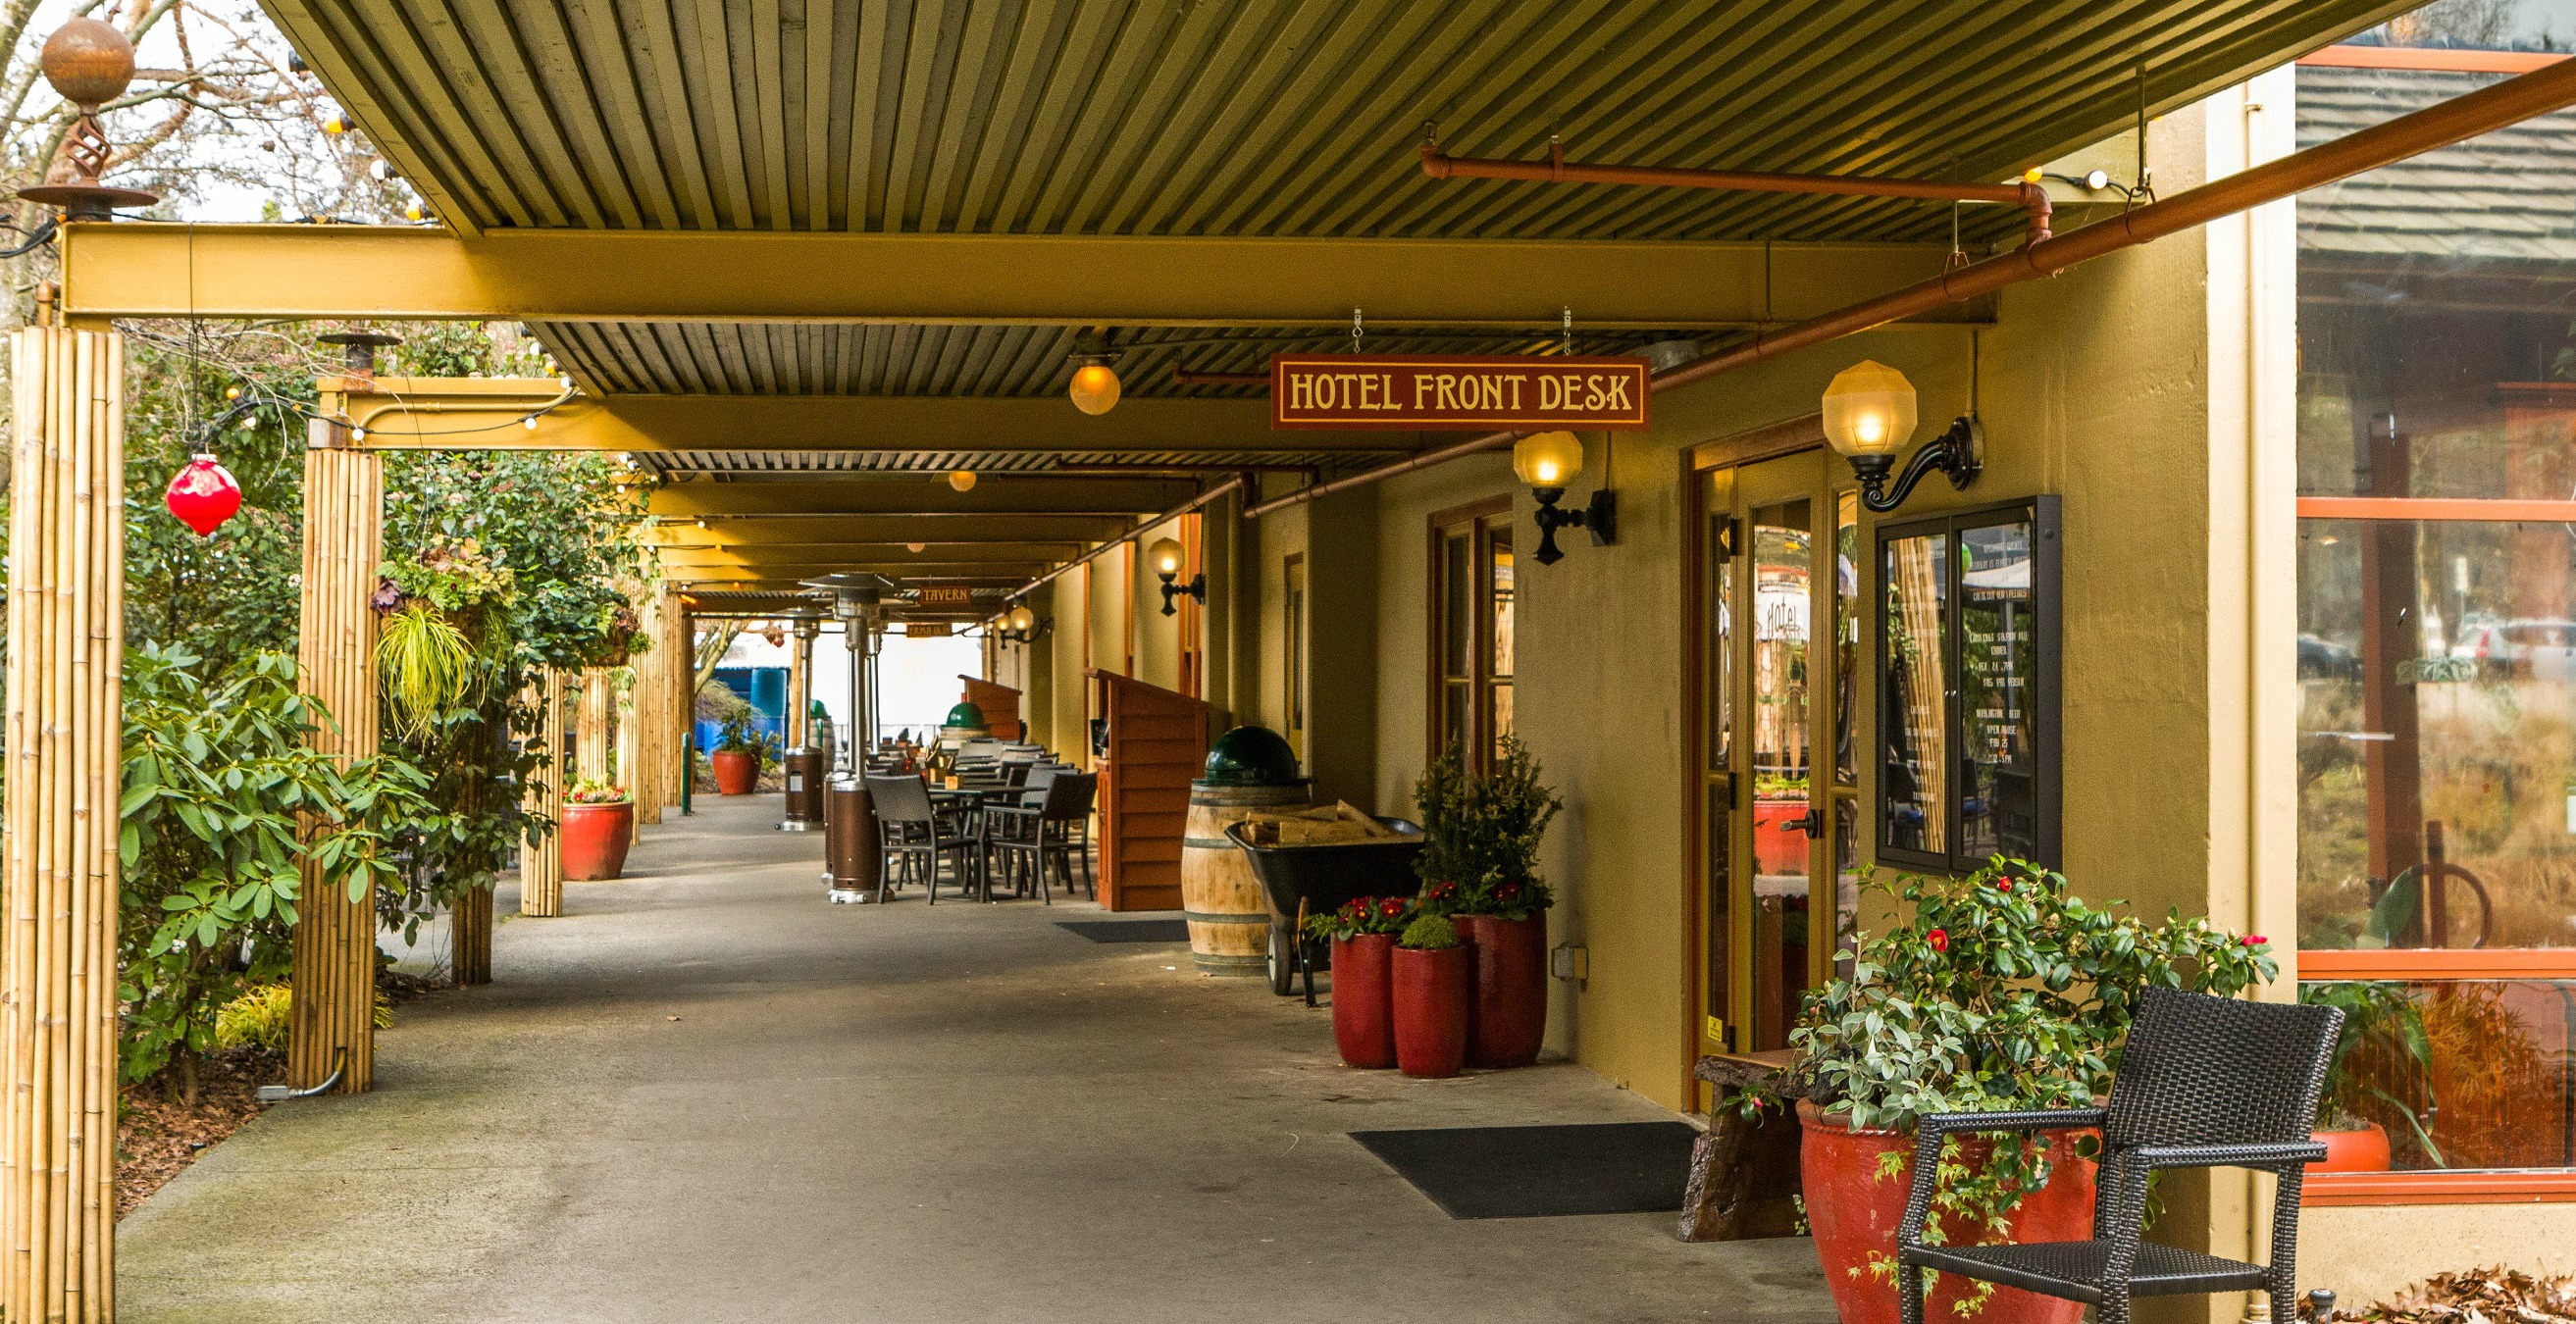
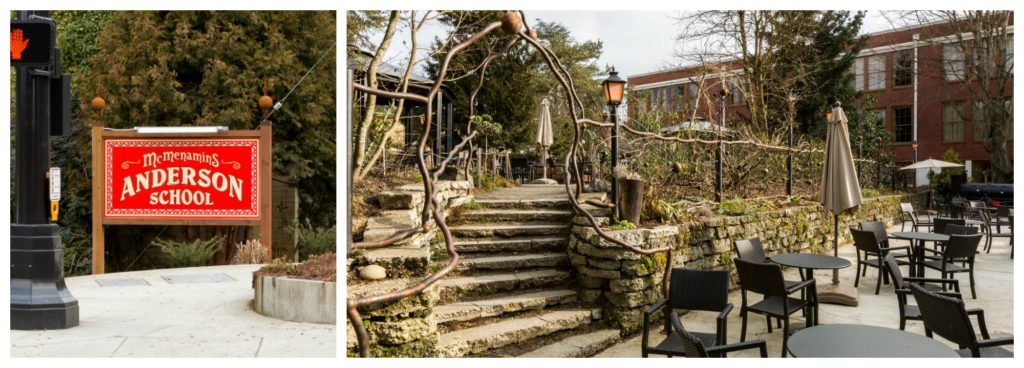
McMenamins: Hotel, Dining, Bars, Movies & More

“McMenamins Anderson School is a great spot!” recommends Brian Hayter. “There are lots of options within but my favorite place is to grab a drink and sit outside near the fire pits, or they have outdoor tables that are under cover with heaters for the cold/wet days.”
Whether you’re just looking for dinner and a movie or searching for an overnight getaway, McMenamins’ Anderson School in Bothell has your dining and entertainment needs covered! This one-stop-shop is located in a converted school, and hotel rooms are located in converted classrooms.
During your stay, visit the Principal’s Office for a drink, enjoy outdoor seating at the Tavern on the Square, take advantage of the Anderson School Theater Bar (order burgers, brews, popcorn, and candy and have it delivered to your table during the movie!), and much more. We recommend checking out their website for room package offerings, a schedule of special events, and more details on accommodations.
Woodinville Wine Country: Sip & Shop
Located right next door to Woodinville, Bothell’s close proximity to this wine capital make it a popular destination for wine lovers. Woodinville is home to a whopping 108 wineries and tasting rooms, 8 microbreweries, distilleries & cideries, and 26 different dining spots! With so many wineries to choose from, it can be a bit daunting, but we recommend checking out Woodinville Wine Country’s website for a guide to Woodinville’s different districts as well as a list of wineries and a special passport that can get you discounts. For those hoping to stay the weekend, there’s also a guide on hotels and bed & breakfasts available for your convenience.
When the sun comes out, Tonya Tye recommends biking from downtown on the Sammamish River Trail and finding a glass of wine to enjoy at the plethora of wineries. She also recommends listening to some music at the popular Chateau Ste Michelle, home to some delicious wine in addition to a concert series that attracts big names like Josh Groban and John Legend.
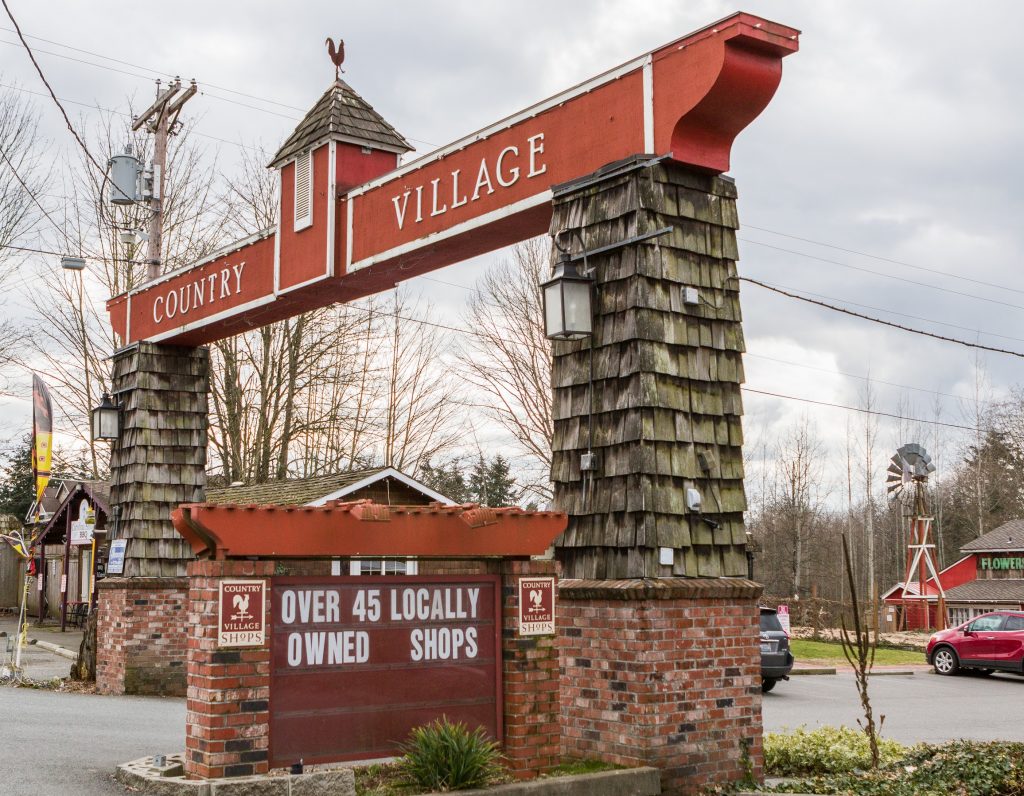
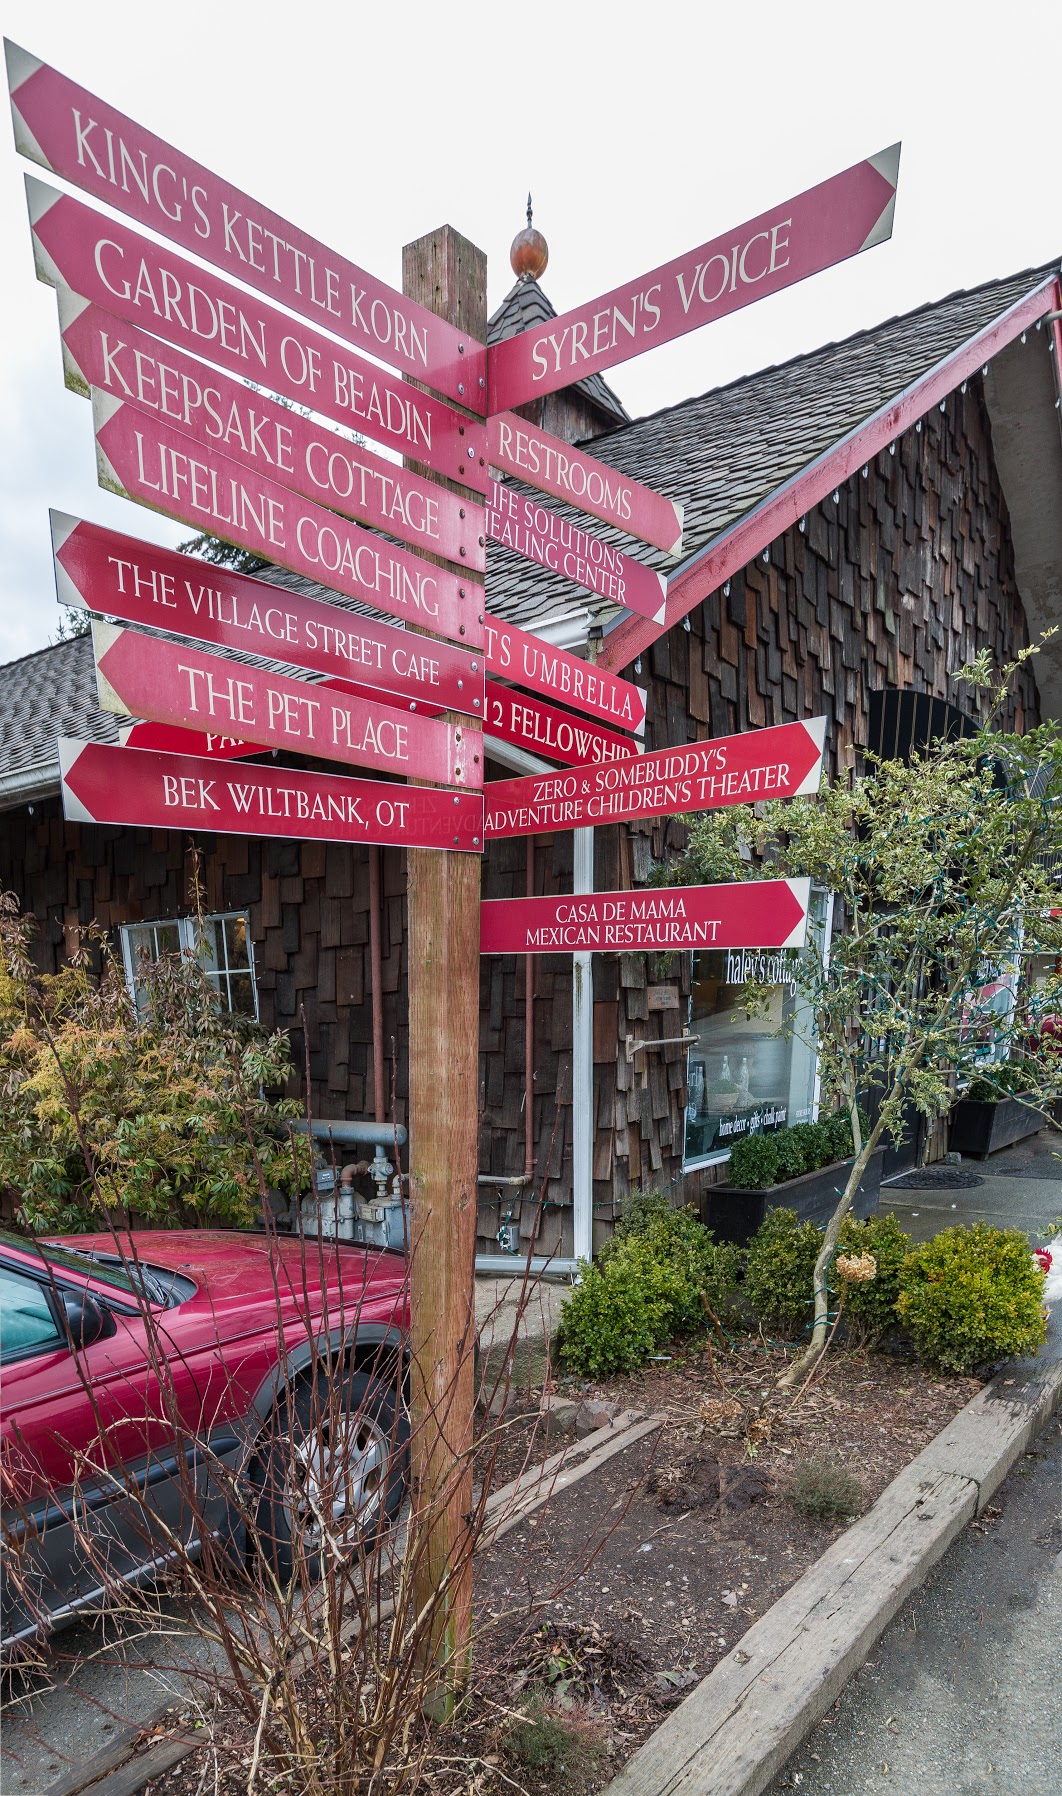
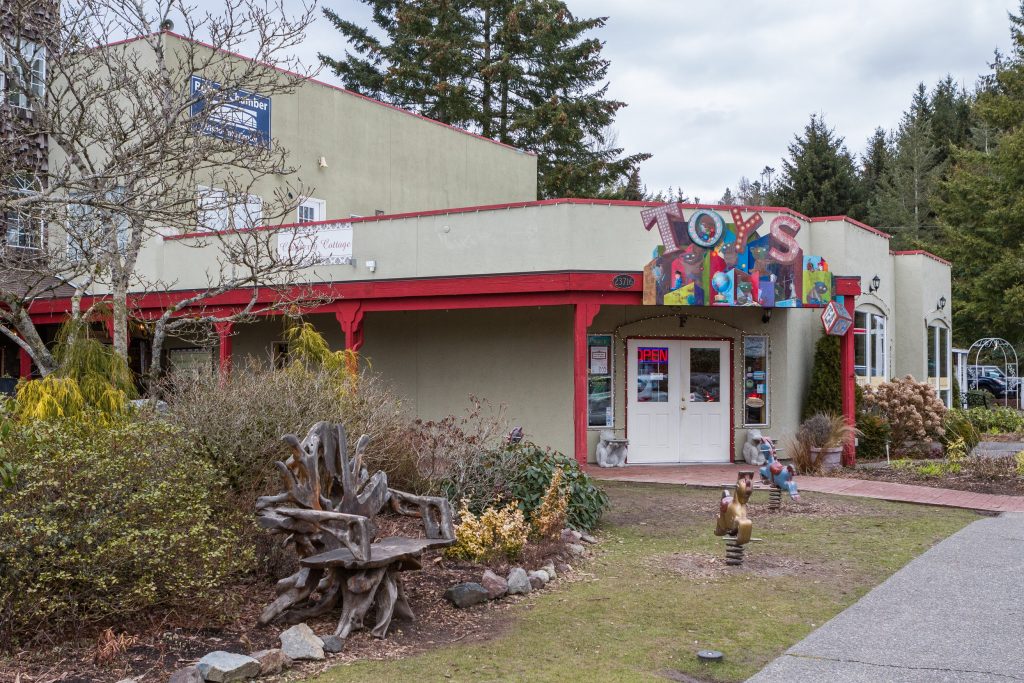
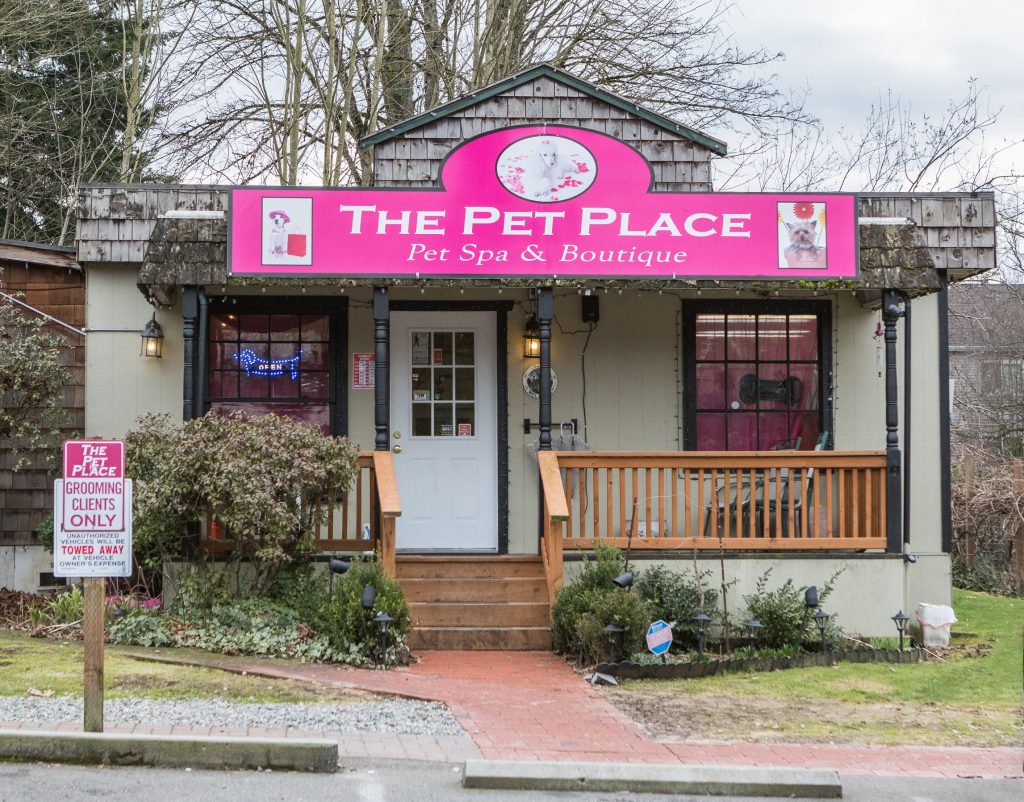
Country Village
Whether you’re looking for some family-friendly entertainment or heading out with a group of adults for a night on the town, Country Village offers a whimsical setting to explore and enjoy! Discover charming ponds, restaurants, and shops with gifts, home decor, toys, antiques, and much more. Home to almost 40 shops, we recommend setting aside at least an entire day to explore the scene!
Country Village is also home to several events throughout the year—enjoy beer walks, wine walks, “Ladies Night Out” events, and other more adult-friendly events alongside seasonal happenings for kids like Cookies with Mrs. Claus, Gingerbread House Weekend, Wizard Fest, Meet the Easter Bunny, and much more.
Also, from June through September each year, take advantage of the Country Village Farmers Market! Located in the center parking lot, this dynamic expanse of vendors features dozens of stands, fresh local produce, handmade items, live music, and much more. View farmers market dates and a list of vendors here.
Brewery Tour
Beer is a big deal in the Pacific Northwest, and Bothell’s long list of breweries sets the perfect scene for a weekend brewery tour!
- Watts Brewing Company: This nano brewery names their accessible beers after bees, and each release is only brewed once.
- Decibel Brewing Co: Kids, pets, and outside food are welcome at this establishment!
- The Hop and Hound: Enjoy at least a dozen fresh beers on tap, plus Stumptown Cold Brew Coffee on NITRO, and different food trucks every Friday.
- Foggy Noggin Brewing: As one of the world’s smallest production breweries, Foggy Noggin offers fresh beers in their Bothell tasting room (bring a growler!).
- Nine Yards Brewing: This all ages spot is located right off of the Burke Gilman trail, making it a great option when you need to stop and cool down.
Tonya Tye also recommends stopping at 192 Brewing Co. or Cairn Brewing, and combining it with a day of riding your bike along the Burke Gilman or along Lake Washington. Break for a picnic along the way!

7 Must-Visit Restaurants in Bothell (Plus Happy Hour Tips & Why Locals Love Each One!)

If you’re looking for a fun date night restaurant or just a laid-back spot to grab some delicious eats, Bothell has got you covered! Home to several dining establishments with mouthwatering menus and some excellent happy hours, Bothell has everything from sushi and Italian to pubs and American breakfasts.
Here are a few restaurants that come highly recommended by locals:
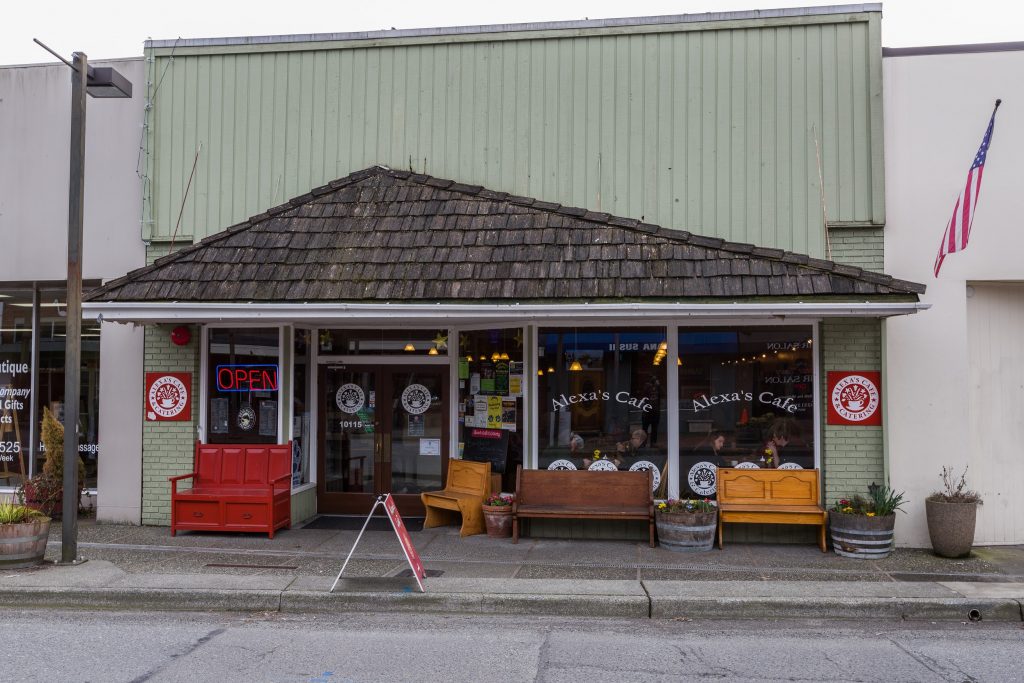
Alexa’s Cafe
Located at 10115 Main St. Bothell, WA
Nestled in a charming 1927-built brick building, Alexa’s Cafe is a neighborhood staple! “We love Alexa’s on main street!” shares Tonya Tye, and Jen Bowman recommends the sweet spot for brunch.
Their extensive breakfast menu is filled with classics like breakfast sandwiches, “bennys,” pancakes and French toast, and scrambles, and their lunch menu is a mouthwatering selection of sandwiches, soups, salads, burgers, wraps, and much more.
Need catering for your event? Becky Larsen recommends checking out Alexa’s catering options whether you’re catering a business lunch or a wedding rehearsal dinner.
Grazie Ristorante
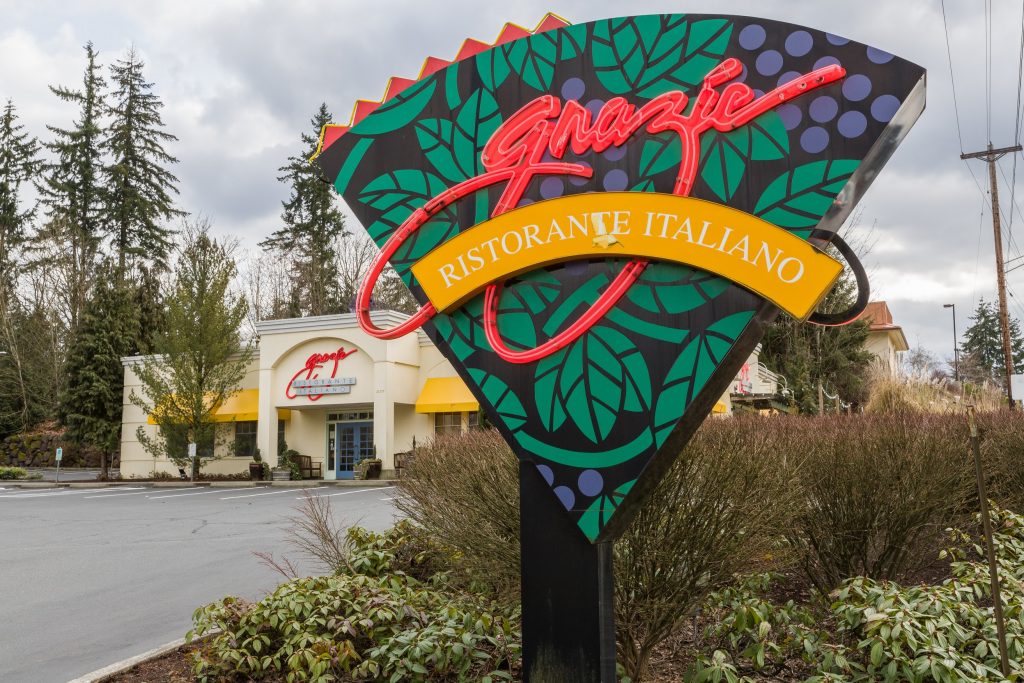 Grazie Ristorante
 Located at 23207 Bothell-Everett Hwy Bothell, WA 98021
If you’re craving Italian, Jen Bowman recommends heading to Grazie Ristorante for pizza, lasagna, cannelloni, and other Italian specialties.
“[Grazie’s serves] great dinners with an extensive wine list and happy hour with live music weekly!” recommends Becky Larsen. Enjoy daily happy hours from opening to 6pm and take advantage of half-price appetizers, wine, beer, and drink specials. As Becky mentioned, Grazie also hosts live music, and you can view their schedule of events here.
Uncle Peteza’s Pizzeria
Located at 228th & Meridian
Located Safeway Plaza 24118 Bothell-Everett Hwy Bothell, WA 98012
“We LOVE Uncle Peteza’s Pizzeria!” shares Melissa Huddleston. “They have two locations—one on 228th and Meridian, and one in the Safeway Plaza off of 241st and Bothell Everett Hwy. Their crust is the best! They have deep dish, thin crust, and, wait for it – STUFFED CRUST! My favorite is the veggie pizza and Chris’ is the Meatsa. They also have cheesy bread, wings, oven baked sandwiches, pasta, calzones, and salads. Yum!!! Now I’m hungry!!”
Melissa’s right—Uncle Peteza’s Pizzeria’s incredible pizza selection is sure to make everyone in your dining party happy! They also have gluten-free pizza, soup, bottomless soda, and a convenient rewards program.
Sushi Hana
Located at 2020 Maltby Road Suite 2 Bothell, WA 98021
“Sushi Hana, a conveyor belt sushi restaurant at Thrasher’s Corner, is one of our favorites. When you don’t want to cook and the kids are starving and you don’t want to wait to order at a sit-down restaurant, this speedy sushi joint is the ticket! Large booths for groups of 6 or bar stools at the belt offer lots of seating. Always great service and good quality sushi,” shares Jen Bowman.
Sushi Hana is truly dedicated to quality—their conveyor belt-style sushi utilizes RFID technology to monitor the dishes on their conveyor belt, and no dish is allowed to be in circulation for more than 2 hours.
Sushi Hana serves up dozens of dishes, from classic nigiri to more unique sushi rolls. “In addition to traditional sushi, they have small plates of strawberries, green grapes, and Mochi ice cream for dessert! They also serve bottled sake, beer and wine,” shares Jen. We recommend taking a look at their menu here!
The Three Lions Pub
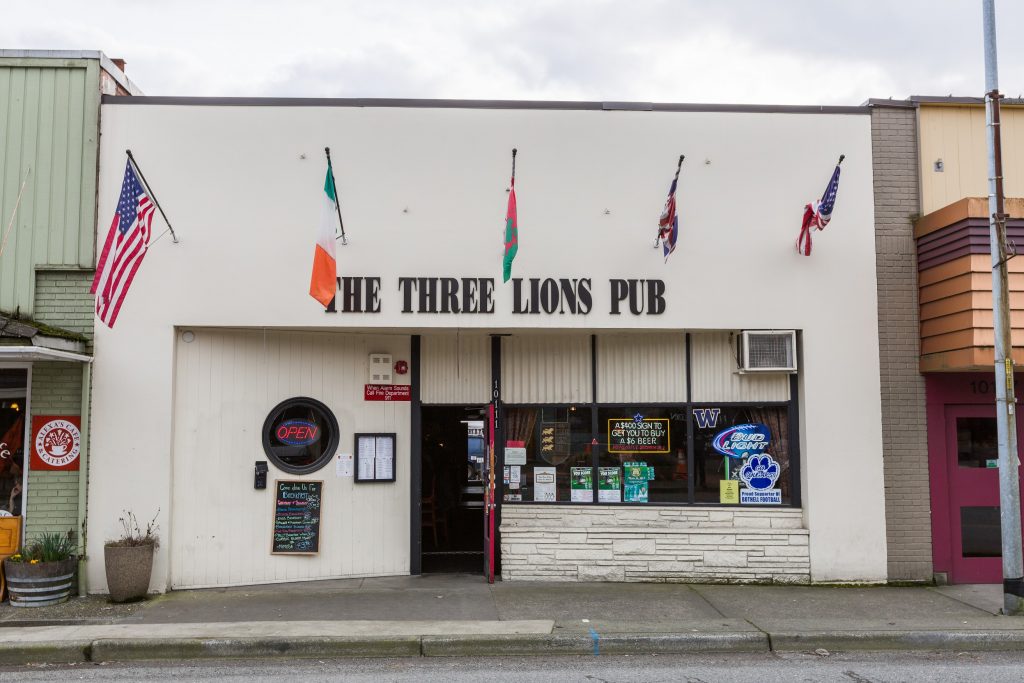 The Three Lions Pub
Located at 10111 Main Street Bothell WA, 98011
“Lion’s Pub on main is always good for watching sports and enjoying beers and pub food,” advises Tonya Tye. And when Tonya says “pub food,” she really means it—Lion’s Pub serves up classic English pub dishes like classic fish & chips, Lancashire Pasty, sausage rolls, steak & mushroom pie, steak & kidney pie, bangers & mash, Shepherd’s Pie, and much more!
Plus, enjoy happy hours every weekday from 4-6pm and on weekends from 3-6pm. Take advantage of their deals on well drinks, wine, draft beer, and cider.
Amaro Bistro
Located at 18333 Bothell Way NE #105 Bothell, WA 98011
Becky Larsen loves Amaro Bistro for their great meals, awesome happy hour, and the fact that it’s a great place to celebrate a special occasion. Brunch, lunch, dinner, dessert, drinks and more are all served at this popular Italian bistro, and their extensive wine menu is truly impressive. Plus, Amaro is also family-friendly and has a special kid’s menu.
Enjoy daily happy hour deals from 3pm-6pm and 10pm to midnight, and take advantage of their lunch special of 2 courses for $16!
Preservation Kitchen
Located at 17121 Bothell Way NE Bothell WA 98011
Highly recommended by both Brian Hayter and Tonya Tye, Preservation Kitchen offers an exquisite seasonal menu. They’re dedicated to supporting local businesses, and they use sustainable and organic ingredients whenever they can.
Tonya especially recommends their amazing polenta fries and their good wine selection, but menus change based on the season, so check out their website every now and then! We also highly recommend their happy hour. From 2-6pm daily, enjoy a large selection of appetizers, $7 cocktails, and discounts on beer and wine. See the complete happy hour menu here.
Bothell is packed with incredible places to eat, and we included a few other favorites below:
- Jen Bowman recommends Viva Jalisco Mexican Restaurant or Passion Tequila for Mexican cuisine
- Becky Larsen loves Foggy Noggin Brewing
- Tonya Tye loves stopping by Ohana Teriyaki for takeout
- A fan of John Howie? Jen Bowman recommends Beardslee Public House, John Howie’s first venture outside of Bellevue
- For the seafood lover, Tonya Tye recommends Thrasher’s Corner Pub for all-you-can-eat crab on Mondays, and she loves Bone Fish at Canyon Park for their amazing firecracker shrimp
- Tonya Tye also recommends stopping by the Yakima Fruit Stand for fresh fruit, veggies, and Christmas trees!

New Construction in Bothell: Developments to Keep Your Eye On

Bothell’s long list of excellent amenities, city conveniences, and central location ensures that it’s a highly desirable place to live. As a result, Bothell is also currently home to a myriad of new developments and new construction!
“There’s lots of new homes in Bothell ranging from $499,000 to over a million,” shares Tonya Tye. And according to Lauren Pulfer and Jen Bowman, in addition to new construction, you can also expect to find a range of entry-level townhomes, split-levels, ramblers, older homes, and homes on lots of land as well.
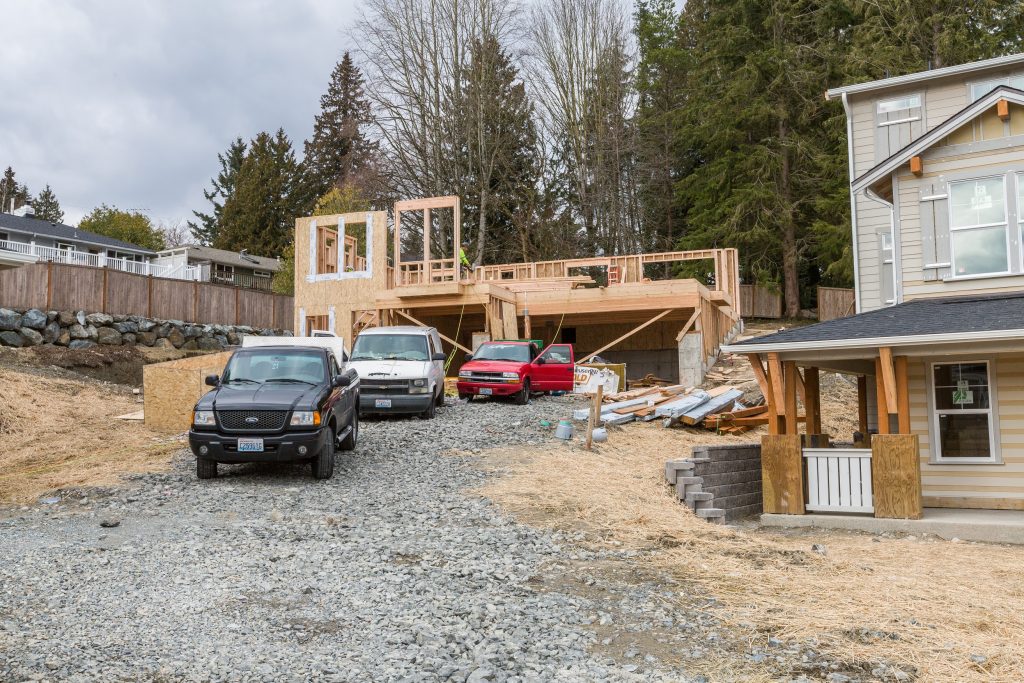
Here are a couple of new construction developments in Bothell to keep your eye on:
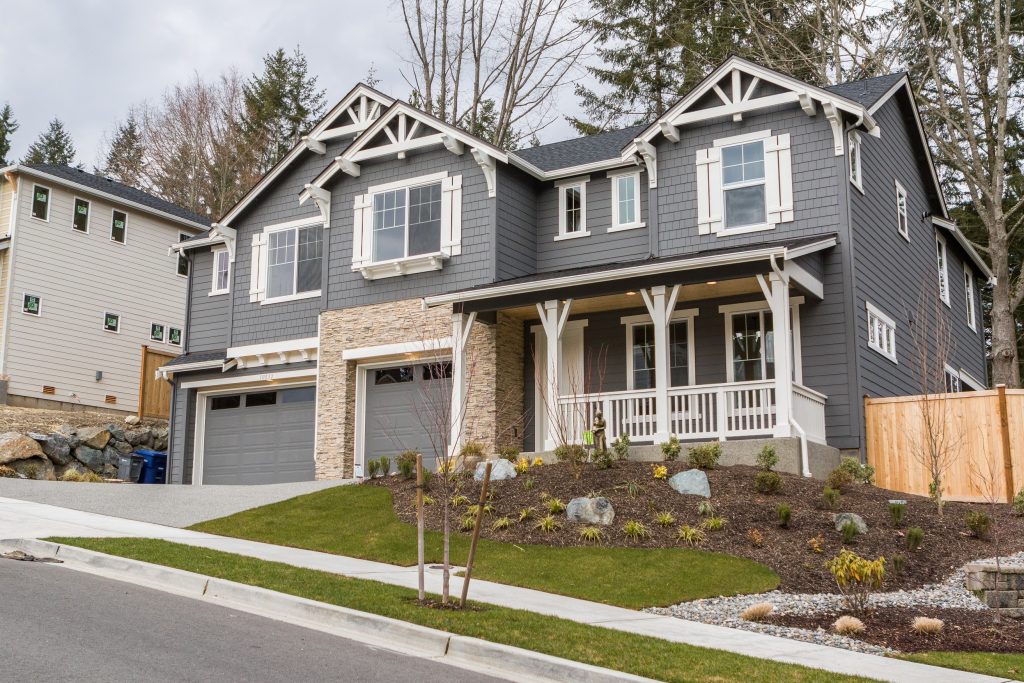
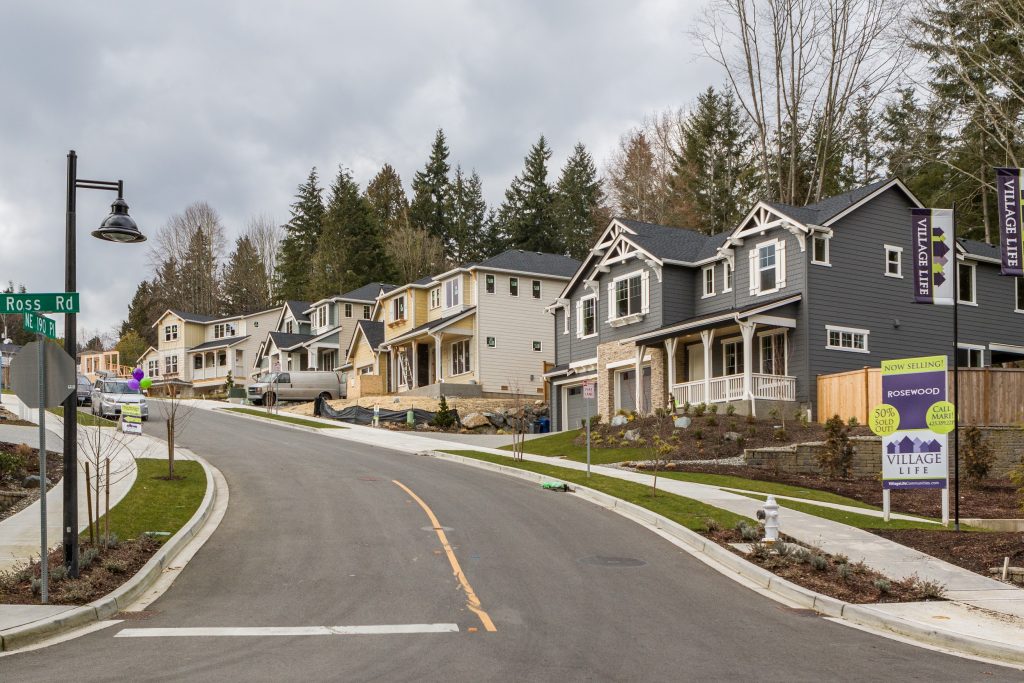
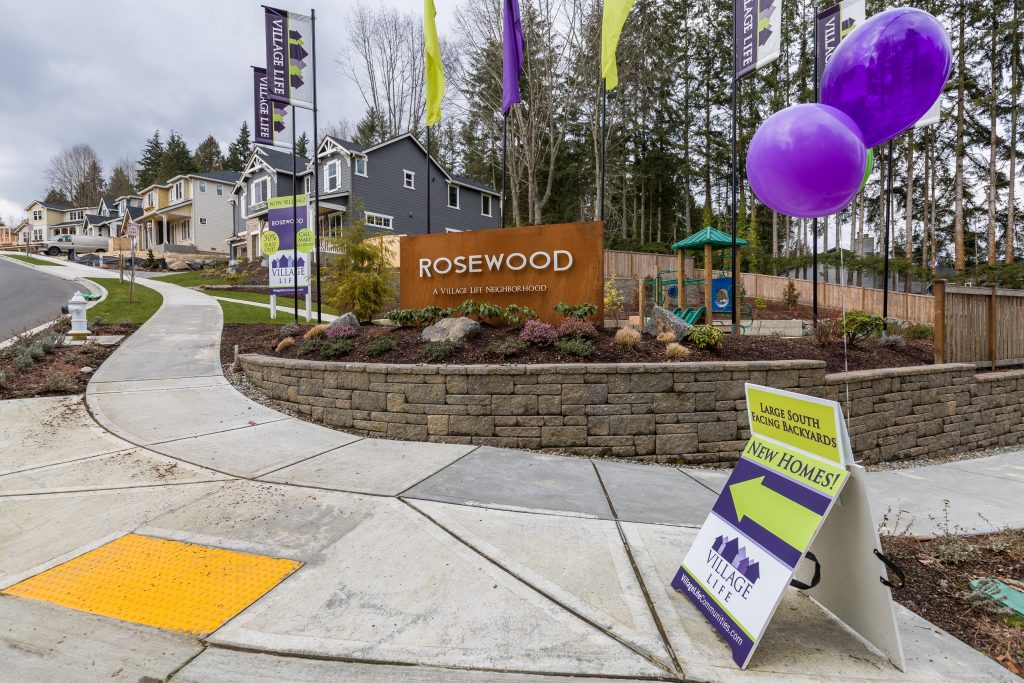
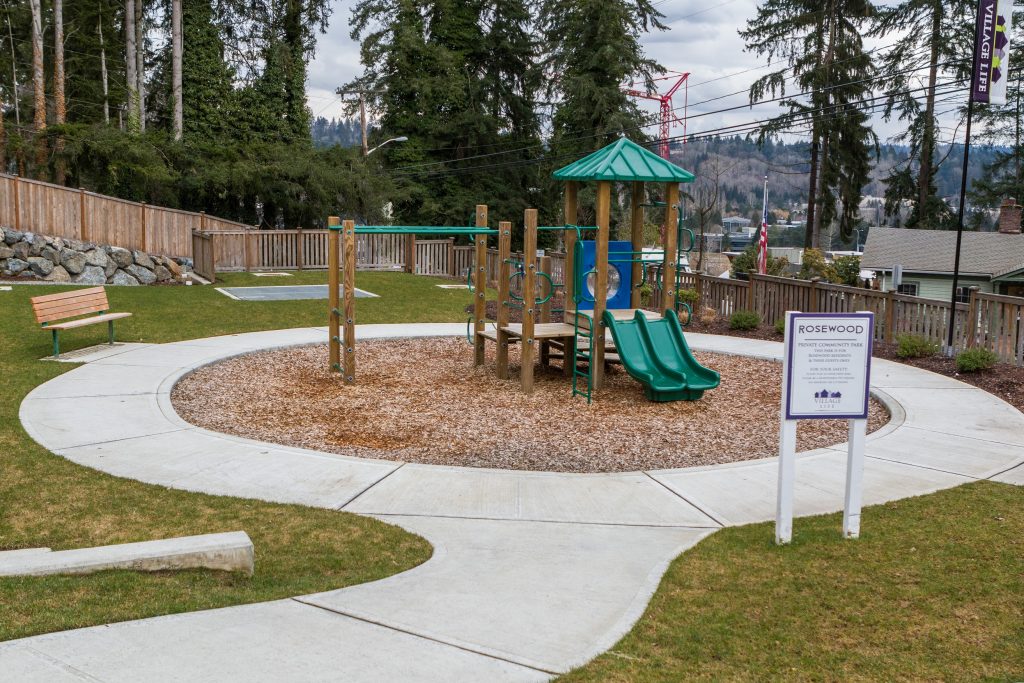
 Toscana by Village Life
 Toscana by Village Life
 Homes range from $900,000 to $1M
Located near Country Village, Toscana is brimming with luxury Craftsman-style homes that offer large floor plans (ranging from 2,832 to 3,860 square feet) and quality, modern finishes. The neighborhood includes 23 homes with 7 floorplans to choose from, and residents get to enjoy sidewalk-lined streets, a community park, a picnic shelter, and Northshore Schools.
Normandie Woods by Sundquist Homes
Homes begin in the $600,000s
Conveniently located near Interstate-5 and 405 and the Mill Creek Town Center, Normandie Woods showcases gorgeous homes that blend classic details and modern elements. There are 54 homes in Normandie Woods, and residents live in the Edmonds School District.
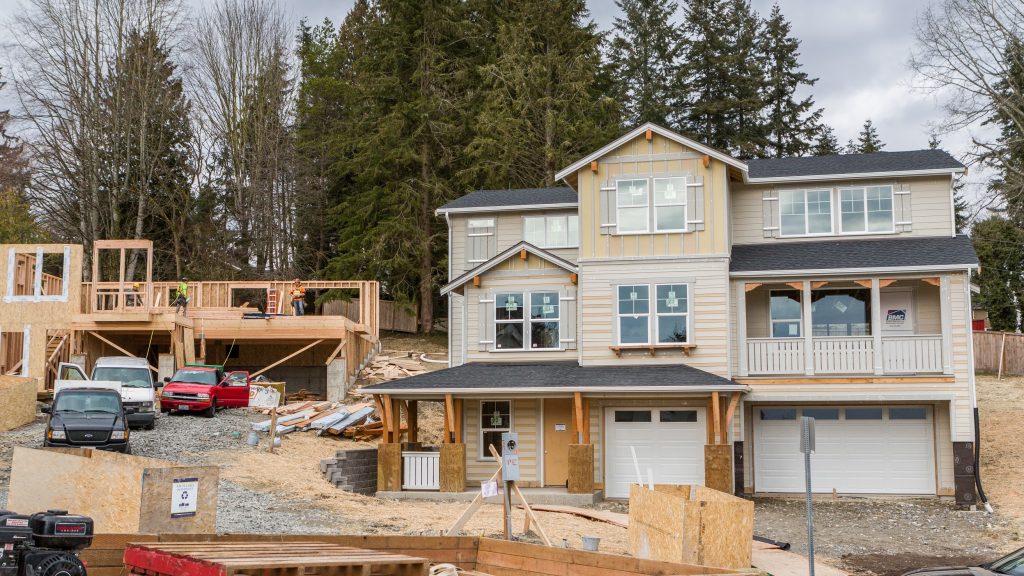
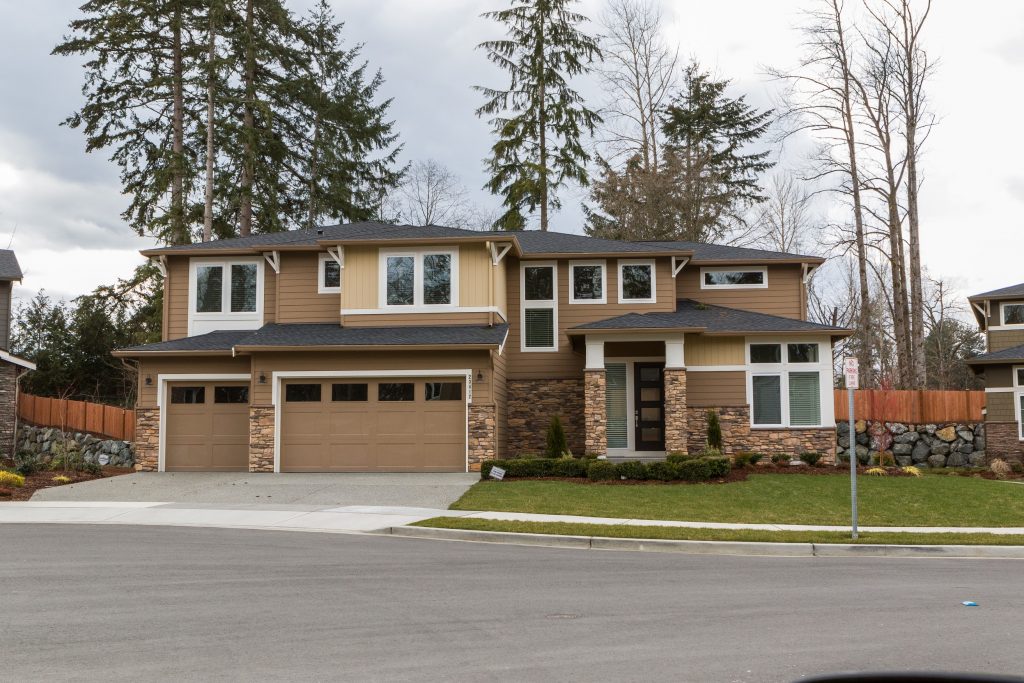
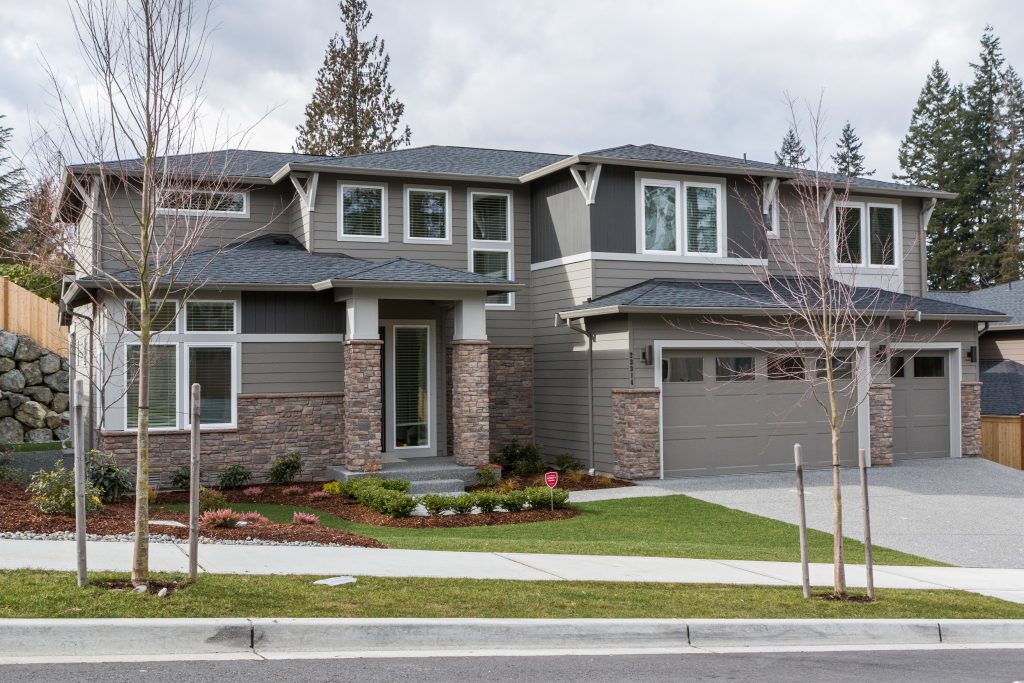
Here are several examples of new construction in Bothell:
Want to keep searching for new construction in Bothell?
We recommend starting your search here!
For more homes in Bothell in a variety of price points, the Bothell search on NewHomeSource.com features several current new construction listings.
Demand is High, Inventory Low… Here we Go!
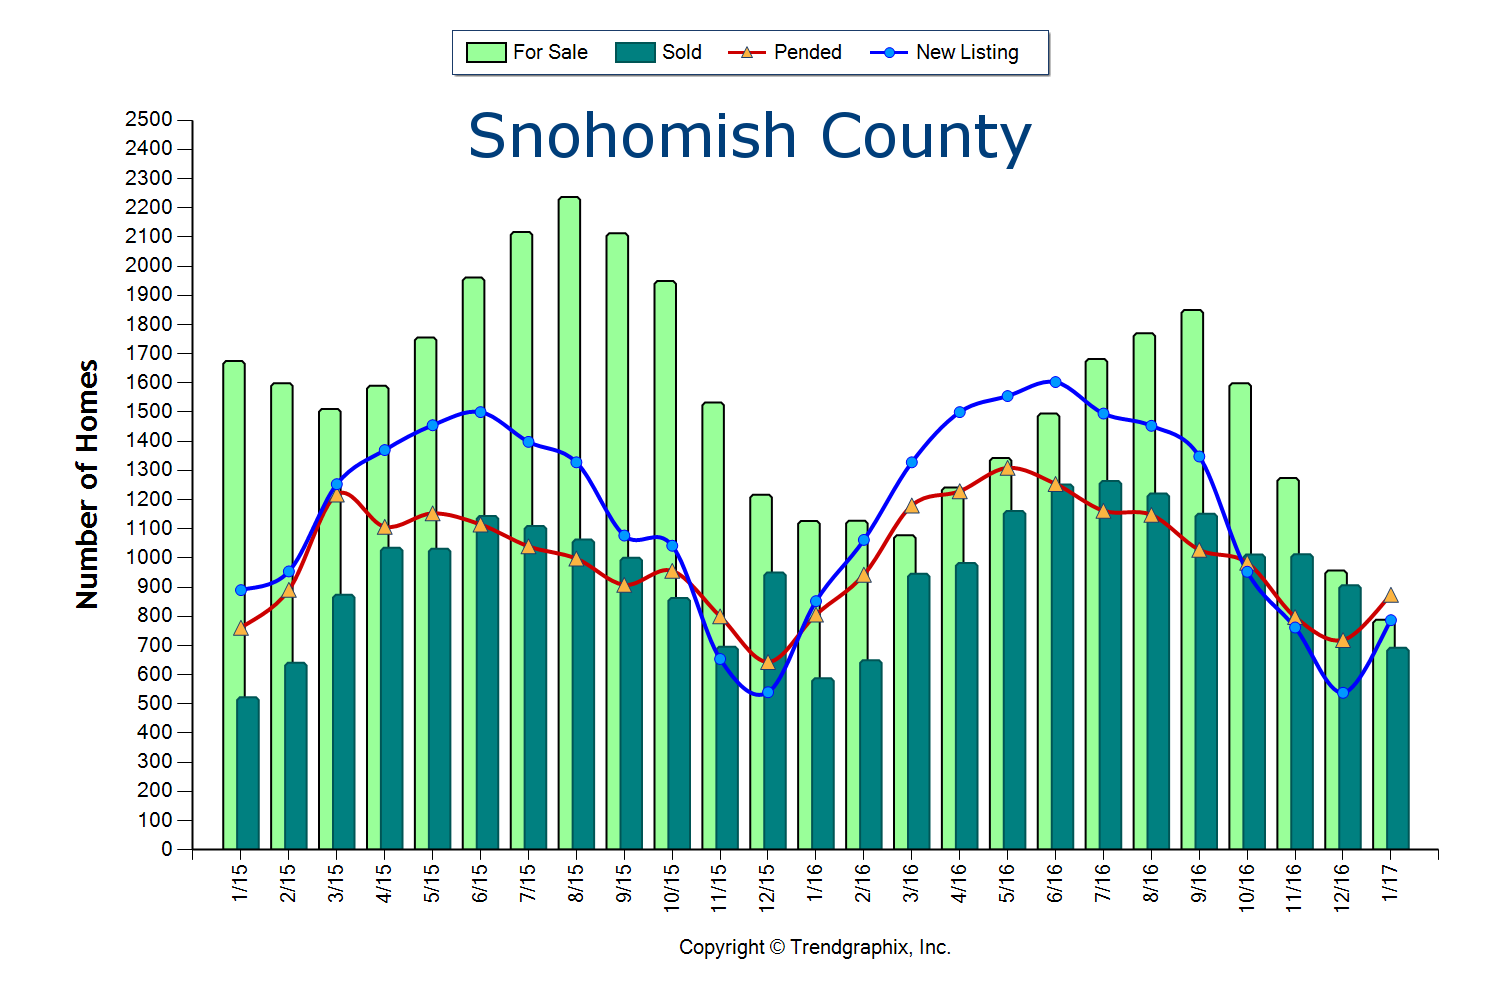
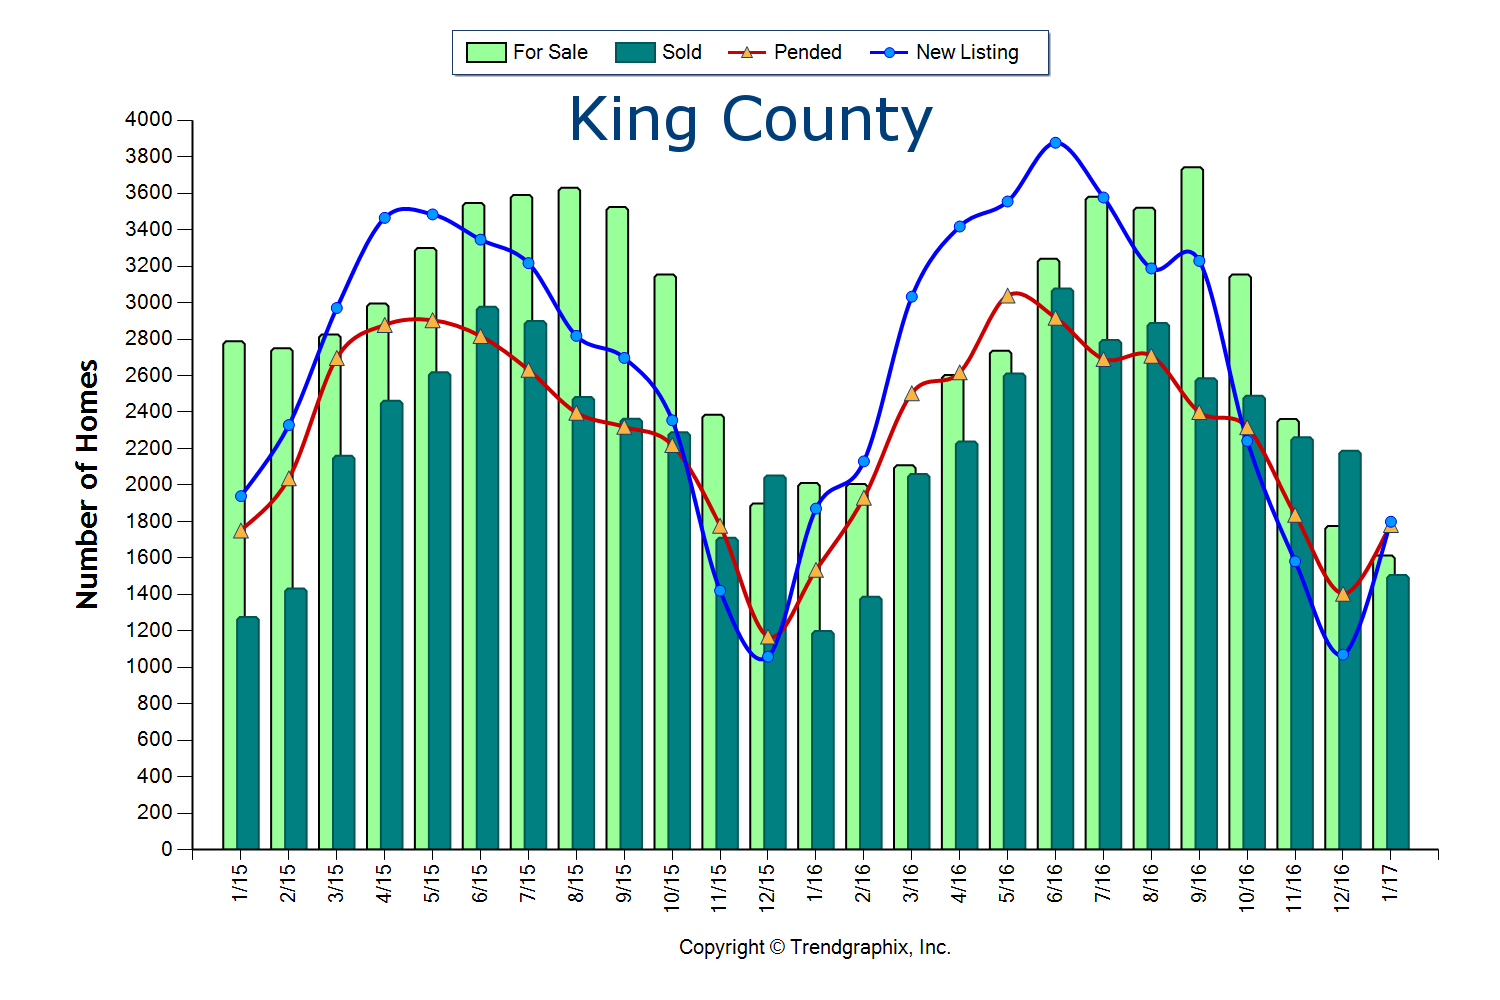
The two graphs here illustrate the amount of homes for sale, the amount of homes that sold, pending sales and new listings over the past two years in King and Snohomish Counties. This gives us a good look at the simple principle of supply and demand. We are currently experiencing one of the strongest Seller’s markets in recent history. A Seller’s market is defined by having three or less months of available inventory. Currently, King and Snohomish counties have only 0.9 months of inventory based on pending sales. This means that if no new homes came to market, we would be sold out of homes in less than a month. What is crazy is that this inventory count is down 30% from the year prior, which was also an extreme Seller’s market!
 Where this particular Seller’s market is unique, is that a decrease in new listings is not creating this environment, but very high buyer demand is. In fact, King County new listings were up 5% over the last year, but so were sales. In Snohomish County new listings were up 7% over last year, but sales were up 11%! Despite the increase in homes coming to market, demand has matched or outpaced, leaving us with the lowest inventory levels ever.
We can thank our local, thriving job market. So much so, that many people from out-of-state are relocating here to be a part of our economy and the quality of life the Greater Seattle area has to offer. We also have poised move-up buyers ready to cash in on their equity and first-timers ready for action. Combine the healthy local economy with strong equity levels and still historically low interest rates, and the audience for homes that come to market is huge!
Multiple offers are very common and prices are increasing. Median price is up complete year over year in King County by 13% and Snohomish County by 10%. This growth in equity has provided home owners the option to make the moves they have been waiting for, such as a move-up, right-size or relocating out of the area for retirement.
These graphs predict that we will see an increase in new listings as we head into the Spring and Summer months, which is needed to meet demand. If you are considering putting your home on the market this year I would advise the sooner the better, as buyers did not hibernate for the winter and will not be worried about flowers blooming in your front yard. Sellers that beat the second quarter increase in listings will enjoy a larger audience due to less competition.
 The importance of both buyers and sellers aligning with a knowledgeable, well-researched and responsive broker is paramount. One might think that it is “easy” to sell a house in this market, but how the preparation, exposure, marketing, management of all the communication and negotiations are handled can make or break a seller’s net return on the sale. While market times are short, they are intense! Negotiations are starting as soon as the property hits the market by educating buyers and their brokers on exactly what a seller would like by the time offers are due. The goal is to bring the sellers I work with not only the highest price, but the best-termed offer that I know is going to close.
If you’re a buyer, it is overwhelmingly important that you are aligned with an agent that knows how to win in this market. Terms, negotiations, financial preparation, communication, responsiveness and market knowledge are what set a highly capable selling agent apart, and are required to prevail. While the market for buyers is fierce, we can assure you that with a well thought out and executed plan, we have helped buyers win.
If you have any curiosities or questions regarding the value of your current home or purchase opportunities in today’s market, please contact us. It is my goal to help keep you informed and empower strong decisions.
7 Breweries for Beer Lovers Just North of Seattle
You don’t have to drive all the way to Seattle for premium microbrews and cool glasses of crafts beers—just north of Seattle, our beer scene is brimming with local options that any craft connoisseur will appreciate. Whether you want to fill up a growler, go on a weekend beer tour, or just grab a pint with friends, these 7 breweries just north of Seattle in Mountlake Terrace, Lynnwood, Edmonds, and Kenmore all offer the perfect place to start!

MOUNTLAKE TERRACE
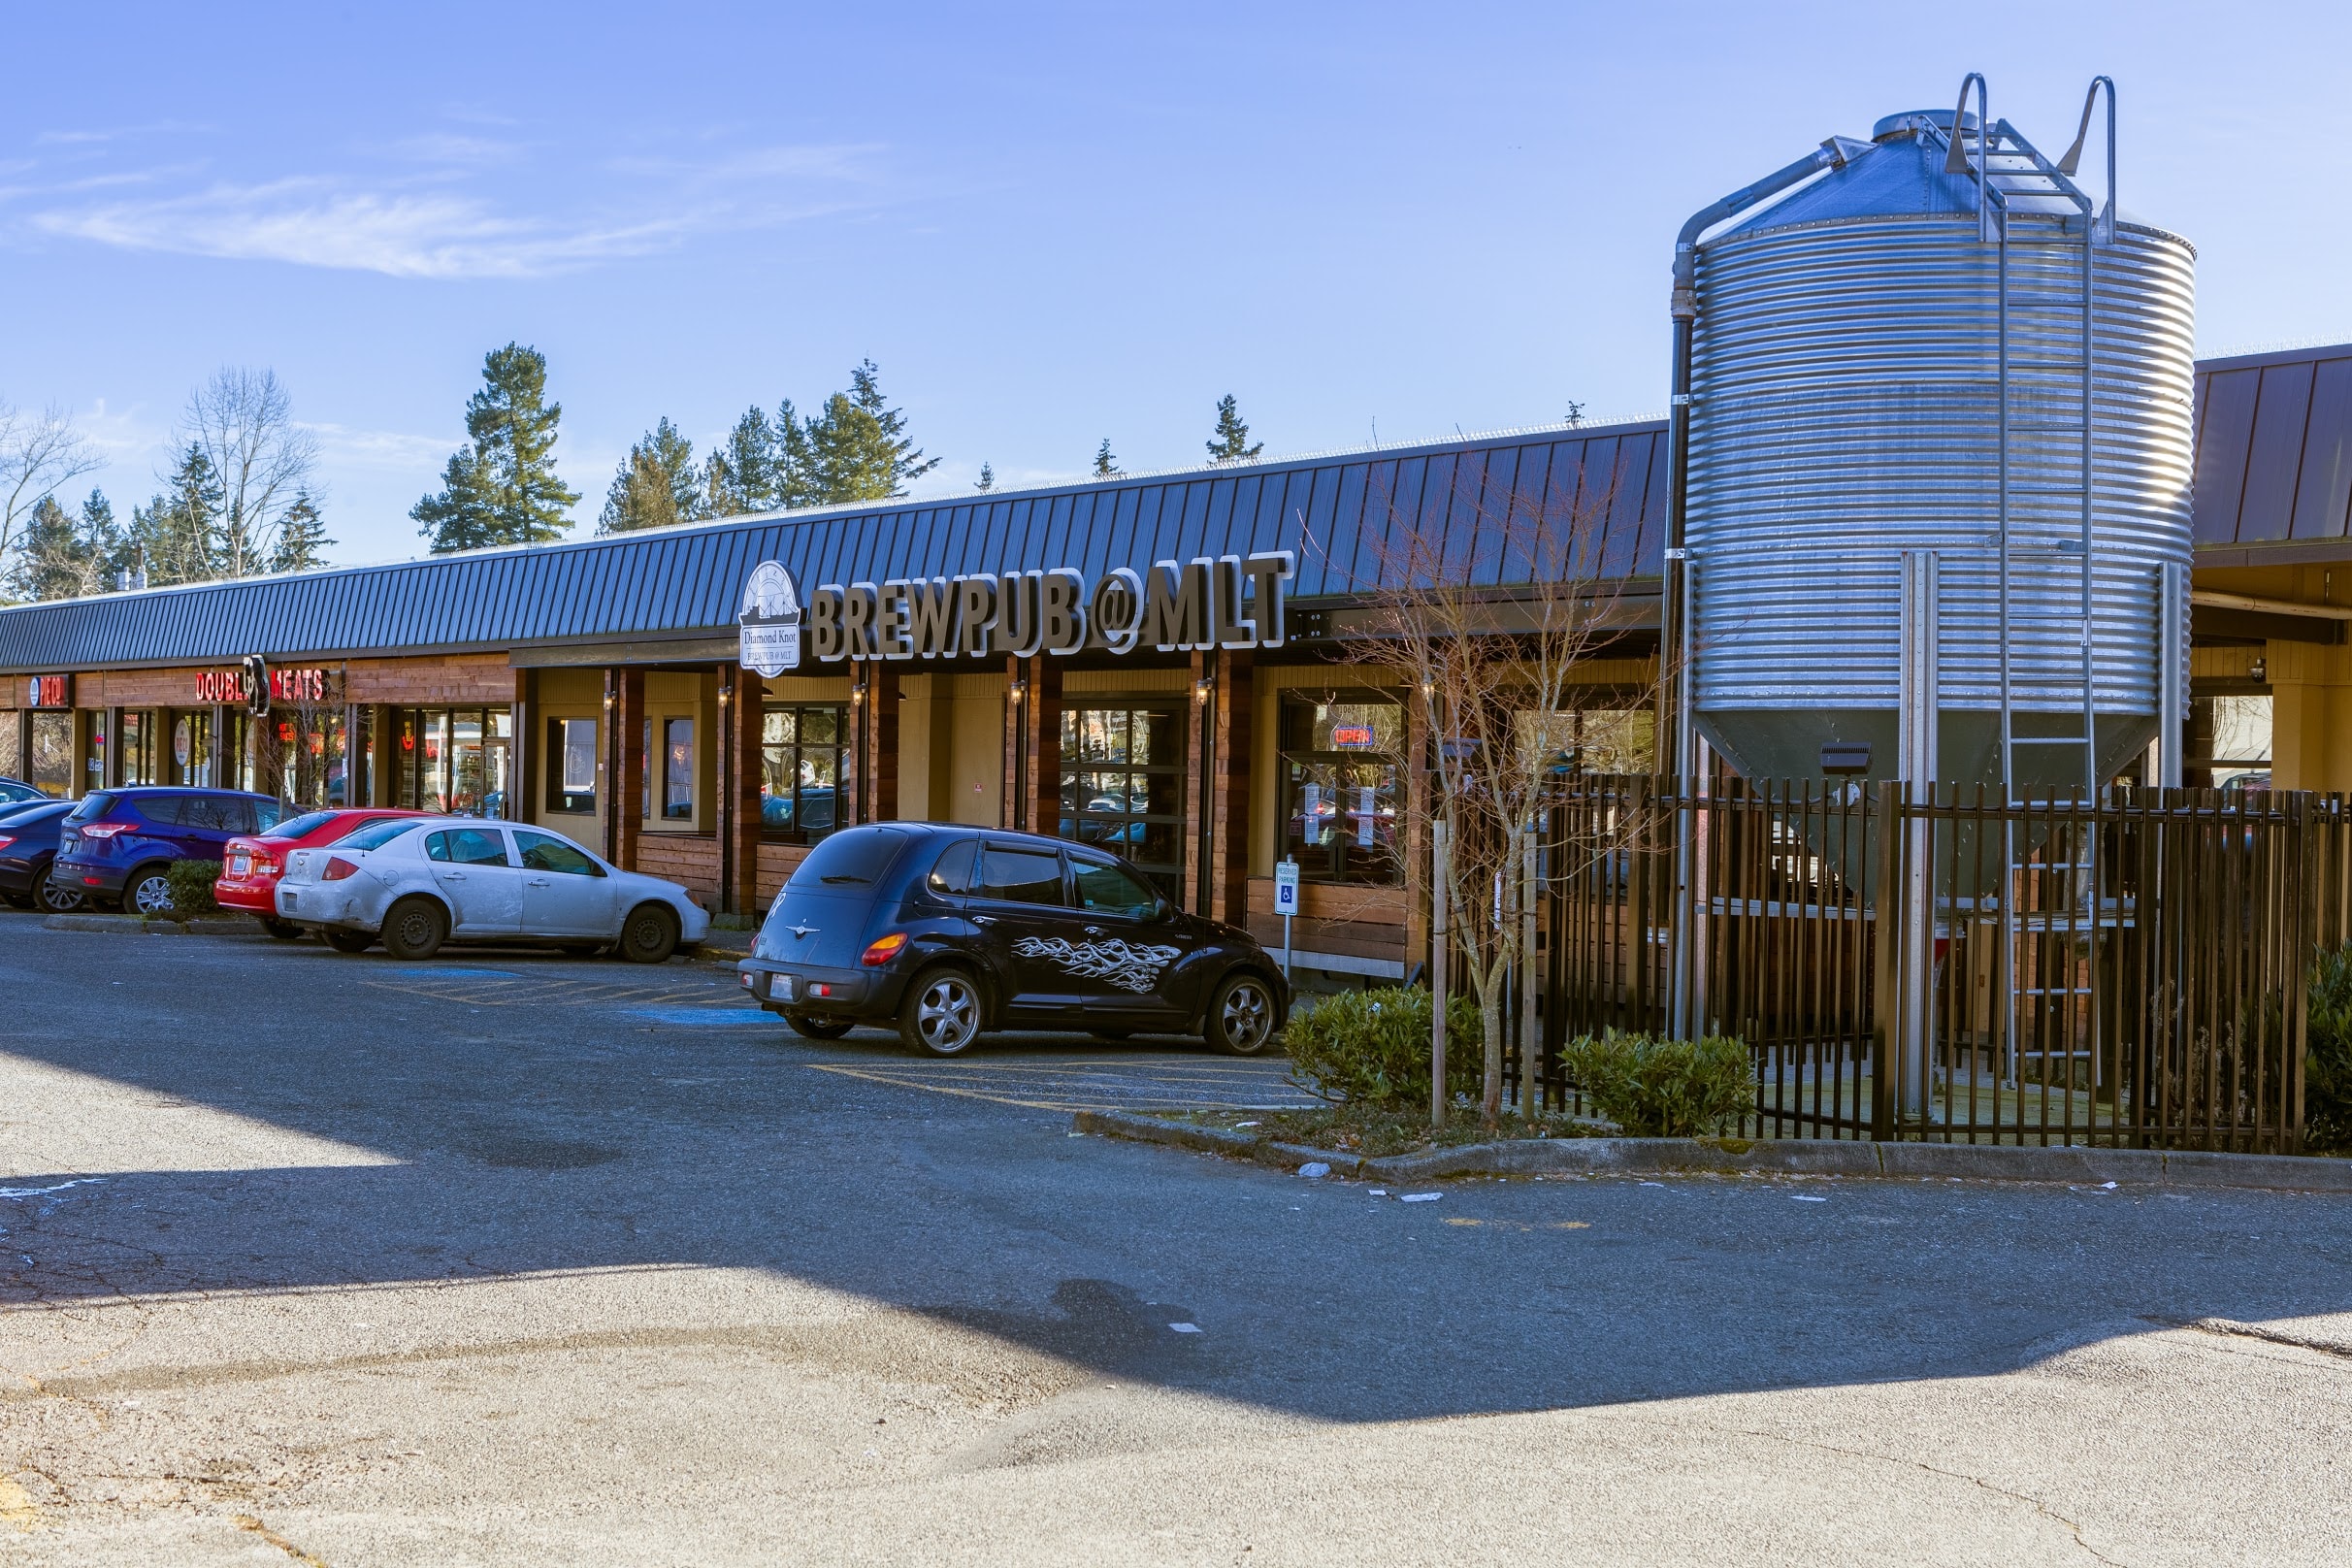
Diamond Knot Brewpub at MLT
- Located at 5602 232nd Street SW Mountlake Terrace, WA 98043
- Hours: Monday-Thursday 11am – 11pm, Friday 11am – Midnight, Saturday 8am – Midnight, Sunday 8am – 11pm
Recommended by both REALTOR® Brian Hayter and Shelly Katzer, the Diamond Knot Brewpub is a local favorite. Started by Bob Maphet and Brian Sollenberger as a hobby, Diamond Knot Craft Brewing now makes over 600 barrels of beer every single month! Diamond Knot mainstays include their India Pale Ale, Industrial IPA, Blonde Ale, Pipe Down Brown Ale, Above Board Pale Ale, E.S.B. Steamer Glide Stout, Possession Porter, and Hefeweizen.
TIP: You can also grab breakfast, lunch or dinner here, plus they’re family- and dog-friendly!
Learn more about Diamond Knot here:
LYNNWOOD
Big E Ales
- Located at 5030 208th St SW Suite A. Lynnwood, WA 98036
- Hours: Tuesday – Thursday 1pm – 10pm, Friday & Saturday 11am – 10pm
Brewing since 1997, Big E Ales serves up hand-crafted ales alongside a full, mouthwatering menu of delicious appetizers and entrees. You can stop by for a refreshing beer with friends, or even book the Brew Room for events like wedding receptions and company parties.
TIP: Their blog is packed with interesting beer history!
EDMONDS
Salish Sea Brewing Company
- Located at 518 Dayton St. #104 Edmonds, WA 98020
- Hours: Monday – Wednesday 3pm – 9pm, Thursday 3pm – 10pm, Friday – Saturday 12pm – 11pm, Sunday Noon – 8pm
Home to a variety of carefully crafted brews, Salish Sea Brewing Company is a staple of the region. Beer lovers can choose from their Drop Anchor IPA, Salish IPA Dayton Street (3 SEAS) Session ISA, Driftwood Pale, Honey Golden, NW “Wildfire” Red, Expansion Amber, Kodiak Brown Porter, Prior Porter, Big Chocolate Love: A Robust Porter, and the seasonal Blackfish Stout and Blizzzaak Winter Ale. In addition to grabbing an ice-cold brew, you can enjoy an evolving menu of sandwiches, soups, and appetizers.
TIP: Families are welcome, and dogs are allowed on the outside patio.
American Brewing Company
- Located at 180 W. Dayton St. Warehouse 102 Edmonds, WA 98020
- Hours: Monday – Thursday 3pm – 9pm, Friday 3 – 10pm, Saturday Noon – 10pm, Sunday Noon – 8pm
At American Brewing Company, craftsmanship and science are at the forefront of everything they do and create. Started in 2010 by Adam Frantz, American Brewing Company benefits from Adam’s years of practice and his worldwide travels that have influenced his craft beers. Their consistent offerings include an India Pale Ale, Pale Ale, Kolsch Ale, Stout, and a selection of seasonal and specialty beers.
TIP: These guys also brew 6 flavors of kombucha!
Gallagher’s Where-U-Brew
- Located at 180 W. Dayton St. #105 EDMONDS, WA
- Hours: Tuesday – Friday 2pm – 8pm, Saturday and Sunday 10am – 5pm
Ready to DIY your own brew?! Gallaghers Where-U-Brew offers an amazing opportunity to create your very own craft beer! They provide you with everything you need to brew a batch of beer… and it only takes 2 hours! They’re guide you through the different types of brews you can create, help you select what you’re most interested in, and assign you to a professional brewing kettle with instructions on how to get started. Then, you set a date (usually 2 weeks later) for you to go in a bottle your beer! Learn more about the process here.
TIP: You can also brew ciders, root beer, and make your own wine at Gallagher’s!
KENMORE
Nine Yards Brewing
- Located at 7324 NE 175th St., Suite A Kenmore, WA 98028
- Hours: Monday – Thursday 2pm – 10pm, Friday 2pm – midnight, Saturday 11am – midnight, Sunday 11am-10pm
Located right off the Burke Gillman trail in Kenmore, Nine Yards is a popular local establishment. Stop by for hand-crafted brews, food trucks, pinball machines, Skee ball… this happening place has it all, and is great for group gatherings or parties.
TIP: This establishment is open to all ages!
Cairn Brewing
- Located at 7204 NE 175th St. Bldg A, Kenmore, WA 98028
- Hours: Wednesday and Thursday 4pm – 9pm, Friday 3pm – 10pm, Saturday 11:30am – 10pm, Sunday 11:30am – 6pm
Cairn Brewing is a hub for beer drinkers and beer brewers alike. Stop by to enjoy a pint of the many on-tap offerings, 5 of which are always served directly from the tank! (There will also often be a food truck parked outside for your convenience!) Or, for those who are interested in learning the craft straight from the masters, sign up for a homebrewing class! Learn about the beer-making process, and actually brew a batch in class.
TIP: The Cairn Brewing taproom is family- and dog-friendly!