
 Facebook
 X
X
 Pinterest
 Copy Link
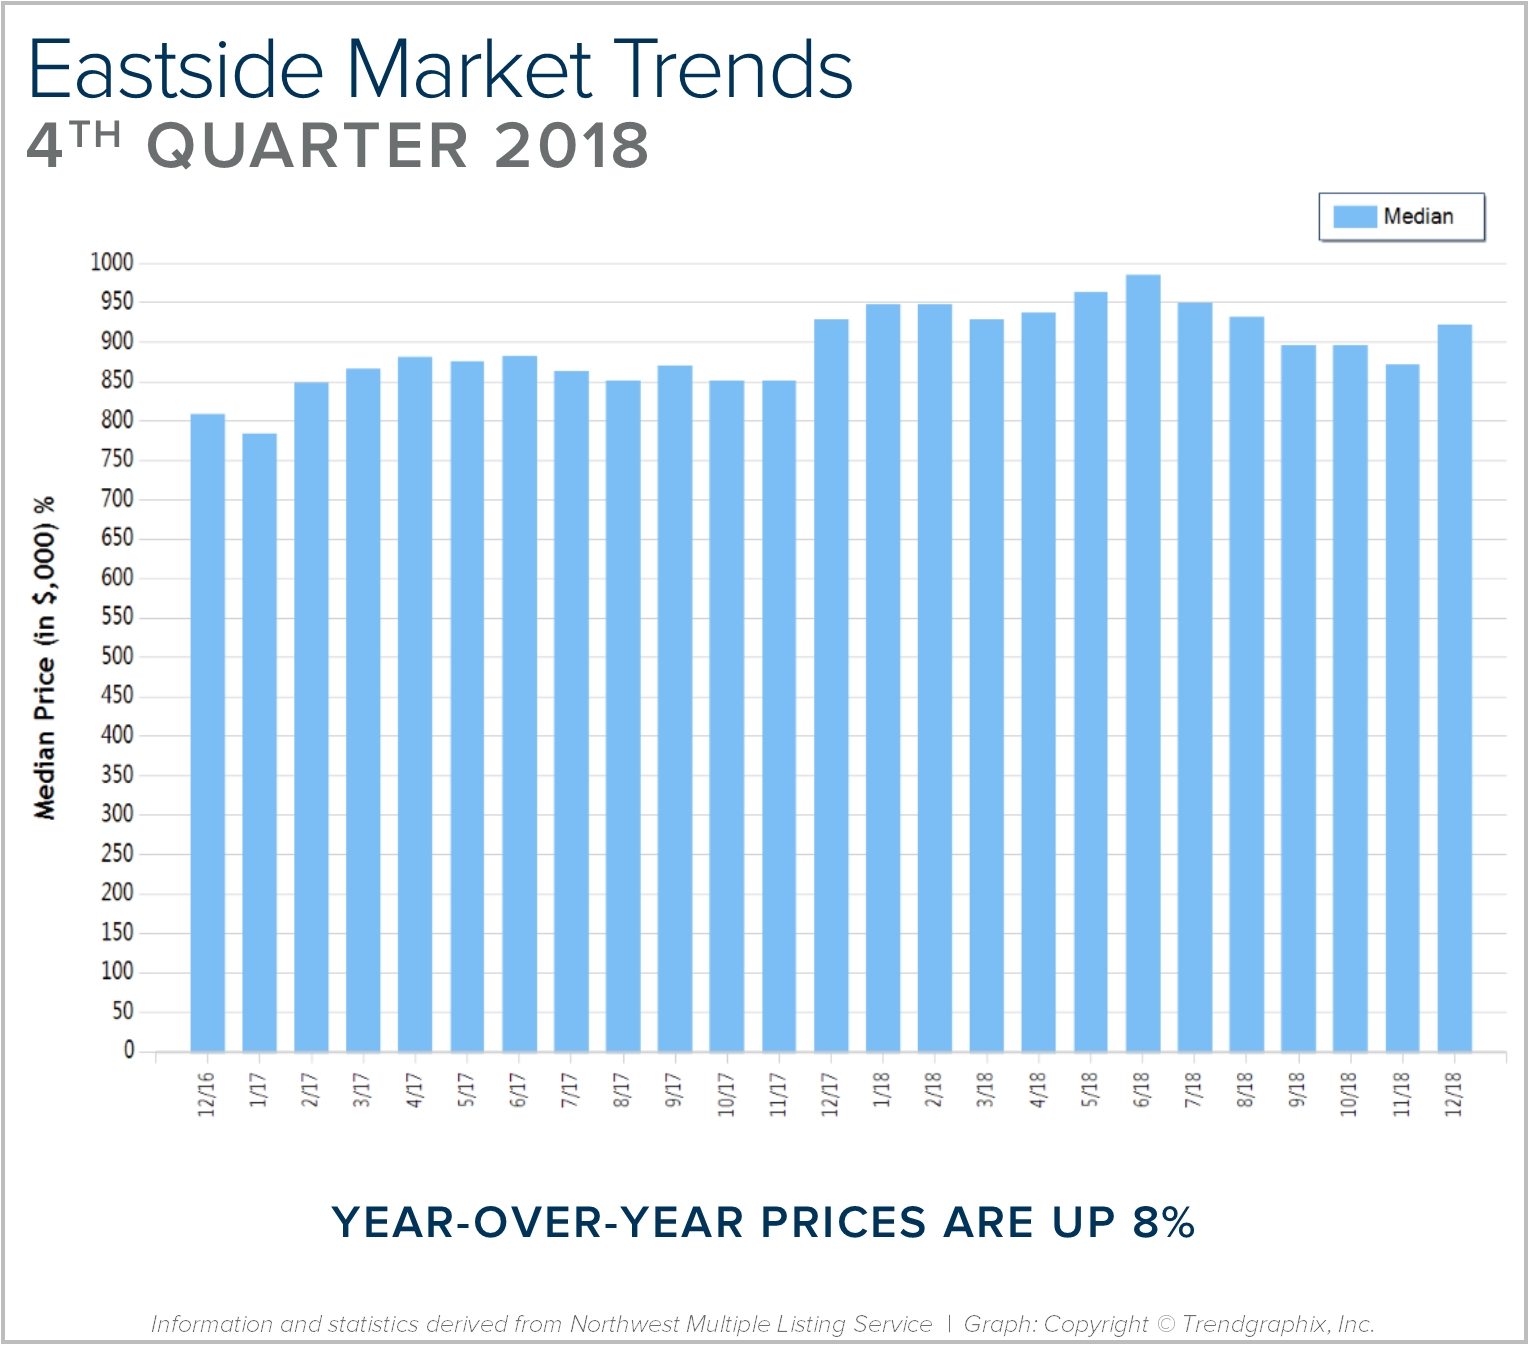
Quarterly Reports: Q4 Eastside
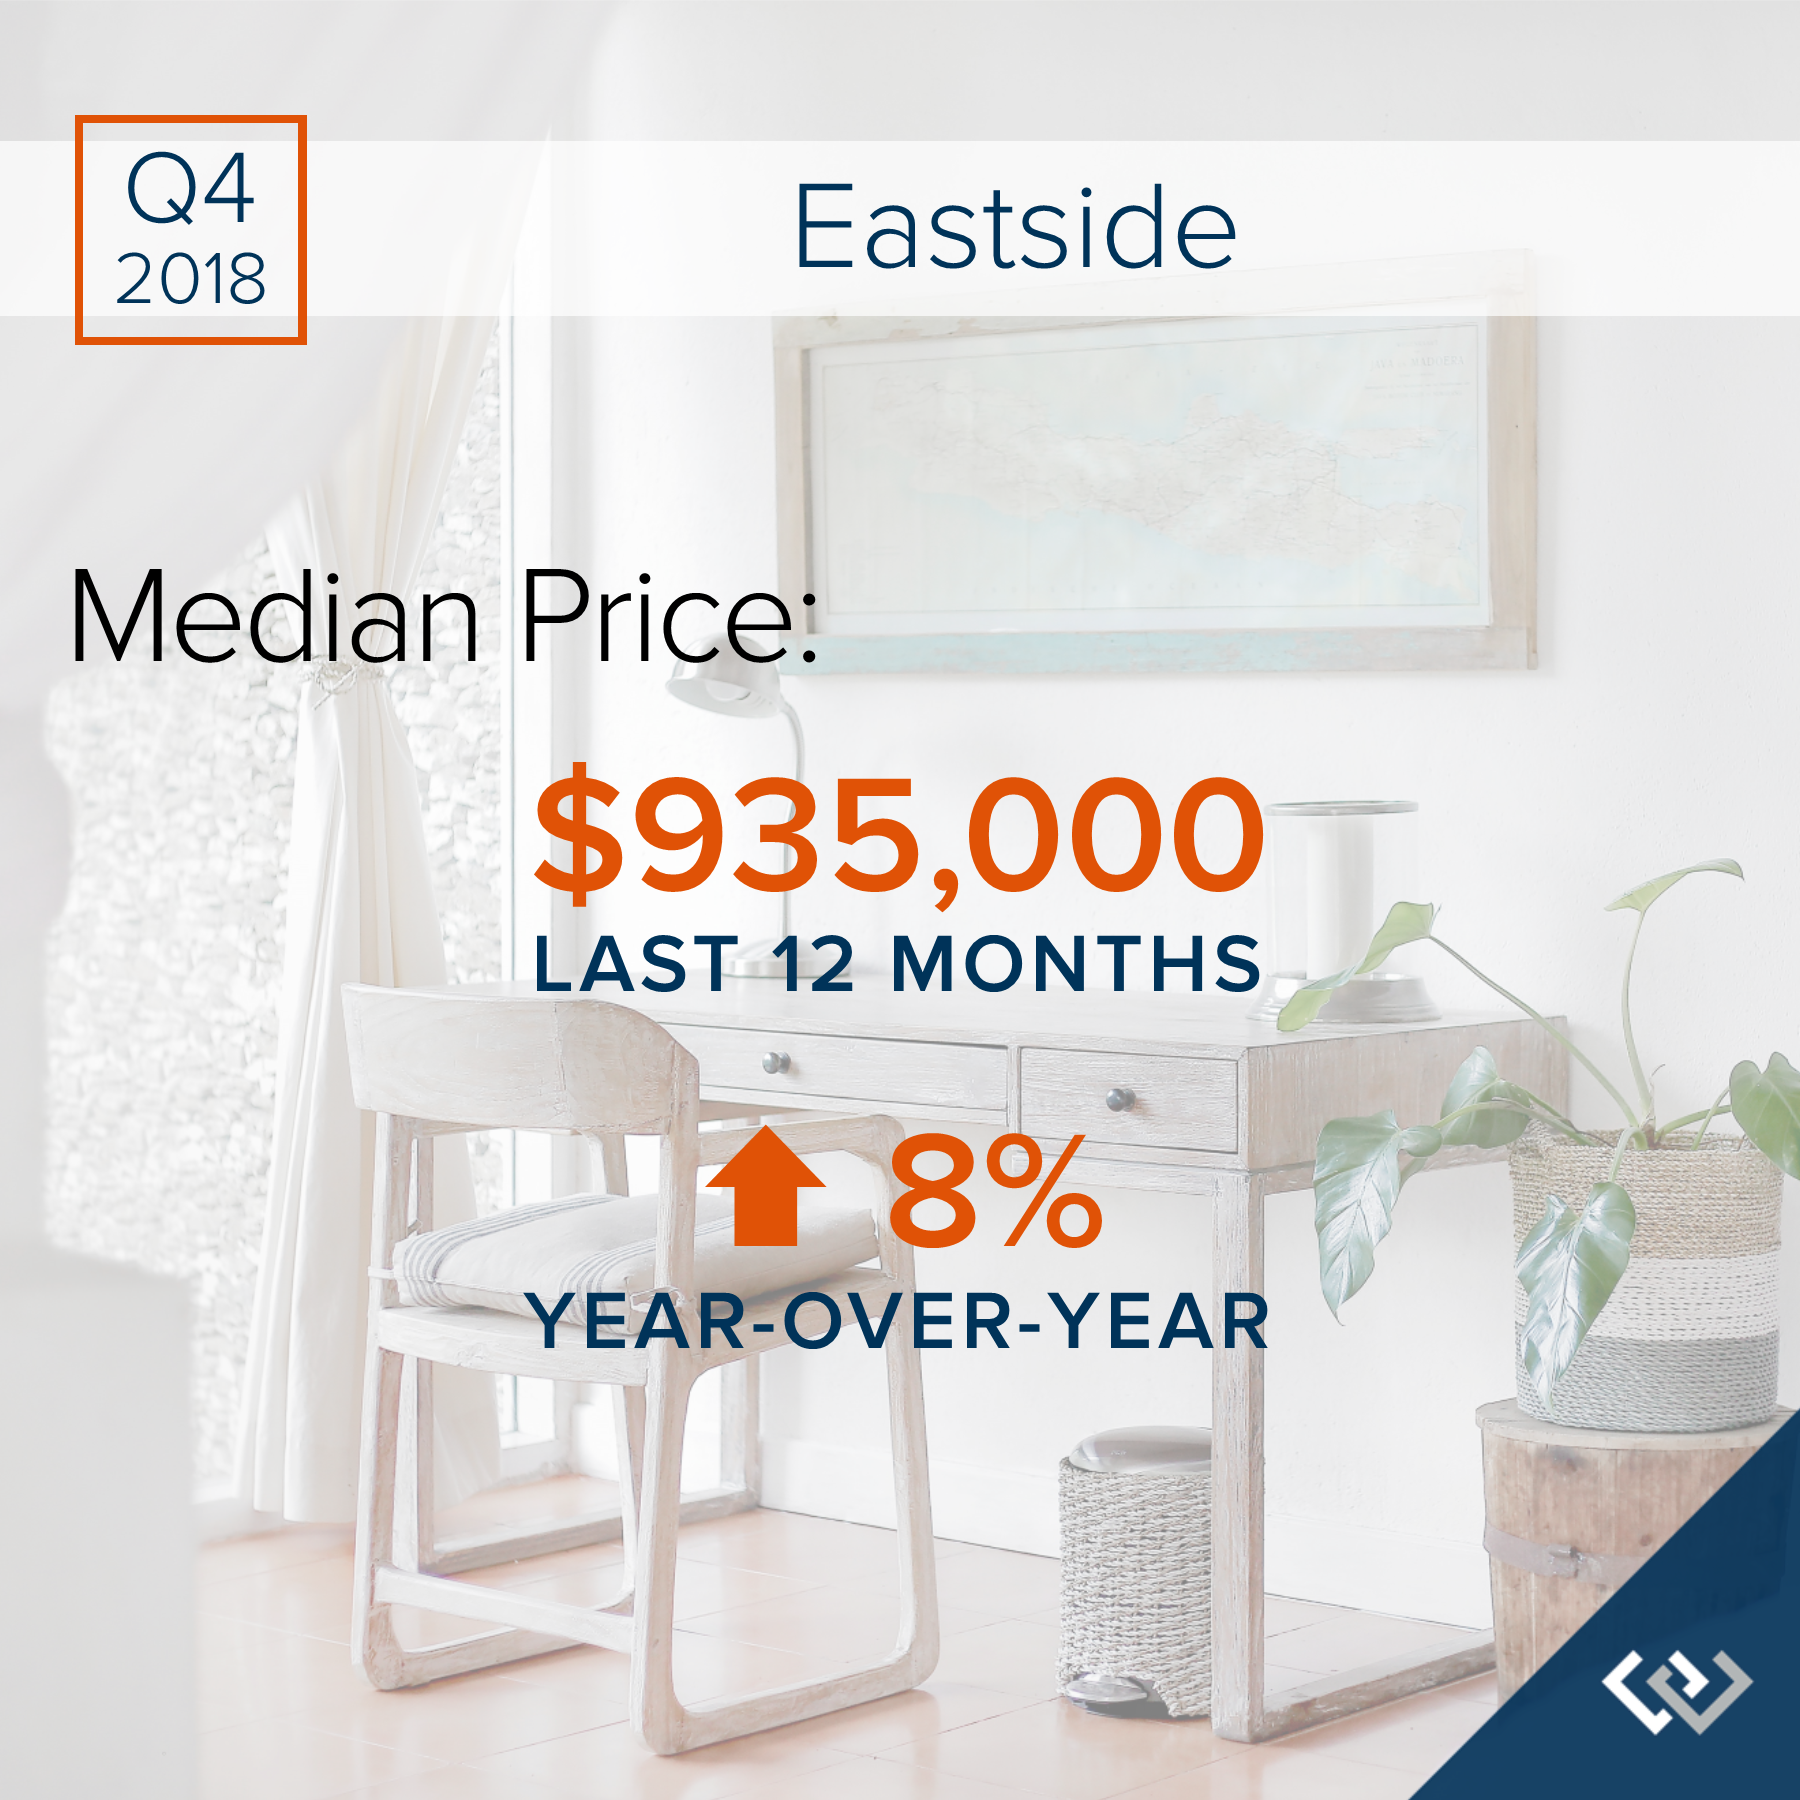
Q4: October 1 – December 31, 2018
EASTSIDE: 2018 was a year of change and growth. The market shifted from an extreme seller’s market, but still had strong gains. Year-over-year, median price is up 8% and since 2012 has increased 87%! Over the last 19 years, the average year-over-year price increase has been 6%. This puts into perspective the growth we have experienced, resulting in well-established equity levels. In 2018, inventory averaged 2 months, double that of 2017. This caused the month-over-month price gains to slow, and we experienced a price correction over the second half of the year. We expect to see more average levels of price appreciation in 2019 as the market continues to balance out.
After six years of expansion resulting in an extreme seller’s market, in 2018 we encountered a market shift in the late spring. Inventory increased, interest rates took a jump, and demand took a step back to re-evaluate the new playing field. This resulted in a tempering of month-over-month price appreciation, and has established some long-awaited balance. This balance has brought opportunities for both buyers and sellers. Buyers have more selection and are negotiating terms like inspection items and concessions. Sellers are sitting on 6+ years of equity growth, and are now able to sell their home and make a move without fearing where they will land next. Interest rates are still well below the 30-year average, currently hovering just under 5%. We are seeing demand start to re-engage now that the new normal has settled in.
This is only a snapshot of the trends on the Eastside; please contact us if you would like further explanation of how the latest trends relate to you.
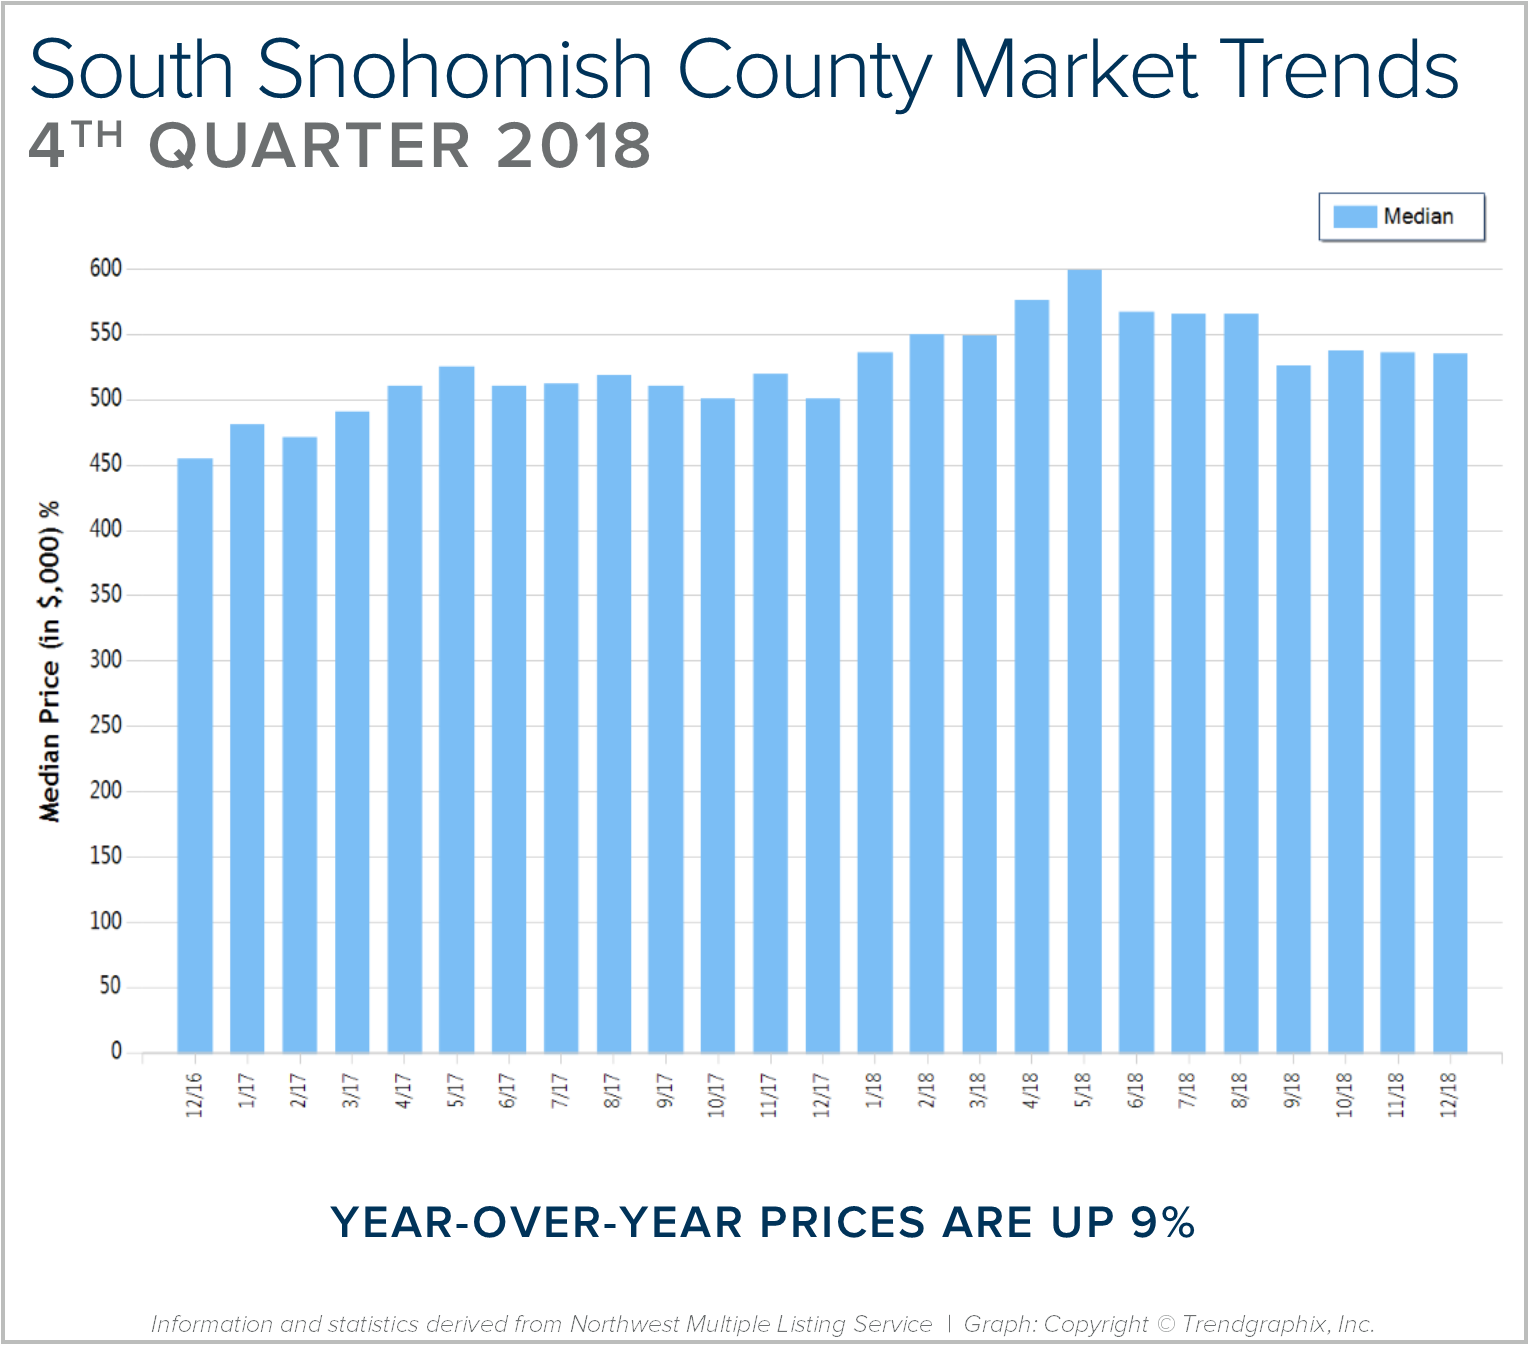
Quarterly Reports: Q4 South Snohomish County
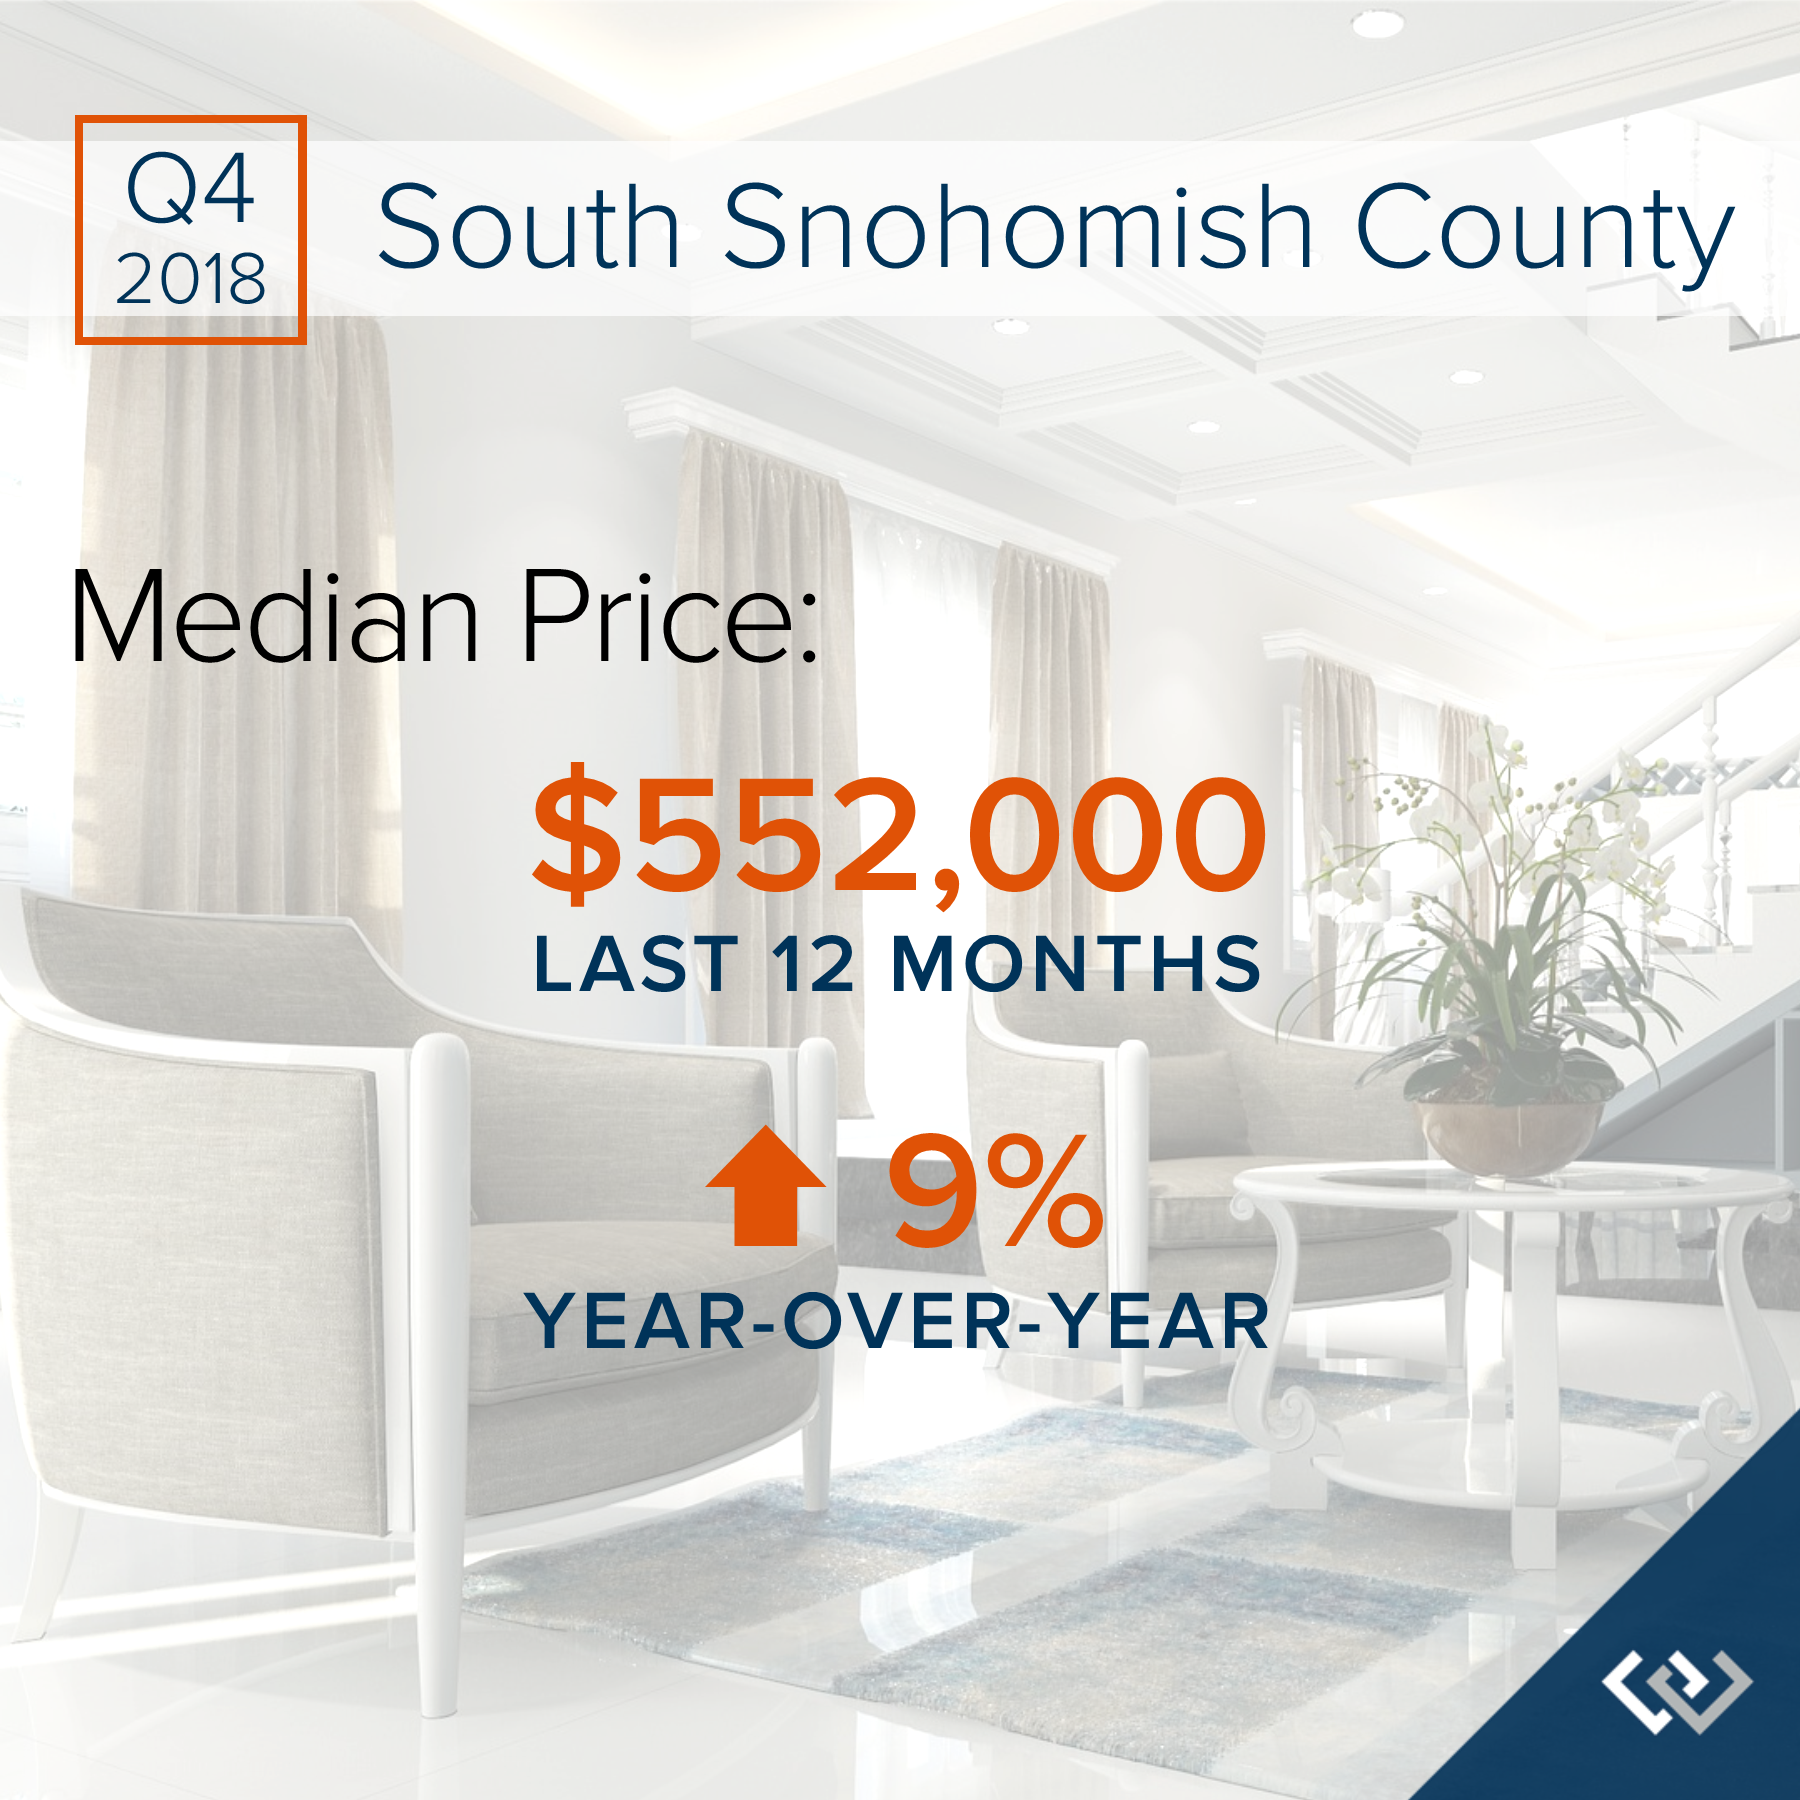
Q4: October 1 – December 31, 2018
SOUTH SNOHOMISH COUNTY: 2018 was a year of change and growth. The market shifted from an extreme seller’s market, but still had strong gains. Year-over-year, median price is up 9% and since 2012 has increased 85%! Over the last 19 years, the average year-over-year price increase has been 6%. This puts into perspective the growth we have experienced, resulting in well-established equity levels. In 2018, inventory averaged 1.5 months, double that of 2017. This caused the month-over-month price gains to slow, and we experienced a price correction over the second half of the year. We expect to see more average levels of price appreciation in 2019 as the market continues to balance out.
After six years of expansion resulting in an extreme seller’s market, in 2018 we encountered a market shift in the late spring. Inventory increased, interest rates took a jump, and demand took a step back to re-evaluate the new playing field. This resulted in a tempering of month-over-month price appreciation, and has established some long-awaited balance. This balance has brought opportunities for both buyers and sellers. Buyers have more selection and are negotiating terms like inspection items and concessions. Sellers are sitting on 6+ years of equity growth, and are now able to sell their home and make a move without fearing where they will land next. Interest rates are still well below the 30-year average, currently hovering just under 5%. We are seeing demand start to re-engage now that the new normal has settled in.
This is only a snapshot of the trends in south Snohomish County; please contact us if you would like further explanation of how the latest trends relate to you.
Quarterly Reports: Q3 South Snohomish
Q3: July 1 – September 30, 2018
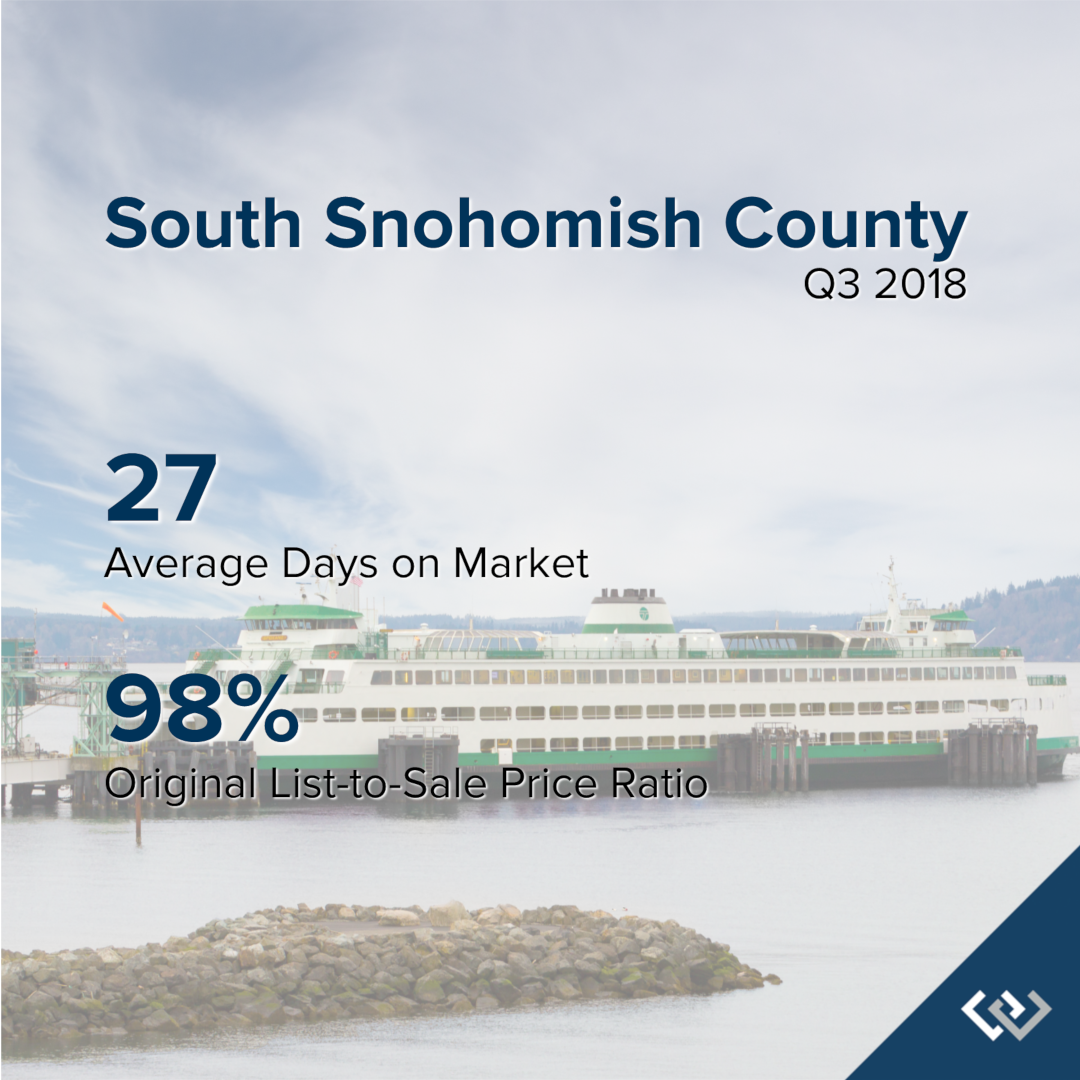
SOUTH SNOHOMISH COUNTY: In September, the average days on market landed at 27 days and the original list-to-sale price ratio 98%. Since May, inventory growth has been noticeable, and has given buyers more options. This has led to more negotiations and fewer bidding wars, which is tempering month-over-month price growth to a more sustainable level.
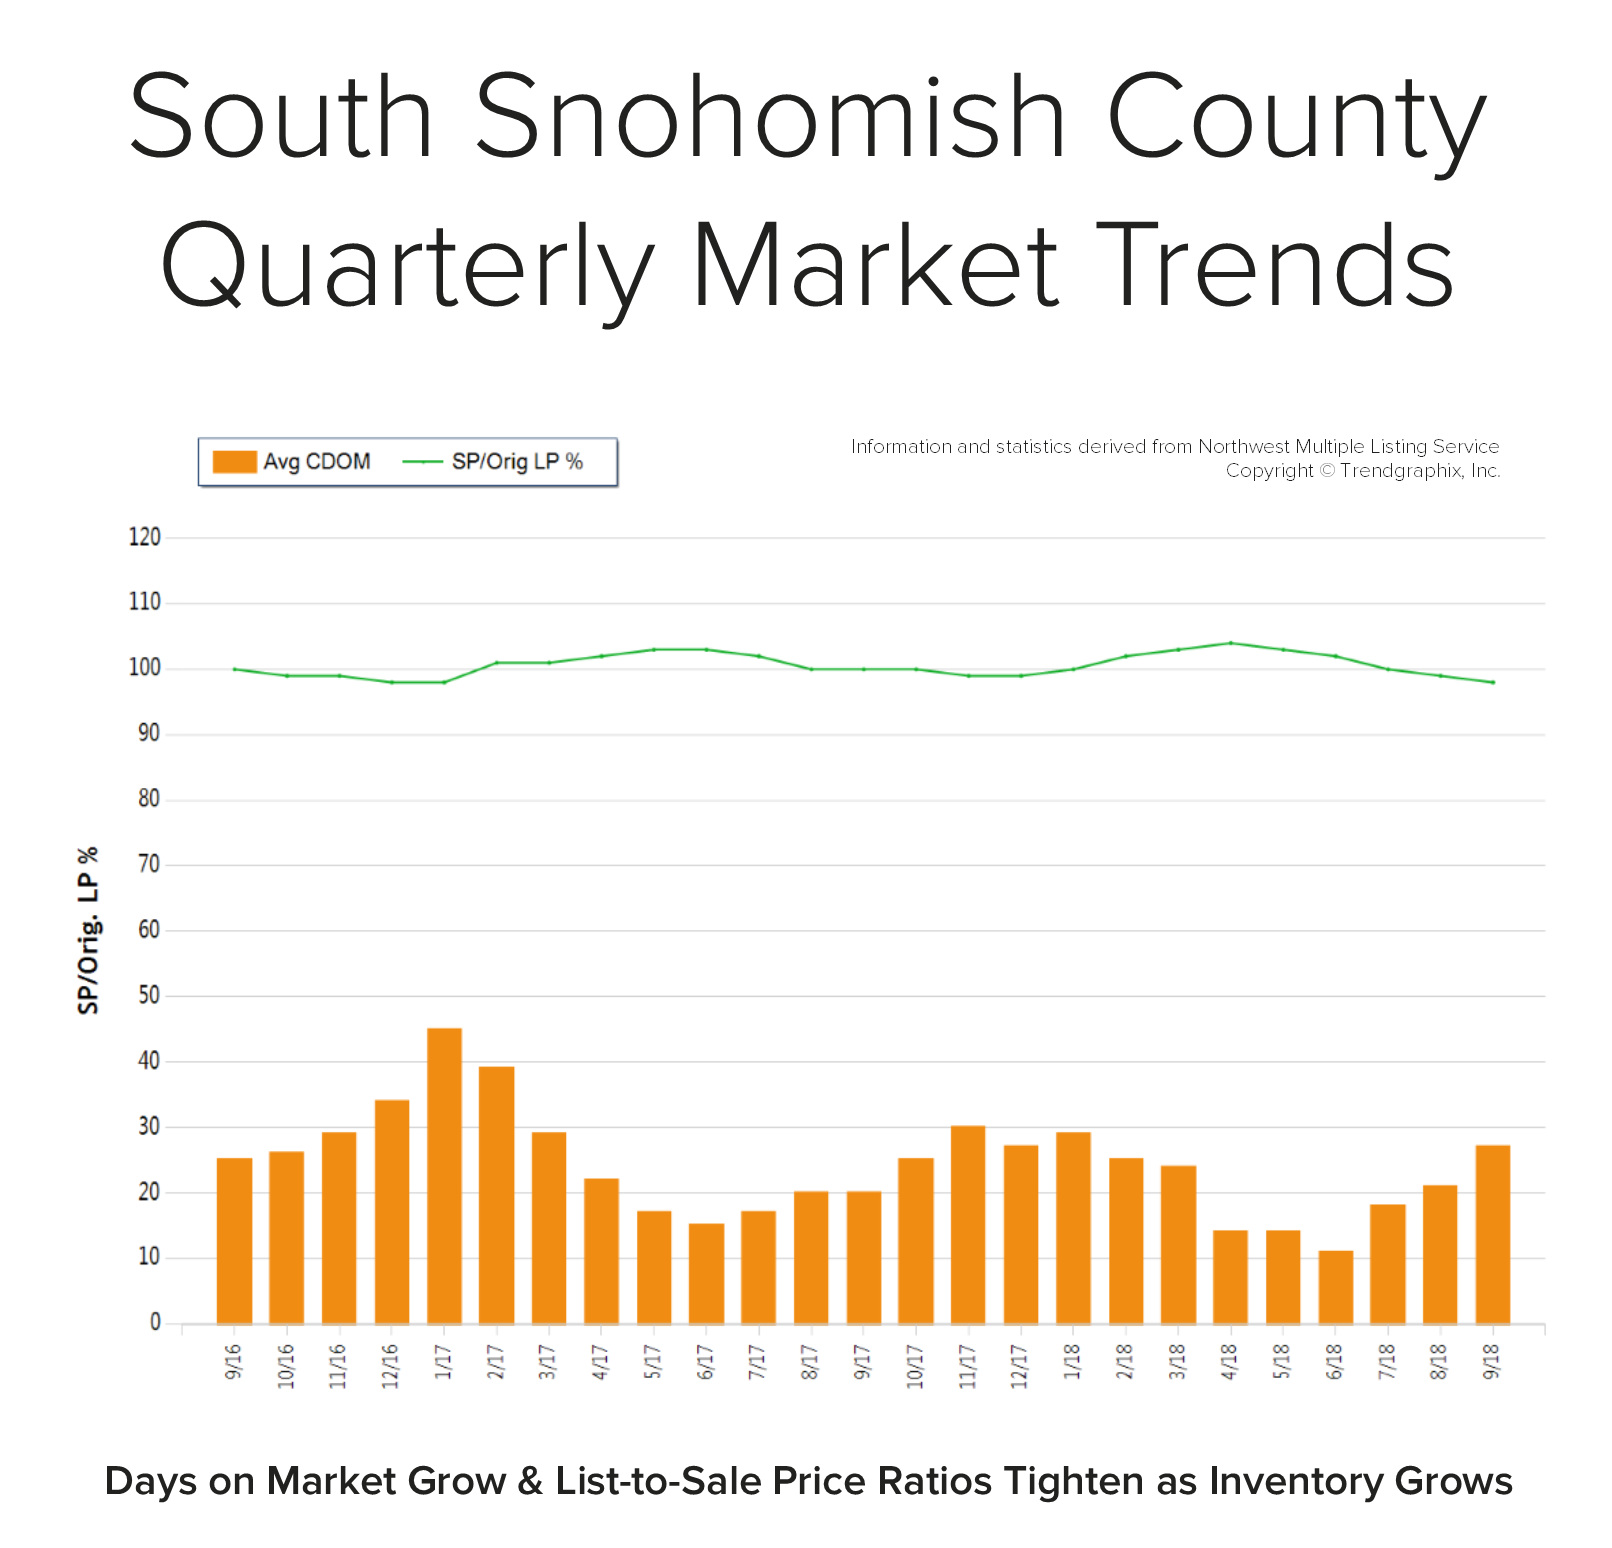 Back in April, the average days on market was 14 days and the original list-to-sale price ratio 104%; but months of inventory based on pending sales was 0.8 months, compared to 2.5 months currently. Year-over-year, prices are up 11%, still well above the historical norm of 3%-5% year-over-year gains—but note that the majority of this growth happened during the spring, due to constricted inventory levels.
Supply has increased, creating more options for buyers and helping to buffer affordability issues. Many sellers are deciding to make moves and cash in on the equity gained over the last six years. An average original list-to-sale price ratio of 98% is a positive return, yet illustrates a softening in the market after some very extreme times. With 11% price growth over the last 12-months in a seller’s favor, the increase in selection has led to more nimble moves from one house to another. Where sellers need to be careful is anticipating the month-over-month price growth we saw prior to the shift in inventory. Prospective buyers would be smart to take advantage of today’s historically low interest rates and the added inventory selection.
This is only a snapshot of the trends in south Snohomish County; please contact us if you would like further explanation of how the latest trends relate to you.
Quarterly Reports: Q3 North King
Q3: July 1 – September 30, 2018
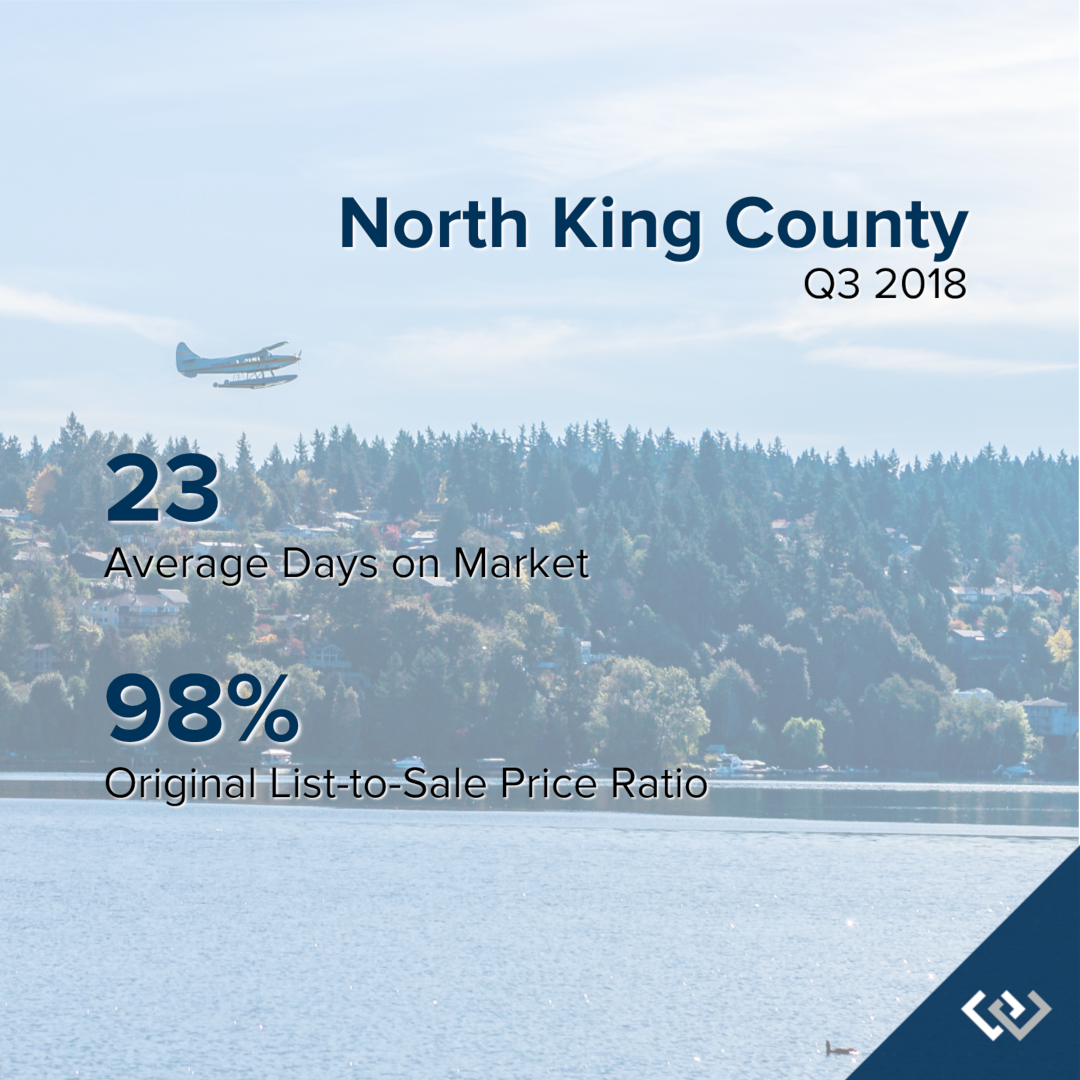
NORTH KING COUNTY: In September, the average days on market landed at 23 days and the original list-to-sale price ratio 98%. Since May, inventory growth has been noticeable, and has given buyers more options. This has led to more negotiations and fewer bidding wars, which is tempering month-over-month price growth to a more sustainable level.
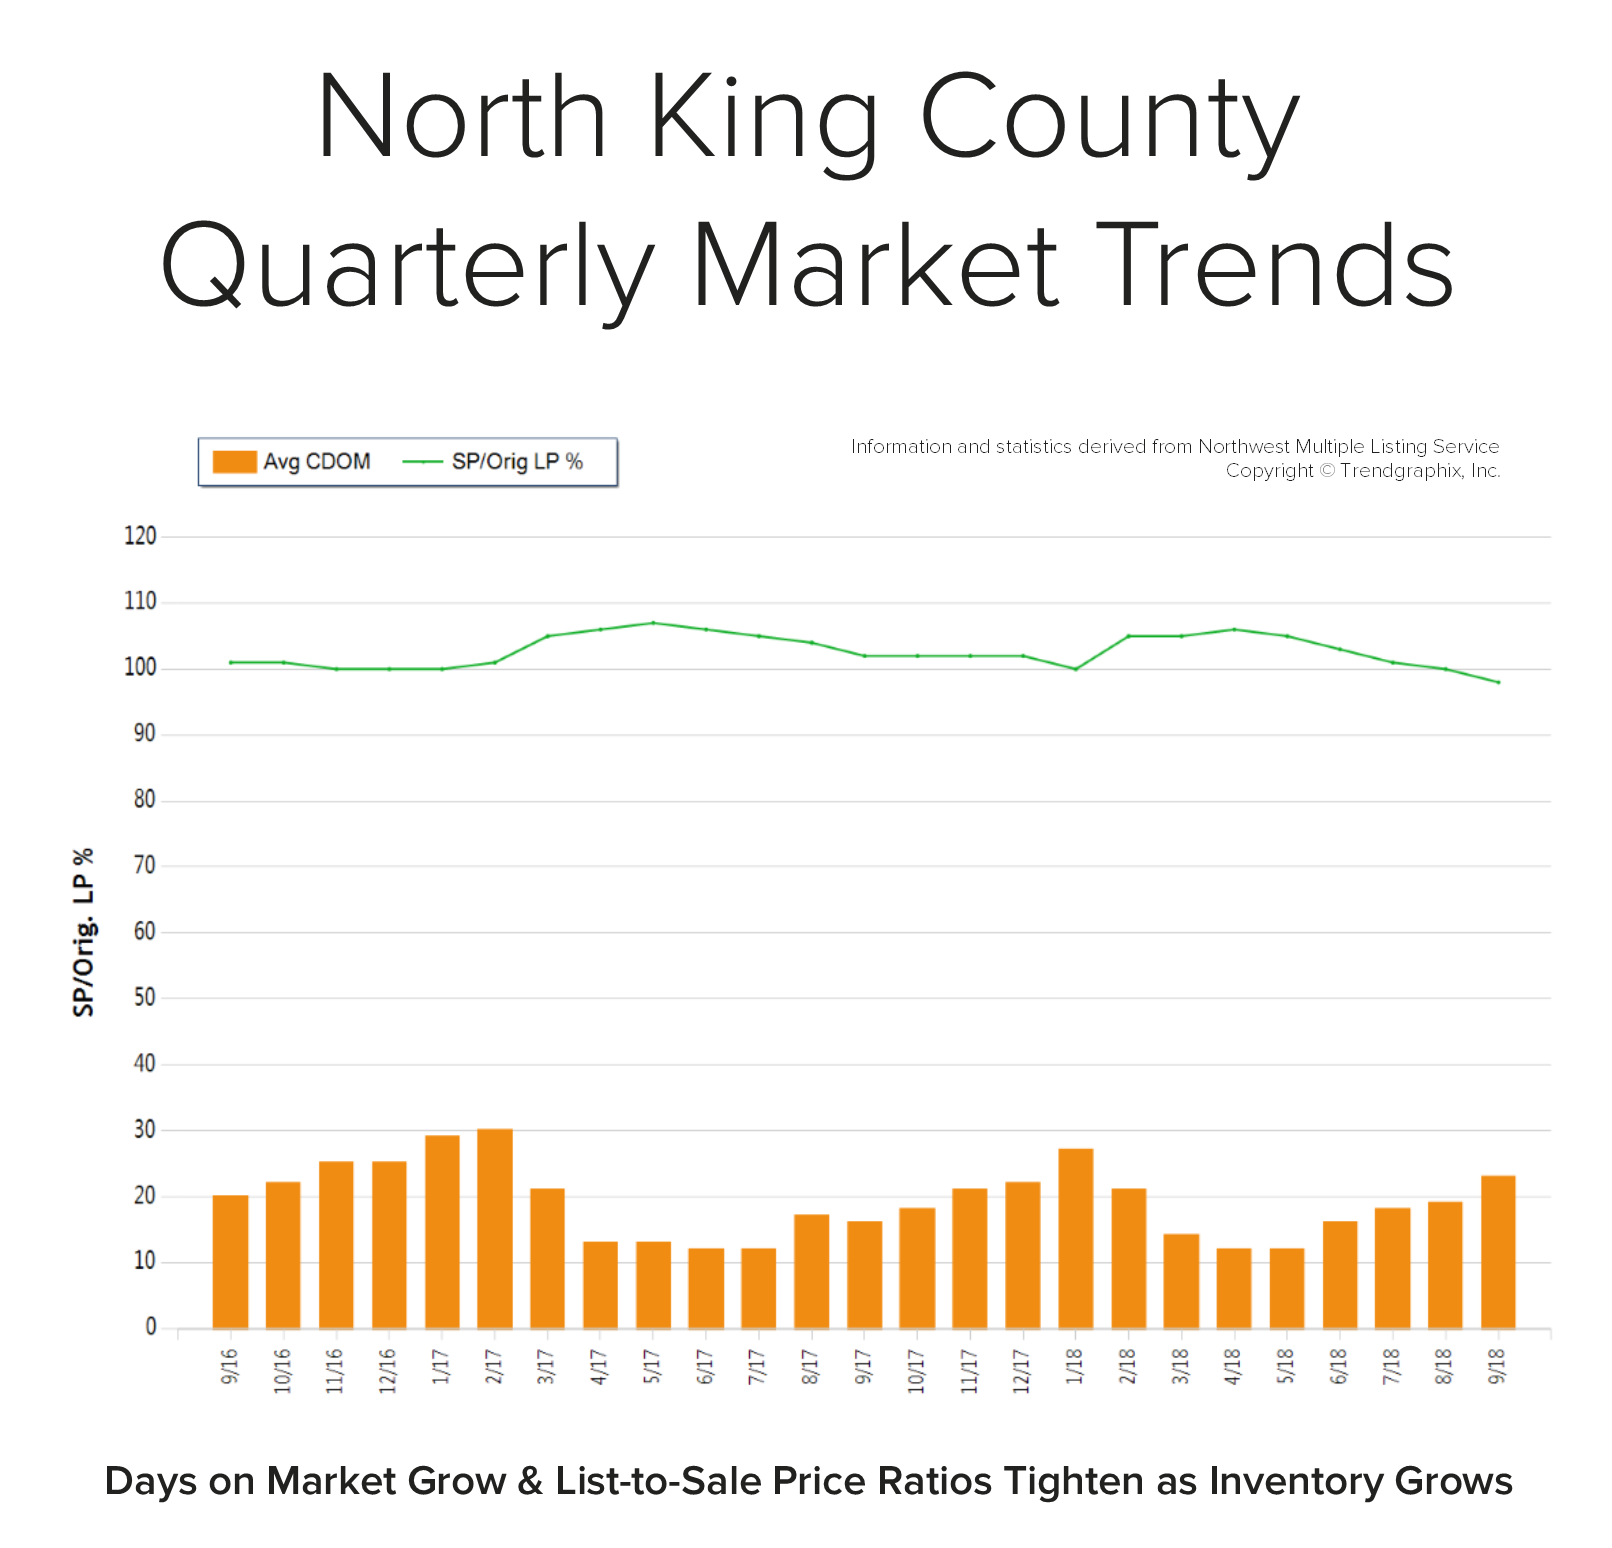 Back in April, the average days on market was 12 days and the original list-to-sale price ratio 106%; but months of inventory based on pending sales was 0.8 months, compared to 2.2 months currently. Year-over-year, prices are up 10%, still well above the historical norm of 3%-5% year-over-year gains—but note that the majority of this growth happened during the spring, due to constricted inventory levels.
Supply has increased, creating more options for buyers and helping to buffer affordability issues. Many sellers are deciding to make moves and cash in on the equity gained over the last six years. An average original list-to-sale price ratio of 98% is a positive return, yet illustrates a softening in the market after some very extreme times. With 10% price growth over the last 12-months in a seller’s favor, the increase in selection has led to more nimble moves from one house to another. Where sellers need to be careful is anticipating the month-over-month price growth we saw prior to the shift in inventory. Prospective buyers would be smart to take advantage of today’s historically low interest rates and the added inventory selection.
This is only a snapshot of the trends in north King County; please contact us if you would like further explanation of how the latest trends relate to you.
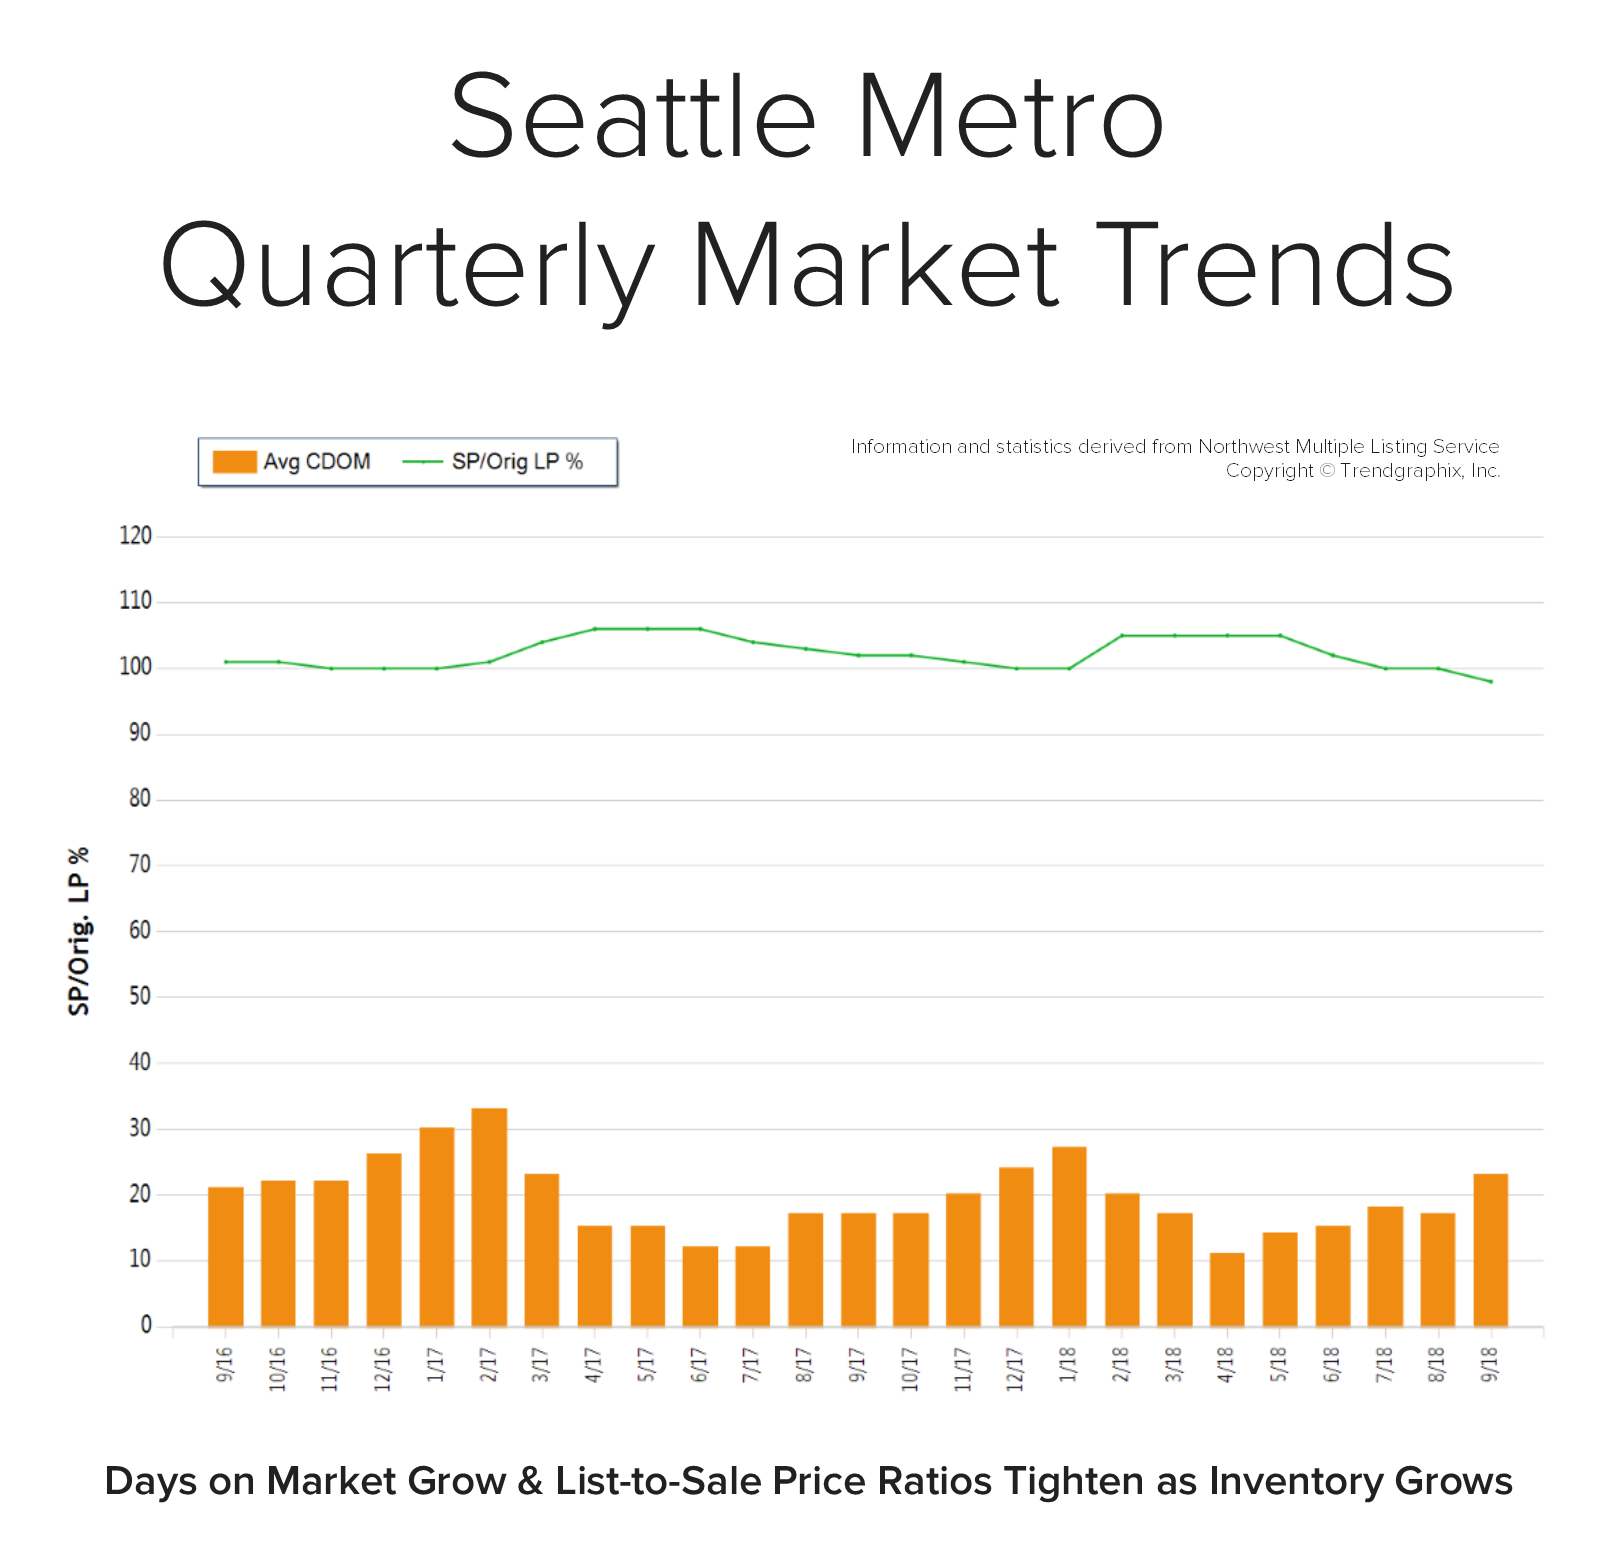
Quarterly Reports: Q3 Seattle Metro
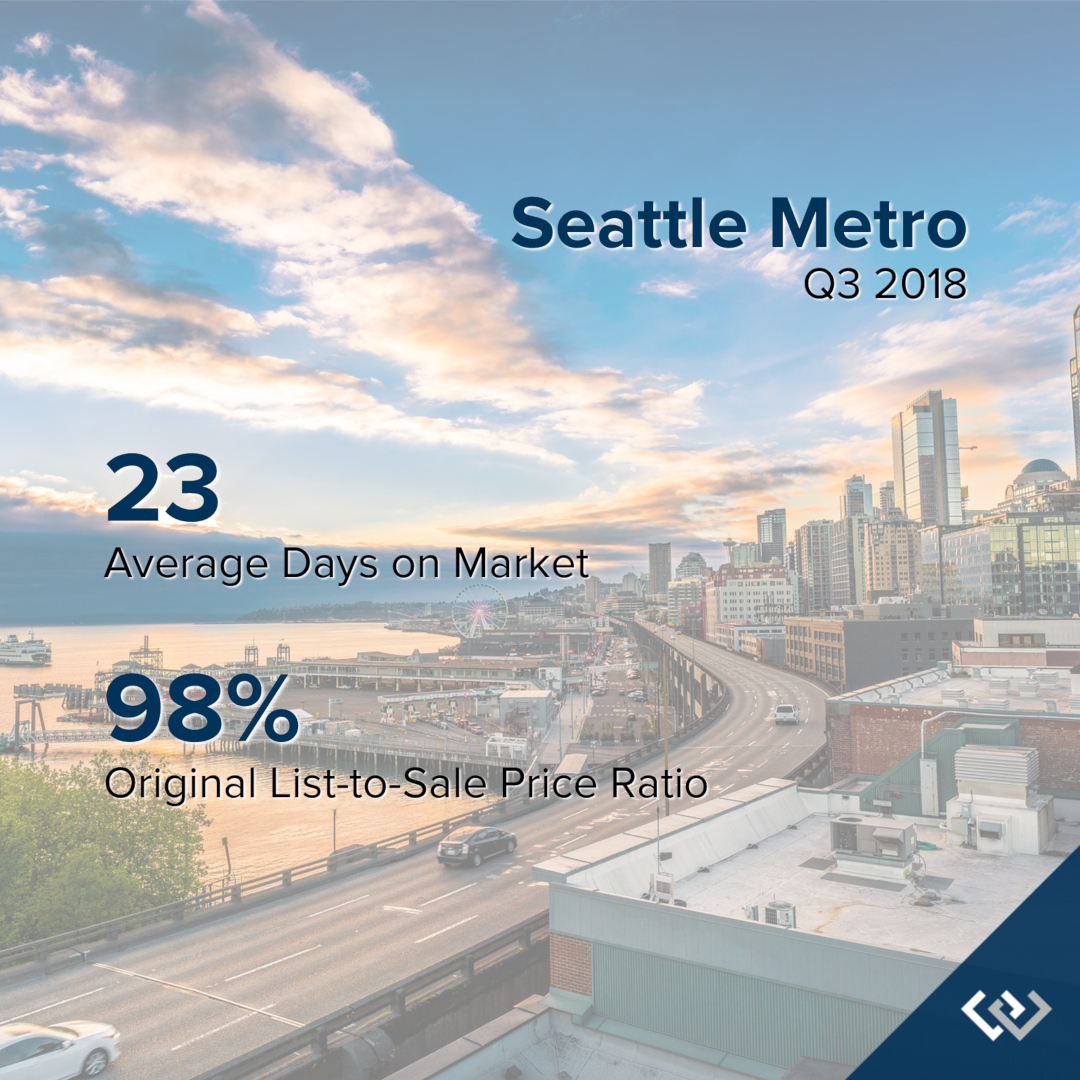
Q3: July 1 – September 30, 2018
SEATTLE METRO: In September, the average days on market landed at 23 days and the original list-to-sale price ratio 98%. Since May, inventory growth has been noticeable, and has given buyers more options. This has led to more negotiations and fewer bidding wars, which is tempering month-over-month price growth to a more sustainable level.
 Back in April, the average days on market was 11 days and the original list-to-sale price ratio 105%; but months of inventory based on pending sales was 0.8 months, compared to 2.4 months currently. Year-over-year, prices are up 11%, still well above the historical norm of 3%-5% year-over-year gains—but note that the majority of this growth happened during the spring, due to constricted inventory levels.
Supply has increased, creating more options for buyers and helping to buffer affordability issues. Many sellers are deciding to make moves and cash in on the equity gained over the last six years. An average original list-to-sale price ratio of 98% is a positive return, yet illustrates a softening in the market after some very extreme times. With 10% price growth over the last 12-months in a seller’s favor, the increase in selection has led to more nimble moves from one house to another. Where sellers need to be careful is anticipating the month-over-month price growth we saw prior to the shift in inventory. Prospective buyers would be smart to take advantage of today’s historically low interest rates and the added inventory selection.
This is only a snapshot of the trends in the Seattle Metro area; please contact us if you would like further explanation of how the latest trends relate to you.
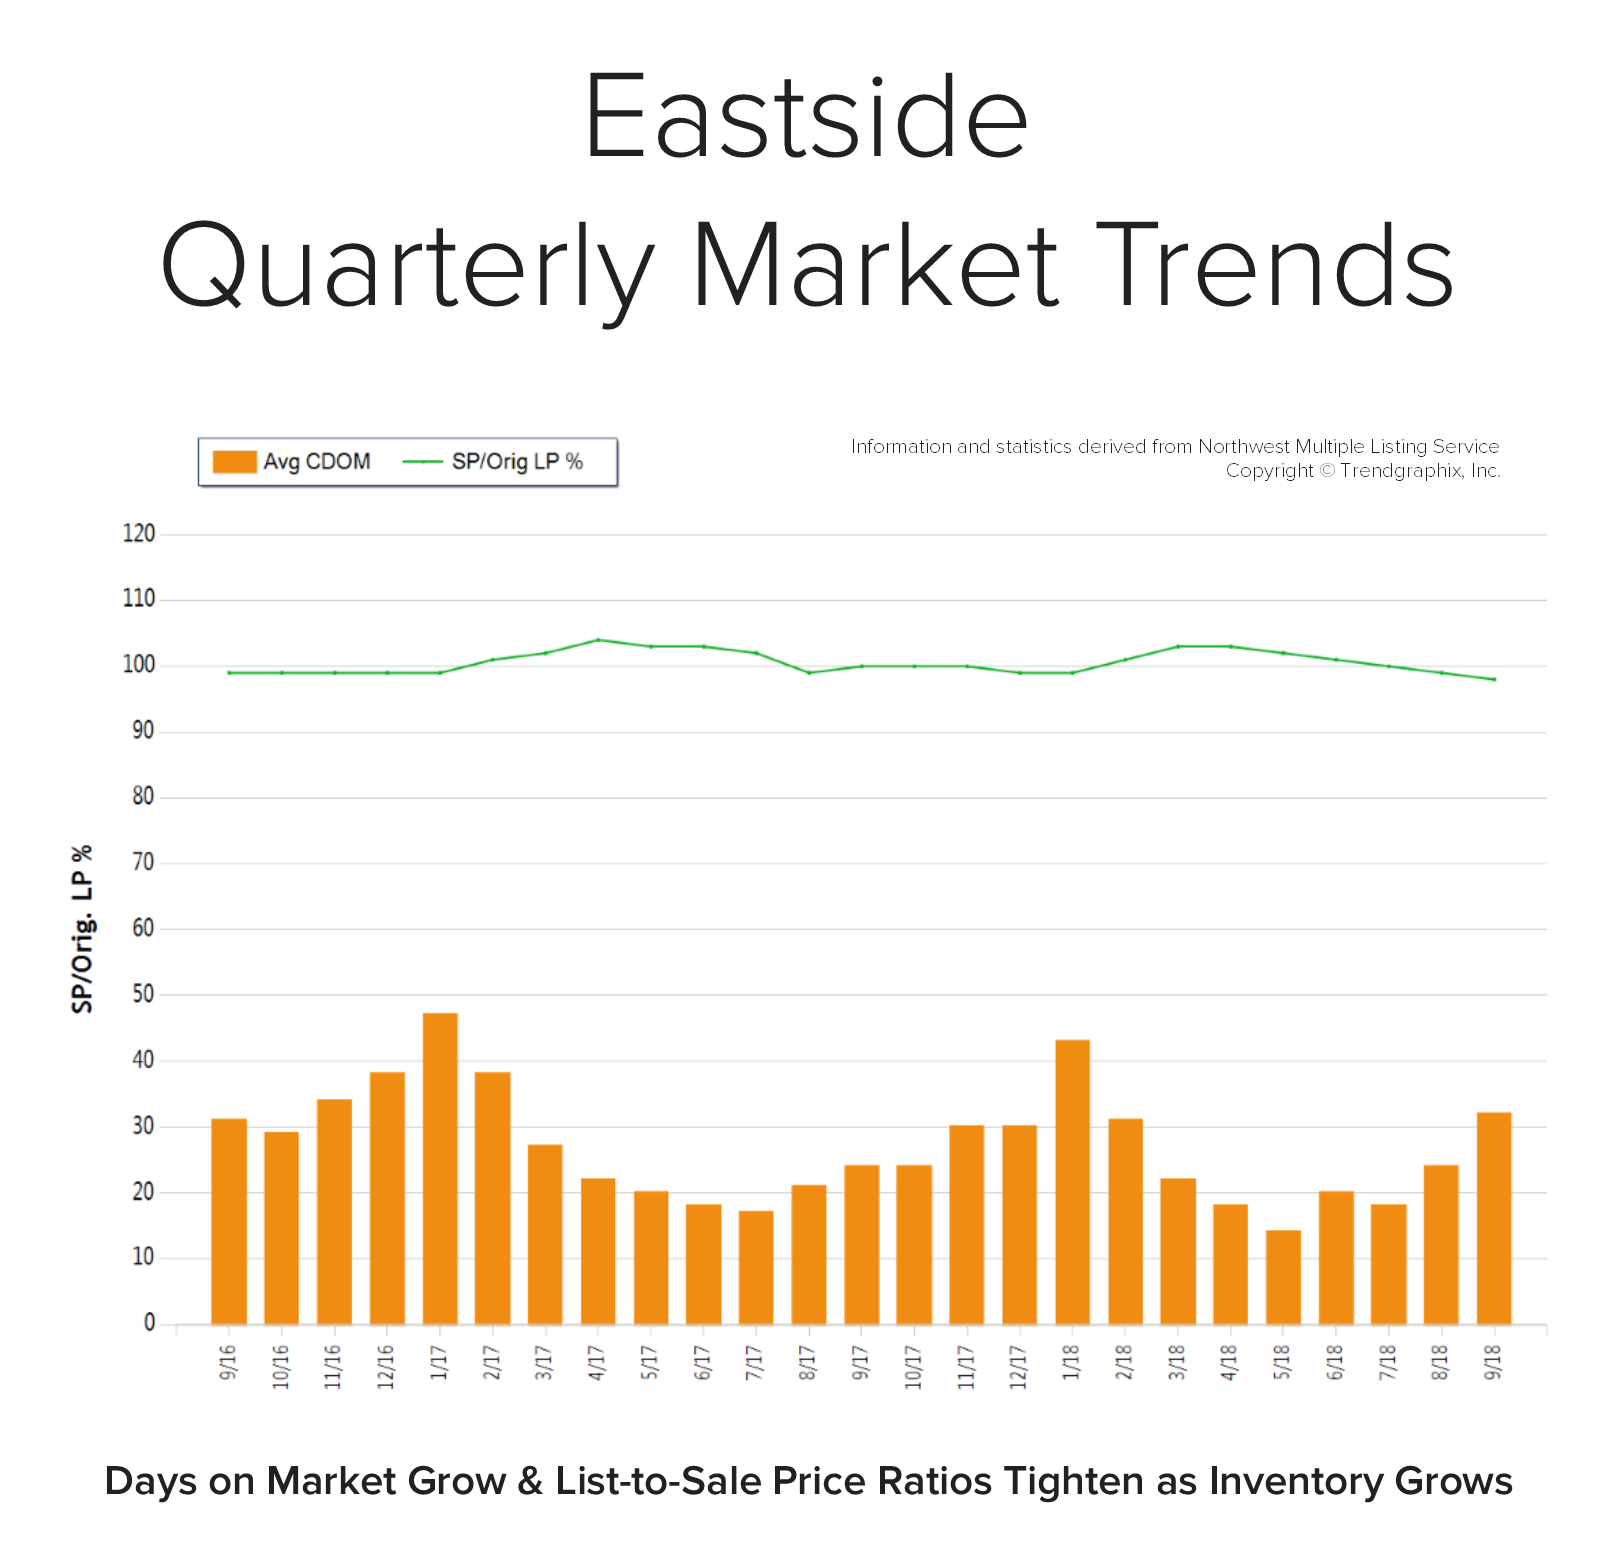
Quarterly Reports: Q3 Eastside
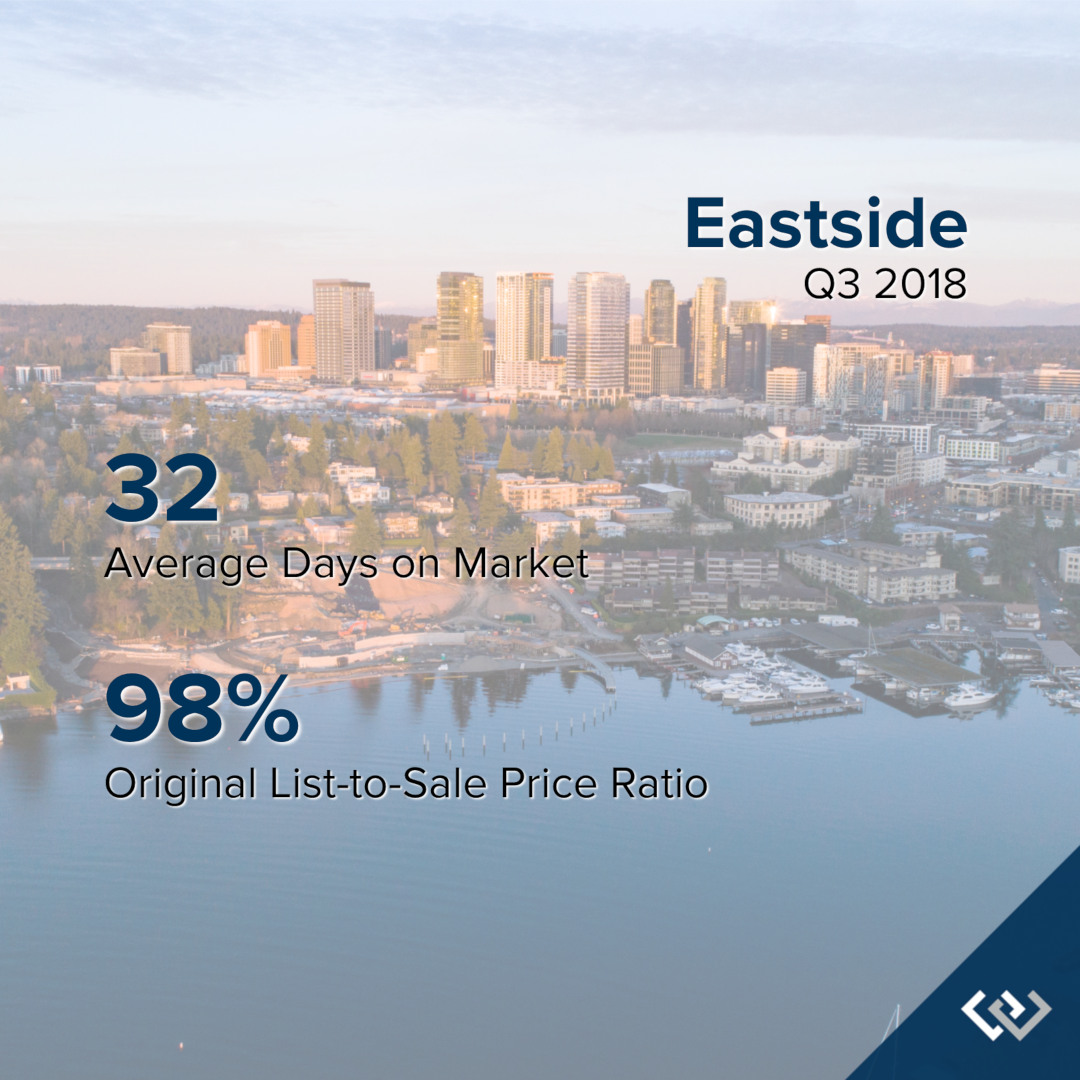
Q3: July 1 – September 30, 2018
THE EASTSIDE: In September, the average days on market landed at 32 days and the original list-to-sale price ratio 98%. Since May, inventory growth has been noticeable, and has given buyers more options. This has led to more negotiations and fewer bidding wars, which is tempering month-over-month price growth to a more sustainable level.
 Back in April, the average days on market was 13 days and the original list-to-sale price ratio 103%; but months of inventory based on pending sales was 0.8 months, compared to 2.9 months currently. Year-over-year, prices are up 10%, still well above the historical norm of 3%-5% year-over-year gains—but note that the majority of this growth happened during the spring, due to constricted inventory levels.
Supply has increased, creating more options for buyers and helping to buffer affordability issues. Many sellers are deciding to make moves and cash in on the equity gained over the last six years. An average original list-to-sale price ratio of 98% is a positive return, yet illustrates a softening in the market after some very extreme times. With 10% price growth over the last 12-months in a seller’s favor, the increase in selection has led to more nimble moves from one house to another. Where sellers need to be careful is anticipating the month-over-month price growth we saw prior to the shift in inventory. Prospective buyers would be smart to take advantage of today’s historically low interest rates and the added inventory selection.
This is only a snapshot of the trends on the Eastside; please contact us if you would like further explanation of how the latest trends relate to you.
Quarterly Reports: Q3 North Snohomish
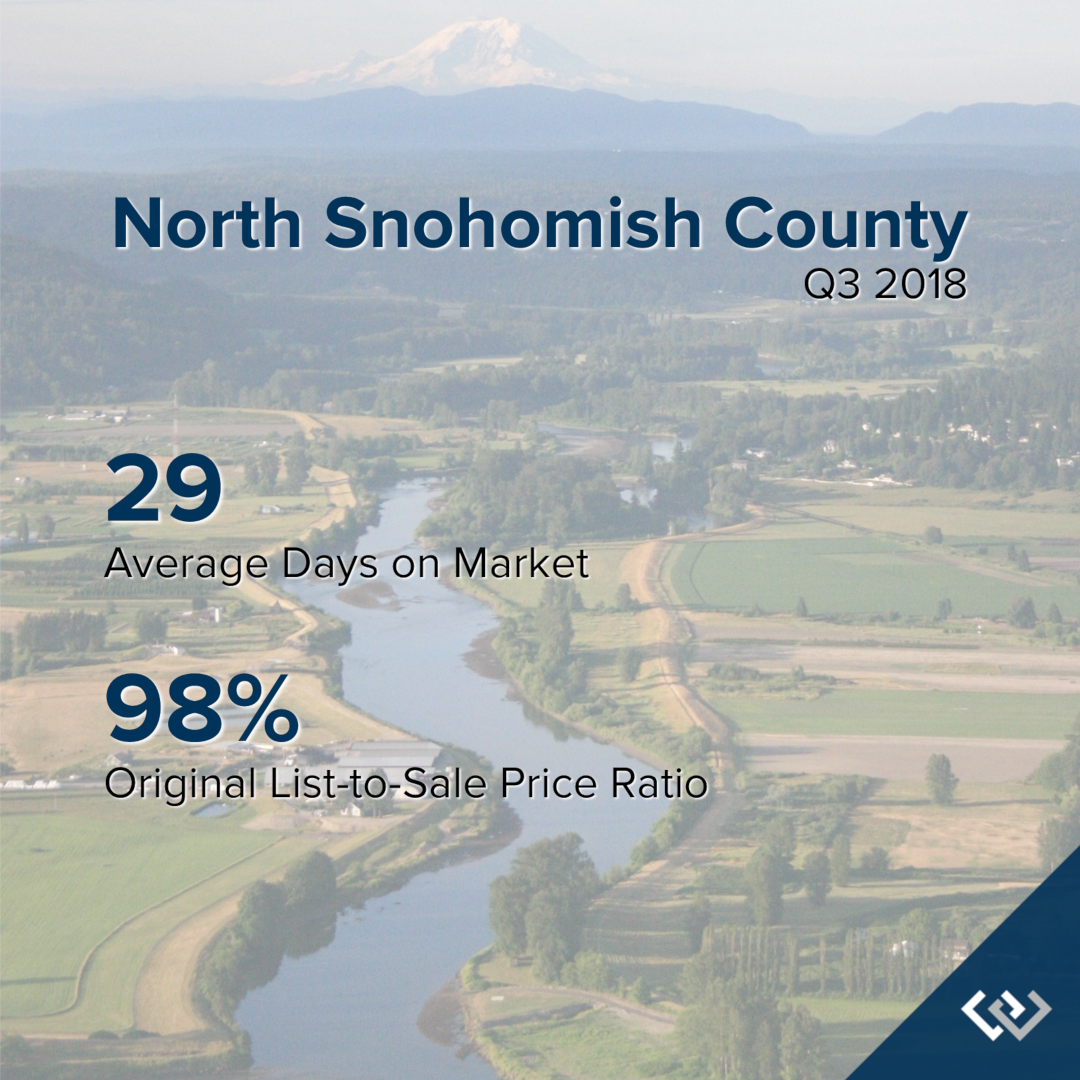
Q3: July 1 – September 30, 2018
NORTH SNOHOMISH COUNTY: In September, the average days on market landed at 29 days and the original list-to-sale price ratio at 98%. Since May, inventory growth has been noticeable, and has given buyers more options. This has led to more negotiations and fewer bidding wars, which is tempering month-over-month price growth to a more sustainable level.
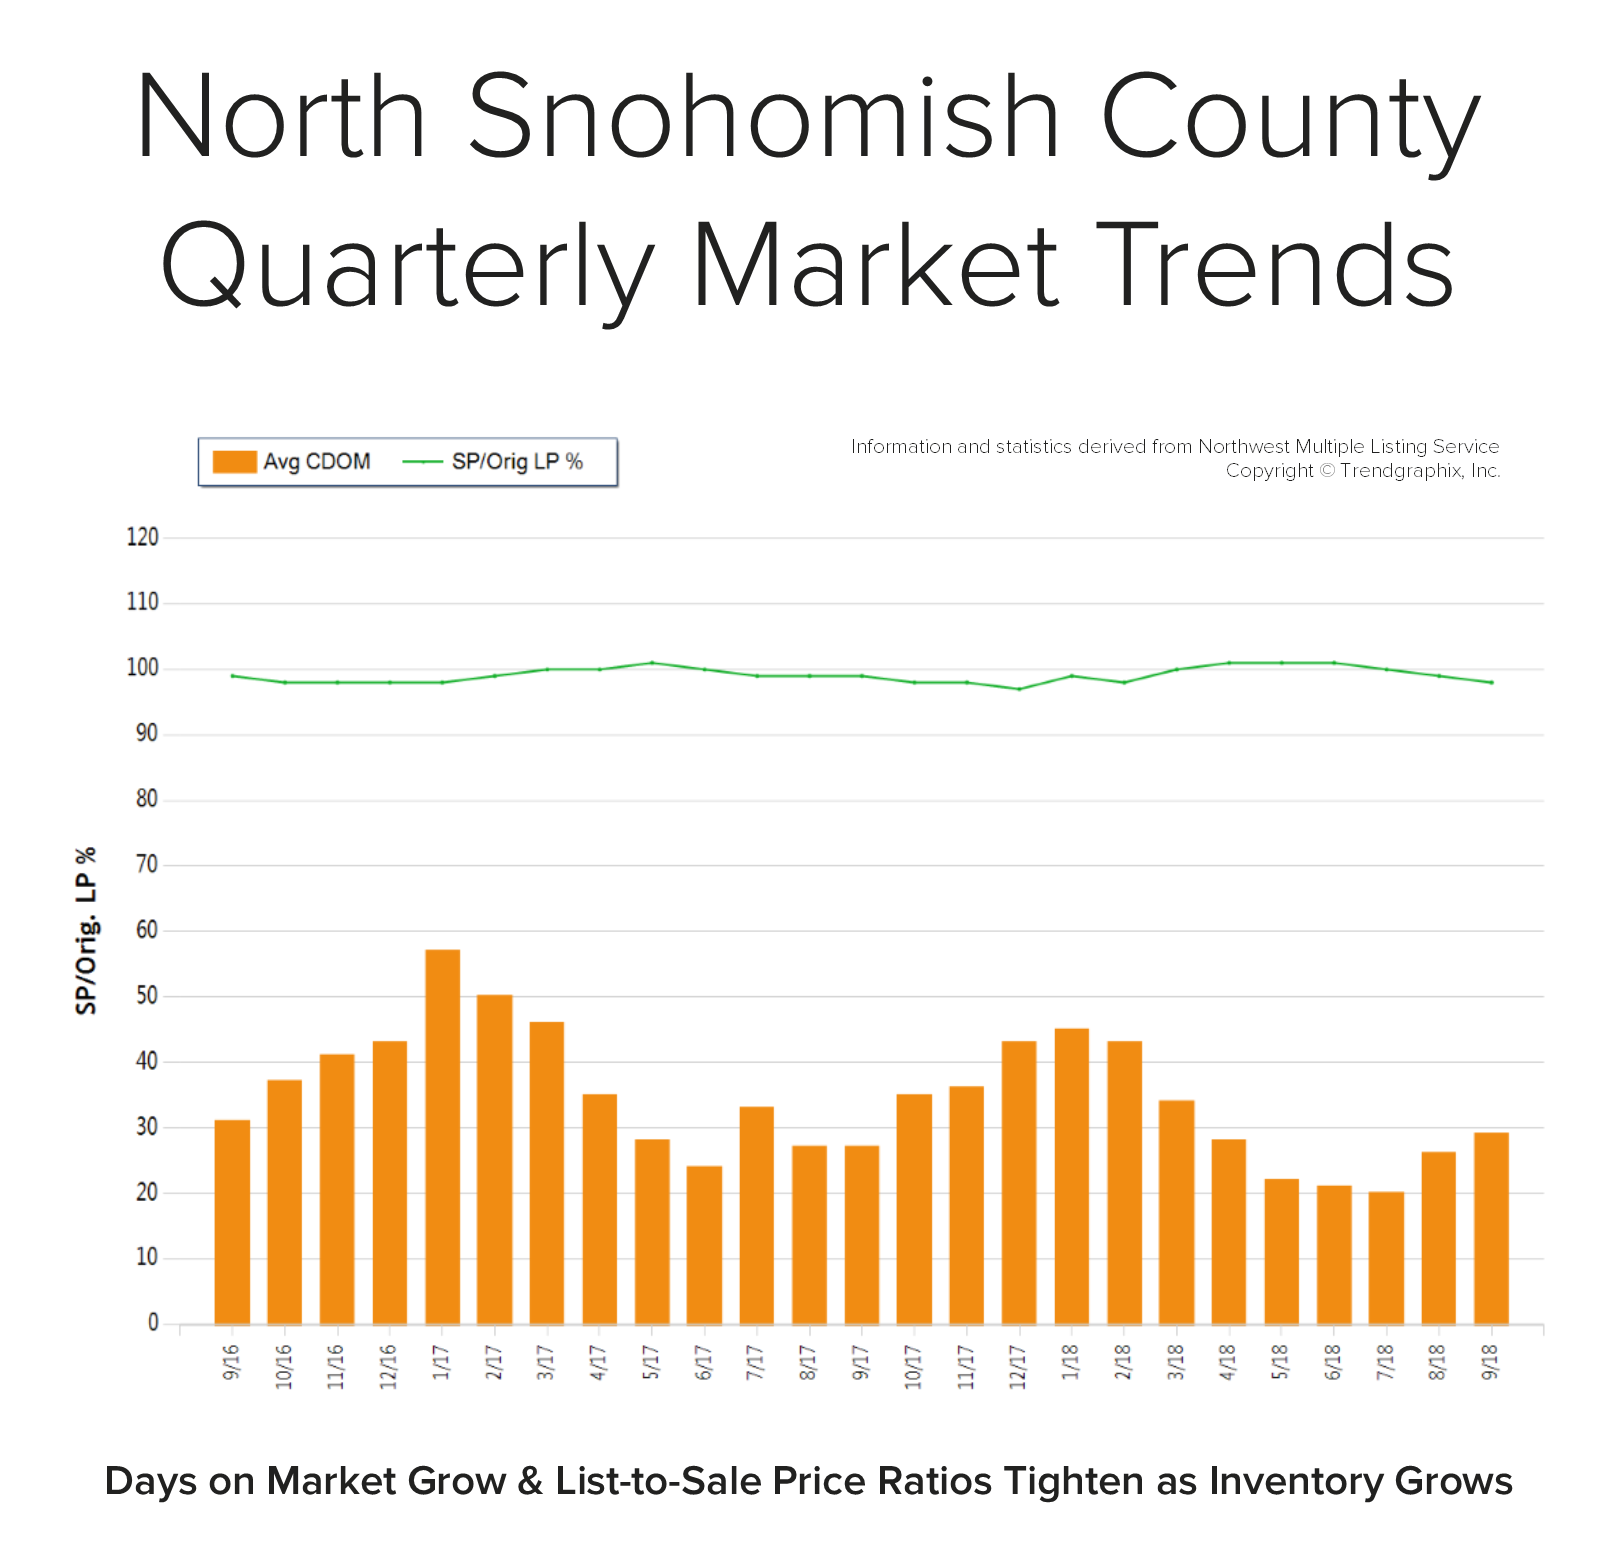 Back in May, the average days on market was 22 days and the original list-to-sale price ratio 101%; but months of inventory based on pending sales was 1 month compared to 2.3 months currently. Year-over-year, prices are up 11%, still well above the historical norm of 3%-5% year-over-year gains—but note that the majority of this growth happened during the spring, due to constricted inventory levels.
Supply has increased, creating more options for buyers and helping to buffer affordability issues. Many sellers are deciding to make moves and cash in on the equity gained over the last six years. An average original list-to-sale price ratio of 98% is a positive return, yet illustrates a softening in the market after some very extreme times. With 11% price growth over the last 12-months in a seller’s favor, the increase in selection has led to more nimble moves from one house to another. Where sellers need to be careful is anticipating the month-over-month price growth we saw prior to the shift in inventory. Prospective buyers would be smart to take advantage of today’s historically low interest rates and the added inventory selection.
This is only a snapshot of the trends in north Snohomish County; please contact me if you would like further explanation of how the latest trends relate to you.
Quarterly Reports: Q3 South King County
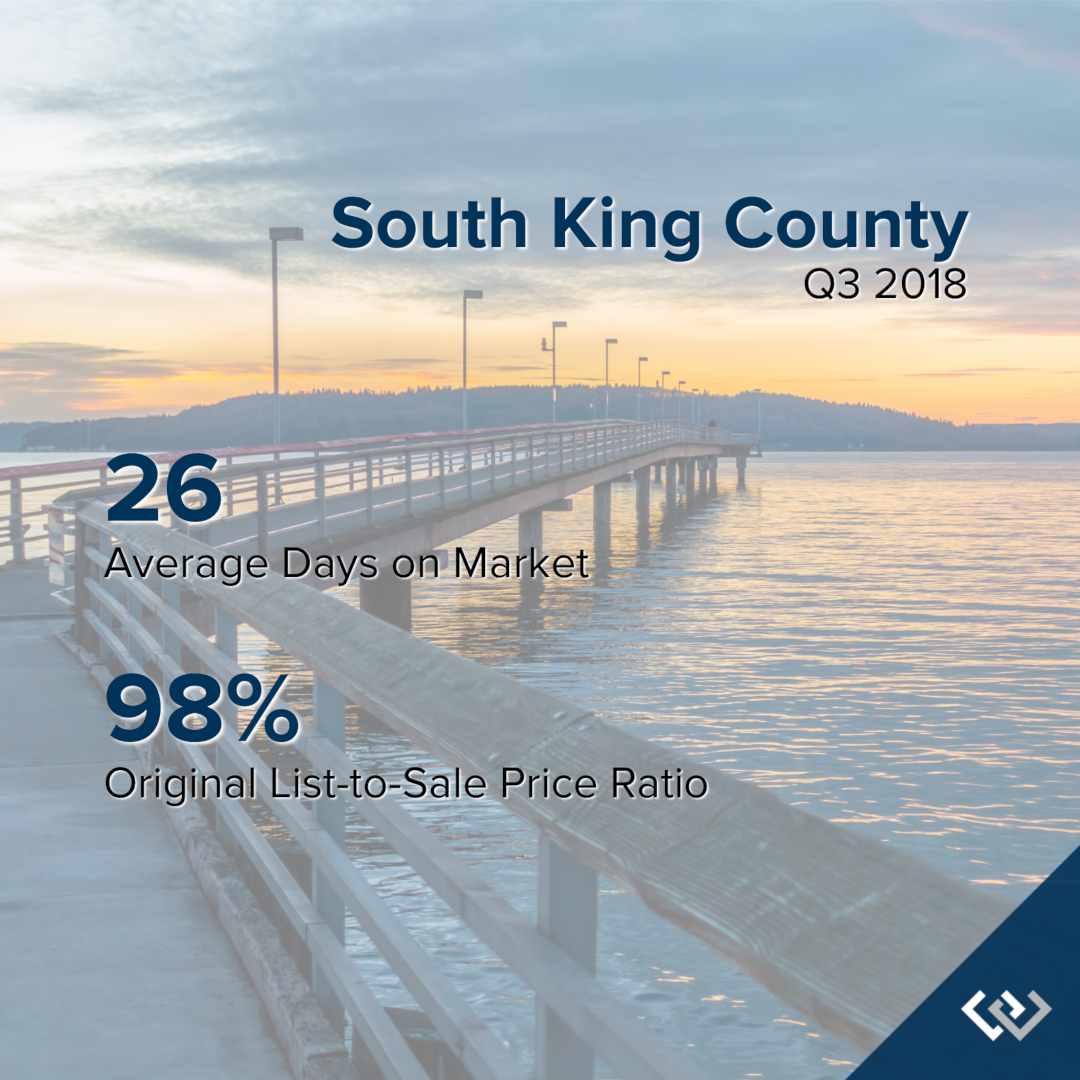
Q3: July 1 – September 30, 2018
SOUTH KING COUNTY: In September, the average days on market landed at 26 days and the original list-to-sale price ratio 98%. Since May, inventory growth has been noticeable, and has given buyers more options. This has led to more negotiations and fewer bidding wars, which is tempering month-over-month price growth to a more sustainable level.
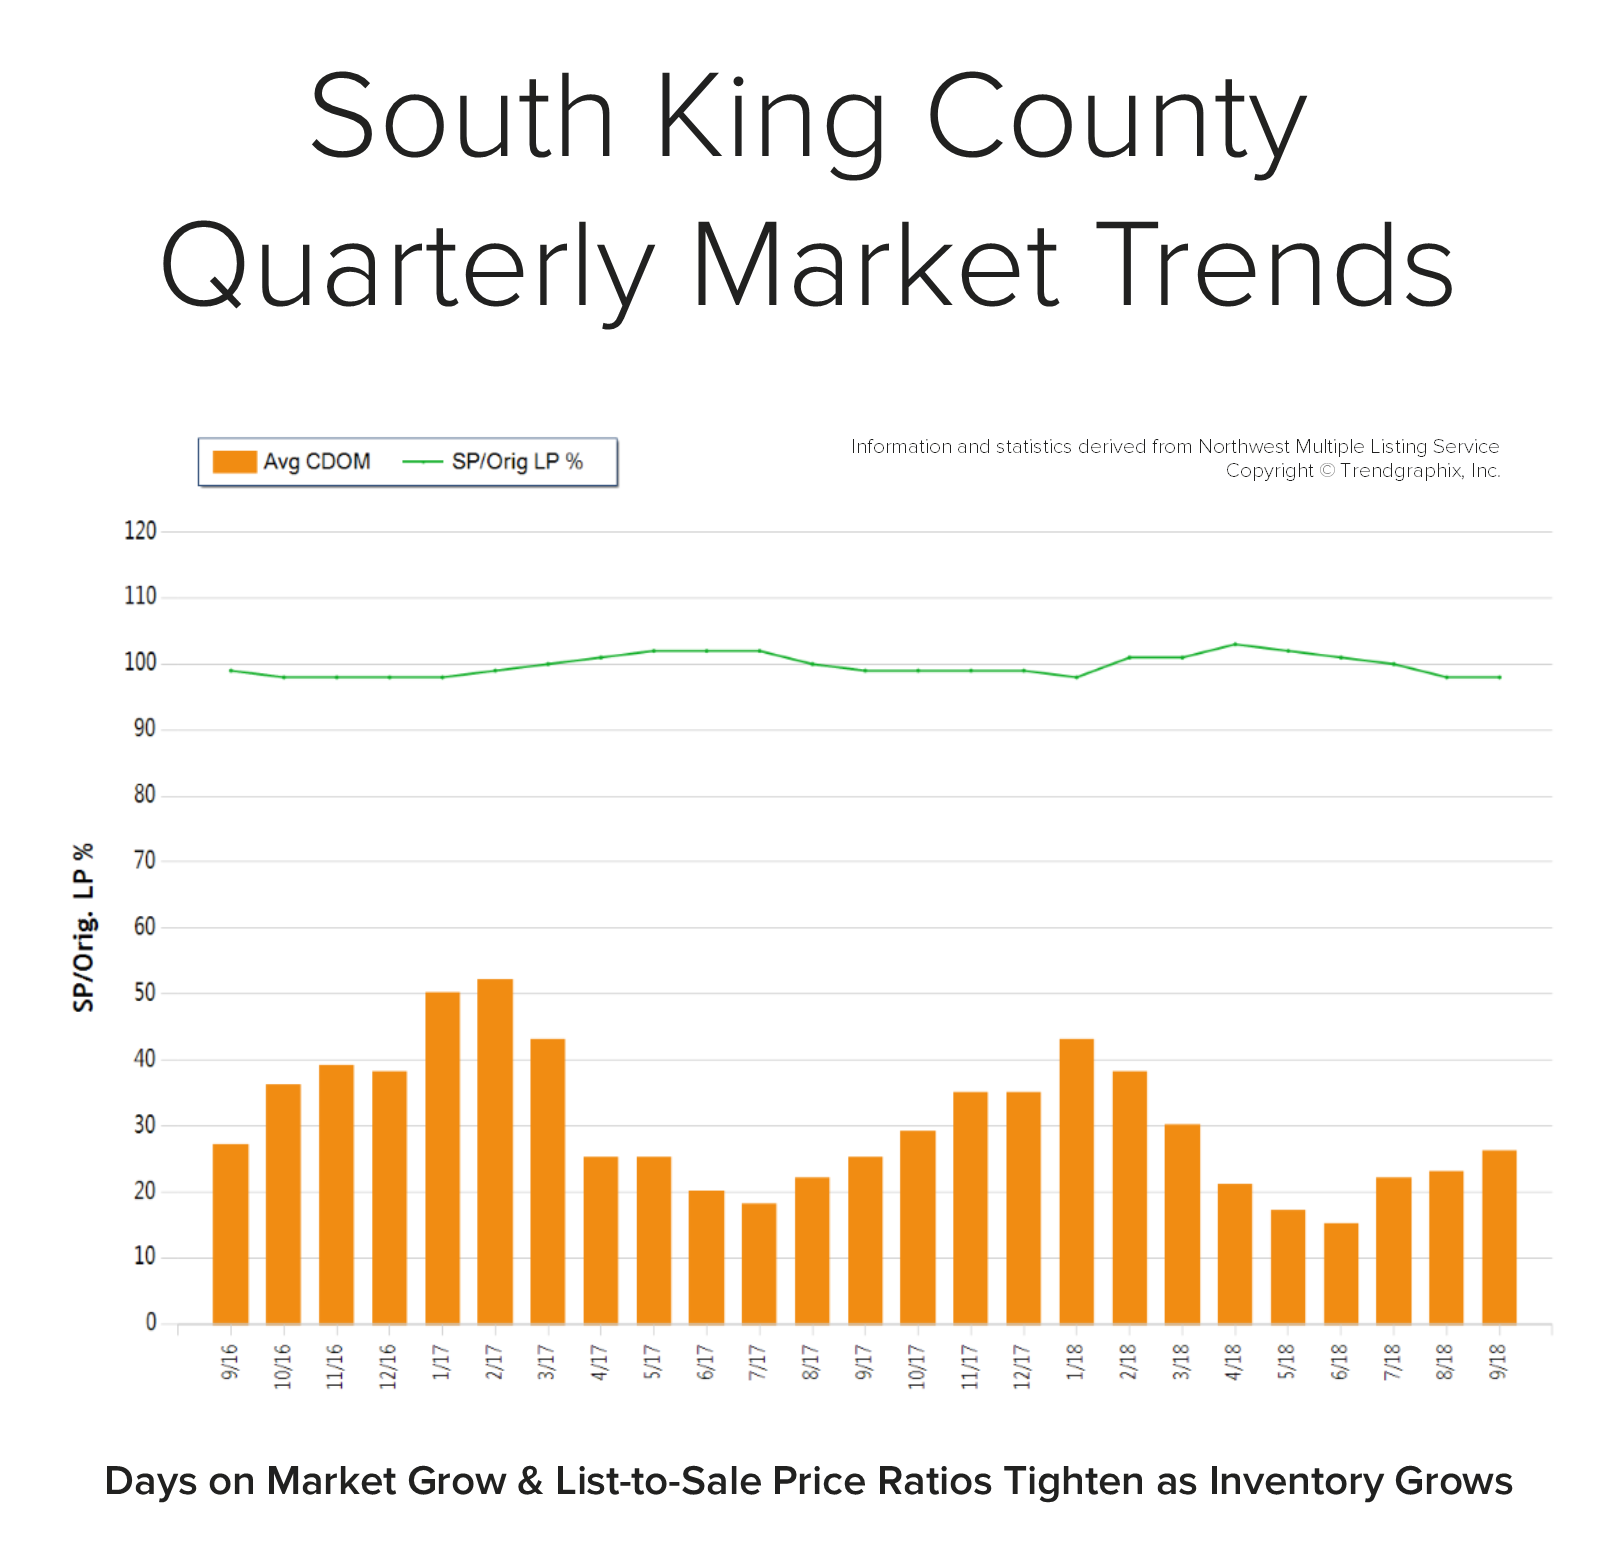 Back in April, the average days on market was 21 days and the original list-to-sale price ratio 103%; but months of inventory based on pending sales was 0.9 months, compared to 2.6 months currently. Year-over-year, prices are up 10%, still well above the historical norm of 3%-5% year-over-year gains—but note that the majority of this growth happened during the spring, due to constricted inventory levels.
Supply has increased, creating more options for buyers and helping to buffer affordability issues. Many sellers are deciding to make moves and cash in on the equity gained over the last six years. An average original list-to-sale price ratio of 98% is a positive return, yet illustrates a softening in the market after some very extreme times. With 10% price growth over the last 12-months in a seller’s favor, the increase in selection has led to more nimble moves from one house to another. Where sellers need to be careful is anticipating the month-over-month price growth we saw prior to the shift in inventory. Prospective buyers would be smart to take advantage of today’s historically low interest rates and the added inventory selection.
This is only a snapshot of the trends in south King County; please contact us if you would like further explanation of how the latest trends relate to you.
Wealth-Building Opportunities Abound for First Time Home Buyers


With the sharpest increase of available homes for sale in years, more opportunities are now available for buyers, including first-timers. Many first-time home buyers have sat on the sidelines and remained renters due to the constriction of inventory, which put major pressure on price affordability. Not only has affordability been an issue, but the terms required to prevail in a multiple-offer situation were often not within reach for someone entering the market for the first time.
For example, over the last 12 months in the Seattle Metro area we have seen a 66% increase in the selection of homes for buyers to choose from. There is currently 1.8 months of available inventory based on pending sales versus 0.8 months that was available the same month last year. This is still a seller’s market (0-3 months), but it is providing more than twice as much selection than a year ago. This loosening up of the market has helped to temper price growth by reducing the amount of price escalations and the need to have super aggressive financing terms in order to secure a home.
You see, over the last 3-4 years we have experienced double-digit price appreciation (10-14%) year-over-year, each year. A normal rate of appreciation is 3-5%. Minimal amounts of available inventory, low interest rates, and rapid job growth lead to this increase in prices. Now that more homes are coming to market and job growth has stabilized a bit (still growing, but not as fast), price growth has slowed. This is good news for sustainability and affordability. Here’s the deal though – we are still experiencing growth in values, making home ownership a sound investment over renting.
According to the most recent survey from rentcafe.com, the average rent for an apartment in Seattle is $1,906 with an average square footage of 736 sq. ft. That is quite a bit of money for not a ton of space. Further, that monthly expenditure does not create any wealth for the renter, only for the landlord. With renting, rates can be increased at any time, and you are paying down someone else’s asset, not your own. Also, owning gives the homeowner control of their overhead, while getting to make their house their home by adding improvements such as painting.
There are several factors to consider that will lead a person to make the best decision for their lifestyle and their financial bottom line. One of the biggest factors is interest rates! Currently, the rate for a 30-year fixed, conventional, conforming loan is hovering around 4.88%. Up from earlier this year and predicted to rise, but still historically low over the course of the last 30 years. These rates need to be considered the greatest opportunity of them all! With prices tempering and rates still under the 30-year average of 6.65%, buyers are able to secure a sound investment with very low debt service.
With interest rates predicted to rise over the next year, a good rule of thumb to remember is that for every one-point increase in rate, a buyer loses 10% of their buying power. For example, if the rate jumps from 4.75% to 5.75% and one wants to keep the same monthly payment, they must adjust their price point down by 10%. So, a $450,000 budget becomes a $405,000 budget, and that isn’t taking appreciation into consideration. If you assume an average appreciation rate of 4% year-over-year, today’s $450,000 house will be $468,000 next year. What side of the equity growth do you want to be on? As an owner now, or a buyer a year from now, when prices are higher and interest rates are most likely higher as well?
Once you secure a mortgage, the payment stays the same over the term of the entire loan. The long-term benefits of owning are abundant, including the stability of not being asked to move. These are important factors to consider for everyone, but especially millennials, who are enjoying the benefits of Seattle’s attractive job market. One myth to address is the common belief that you must have a 20% down payment in order to buy a home. That is simply not true. There are loan programs as low as 3% down, decreasing the need to have a large sum of money saved up before being able to buy.
Where folks are having to compromise the most due to affordability is commute times, and settling in less-urban neighborhoods. Worth pointing out, is the average home price in south Snohomish County is 34% less than Seattle Metro – that is a huge savings! Further, south King County is 74% more affordable than Seattle. Some people, mainly millennials, have not been willing to give up living in the core urban neighborhoods that have high walk scores and shorter commute times. That should be apt to change with more selection available in the purchase market, coupled with low interest rates. The advantages of moving out a little further and securing a home will start people on the track of building long-term wealth. If you or anyone you know is currently renting and is considering a change, please let me know, as I would be happy to get their questions answered and help them make an informed decision.
A Love Letter to Buyers

We often share the advantages of this market for home sellers, which is unbelievably positive. However we thought it was time to give the potential buyers in our marketplace some love, hope, and of course data!
 Dear Greater Seattle Home Buyer,
Let’s just be up front: buying a home in today’s market is not easy. Quite frankly, it can be a wild roller coaster ride with twists and turns; but remember, folks pay a lot of money and stand in long lines for roller coaster rides. Imagine the excited pit in your stomach as the cart clicks up to the highest point before you plunge down a steep drop, and the thrill of raising your hands up because you trust that you are going to be okay. These emotions also accurately reflect the feelings of today’s home buyer – it can be a wild ride! Let’s also note that many roller coaster riders return to the back of the line right after getting off. Home ownership is also a good exercise to repeat and is often the investment that leads to the most built wealth in one’s life.
So how does one ensure that they are not the Nervous Nelly who stands in line for over an hour, finally makes it to the front to be strapped in to the cart, but who then chooses to bow out? The one that sits on the sidelines watching others throw up their hands with a thrill in their eye; the one with that tinge of regret as their friends rejoin them back on hallowed ground to recount their adventure. Wow, this is getting dramatic! Here are a few tips to follow that will ensure that one can find success securing a home in today’s market and get on the equity building train.
![]() Waiting is Even More Expensive
Waiting is Even More Expensive
In 2017, the year-over-year median price gains across our region were strong. In fact, here is a little break down.
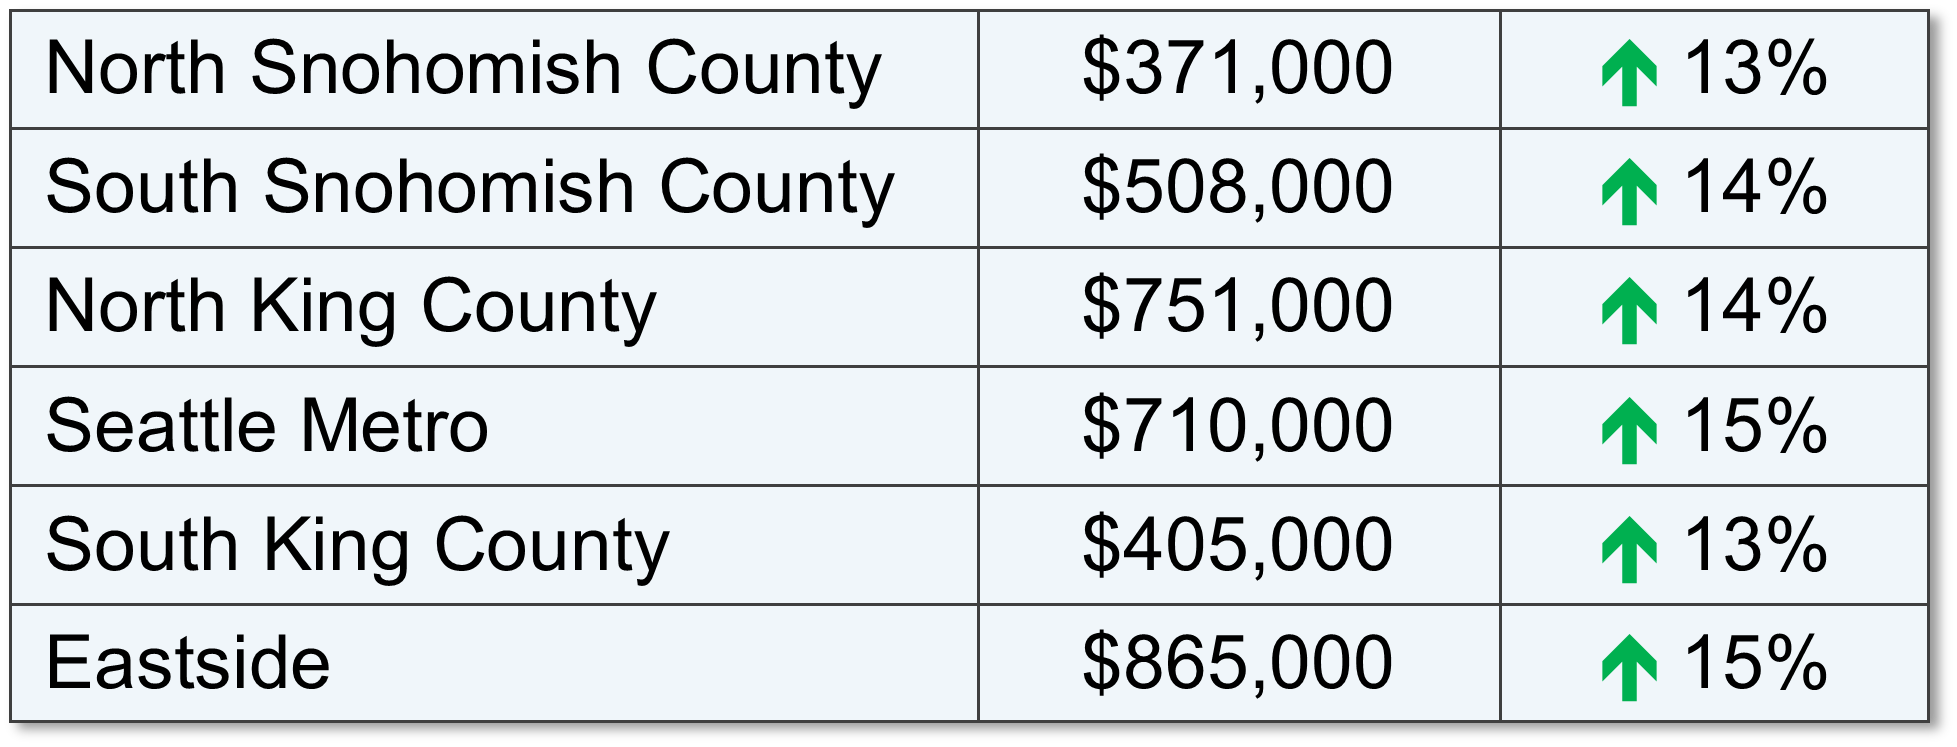
The appreciation is for real and as each month ticks by, prices are going up. That is why it is incredibly important to have a plan and realistic expectations. In referring to the chart above, it is plain to see the affordability of each area. Buyers have had to get creative and honest with themselves regarding the city or neighborhood in which they land. Commute times are one of the biggest indicators of home cost. It is paramount to line your budget up with a realistic commute time and then dig in. Too often we’ve seen buyers tightly grip to the idea of an in-city commute, only to have it end up being a more suburban choice in the end. The months wasted trying to perform in a market that didn’t match their budget ended up costing them at least 1% a month, based on last year’s appreciation. Getting real saves time, money, and heartache.
![]() Interest Rates are Rising
Interest Rates are Rising
This aspect is actually one to pay very close attention to. We have been amazingly spoiled with historically low interest rates over the last five years. In fact, there is an entire generation of buyers who only know rates that have hovered from 3.5 – 4.5% – that is close to 3 points under the 30-year average! A good rule of thumb regarding interest rates, is that for each 1-point increase a buyer loses 10% of their buying power. That means that if you have a $500,000 budget and the rate goes up by a point, that you are now shopping for a $450,000 house if you want the same payment. Note, that shift does not take appreciation into consideration. Today’s rates have helped buyers bear the home prices in our area. It is predicted that rates will rise in 2018 by .5 to 1%.
![]() Rents are High and Don’t Build Wealth
Rents are High and Don’t Build Wealth
Seattle is now the 5th most expensive city to rent in the country according to the US Census Bureau. With rising rental rates, still historically low interest rates, and home prices on the rise, the advantage of buying versus renting has become clear for folks who have a down payment saved, good debt-to-income ratios and strong credit. Currently, the breakeven horizon (the amount of time you need to own your home in order for owning to be a superior financial decision vs. renting) in the Greater Seattle area is 1.6 years according to Zillow research.
![]() Partner with a Broker Who Will Get the Job Done
Partner with a Broker Who Will Get the Job Done
A broker that has a process is key! It starts with an initial buyer consultation. I liken the buyer consultation to the seat belt you would wear on the roller coaster ride. The buyer consultation aims to unearth a buyer’s goals, research the areas they are interested in, address financing, and illustrate the challenges of the environment, so one can be successful. Time is money, and this consultation brings clarity, efficiency and trust. This upfront education coupled with a high level of communication and availability is paramount. The depth of the relationship will lead to success, and is the ingredient that enables a buyer to throw up their hands and take the thrilling plunge. It is hard to do that without a seat belt!
![]()
Get Your Finances in Order
Aligning with a trusted real estate professional is key, but so is aligning with a reputable and responsive mortgage lender. Getting pre-approved is the minimum, but getting pre-underwritten is a game changer. Finding a lender that is willing to put in the work up-front to vet credit, income, savings, debt, and all other financial indicators will lead to being pre-underwritten, which listing agents and sellers appreciate! Also, be aware that you do not always need to have a huge down payment to make a purchase work. Employment, assets, credit, and what you have saved all work into your ability to acquire a loan. I have seen plenty of people secure a home with 3-5% down. Education and awareness create clarity, and investing into understanding your financial footing equals empowered and more efficient decisions. Note that I mentioned “responsive”. This is a 24/7 market, and lenders who don’t work evenings and weekends can get in the way of a buyer securing a home. If you need a short list of lenders that fit this description, please contact me.
![]() ‘Tis the Season – Inventory is Coming
‘Tis the Season – Inventory is Coming
Have hope! This is the time of year where we see inventory climb month over month. There will be more selection, but bear in mind it is also the time of year that the appreciation push happens. If you are feeling 75-80% in love with a home, it is one to act on. You’re never going to “get it all”, so a willingness to focus on priorities will pay off, because waiting will have an expense.
If you or someone you know is considering a purchase in today’s market, please contact us. It is our pleasure to take the time to educate, devise a plan, and help buyers find success in a challenging, yet advantageous market.
