
 Facebook
 X
X
 Pinterest
 Copy Link
Commute Times & Price Premiums: The Value of Location, Location, Location

It is the time of year when we like to re-cap the price premiums in our area based on commute times. The price divide continued in 2017 between key market areas in the Greater Seattle area based on proximity to major job centers. These pricing premiums have cemented the drive-to-qualify market. Seattle proper has always been more expensive than its neighboring suburbs, but the most current prices illustrate the extreme value of a shorter commute.
 In 2017, the average sales price for a single-family residential home in the Seattle Metro area was $801,000, up 14% from the year prior! In south Snohomish County (Everett to the King County line) the average sales price for a single-family residential home in 2017 was $543,000, up 12% from the year prior, however 48% less expensive than Seattle Metro.
Further, if you jump across Lake Washington to the Eastside, the average sales price in 2017 for a single-family residential home was $1,049,000, up 16% from the year prior and 31% more expensive than Seattle Metro! The Eastside has the infrastructure to support their own job centers, making it a second “Seattle”, with the benefit of newer and larger housing stock, which reflects the pricing. Many folks are living and working on the Eastside, or using the 520 toll bridge to jump over to Seattle.
In 2017, closed transactions were up 4% in south Snohomish County despite fewer new listings coming to market, which I think was driven by its affordability compared to Seattle and the Eastside. Snohomish County offers lower prices, larger houses and yards, new construction, lower taxes, strong school district options and longer, yet manageable commute times. Newer transit centers and telecommuting have also opened up doors to King County’s little brother to the north.
Another hot button that has continued to influence pricing is the future expansion of Light Rail and the locations of the planned stations. We have seen home values in these areas sell at a premium as consumers anticipate the shorter commute times the rail will bring. These neighborhoods are experiencing zoning changes now and the additional expansion is being phased in over the course of the next 15 years. There will be more multi-family and commercial development in these areas, creating more density to serve the public using these commuting services. This has created great appeal for homeowners that want to get in on the ease of nearby public transportation, and developers eager to be part of the infrastructure growth. Stations at Northgate, 145th & 185th in Shoreline, Mountlake Terrace and Lynnwood are all slated to open over the next 3-6 years.
No matter what neighborhood you are interested in learning about, in either King or Snohomish County, we are happy to provide a 2017 re-cap of that market. We work in both counties and understand each of their nuances. 2017 was another eventful year in real estate and we are looking for that to continue in 2018. With these strong market prices, we hope to see an increase in inventory levels, providing more options for buyers and allowing price growth to temper to sustainable levels.
Here’s to a successful 2018!
Quarterly Market Trends: Eastside
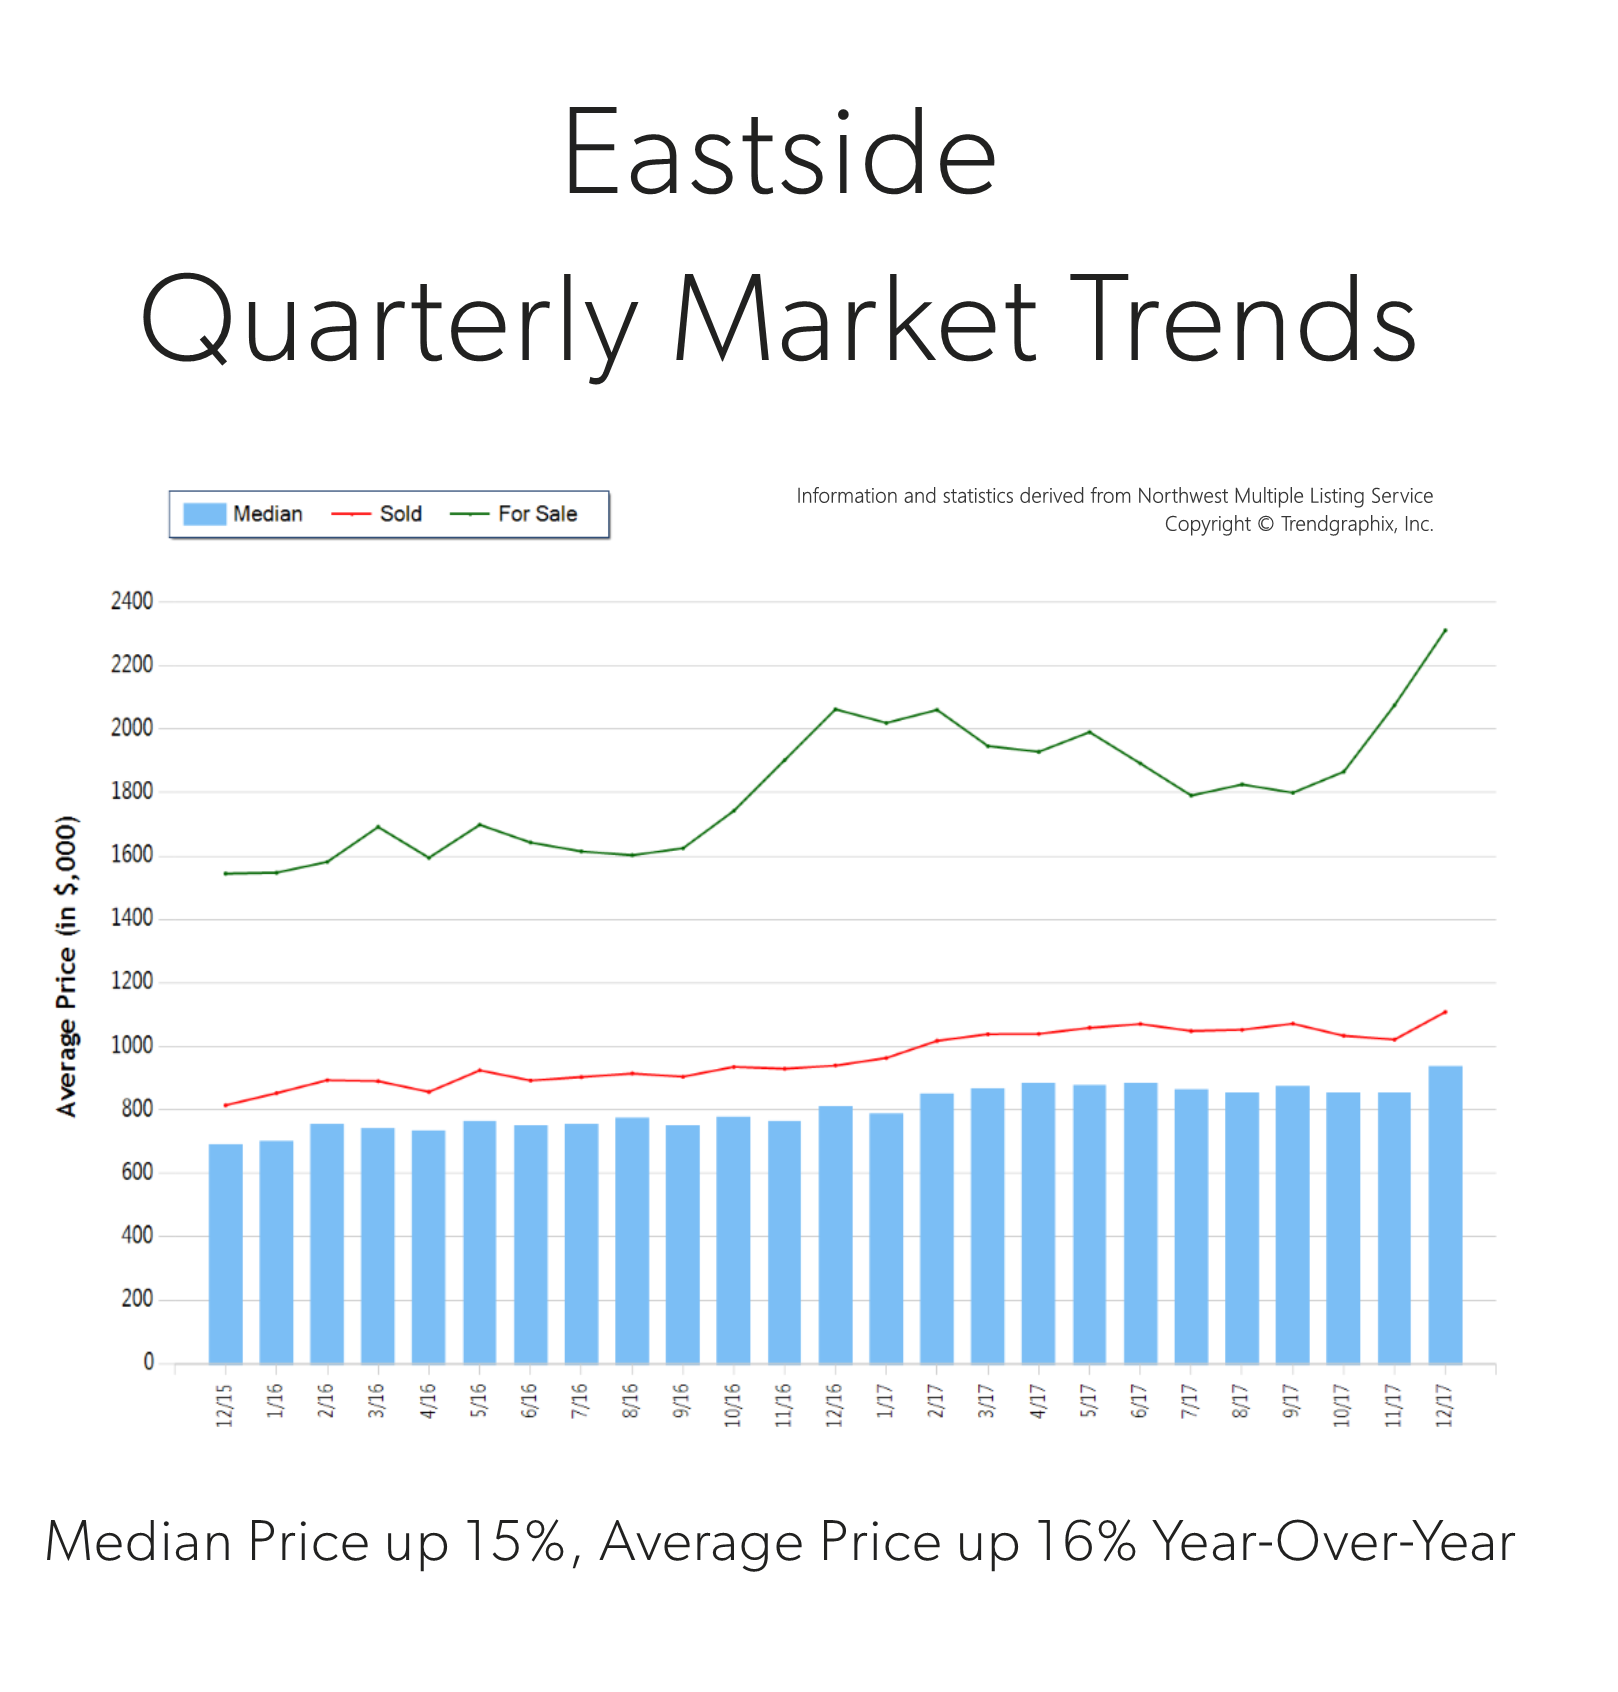
Q4 2017
 Price growth was particularly strong in 2017! Median was up 15% and average price up 16% over 2016. Median price in 2017 landed at $865,000 and the average at $1,049,000. The average amount of days it took to sell a house in 2017 was 24 days, which is 17% faster than 2016. The average list-to-sale price ratio over the last year was 101%, with the spring months as high as 103%! In 2017, inventory growth continued to be a challenge, with a 4% decrease in new listings compared to 2016. Even with inventory limitations there were a near equal amount of sales! This phenomenon illustrates strong buyer demand and a need for more listings.
Demand for Eastside real estate has grown due to close proximity to job centers, great schools and quality of life. Over the last year, the Eastside was 70% more expensive than south Snohomish County and 22% over Seattle Metro. Historically low interest rates continue to drive the market as well, they have helped offset the increase in prices. Sellers are enjoying great returns due to this phenomenon and buyers are securing mortgages with minor debt service.
This is only a snapshot of the trends on the Eastside area; please contact us if you would like further explanation of how the latest trends relate to you.
Market Update – Q3
Inventory levels providing more choices for buyers; is the market starting to stabilize?
As we head into the fall and winter months after an incredibly eventful spring and summer, available inventory levels are starting to ease. It is still a seller’s market (3 months of inventory or less) in most areas, but one that is providing buyers increased options. The increase in available inventory is due to pent-up seller demand starting to come to market. The return of strong equity levels have brought sellers to market that have been waiting to jump in for some time. Continued buyer demand due to our flourishing job market and historically low interest rates have steadily absorbed new inventory, but we are finally starting to see a trend toward some more balance. This is good news! Additionally, lending requirements remain stringent and down payments are bigger, unlike the dreaded bubble market we experienced in 2007/2008. Educated pricing and sound condition is what will drive a buyer’s interest in a home. As the market stabilizes, it will be important for consumers to partner with a broker who closely follows the market to help them make informed decisions and develop winning strategies.
Read below for market details from Snohomish County down through south King County.
Snohomish County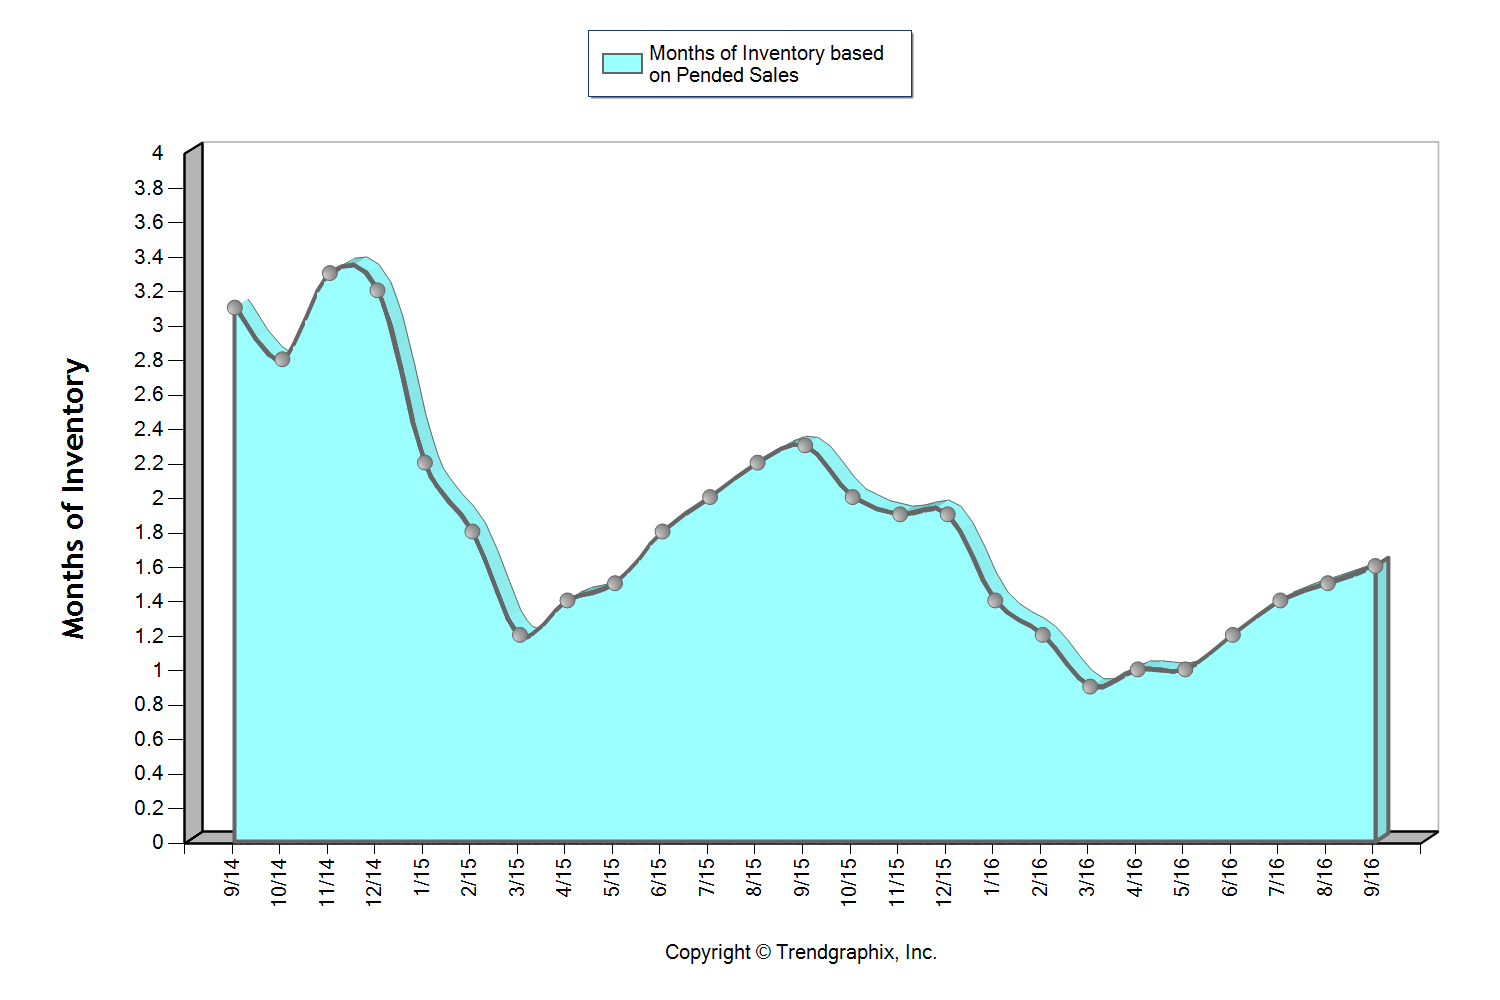
This graph shows that we currently sit at 1.6 months of inventory based on pending sales, which is the highest level we have seen in all of 2016! It is still a seller’s market (3 months or less), but one that is providing buyers increased options. The average cumulative days on market reached 28 days in September, which was up 8% over August. Median price peaked in August at $401,000 and settled at $397,000 in September after hovering between $380,000 and $400,000 since April. For the first time since February, the average list to sale price ratio was 99% after sitting at 100-101% over the last six months.
The return of strong equity levels have brought sellers to market that have been waiting to jump in for some time. In fact, average prices have grown just over 20% over the last two years, freeing up sellers to make the moves they have been waiting for. Continued buyer demand due to our flourishing job market and historically low interest rates have steadily absorbed new inventory, but we are finally starting to see a trend toward some more balance. This is good news! We are still seeing multiple offers and quick market times, but not quite the frenzy that we experienced earlier this year.
All of these factors indicate that we may finally be headed towards a more stabilized market with positive attributes for both buyers and sellers.
South Snohomish County 
This graph shows that we currently sit at 1.4 months of inventory based on pending sales, which is the highest level we have seen in all of 2016! It is still a seller’s market (three months or less), but one that is providing buyers increased options. The average cumulative days on market reached 24 days in September, which was up 14% over August. Median price peaked in August at $453,000 and settled at $440,000 in September after hovering between $440,000 and $450,000 since March. For the first time since February, the average list to sale price ratio was 99% after sitting at 100-101% over the last six months.
The return of strong equity levels have brought sellers to market that have been waiting to jump in for some time. In fact, average prices have grown just over 20% over the last two years, freeing up sellers to make the moves they have been waiting for. Continued buyer demand due to our flourishing job market and historically low interest rates have steadily absorbed new inventory, but we are finally starting to see a trend toward some more balance. This is good news! We are still seeing multiple offers and quick market times, but not quite the frenzy that we experienced earlier this year.
All of these factors indicate that we may finally be headed towards a more stabilized market with positive attributes for both buyers and sellers.
North King County 
This graph shows that we currently sit at 1.1 months of inventory based on pending sales, which is the highest level we have seen since January! It is certainly still a seller’s market (3 months or less), but one that is starting to provide buyers increased options. In fact, we saw a 13% jump in new listings month-over-month. The average cumulative days on market reached 20 days in September, which was up 18% over August. Median price peaked in June at $650,000 and settled at $600,000 in September after hovering between $605,000 and $650,000 since March. In June, there were 95% more home sales above $1M over September. For the first time since February, the average list to sale price ratio was 101% after sitting at 102-104% over the last seven months.
The return of strong equity levels have brought sellers to market that have been waiting to jump in for some time. In fact, average prices have grown 21% over the last two years, freeing up sellers to make the moves they have been waiting for. Continued buyer demand due to our flourishing job market and historically low interest rates have steadily absorbed new inventory, but we are finally starting to see a trend toward some more balance. This is good news! We are still seeing multiple offers and quick market times, but not quite the frenzy that we experienced earlier this year.
All of these factors indicate that we may finally be headed towards a more stabilized market with positive attributes for both buyers and sellers.
Eastside 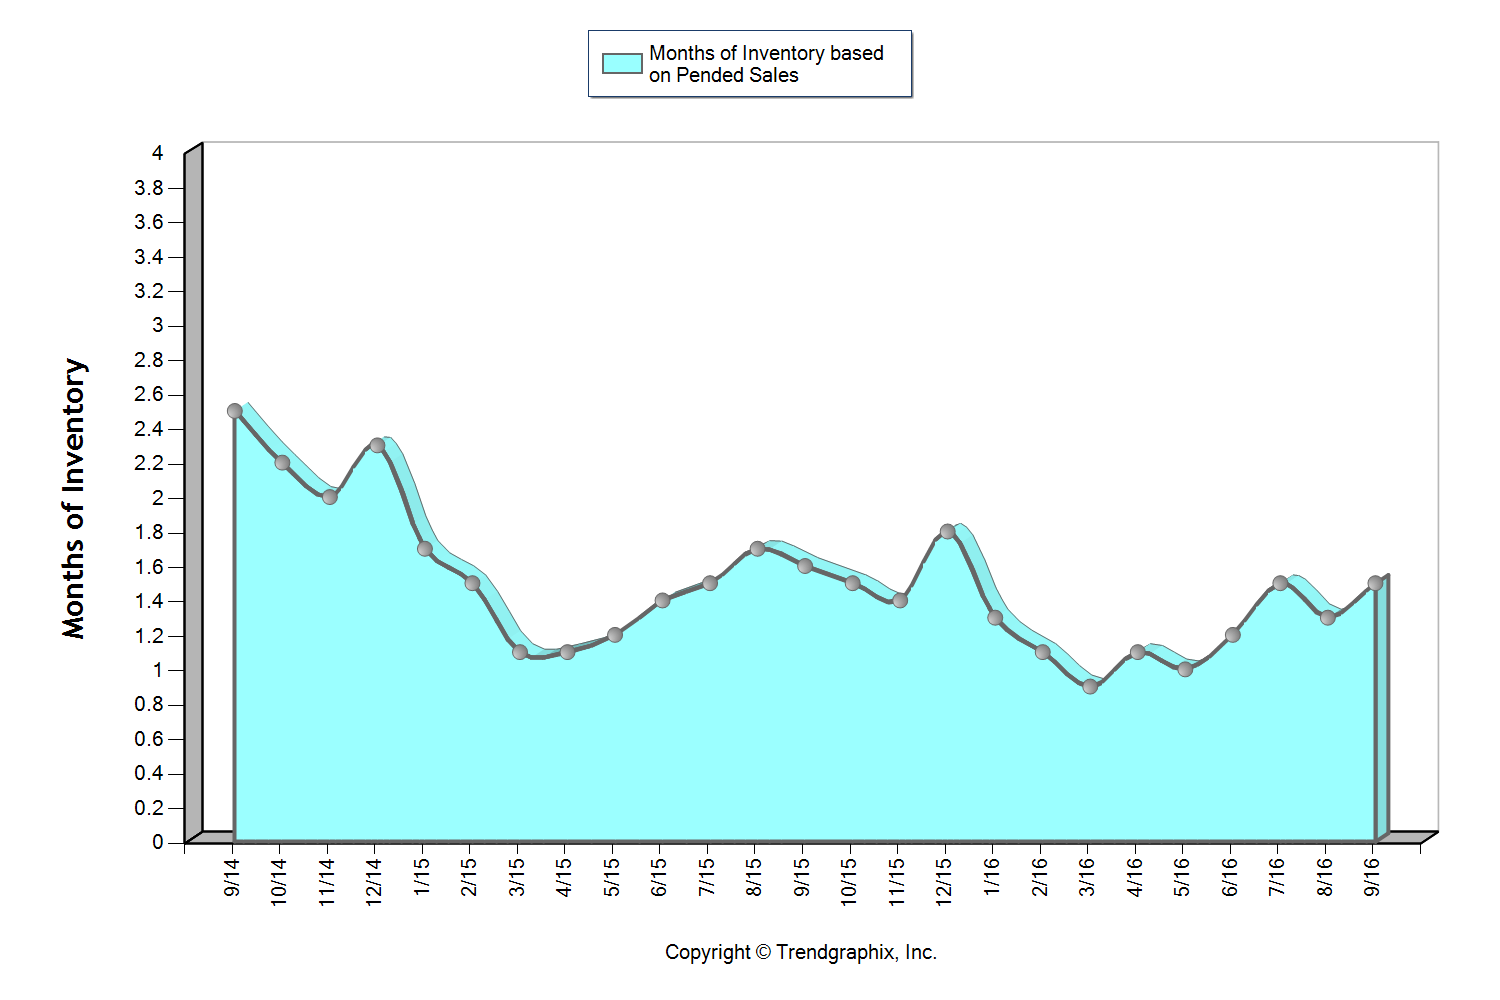
This graph shows that we currently sit at 1.5 months of inventory based on pending sales, which is the highest level we have seen in all of 2016! It is still a seller’s market (3 months or less), but one that is starting to provide buyers increased options. The average cumulative days on market reached 31 days in September which was up 24% over August. Median price peaked in August at $770,000 and settled at $750,000 in September after hovering between $737,000 and $770,000 since March. In June, there were 18% more home sales above $1M over September. Over the last two months, the average list to sale price ratio was 99% after sitting at 101-102% over the five months prior.
The return of strong equity levels have brought sellers to market that have been waiting to jump in for some time. In fact, average prices have grown 25% over the last two years, freeing up sellers to make the moves they have been waiting for. Continued buyer demand due to our flourishing job market and historically low interest rates have steadily absorbed new inventory, but we are finally starting to see a trend toward some more balance. This is good news! We are still seeing multiple offers and quick market times, but not quite the frenzy that we experienced earlier this year.
All of these factors indicate that we may finally be headed towards a more stabilized market with positive attributes for both buyers and sellers.
Seattle Metro 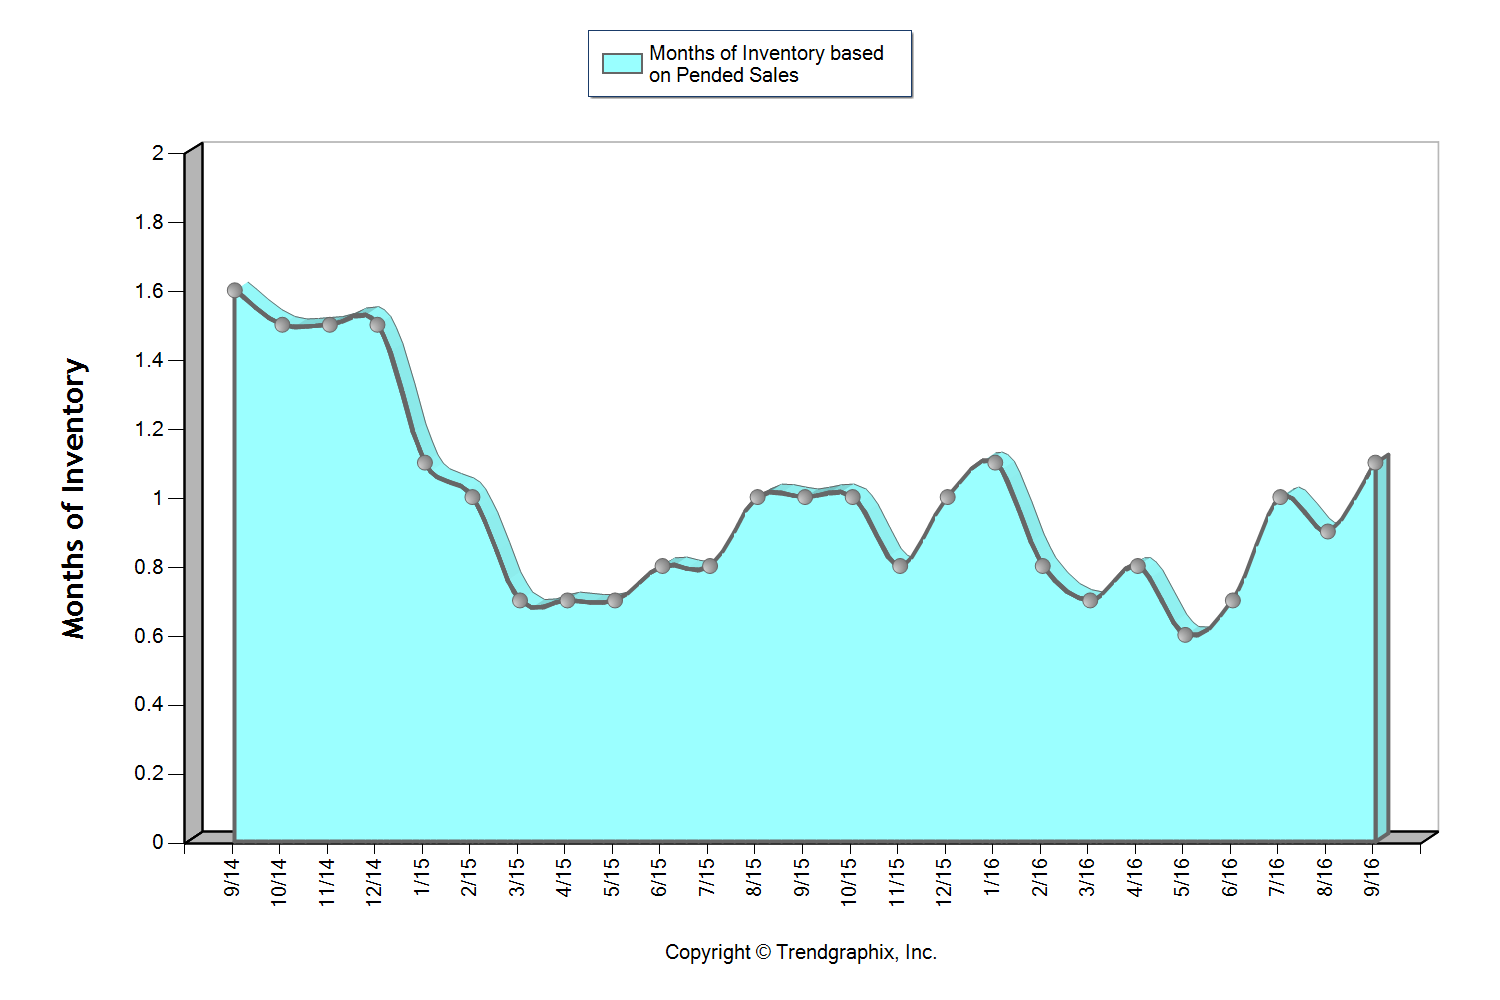
This graph shows that we currently sit at 1.1 months of inventory based on pending sales, which is the highest level we have seen since January! It is certainly still a seller’s market (3 months or less), but one that is starting to provide buyers increased options. In fact, we saw a 16% jump in new listings month-over-month. The average cumulative days on market reached 21 days in September, which was up 31% over August. Median price peaked in June at $650,000 and settled at $605,000 in September after hovering between $608,000 and $650,000 since March. In June, there were 23% more home sales above $1M over September. For the first time since February, the average list to sale price ratio was 101% after sitting at 102-104% over the last seven months.
The return of strong equity levels have brought sellers to market that have been waiting to jump in for some time. In fact, average prices have grown 22% over the last two years, freeing up sellers to make the moves they have been waiting for. Continued buyer demand due to our flourishing job market and historically low interest rates have steadily absorbed new inventory, but we are finally starting to see a trend toward some more balance. This is good news! We are still seeing multiple offers and quick market times, but not quite the frenzy that we experienced earlier this year.
All of these factors indicate that we may finally be headed towards a more stabilized market with positive attributes for both buyers and sellers.
South King County 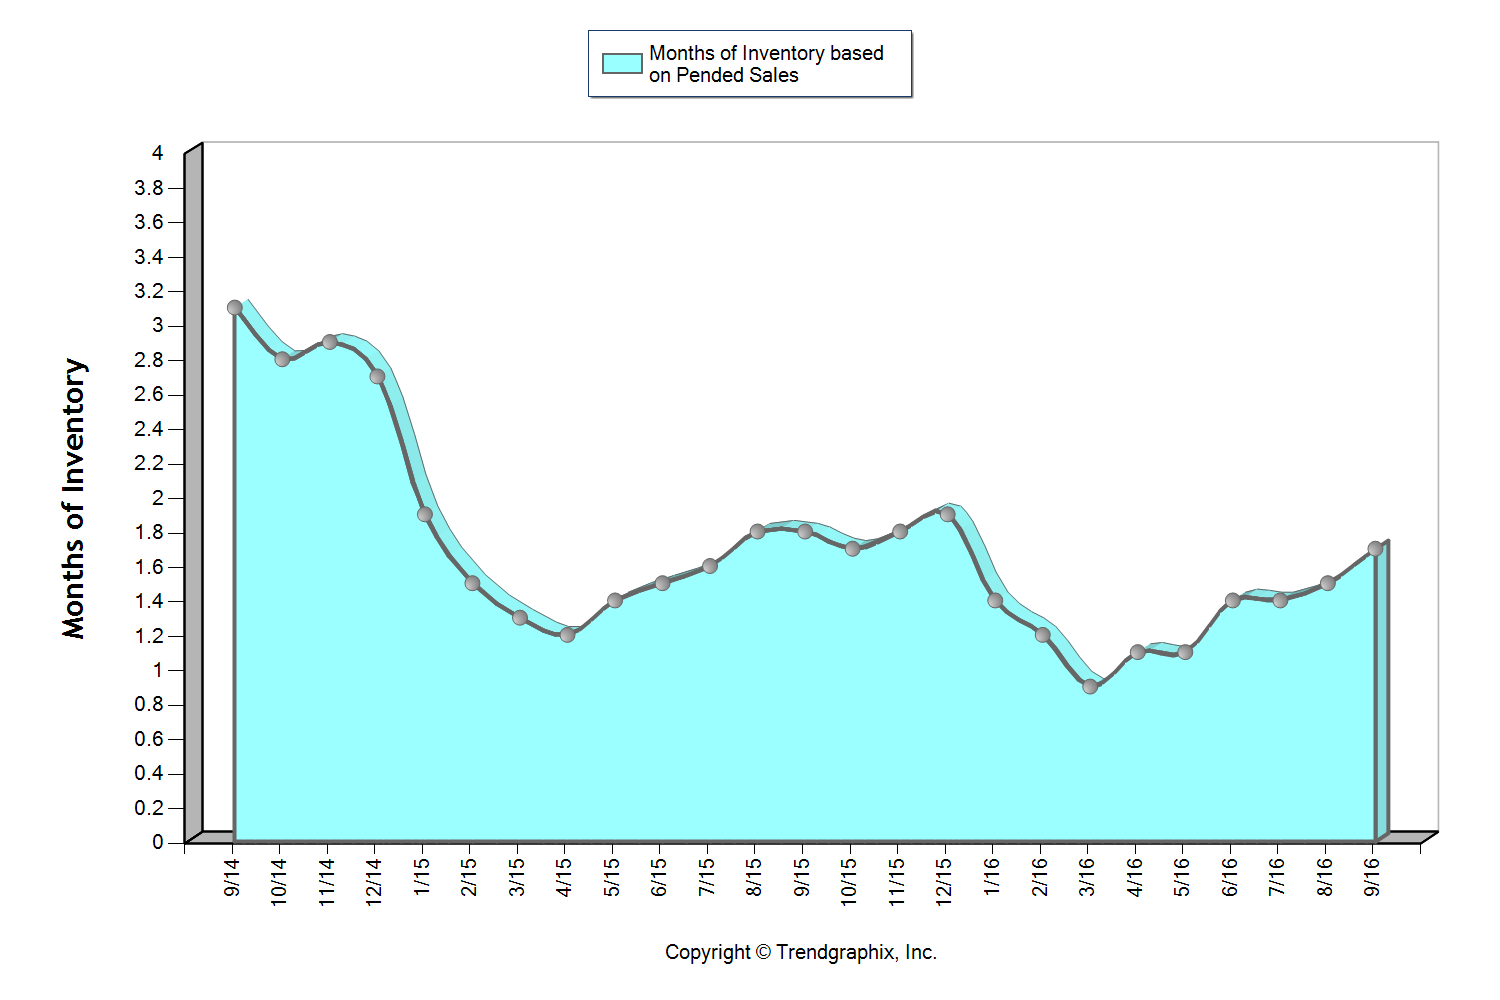
This graph shows that we currently sit at 1.7 months of inventory based on pending sales, which is the highest level we have seen in all of 2016! It is still a seller’s market (3 months or less), but one that is providing buyers increased options. The average cumulative days on market reached 27 days in both August and September, which was up 23% over July. Median price peaked in June at $371,000 and settled at $360,000 in September after hovering between $350,000 and $371,000 since March. For the first time since March, the average list to sale price ratio was 99% in August and September after sitting at 100-101% the prior four months.
The return of strong equity levels have brought sellers to market that have been waiting to jump in for some time. In fact, average prices have grown 16% over the last two years, freeing up sellers to make the moves they have been waiting for. Continued buyer demand due to our flourishing job market and historically low interest rates have steadily absorbed new inventory, but we are finally starting to see a trend toward some more balance. This is good news! We are still seeing multiple offers and quick market times, but not quite the frenzy that we experienced earlier this year.
All of these factors indicate that we may finally be headed towards a more stabilized market with positive attributes for both buyers and sellers.
These are only snapshots of the trends in our area; please contact one of our agents if you would like further explanation of how the latest trends relate to you.
Market Update – Q1 2016
The 2016 real estate market is off to an extreme start! Strong buyer demand due to our flourishing job market and historically low interest rates are the driving force behind this market. Buyers often find themselves competing due to multiple offers which require seller-centric terms in order to win. Prices have continued to grow over the last two years, putting sellers in a very favorable equity position, freeing them up to make the moves they have been waiting for. Additional inventory would help slow price growth and make it less competitive for buyers, creating positive outcomes for everyone. Lending requirements remain stringent, unlike the past “up” market which created the bubble we experienced in 2008.
Scroll down for more details about the first quarter market in Snohomish County, south Snohomish County, north King County, the Eastside, Seattle Metro and south King County.
Snohomish County
More inventory is needed to quench buyer demand as we head into spring and summer.
Snohomish County ended 2015 with a larger-than-seasonally-normal surge of closed sales, leaving us with only 1.4 months of inventory based on pending sales to start the year, which is not much! The first quarter saw a frenzy of buyer activity but only a small trickle of new inventory, leaving us with only 0.8 months of inventory heading into the second quarter. This has caused days on market to shrink and list-to-sale price ratios to rise. These conditions are very favorable to sellers. In fact, average and median prices were up 5% and 4% respectively in March over February! The good news is that new listings were up 25% in that same time frame. We hope to see that trend continue as we head into spring as the buyer demand is there to absorb it and it is needed to slow price growth.
South Snohomish County
More inventory is needed to quench buyer demand as we head into spring and summer.
South Snohomish County ended 2015 with a larger-than-seasonally-normal surge of closed sales, leaving us with only 1.2 months of inventory based on pending sales to start the year, which is not much! The first quarter saw a frenzy of buyer activity but only a small trickle of new inventory, leaving us with only 0.7 months of inventory heading into the second quarter. This has caused days on market to shrink and list-to-sale price ratios to rise. These conditions are very favorable to sellers. In fact, average and median prices were up 5% in March over February! The good news is that new listings were up 27% in that same time frame. We hope to see that trend continue as we head into spring as the buyer demand is there to absorb it and it is needed to slow price growth.
North King County
More inventory is needed to quench buyer demand as we head into spring and summer.
North King County ended 2015 with a larger-than-seasonally-normal surge of closed sales, leaving us with only 1.1 months of inventory based on pending sales to start the year, which is not much! The first quarter saw a frenzy of buyer activity but only a small trickle of new inventory, leaving us with only 0.6 months of inventory heading into the second quarter. This has caused days on market to shrink and list-to-sale price ratios to rise. These conditions are very favorable to sellers. In fact, the average price was up 2% in March over February! The good news is that new listings were up 49% in that same time frame. We hope to see that trend continue as we head into spring as the buyer demand is there to absorb it and it is needed to slow price growth.
Eastside
More inventory is needed to quench buyer demand as we head into spring and summer.

The Eastside ended 2015 with a larger-than-seasonally-normal surge of closed sales, leaving us with only 1.3 months of inventory based on pending sales to start the year, which is not much! The first quarter saw a frenzy of buyer activity but only a small trickle of new inventory, leaving us with only 0.9 months of inventory heading into the second quarter. This has caused days on market to shrink and list-to-sale price ratios to rise. These conditions are very favorable to sellers. In fact, average and median prices were up 4% in March over February! The good news is that new listings were up 43% in that same time frame. We hope to see that trend continue as we head into spring as the buyer demand is there to absorb it and it is needed to slow price growth.
Seattle Metro
More inventory is needed to quench buyer demand as we head into spring and summer.

The Seattle Metro area ended 2015 with a larger-than-seasonally-normal surge of closed sales, leaving us with only 1.1 months of inventory based on pending sales to start the year, which is not much! The first quarter saw a frenzy of buyer activity but only a small trickle of new inventory, leaving us with only 0.6 months of inventory heading into the second quarter. This has caused days on market to shrink and list-to-sale price ratios to rise. These conditions are very favorable to sellers. In fact, average and median prices were up 3% in March over February! The good news is that new listings were up 47% in that same time frame. We hope to see that trend continue as we head into spring as the buyer demand is there to absorb it and it is needed to slow price growth.
South King County
More inventory is needed to quench buyer demand as we head into spring and summer.
South King County ended 2015 with a larger-than-seasonally-normal surge of closed sales, leaving us with only 1.4 months of inventory based on pending sales to start the year, which is not much! The first quarter saw a frenzy of buyer activity but only a small trickle of new inventory, leaving us with only 0.8 months of inventory heading into the second quarter. This has caused days on market to shrink and list-to-sale price ratios to rise. These conditions are very favorable to sellers. In fact, average and median prices were up 6% and 3% respectively in March over February! The good news is that new listings were up 39% in that same time frame. We hope to see that trend continue as we head into spring, as the buyer demand is there to absorb it and it is needed to slow price growth.
This is only snapshots of the trends in our area. Please contact one of our agents if you would like further explanation of how the latest trends relate to you.
Market Update – Q3 2015
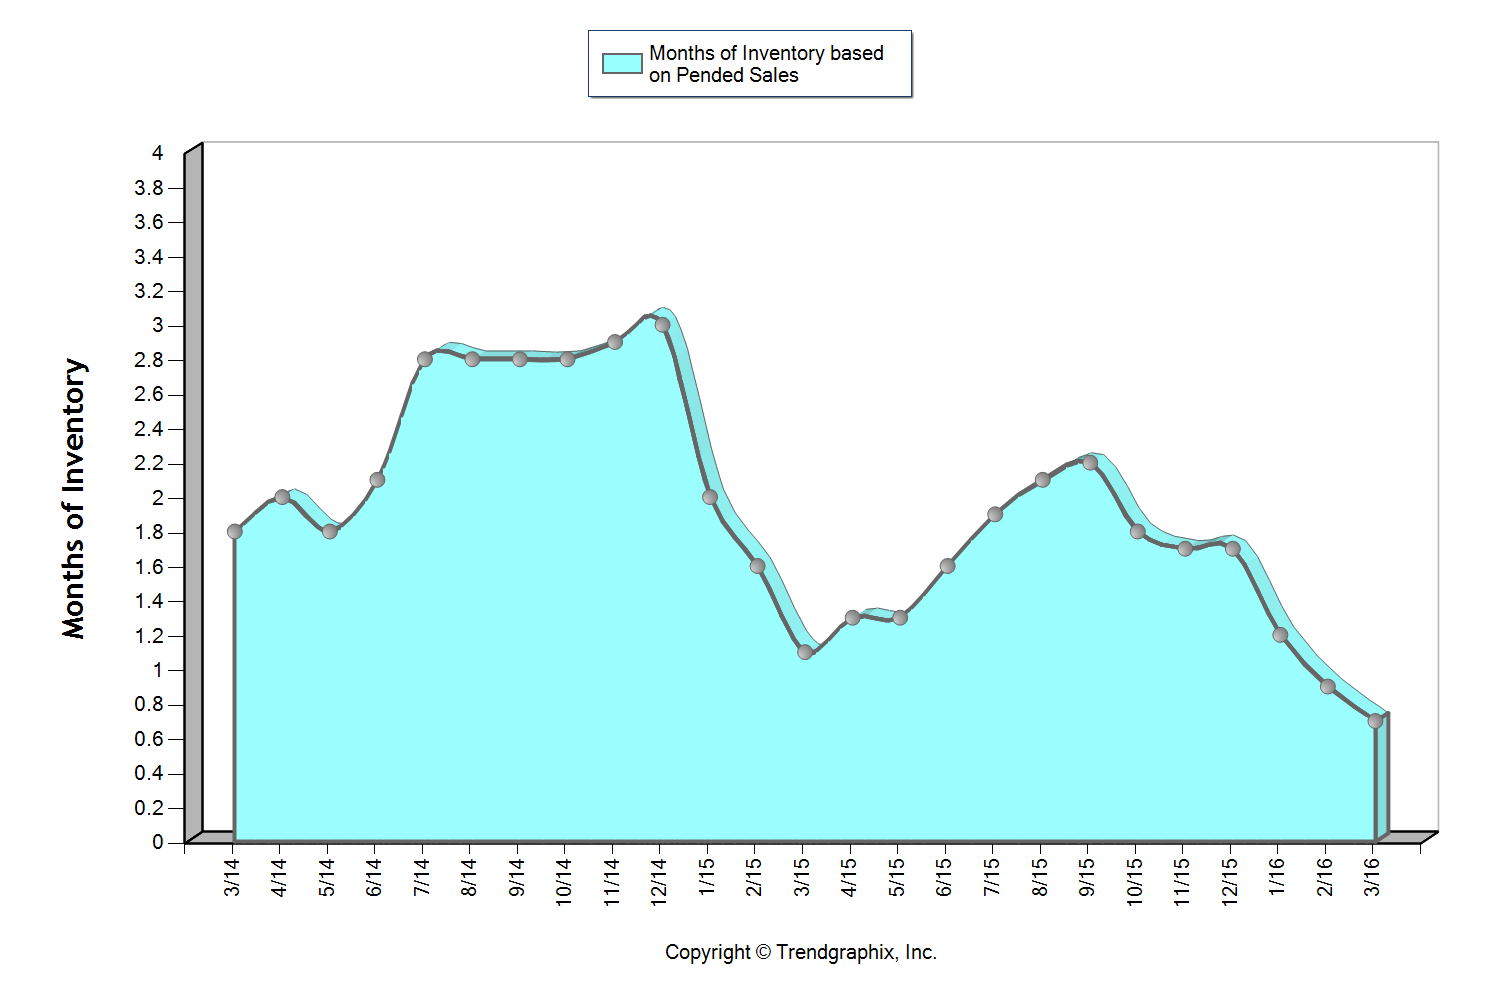
Snohomish County
Seasonal patterns are returning after the market’s fall and recovery
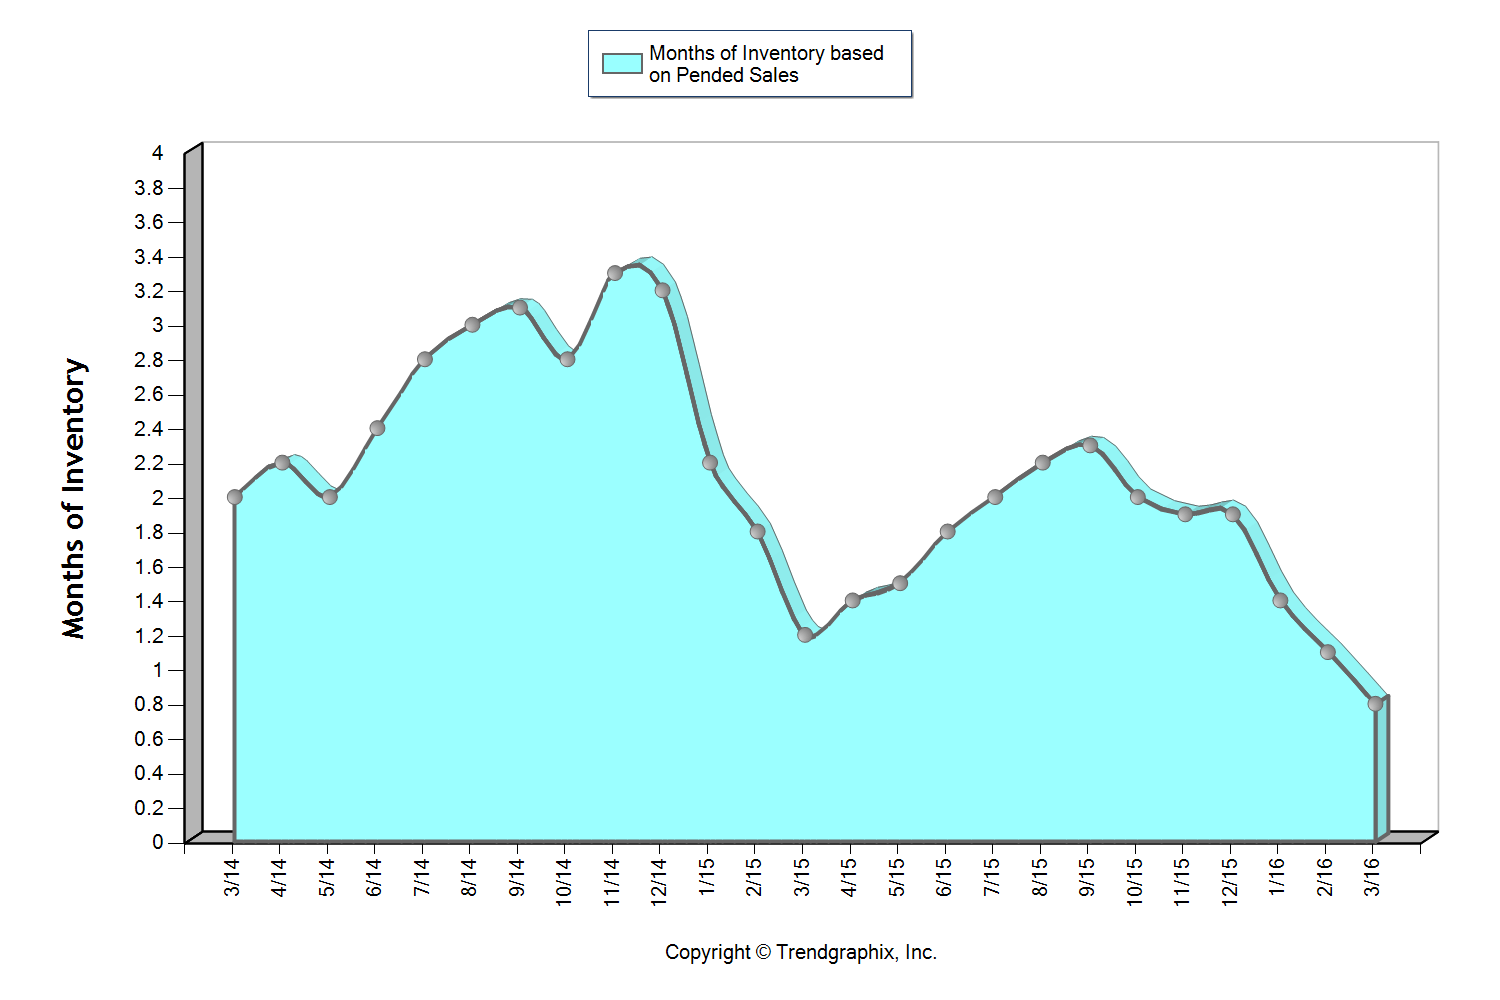
The graph above shows a two-year history of the market, where we have clearly seen a surge of inventory from March to August. In fact we saw a 48% increase in inventory during this time period. While that is a welcome increase, inventory growth was down 1% from the year prior, all while closed sales were up 18%! Months of Inventory based on pending sales has held steady at an average of two months over the last year. Due to demand outweighing supply we continue to see above-normal price growth, with both median and average prices up 9% complete year-over-year.
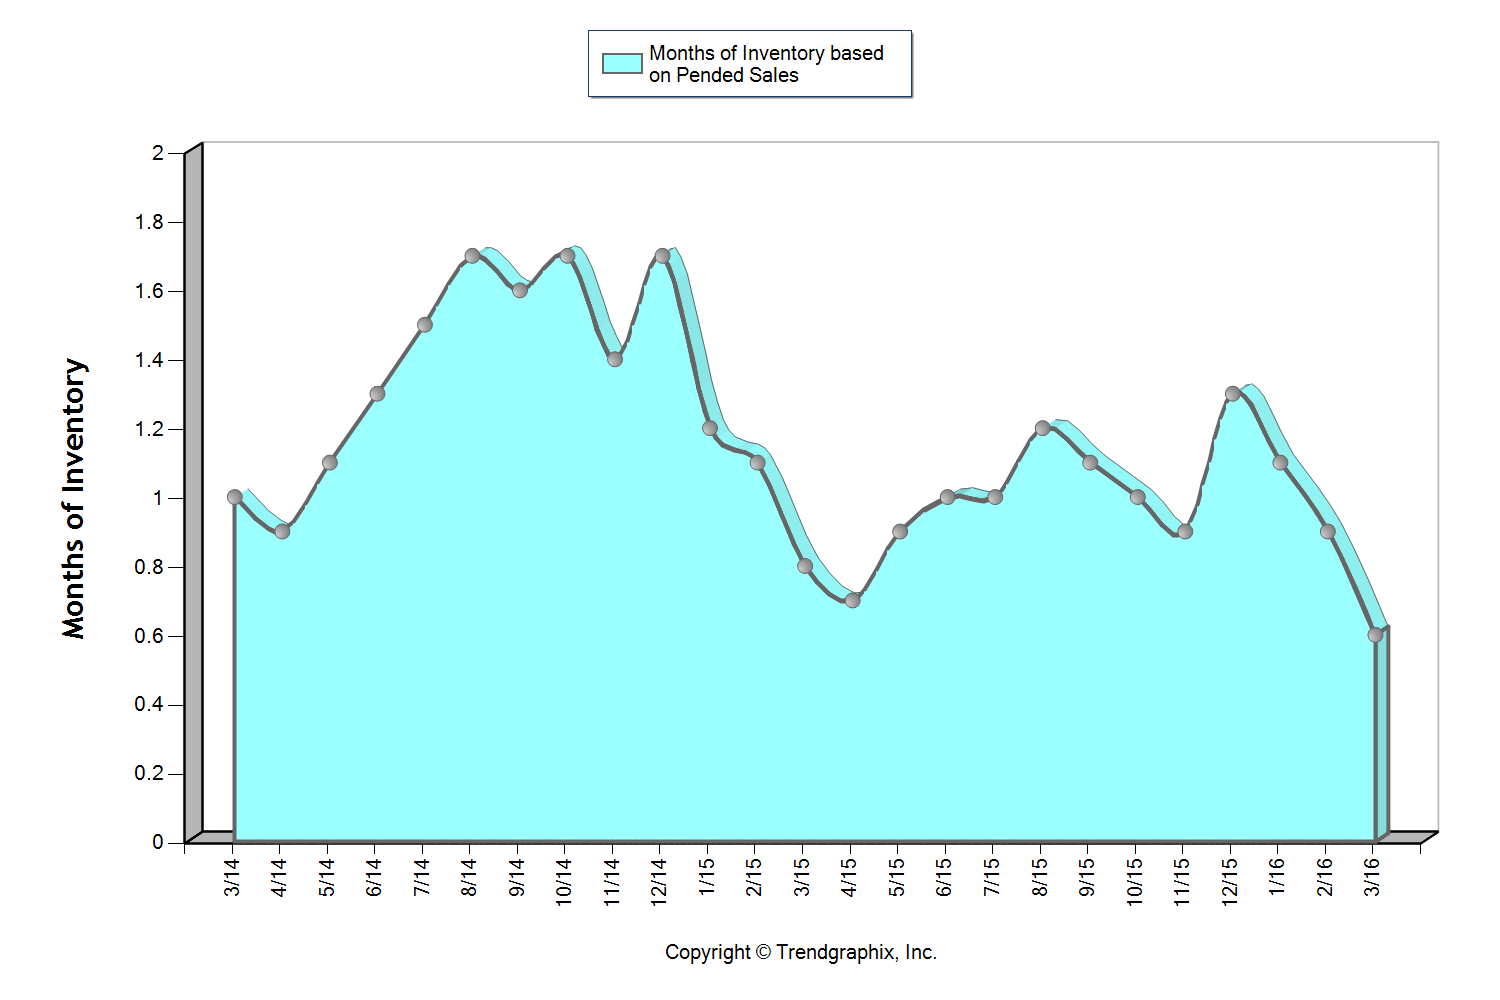
South Snohomish County
Seasonal patterns are returning after the market’s fall and recovery
You can see in the graph above a clear surge of inventory came to market from March to August. In fact we saw a 53% increase in inventory during this time period. While that is a welcome increase, inventory growth was down 5% from the year prior, all while closed sales were up 19%! Months of Inventory based on pending sales has held steady at an average of two months over the last year. Due to demand outweighing supply we continue to see above-normal price growth, with both median and average prices up 9% complete year-over-year.
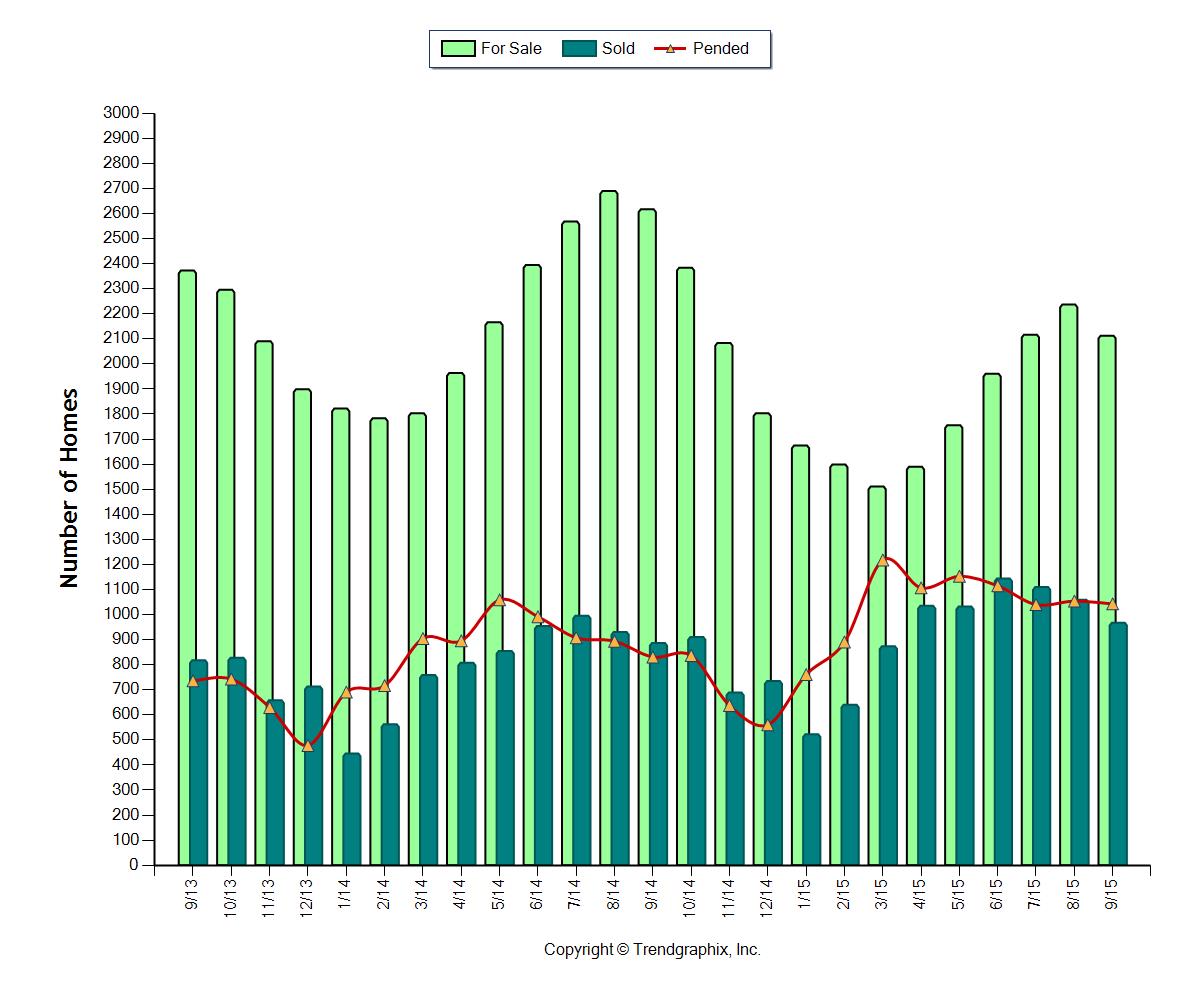
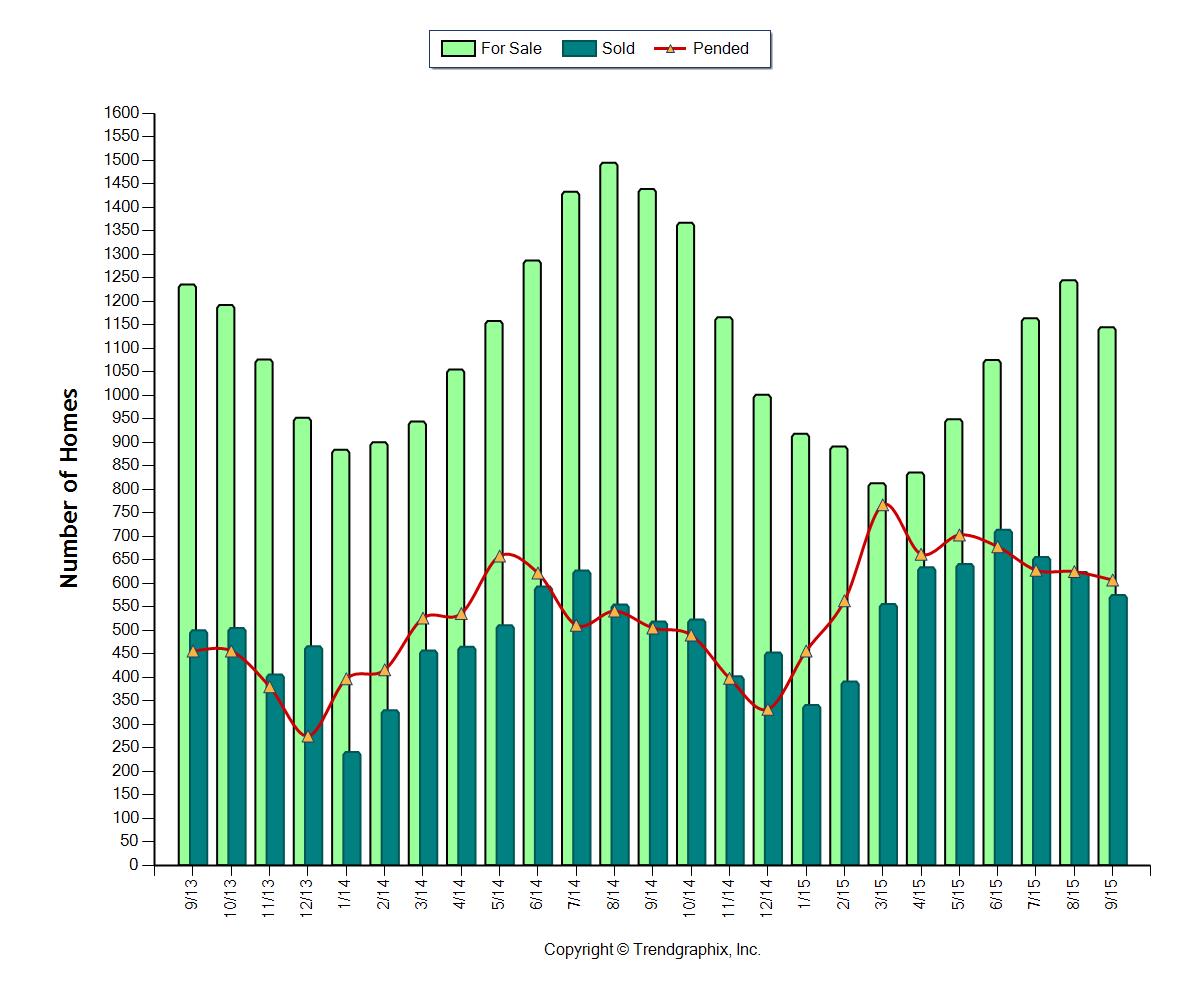
North King County
Price increases are strong due to high demand and low inventory
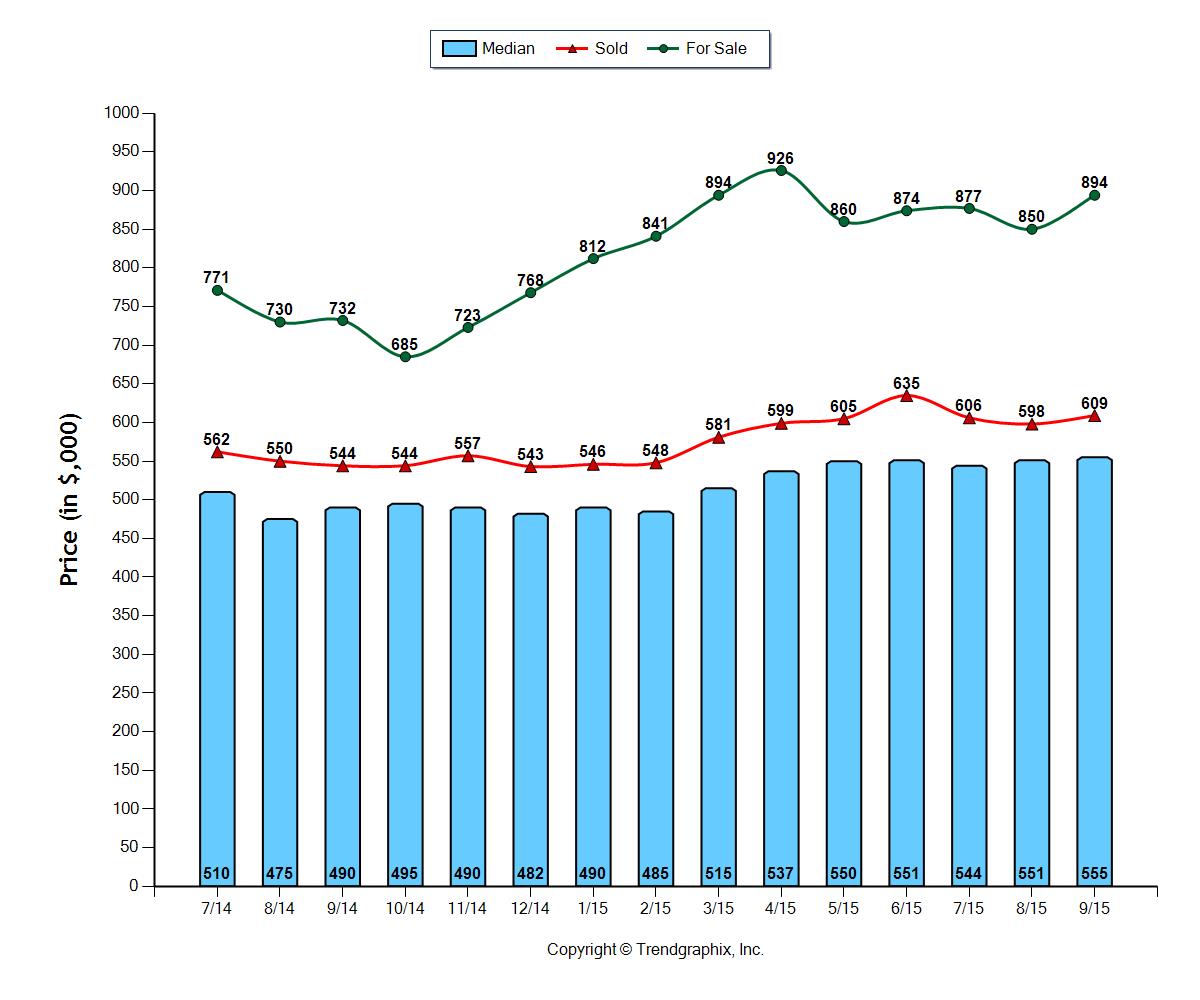
All indicators, such as sold median price, sold average price and sold price per square foot point to a 10% increase in prices complete year-over-year. The median price in North King County this September was $555,000 and the average was $609,000. Average days on market have shrunk to as low as 22 days this last month, and the list to sale price ratio was 101%. Lack of supply and high demand is the gas in this market’s engine. Months of inventory based on pending sales finally crested one month after a small surge of additional inventory in the third quarter.
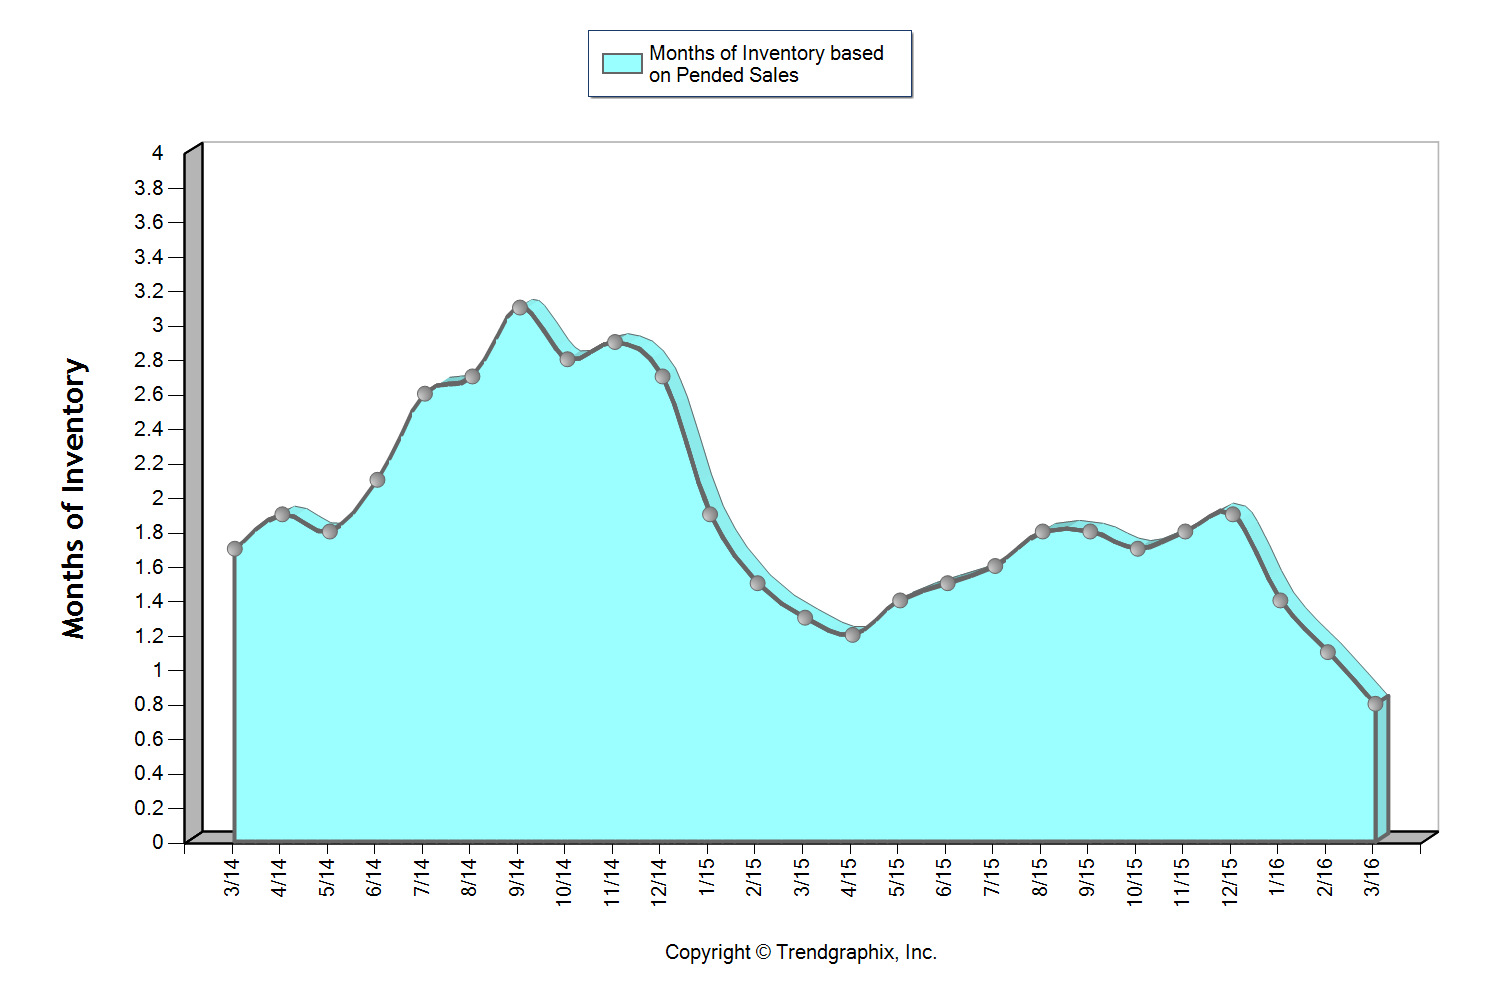
Eastside
Seasonal patterns are returning after the market’s fall and recovery
The graph above shows a two-year history of the market, where we have clearly seen a surge of inventory from February to August. In fact we saw a 44% increase in inventory during this time period. While that is a welcome increase, inventory growth was down 45% from the year prior, all while closed sales were up 10%! Months of Inventory based on pending sales has held steady at an average of 1.5 months over the last year. Due to demand outweighing supply we continue to see above normal price growth, with both median and average prices up 9% complete year-over-year.
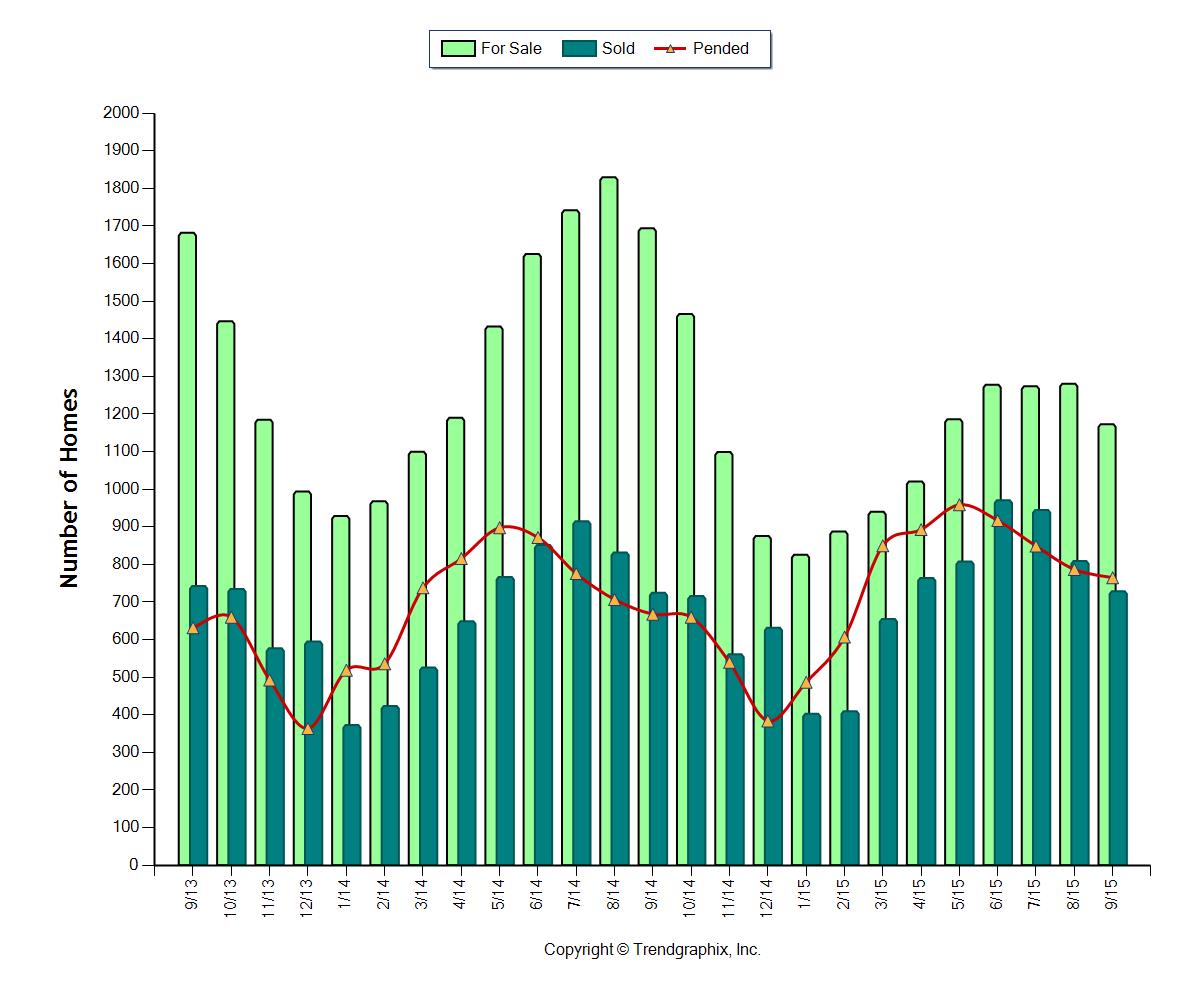
Seattle Metro
Price increases are strong due to high demand and low inventory
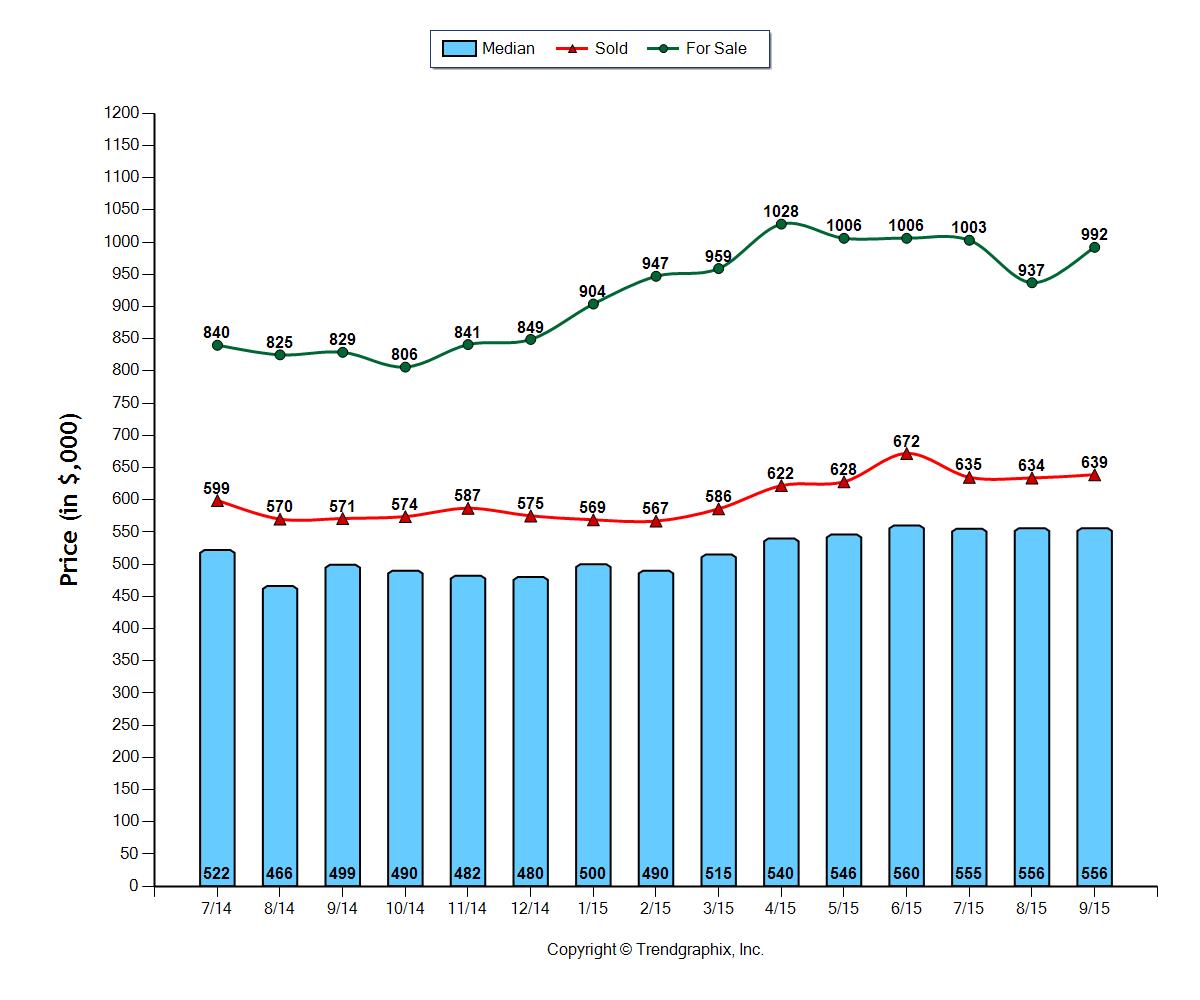
All indicators, such as sold median price, sold average price and sold price per square foot point to an 11% increase in prices complete year-over-year. The median price in the Seattle Metro area this September was $556,000 and the average was $639,000. Average days on market have shrunk to as low as 22 days this last month, and the list to sale price ratio was 101%. Lack of supply and high demand is the gas in this market’s engine. Months of inventory based on pending sales finally crested one month after a small surge of additional inventory in the third quarter.
South King County
Price increases are strong due to high demand and low inventory

All indicators point to strong price increases with median price up 11%, average price up 8% and average price per square foot up 8% complete year-over-year. The median price in South King County this September was $335,000 and the average was $358,000. Average days on market have shrunk to as low as 36 days this last month, and the list to sale price ratio was 99%. Lack of supply and high demand is the gas in this market’s engine. Months of inventory based on pending sales finally crested 1.5 months after a small surge of additional inventory in the third quarter.
This is only snapshots of the trends in our area. Please contact one of our agents if you would like further explanation of how the latest trends relate to you.
