
 Facebook
 X
X
 Pinterest
 Copy Link
Demand is High, Inventory Low… Here we Go!
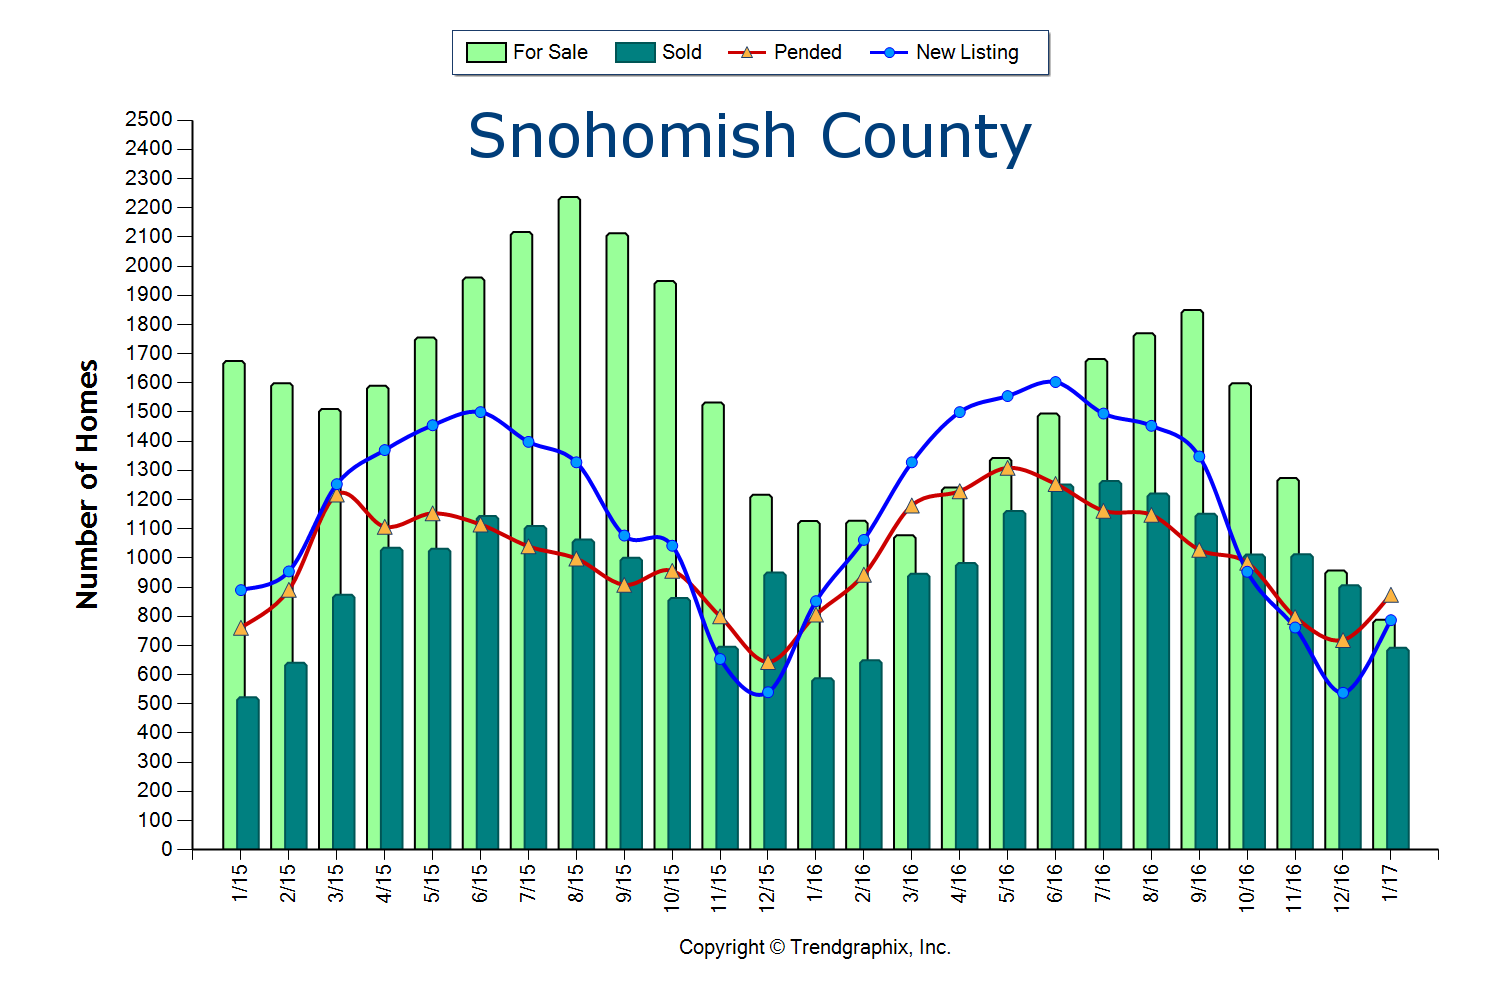
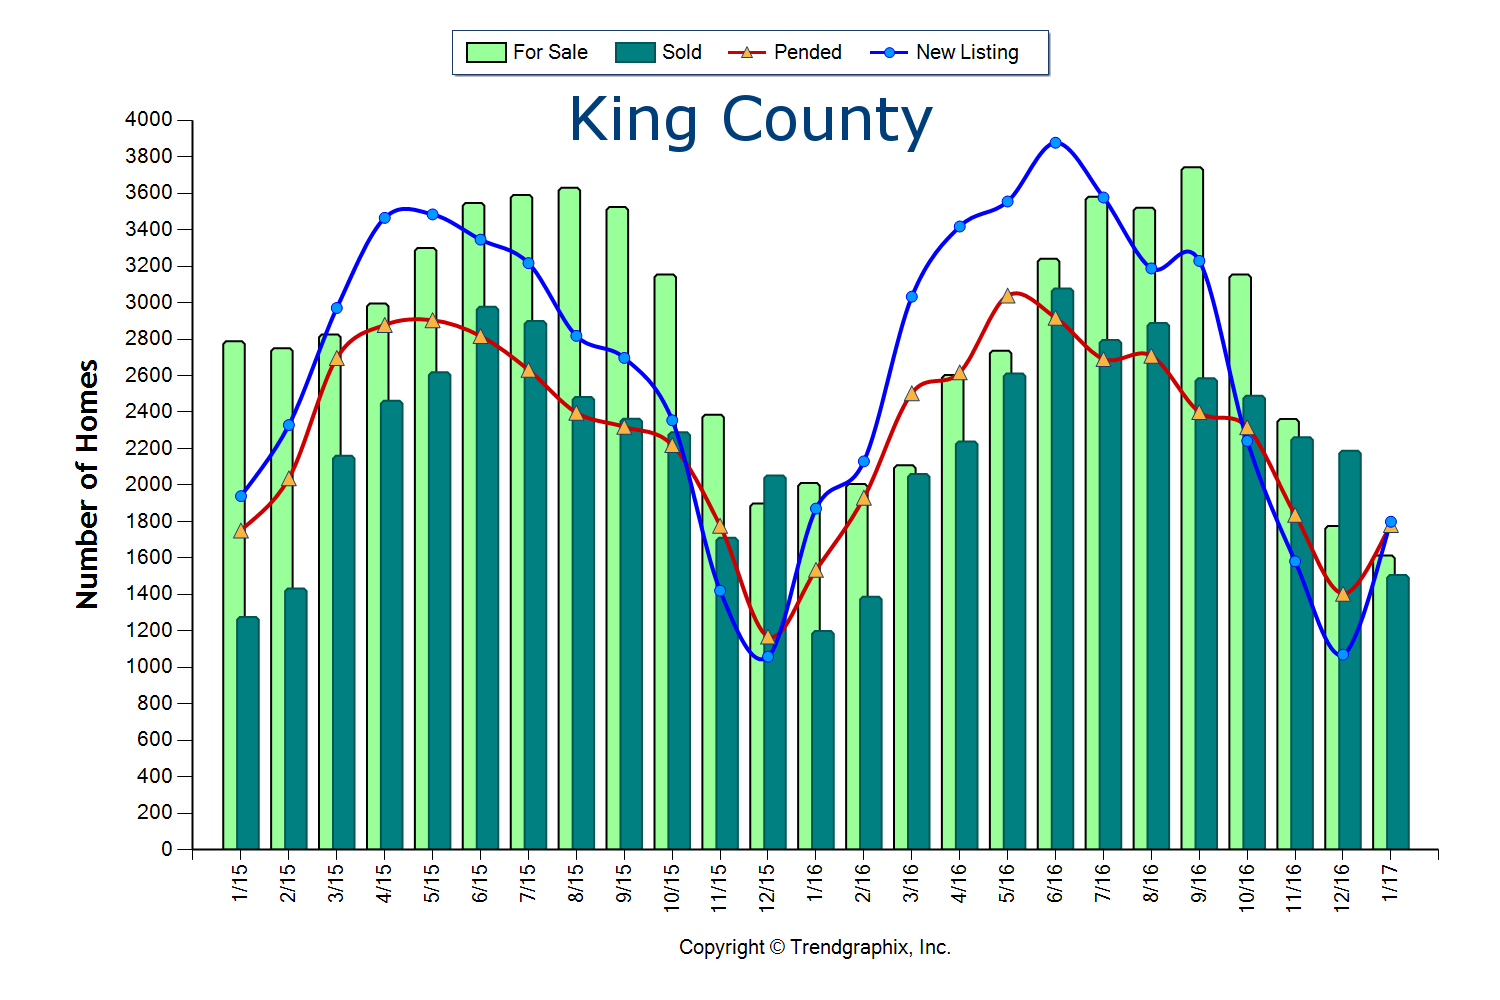
The two graphs here illustrate the amount of homes for sale, the amount of homes that sold, pending sales and new listings over the past two years in King and Snohomish Counties. This gives us a good look at the simple principle of supply and demand. We are currently experiencing one of the strongest Seller’s markets in recent history. A Seller’s market is defined by having three or less months of available inventory. Currently, King and Snohomish counties have only 0.9 months of inventory based on pending sales. This means that if no new homes came to market, we would be sold out of homes in less than a month. What is crazy is that this inventory count is down 30% from the year prior, which was also an extreme Seller’s market!
 Where this particular Seller’s market is unique, is that a decrease in new listings is not creating this environment, but very high buyer demand is. In fact, King County new listings were up 5% over the last year, but so were sales. In Snohomish County new listings were up 7% over last year, but sales were up 11%! Despite the increase in homes coming to market, demand has matched or outpaced, leaving us with the lowest inventory levels ever.
We can thank our local, thriving job market. So much so, that many people from out-of-state are relocating here to be a part of our economy and the quality of life the Greater Seattle area has to offer. We also have poised move-up buyers ready to cash in on their equity and first-timers ready for action. Combine the healthy local economy with strong equity levels and still historically low interest rates, and the audience for homes that come to market is huge!
Multiple offers are very common and prices are increasing. Median price is up complete year over year in King County by 13% and Snohomish County by 10%. This growth in equity has provided home owners the option to make the moves they have been waiting for, such as a move-up, right-size or relocating out of the area for retirement.
These graphs predict that we will see an increase in new listings as we head into the Spring and Summer months, which is needed to meet demand. If you are considering putting your home on the market this year I would advise the sooner the better, as buyers did not hibernate for the winter and will not be worried about flowers blooming in your front yard. Sellers that beat the second quarter increase in listings will enjoy a larger audience due to less competition.
 The importance of both buyers and sellers aligning with a knowledgeable, well-researched and responsive broker is paramount. One might think that it is “easy” to sell a house in this market, but how the preparation, exposure, marketing, management of all the communication and negotiations are handled can make or break a seller’s net return on the sale. While market times are short, they are intense! Negotiations are starting as soon as the property hits the market by educating buyers and their brokers on exactly what a seller would like by the time offers are due. The goal is to bring the sellers I work with not only the highest price, but the best-termed offer that I know is going to close.
If you’re a buyer, it is overwhelmingly important that you are aligned with an agent that knows how to win in this market. Terms, negotiations, financial preparation, communication, responsiveness and market knowledge are what set a highly capable selling agent apart, and are required to prevail. While the market for buyers is fierce, we can assure you that with a well thought out and executed plan, we have helped buyers win.
If you have any curiosities or questions regarding the value of your current home or purchase opportunities in today’s market, please contact us. It is my goal to help keep you informed and empower strong decisions.
Market Update – Q3
Inventory levels providing more choices for buyers; is the market starting to stabilize?
As we head into the fall and winter months after an incredibly eventful spring and summer, available inventory levels are starting to ease. It is still a seller’s market (3 months of inventory or less) in most areas, but one that is providing buyers increased options. The increase in available inventory is due to pent-up seller demand starting to come to market. The return of strong equity levels have brought sellers to market that have been waiting to jump in for some time. Continued buyer demand due to our flourishing job market and historically low interest rates have steadily absorbed new inventory, but we are finally starting to see a trend toward some more balance. This is good news! Additionally, lending requirements remain stringent and down payments are bigger, unlike the dreaded bubble market we experienced in 2007/2008. Educated pricing and sound condition is what will drive a buyer’s interest in a home. As the market stabilizes, it will be important for consumers to partner with a broker who closely follows the market to help them make informed decisions and develop winning strategies.
Read below for market details from Snohomish County down through south King County.
Snohomish County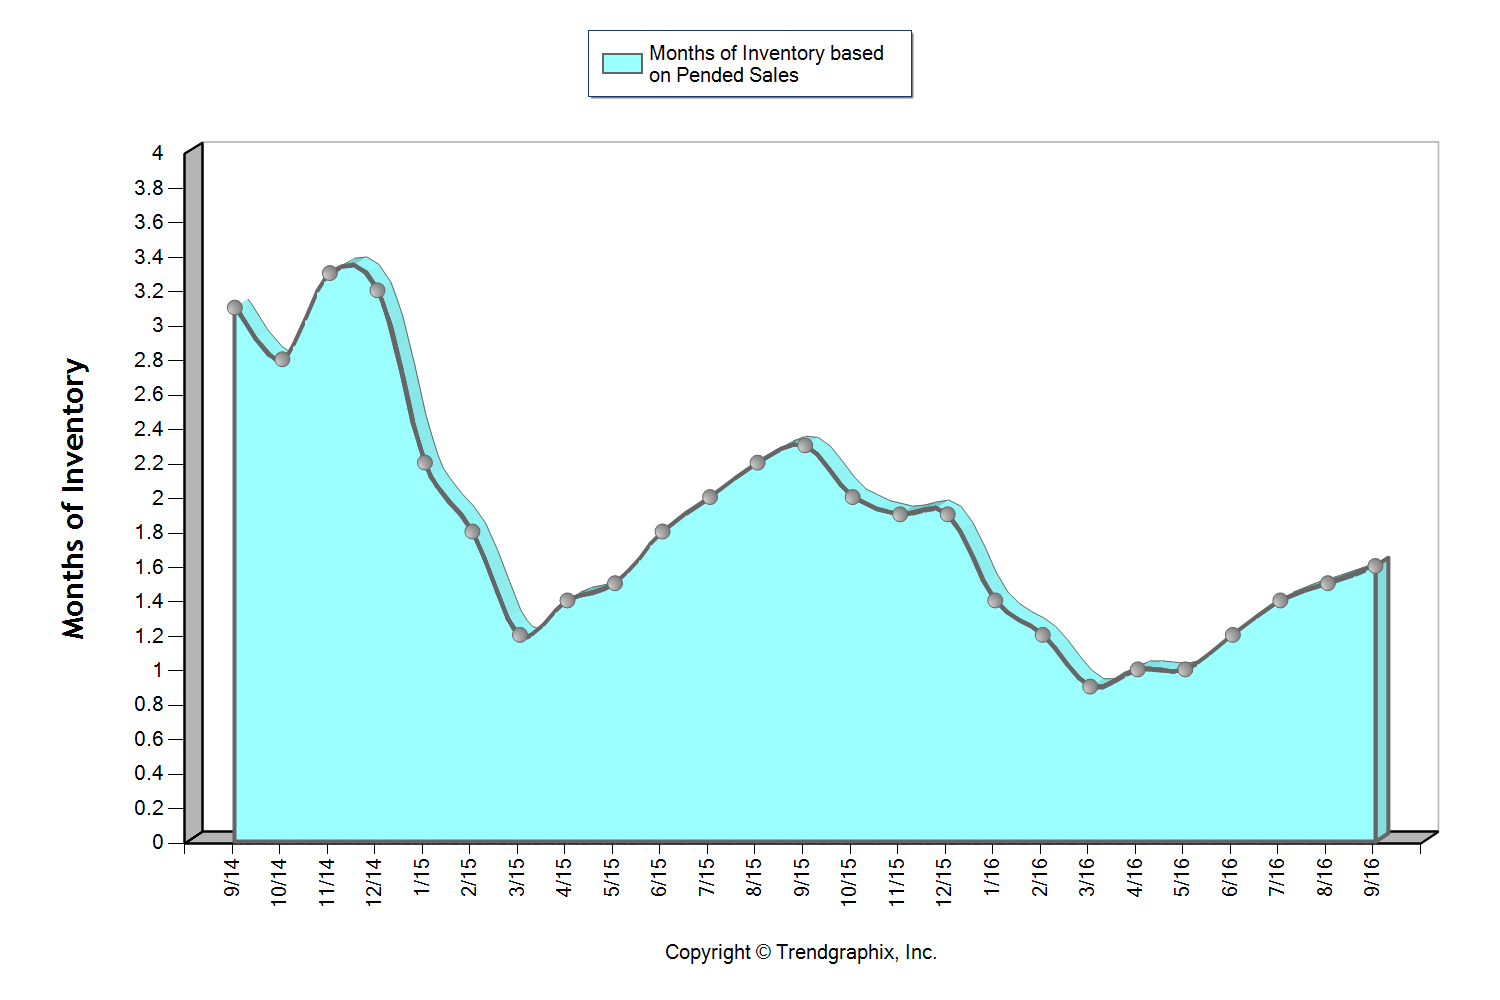
This graph shows that we currently sit at 1.6 months of inventory based on pending sales, which is the highest level we have seen in all of 2016! It is still a seller’s market (3 months or less), but one that is providing buyers increased options. The average cumulative days on market reached 28 days in September, which was up 8% over August. Median price peaked in August at $401,000 and settled at $397,000 in September after hovering between $380,000 and $400,000 since April. For the first time since February, the average list to sale price ratio was 99% after sitting at 100-101% over the last six months.
The return of strong equity levels have brought sellers to market that have been waiting to jump in for some time. In fact, average prices have grown just over 20% over the last two years, freeing up sellers to make the moves they have been waiting for. Continued buyer demand due to our flourishing job market and historically low interest rates have steadily absorbed new inventory, but we are finally starting to see a trend toward some more balance. This is good news! We are still seeing multiple offers and quick market times, but not quite the frenzy that we experienced earlier this year.
All of these factors indicate that we may finally be headed towards a more stabilized market with positive attributes for both buyers and sellers.
South Snohomish County 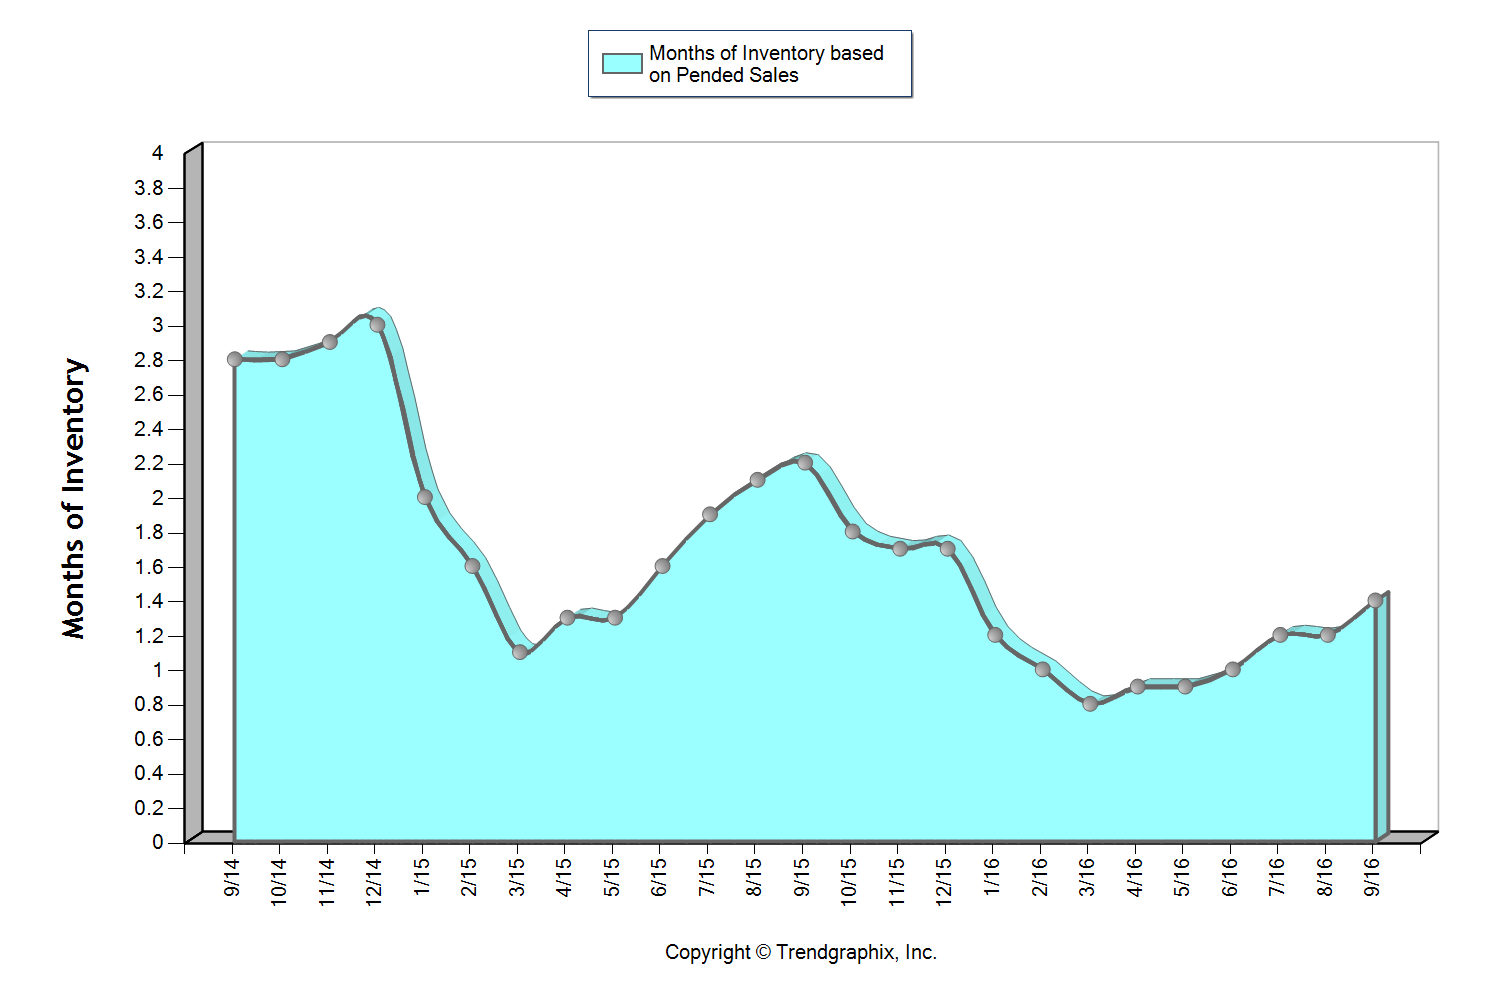
This graph shows that we currently sit at 1.4 months of inventory based on pending sales, which is the highest level we have seen in all of 2016! It is still a seller’s market (three months or less), but one that is providing buyers increased options. The average cumulative days on market reached 24 days in September, which was up 14% over August. Median price peaked in August at $453,000 and settled at $440,000 in September after hovering between $440,000 and $450,000 since March. For the first time since February, the average list to sale price ratio was 99% after sitting at 100-101% over the last six months.
The return of strong equity levels have brought sellers to market that have been waiting to jump in for some time. In fact, average prices have grown just over 20% over the last two years, freeing up sellers to make the moves they have been waiting for. Continued buyer demand due to our flourishing job market and historically low interest rates have steadily absorbed new inventory, but we are finally starting to see a trend toward some more balance. This is good news! We are still seeing multiple offers and quick market times, but not quite the frenzy that we experienced earlier this year.
All of these factors indicate that we may finally be headed towards a more stabilized market with positive attributes for both buyers and sellers.
North King County 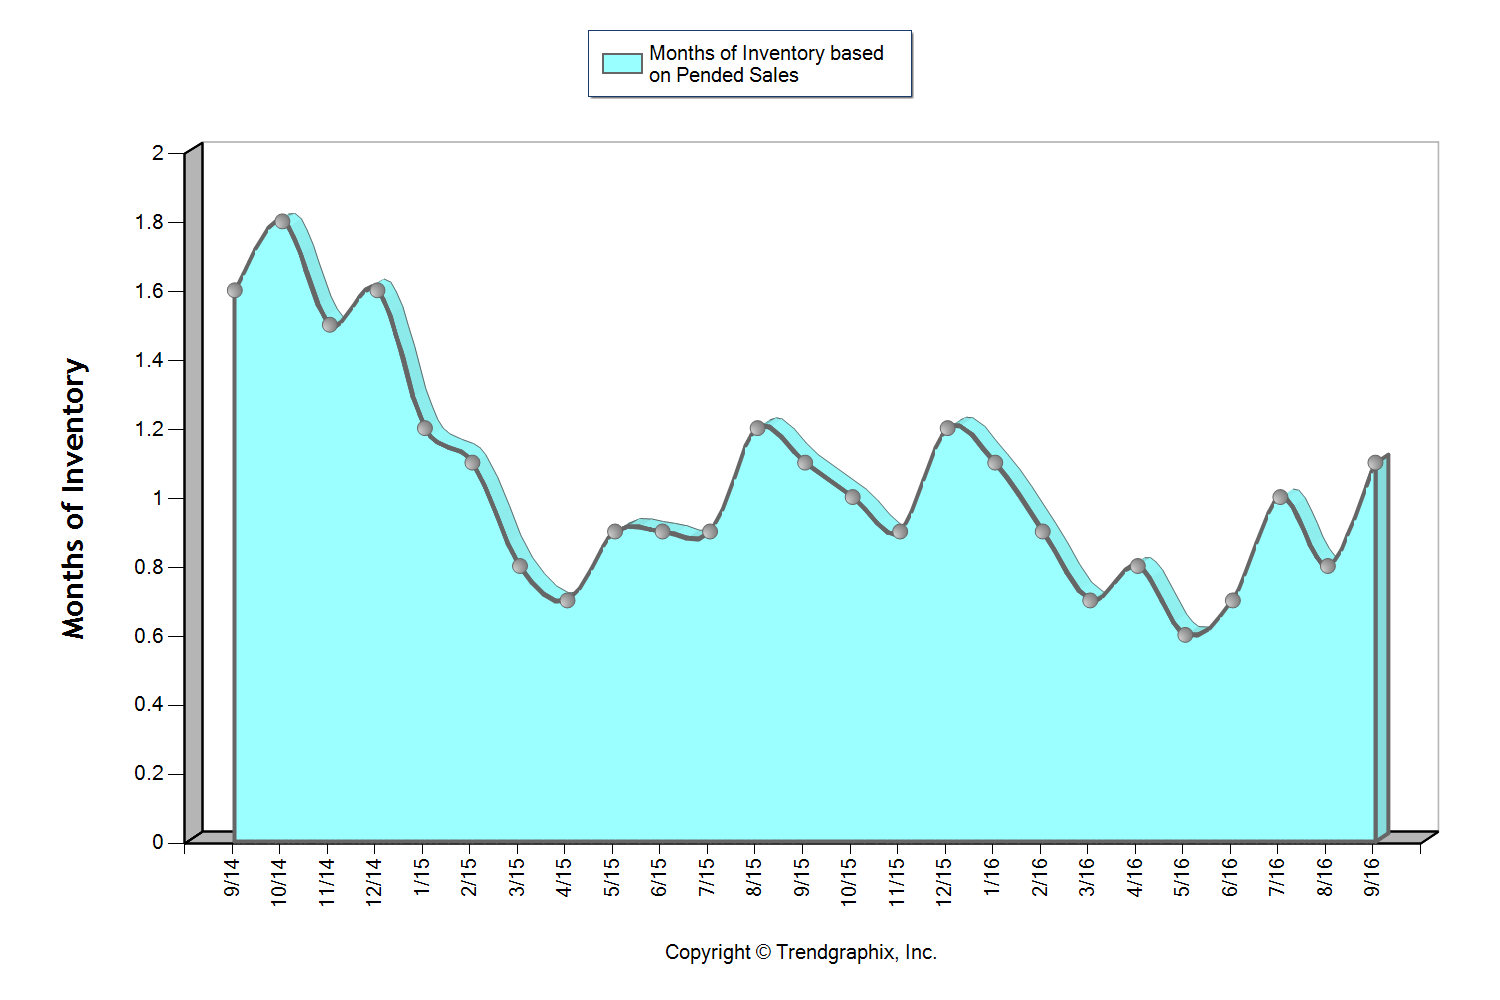
This graph shows that we currently sit at 1.1 months of inventory based on pending sales, which is the highest level we have seen since January! It is certainly still a seller’s market (3 months or less), but one that is starting to provide buyers increased options. In fact, we saw a 13% jump in new listings month-over-month. The average cumulative days on market reached 20 days in September, which was up 18% over August. Median price peaked in June at $650,000 and settled at $600,000 in September after hovering between $605,000 and $650,000 since March. In June, there were 95% more home sales above $1M over September. For the first time since February, the average list to sale price ratio was 101% after sitting at 102-104% over the last seven months.
The return of strong equity levels have brought sellers to market that have been waiting to jump in for some time. In fact, average prices have grown 21% over the last two years, freeing up sellers to make the moves they have been waiting for. Continued buyer demand due to our flourishing job market and historically low interest rates have steadily absorbed new inventory, but we are finally starting to see a trend toward some more balance. This is good news! We are still seeing multiple offers and quick market times, but not quite the frenzy that we experienced earlier this year.
All of these factors indicate that we may finally be headed towards a more stabilized market with positive attributes for both buyers and sellers.
Eastside 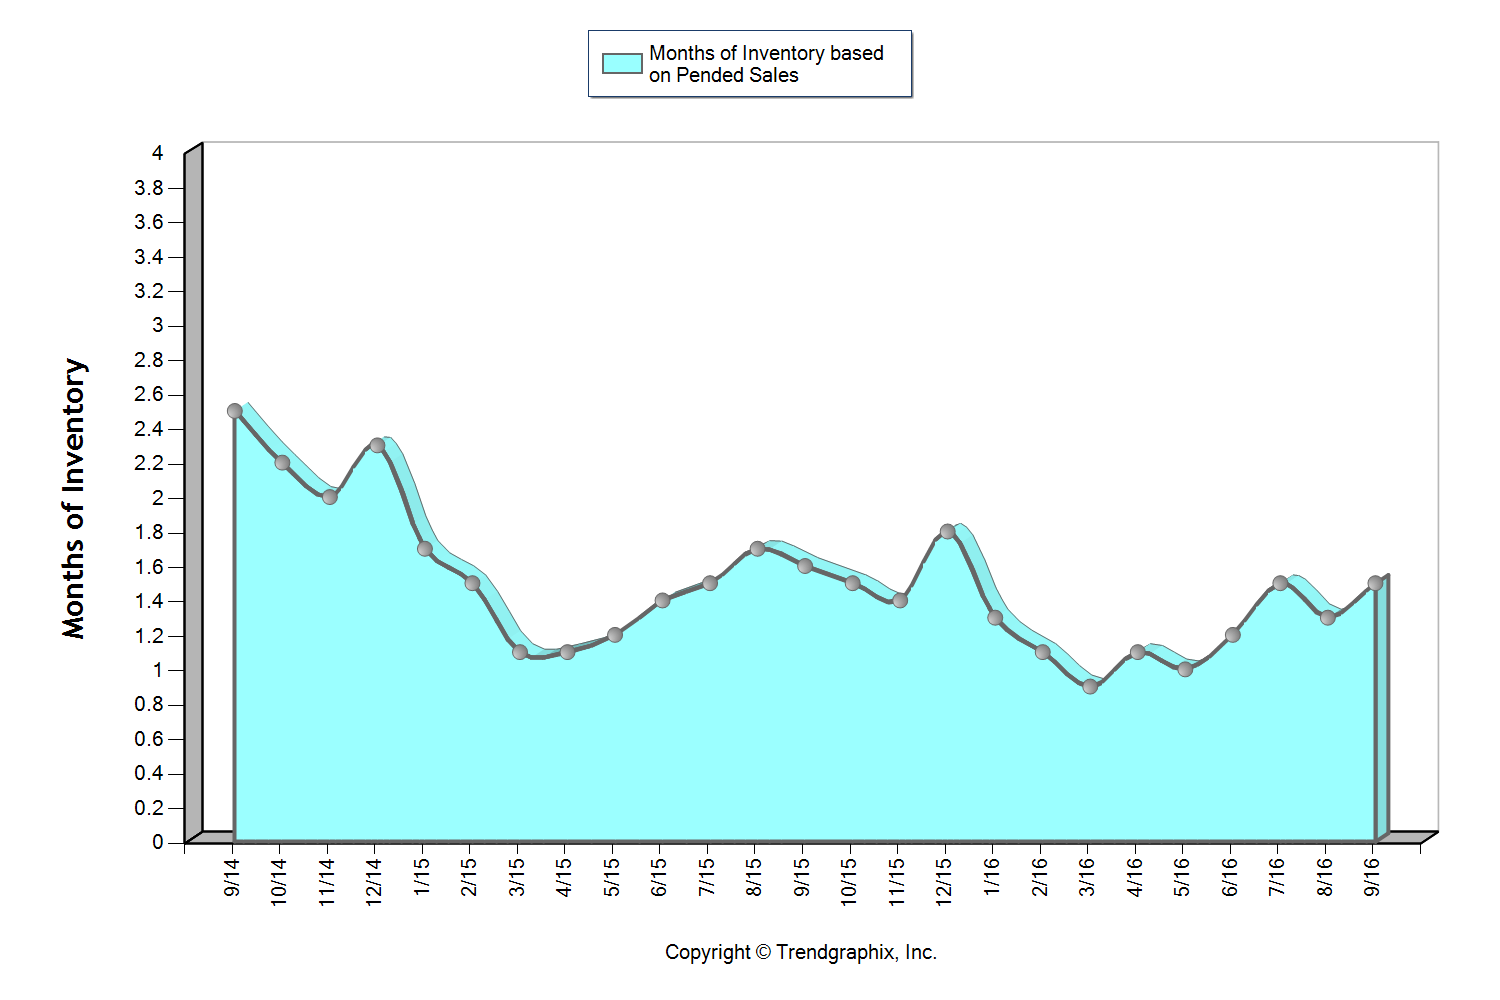
This graph shows that we currently sit at 1.5 months of inventory based on pending sales, which is the highest level we have seen in all of 2016! It is still a seller’s market (3 months or less), but one that is starting to provide buyers increased options. The average cumulative days on market reached 31 days in September which was up 24% over August. Median price peaked in August at $770,000 and settled at $750,000 in September after hovering between $737,000 and $770,000 since March. In June, there were 18% more home sales above $1M over September. Over the last two months, the average list to sale price ratio was 99% after sitting at 101-102% over the five months prior.
The return of strong equity levels have brought sellers to market that have been waiting to jump in for some time. In fact, average prices have grown 25% over the last two years, freeing up sellers to make the moves they have been waiting for. Continued buyer demand due to our flourishing job market and historically low interest rates have steadily absorbed new inventory, but we are finally starting to see a trend toward some more balance. This is good news! We are still seeing multiple offers and quick market times, but not quite the frenzy that we experienced earlier this year.
All of these factors indicate that we may finally be headed towards a more stabilized market with positive attributes for both buyers and sellers.
Seattle Metro 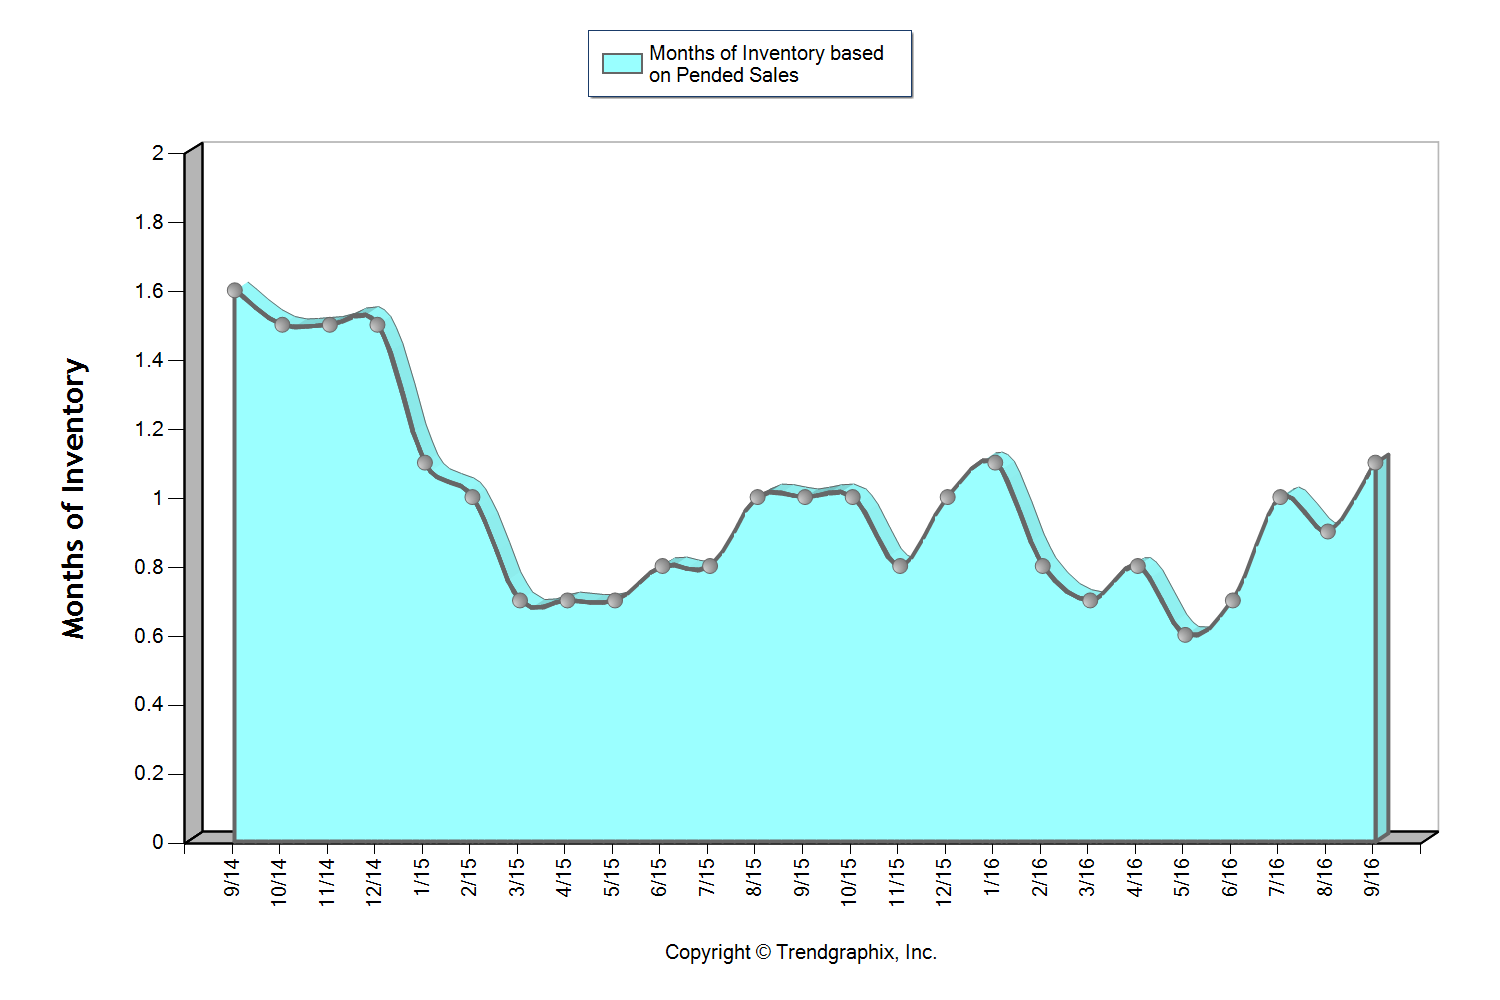
This graph shows that we currently sit at 1.1 months of inventory based on pending sales, which is the highest level we have seen since January! It is certainly still a seller’s market (3 months or less), but one that is starting to provide buyers increased options. In fact, we saw a 16% jump in new listings month-over-month. The average cumulative days on market reached 21 days in September, which was up 31% over August. Median price peaked in June at $650,000 and settled at $605,000 in September after hovering between $608,000 and $650,000 since March. In June, there were 23% more home sales above $1M over September. For the first time since February, the average list to sale price ratio was 101% after sitting at 102-104% over the last seven months.
The return of strong equity levels have brought sellers to market that have been waiting to jump in for some time. In fact, average prices have grown 22% over the last two years, freeing up sellers to make the moves they have been waiting for. Continued buyer demand due to our flourishing job market and historically low interest rates have steadily absorbed new inventory, but we are finally starting to see a trend toward some more balance. This is good news! We are still seeing multiple offers and quick market times, but not quite the frenzy that we experienced earlier this year.
All of these factors indicate that we may finally be headed towards a more stabilized market with positive attributes for both buyers and sellers.
South King County 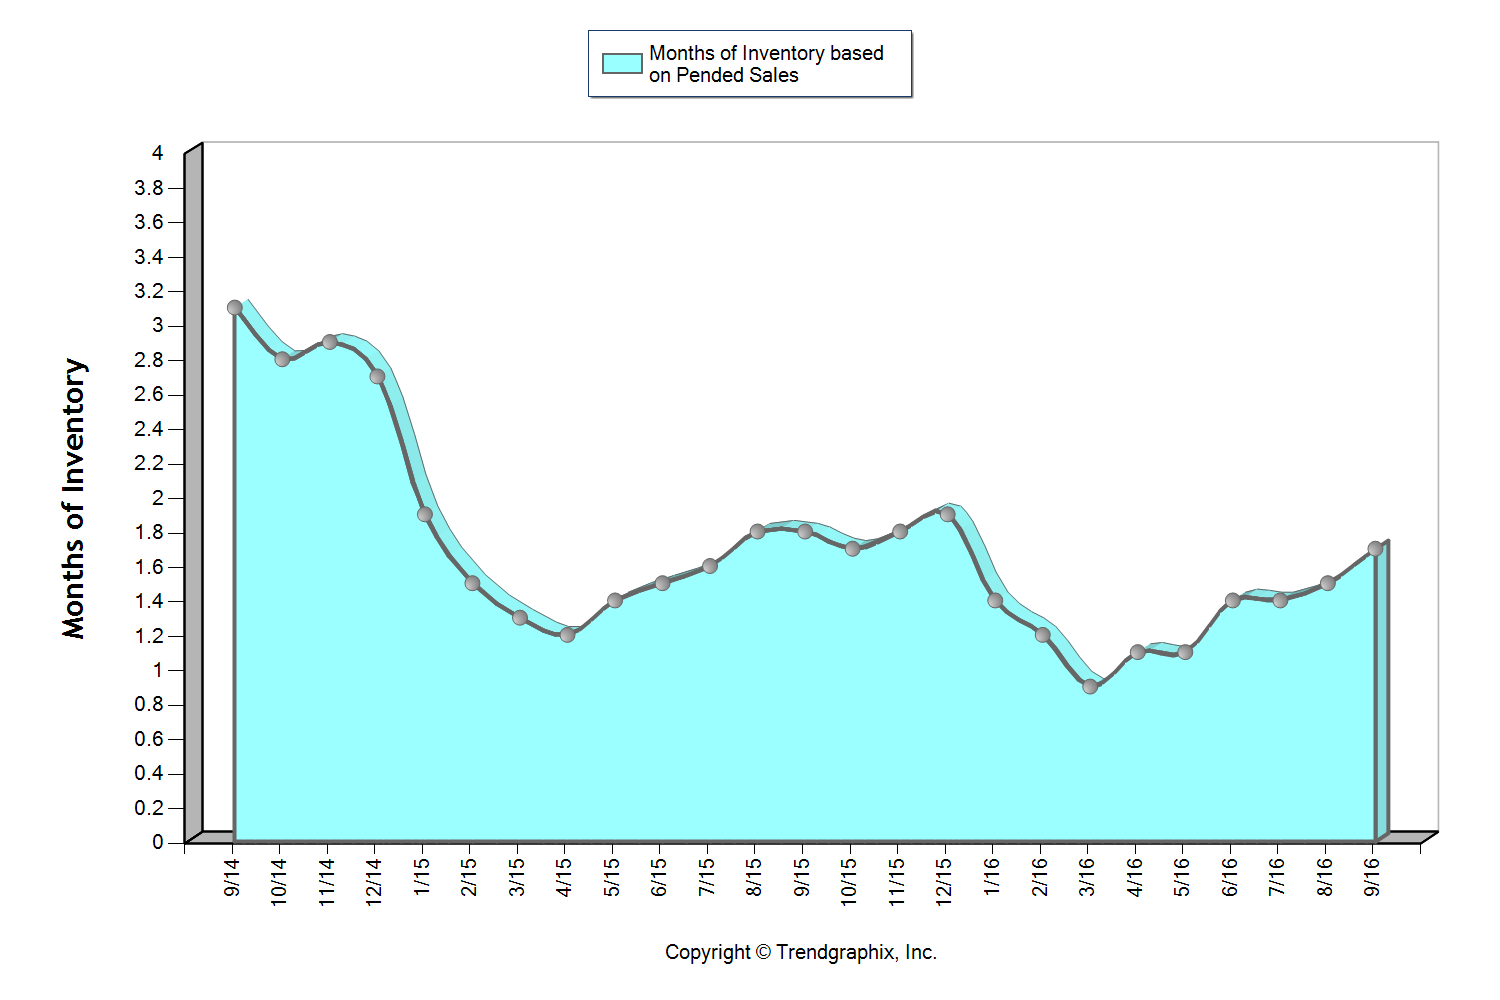
This graph shows that we currently sit at 1.7 months of inventory based on pending sales, which is the highest level we have seen in all of 2016! It is still a seller’s market (3 months or less), but one that is providing buyers increased options. The average cumulative days on market reached 27 days in both August and September, which was up 23% over July. Median price peaked in June at $371,000 and settled at $360,000 in September after hovering between $350,000 and $371,000 since March. For the first time since March, the average list to sale price ratio was 99% in August and September after sitting at 100-101% the prior four months.
The return of strong equity levels have brought sellers to market that have been waiting to jump in for some time. In fact, average prices have grown 16% over the last two years, freeing up sellers to make the moves they have been waiting for. Continued buyer demand due to our flourishing job market and historically low interest rates have steadily absorbed new inventory, but we are finally starting to see a trend toward some more balance. This is good news! We are still seeing multiple offers and quick market times, but not quite the frenzy that we experienced earlier this year.
All of these factors indicate that we may finally be headed towards a more stabilized market with positive attributes for both buyers and sellers.
These are only snapshots of the trends in our area; please contact one of our agents if you would like further explanation of how the latest trends relate to you.
A Thirteen-Year Overview of Inventory Levels- Where’s the Balance?
The two graphs here illustrate a thirteen-year overview of inventory levels in both King and Snohomish Counties, highlighting the 2007 crash. Inventory levels are measured by the months of available inventory. For example, if there were 60 homes available in July and 30 homes sold in July, you would be left with two months of inventory; meaning that if no new homes came to market, the demand of 30 homes per month would absorb the 60 available homes in two months. A buyer's market is defined by 6+ months of inventory, a balanced market, 3-6 months and a seller's market, 0-3 months. From March to June of this year we averaged 1.1 months of inventory in King County and 1.2 months in Snohomish County, both extreme seller's markets.
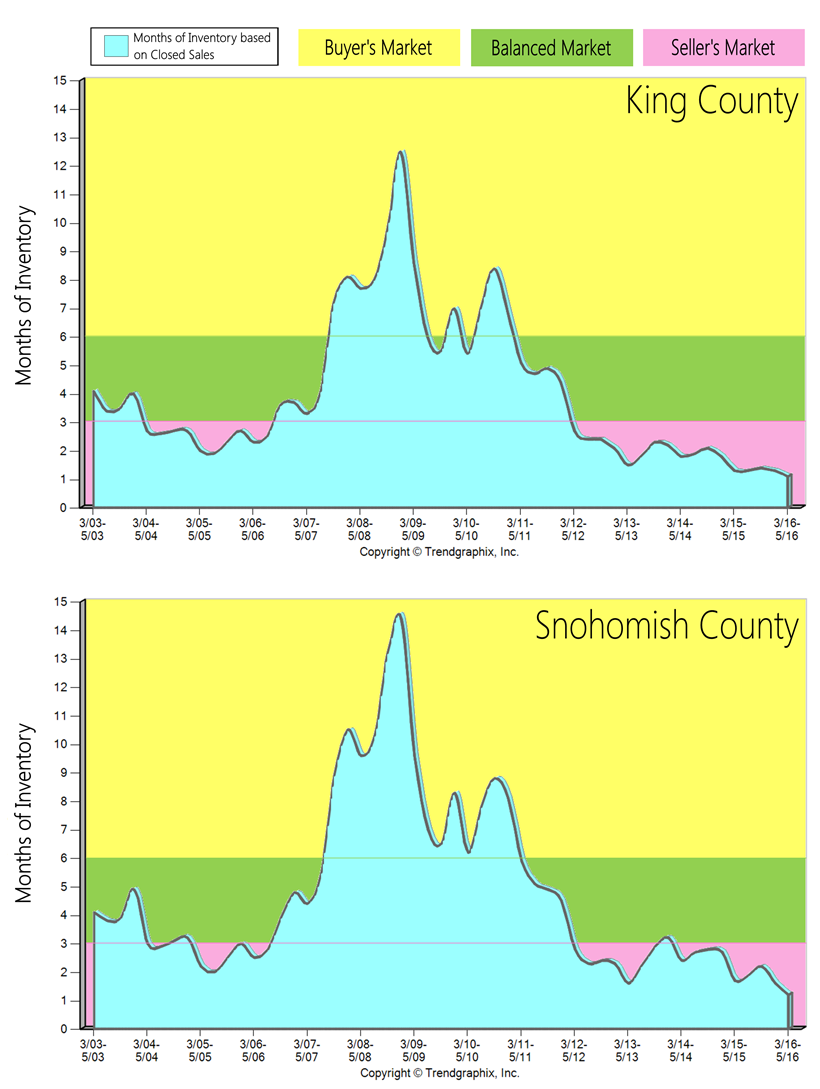 In King County over the last 13 years we saw three years of a buyer's market, which happened during the biggest economic downturn since the Great Depression, after the crash of the housing market in 2007. This economic fallout was a result of predatory lending practices, which created a large population of buyers who were not truly qualified to purchase a home. This oversaturated the market and then led it to its crash when those lending practices were shut down. These severe influences on the market led to quick jumps from a seller's to a buyer's market and then a buyer's to a seller's market. It only took one short year to transition from the seller's market of 2004-2006 to the three-year long buyer's market after the housing crash. Once the sub-prime lending options were shut down in July 2007, it eliminated many buyers, creating an extreme buyer's market. It also only took one short year to transition out of the downturn and back to a seller's market as the economy started to recover. It has been a seller's market in King County since May of 2012 – four years!
In Snohomish County over the last 13 years we saw four years of a buyer's market. Snohomish County was hit a bit harder by the Great Recession than our neighbor to the south, as it took longer to recover. It has been a seller's market in Snohomish County since May of 2012, except for one quarter of a balanced market in the beginning of 2014, when we saw a surge of new construction come to market due to the national builders releasing some neighborhoods they had acquired in the downturn.
Interestingly, the market shifts were brief because the downturn was so severe, which changed the market environment quickly. In order to clean up the predatory lending mistakes of 2004-2007, the market essentially had to come to a standstill and flush out all of the bad loans via foreclosure and short sales, which took five years. The only time we found ourselves in such an extreme buyer's market, was after one of the biggest economic fallouts of the last century. Once that corrected itself we quickly returned to a seller's market due to many positive factors.
Our available housing stock is affected by the limited land left to build on, a thriving job sector (especially in tech), historically low interest rates and the Greater Seattle area being a nice place to live. All four of these indicators have shrunk inventory and put upward pressure on prices. Sellers continue to enjoy great market returns, and buyers continue to fight to secure a home with a 4% interest rate, and not too far from their workplace. Additional inventory would be more than welcomed, it is very clear that we have the demand to absorb it. If you are curious about the value of your home in today's market or securing a purchase please contact one of our agents. We are always happy to help educate you on how this market can benefit your bottom line.
It’s an Amazing Time to be a Seller!
The two graphs here illustrate the amount of homes for sale and the amount of homes sold over the past two years in King and Snohomish Counties. This gives us a good look at the simple principle of supply and demand. 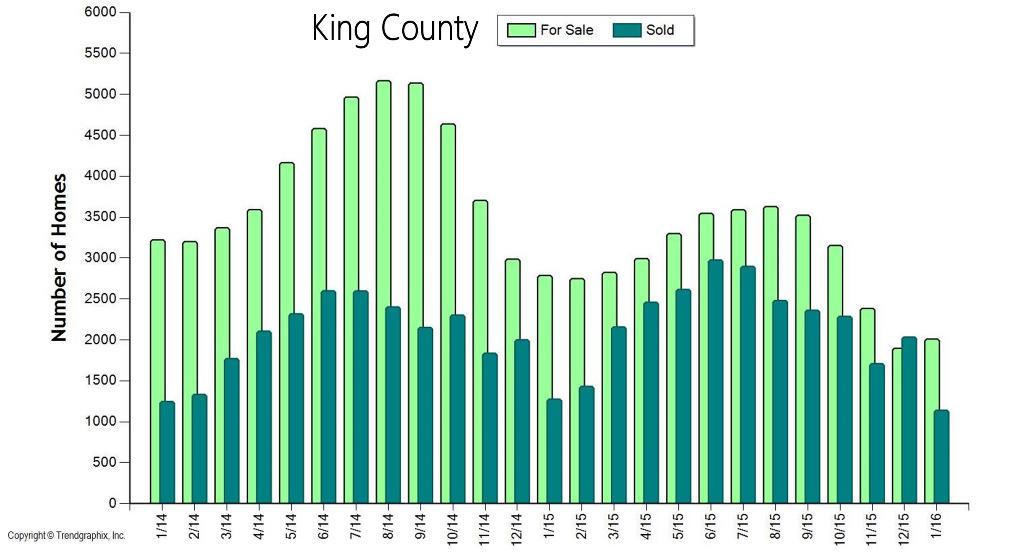 We are currently experiencing one of the strongest Seller's markets in recent history. A Seller's market is defined by having three or less months of available inventory. Currently, King County has 1.2 months of inventory based on pending sales and Snohomish County 1.3. Where this particular Seller's market is unique is that it is not only a shortage of inventory creating this environment, but very high buyer demand as well. Our local job market is thriving, so much so that many people from out-of-state are relocating here to be a part of our economy and the quality of life the Greater Seattle area has to offer. Couple the healthy local economy with still historically low interest rates and the audience for homes that come to the market is huge! Multiple offers are very common and prices are increasing.
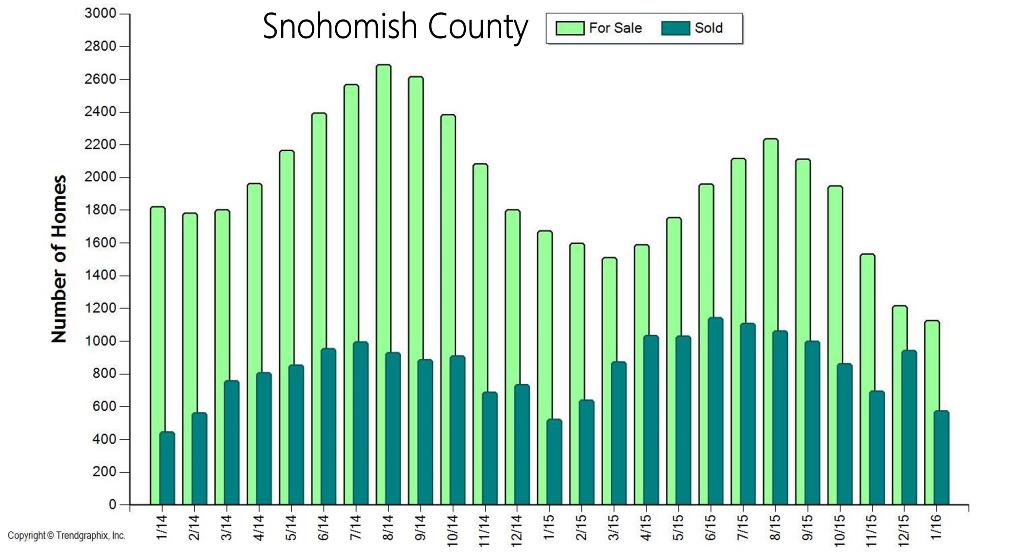 In order to get a better understanding of the market conditions we dug a little deeper and were quite surprised. We looked into the amount of new listings that came to market this January, assuming that there would be a huge deficit of new listings – we were wrong! In King County there were only 111 less listings (-4%) that came to market this January compared to last January, and only 16 less listings (-1%) in Snohomish County. Yes, fewer homes are coming to market, but the high buyer demand has eaten up any inventory carryover month-to-month, leaving us with 30% less homes to choose from compared to the year prior – hence the very low months of inventory. We are coming close to selling out of homes each month and new inventory is required to create more market. It is sort of mind blowing! The good news is, if you look at the graphs above you will see a seasonal uptick in inventory in the Spring and Summer months, and that is needed to meet demand. If you are considering putting your home on the market this year I would advise the sooner the better, as buyers did not hibernate for the winter and will not be worried about flowers blooming in your front yard. Sellers that beat the Spring increase in listings will enjoy a larger audience due to less competition. If you’re a buyer, it is overwhelmingly important that you are aligned with an agent that knows how to win in this market. Terms, negotiations, communication and market knowledge is what sets a highly capable selling agent apart and is required to prevail.
If you have any curiosities or questions regarding the value of your current home or purchase opportunities, please contact any of our agents. It is always our goal to help keep you informed on all things real estate, and help you manage these investments.
Housing Demand Defined
 What defines a housing market? We have had many different markets over the years that have been defined by certain identifiable factors. Will the last person leaving Seattle- turn out the lights, do you remember that billboard from 1971? Or the global housing boom of 2005-2007 that was driven by sub-prime credit lending options (which no longer exist, thank goodness!). Our current market is defined by strong demand and low inventory – the basic economic principle of supply and demand – Economics 101! A market with 0-3 months of inventory is a seller's market, 4-6 a balanced market and 6+ months a buyer's market. The route of the 2007-2011 economic down-turn, where months of available inventory favored buyers and was as high as 13 months, seems like ancient history. Since the Summer of 2012, months of inventory has favored sellers in both King and Snohomish counties, with an average of two months of available inventory between the two counties over the last three years. There is a market divergence going on between King and Snohomish County due to some unique factors each county possesses.
First, King County's lack of inventory has been drastic. Year-to-date, it has hovered at one month of available inventory, which means that each month we are nearly selling out of homes! This is due to the fact that demand is high and inventory is down. In the last 12 months, Seattle has had 27% less homes for sale than the previous 12 months, and closed sales are up 6%. In fact, Auction.com just named Seattle the number one housing market in the nation. This is due to the city's large technology sector driving employment, low interest rates and an increase in household formation. The housing premium in Seattle is rooted in shorter commute times to job centers, high walk scores and hip urban centers. The premium is real though, with the median home price over the last 12 months in Seattle reaching $528,000 – up 13% from the previous 12 months.
In Snohomish County inventory is still tight, with an average of two months of available inventory this year. Inventory has been somewhat supported by new construction and improved equity levels for re-sale properties. The median home price over the last 12 months was $347,000 – 34% less than Seattle. Median price growth is up 9% complete year-over-year.
What should we expect going forward into 2016? In both counties there was an increase in inventory in the third quarter. This is a promising indicator that folks are feeling more comfortable coming to market due to price increases after a booming spring market and healthier overall economic environment. Where this market is different from the bubbly market of 2007 are the drivers of the strong local economy, low interest rates and job growth, versus the unsustainable lending standards of the sub-prime loan movement. I believe we will see more homes come to market, especially as we head into the spring 2016 market. Folks are ready to move on to what is next for them, and recouped prices are enabling those choices. This increase will be welcomed as it will provide more options for buyers and will start to temper price growth, which is a good thing.
Where this market has gotten a bit tricky, is where one goes once their home sells. The low inventory has made this challenging, but with any market challenge you find creative and strategic ways to maneuver through and find success for your clients. Windermere has a great Bridge Loan product to utilize, temporary moves have solved these transitions, and longer closings with seller rent-backs have also been widely used to help make seamless transitions. This an exciting market to participate in, and creative strategy is the name of the game. Please contact one of our agents if you would like to know more about the current market conditions and how they relate to your bottom line and lifestyle decisions.
