
 Facebook
 X
X
 Pinterest
 Copy Link
Buyers: Keep Your Head Down, This May be Your Time


The first five months of 2017 have been a grind for buyers in our area. Inventory has been quite limited and demand has been off the charts. However, in the month of May we started to see things loosen up, with the highest rate of new listings coming to market in some time. Below are two market samplings from the Greater Seattle area: north King County and south Snohomish County which are reflective of our entire market.
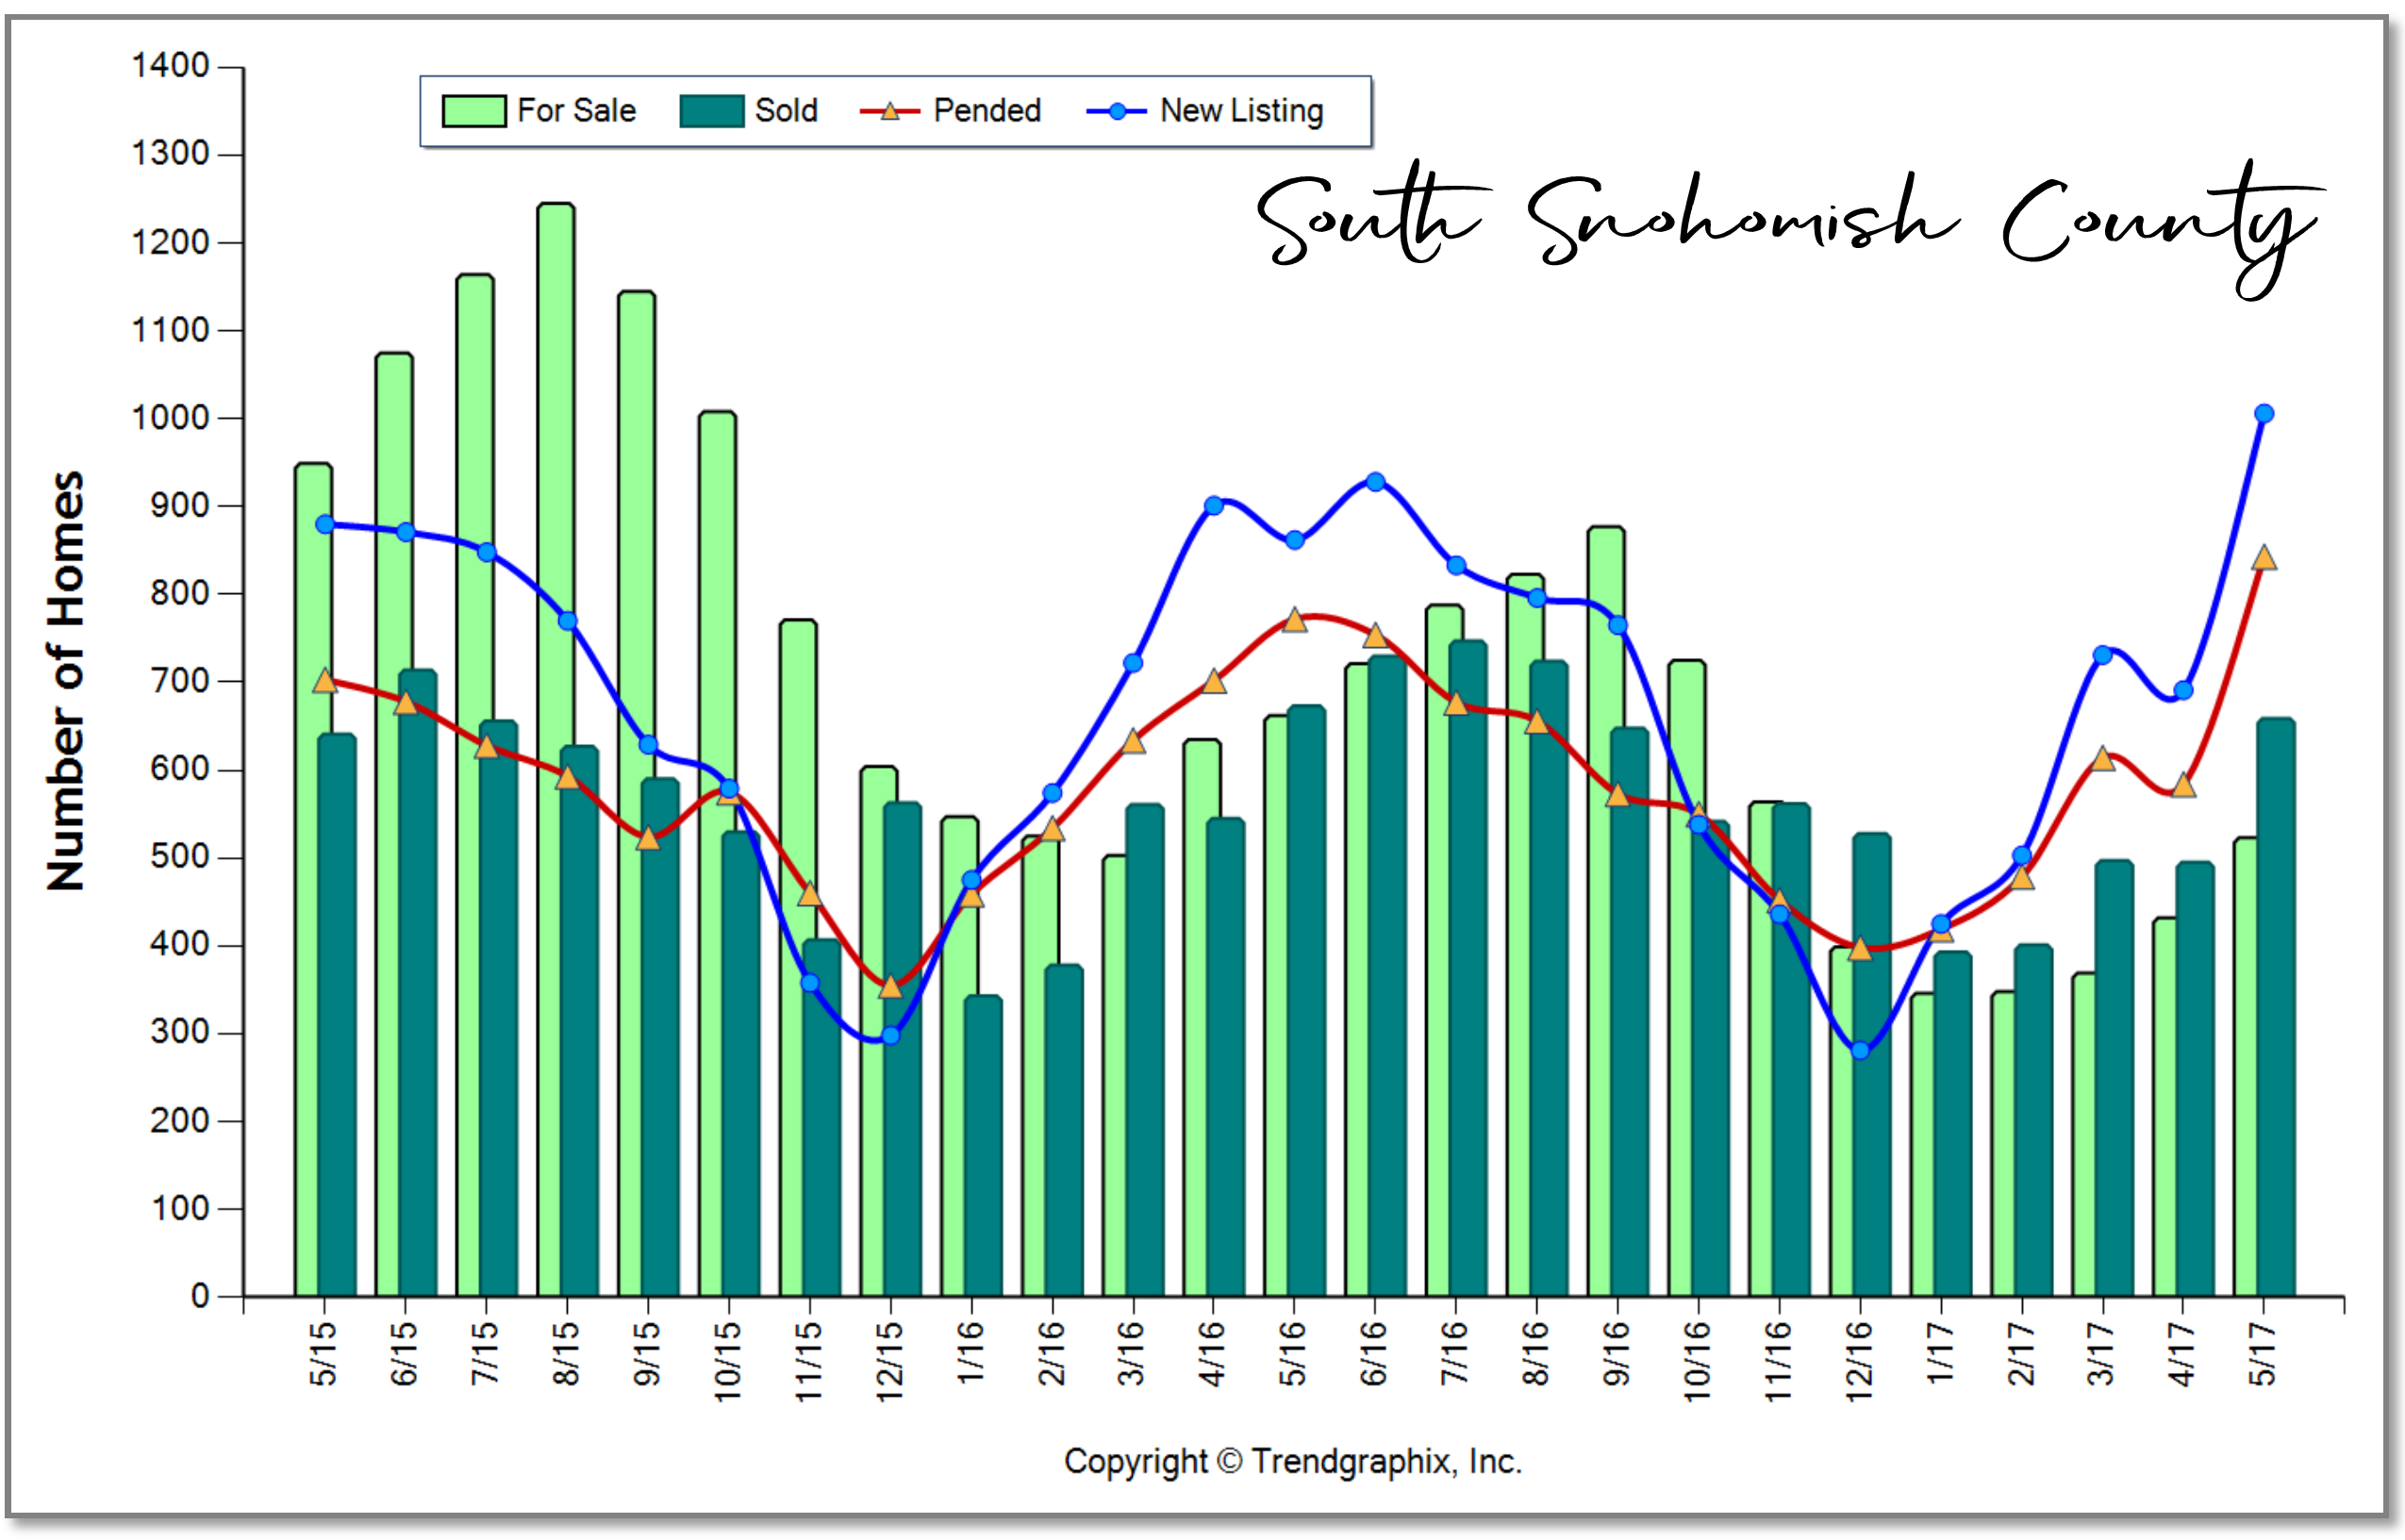 South Snohomish County:
In May we saw just over 1,000 new listings come to market in south Snohomish County; the highest inventory push in one given month in over five years! In fact, it was a 46% increase over the previous month, and a 17% increase from the same month a year ago. This is good news for buyers, finally! One should note, however, that pending sales nearly mirrored the number of new listings, illustrating that demand is still very strong.
I think we will see that opportunities have loosened up for buyers in the list-to-sale price ratios that will post in June closings (May pendings). My prediction is that they will have tempered a bit from the 103% posting in May, purely based on buyers having more selection.
Demand surely met the new surge of inventory, but from what I am observing in the market, not all homes are getting multiple offers. When there are multiple offers, smaller groups of buyers may be vying for one house. We have even seen more price reductions in May with overzealous sellers not paying close attention these slight shifts in the market.
Don’t get me wrong, the good houses that are well-priced and looking good are seeing great price escalation and competition, but some are simply selling with a one-buyer audience. There are just more opportunities when there is more inventory, and this is good news for all of us as tempered price growth is needed after a 51% increase in median price over the last four years.
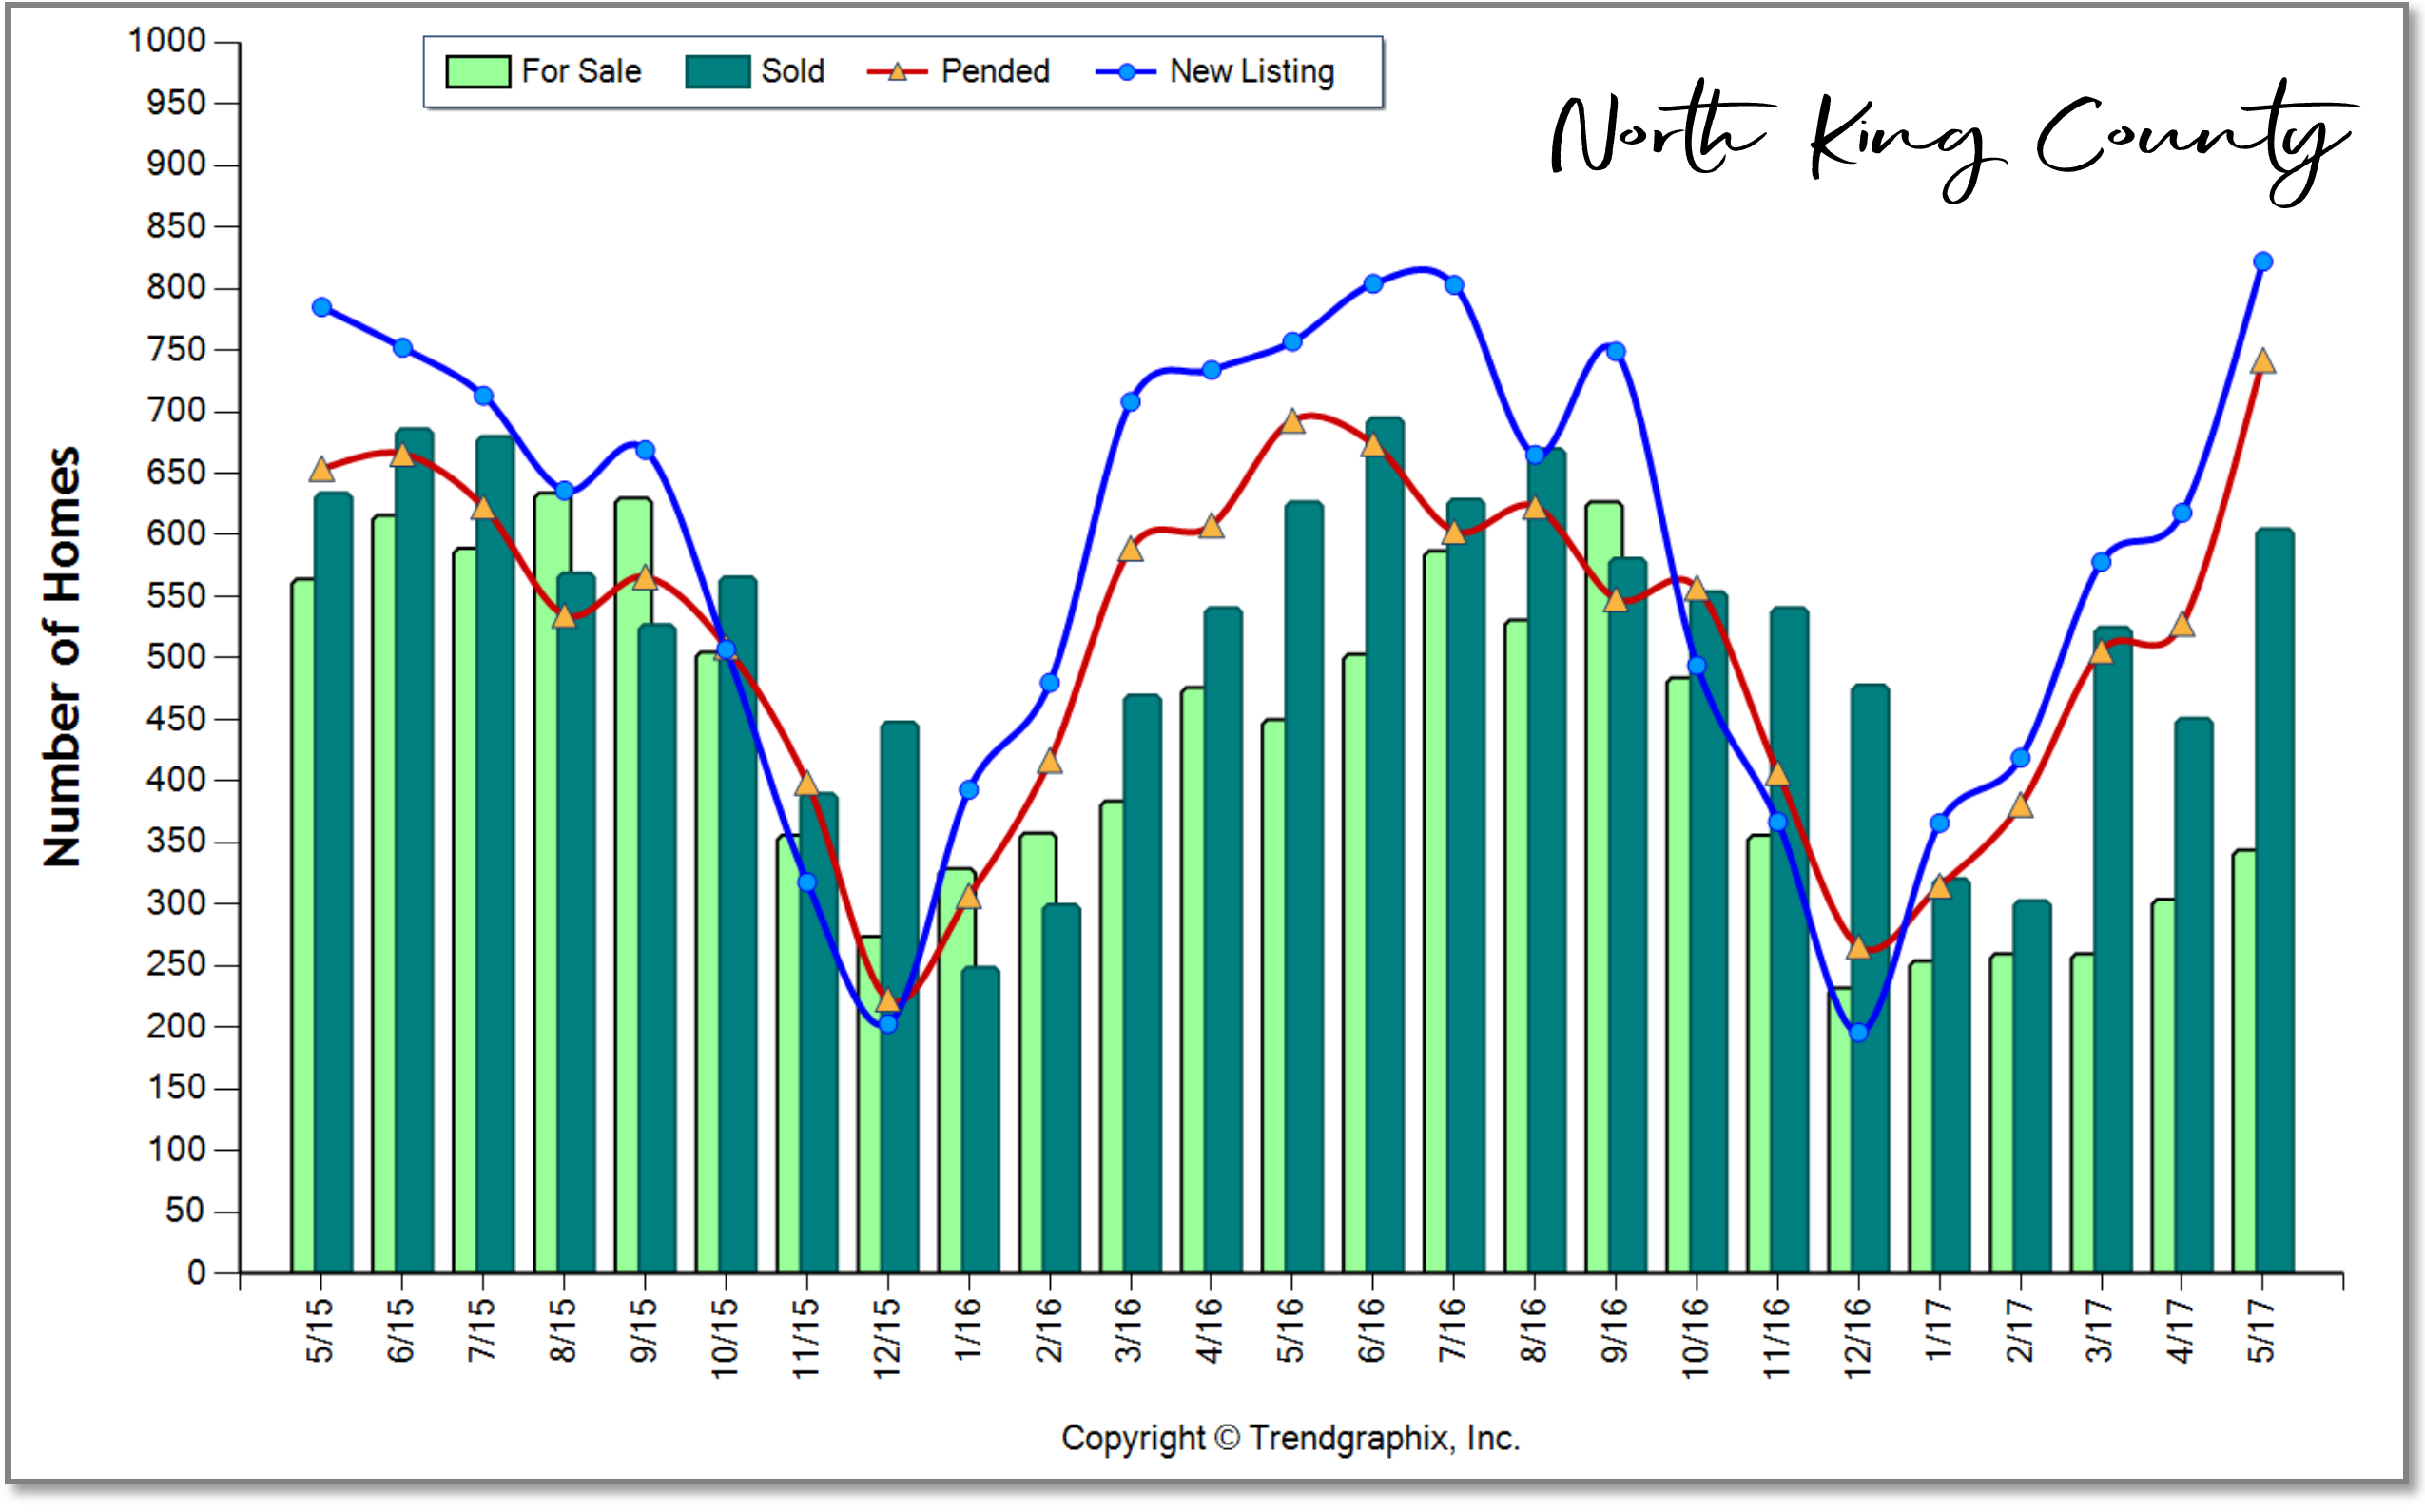 North King County:
In May, we saw just over 800 new listings come to market in north King County; the highest inventory push in one given month in over three years! In fact, it was a 33% increase over the previous month and a 9% increase from the same month a year ago. Pending sales also met demand here, but more buyers were able to land a home, which is good news. List-to-sale price ratios recorded at an average of 107% in this area, so definitely a needed tempering as we head into June.
When you are closer to jobs centers demand is higher, so the in-city market will continue to present a hustle for buyers, but more listings will equal a better chance of landing a house close to work. Prices in this area have increased 60% over the last four years.
Interest Rates:
Currently, interest rates are a buyer’s dream come true! We started the year at 4.25%, bumped up to 4.375% in early spring, and we have inched down to 4% most recently. This reduction in rate is saving buyers thousands of dollars over the course of their mortgage on their monthly payments, somewhat offsetting the increase in prices since the first of the year. This is something to pay attention to, and could not come at a better time as it is coupled with more inventory. Inventory in June and July should continue to be strong as the long winter delayed folks getting to market, and many sellers are taking advantage of the prices.
If you have thought about making a move or even your first purchase, now may be the time to not just dip your toe in the pool, but to jump in. It is summer and who doesn’t like a nice swim? Especially if that pool has more homes than we’ve seen in some time and cheap money. If you or anyone you know is interested in learning more about our market please contact one of our agents, as it is our goal to keep our clients informed and empower strong decisions.
You’d Like to Sell Your Home, but Where to Next… and How?


Homeowners across our region are enjoying very healthy equity levels due to an upswing in the real estate market over the last five years. In fact, the median price in King County is up 50% over the last five years and up 47% in Snohomish County. This growth in equity has given homeowners the exciting option to sell their home for a high price and move on to their next chapter, such as a move-up, down-size or second home. This price growth is great news and provides many opportunities, however we have also faced some challenges in how to make these transitions.
Our biggest challenge in the marketplace right now is inventory levels; sometimes requiring a buyer to compete in multiple offers for their next home. Currently King County sits at 0.7 months of inventory and 0.8 in Snohomish. Historically, buyers that are also sellers would commonly secure a new home contingent on the sale of their current home. Meaning the seller of the new home they are buying would give them a month or so to get their current house sold in order to buy theirs. Well in this market, that is only rarely an option. So, the million-dollar question is this: how does one who has gained so much equity, now itching to get that bigger house, different location, or perfect rambler for settling into retirement, make this transition without having to move twice? We need to get creative and have a strategy. Two options that have recently proved to be successful, are negotiating a rent-back for sellers or using the Windermere Bridge Loan program.
First, negotiating a rent-back has become a great option for someone who needs to first sell their current home in order to buy. The way it works is we put their home on the market, price it competitively to create demand, and ask for a rent-back as one of the preferred terms. If this rent-back is successfully negotiated, then the seller closes on their home and collects their funds, but gets to stay in the house anywhere from 30-60 days. This enables the seller, who is now a buyer, to have their cash in-hand, time to find a new house, get it under contract and close the sale when their rent-back is ending. This eliminates the need to move twice. There is a bit of calculated risk in this plan, but we’ve seen it work several times, always with a plan B ready just in case. Rarely has plan B needed to be executed, and often times we’ve even been able to pay little to no rent during this time.
The second option is the Windermere Bridge Loan program. This is an amazing tool for homeowners that own their homes free and clear, or have paid down their debt quite a bit. This is a low-cost alternative to pull the equity out of one’s house prior to selling it in order to make a non-contingent offer. The way it works is we take the market value of the house the homeowner current lives in, established by a comparative market analysis completed by your Windermere agent and signed off by the Broker. We then take 65% of that value and subtract any debt owed, and that is the maximum amount the homeowner can borrow for their next down payment. They can then make a non-contingent offer on a new home. What is really great about this, is that it doesn’t require an appraisal (like a HELOC does), and these can easily be turned around in 3-5 business days. This tool provides the opportunity to quickly and inexpensively pull your equity out, be competitive, and eliminates the double move.
The fees associated with this program are a 1% loan fee on the equity that is pulled, a title report, and interest that is incurred between the loan funding and being paid off once the subject home is sold. That interest is conveniently wrapped up in the closing costs when they close the sale of their home, eliminating the need to make monthly interest payments. In a strategy that is somewhat mind blowing- we can sometimes use these bridge loans and never have to actually fund them. For example, if we secure a property non-contingent with the bridge loan and immediately get the subject home on the market, we can often secure a sale with a simultaneous closing, and never have to fund the loan. This eliminates the loan fee, interest, and the need to carry two mortgages.
If you are excited about equity levels and today’s low interest rates and have thought about making that move you’ve been waiting for, but have been fearful of how to do it all – we can help. These two options, along with great attention to detail, hand-holding, and careful planning have helped many people make these exciting transitions. It is our goal to help keep our clients informed and empower strong decisions. Please contact any one of our agents if you would like further information on how this might work for you or someone you know.
You Don’t Need Tulips for a Strong Home Sale
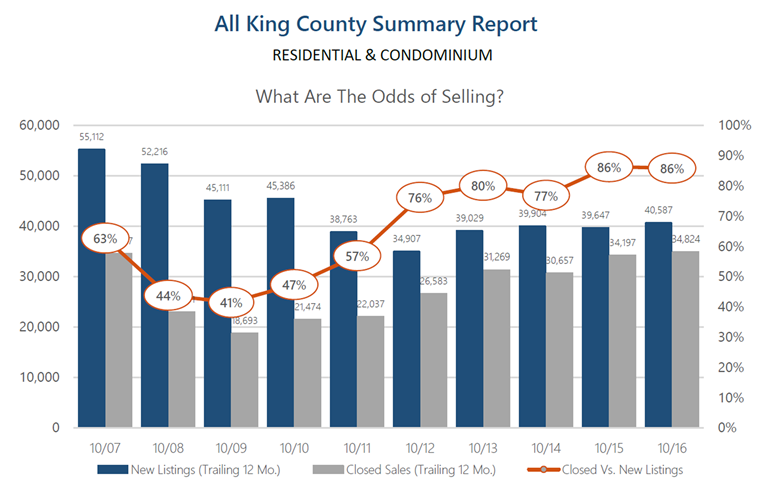
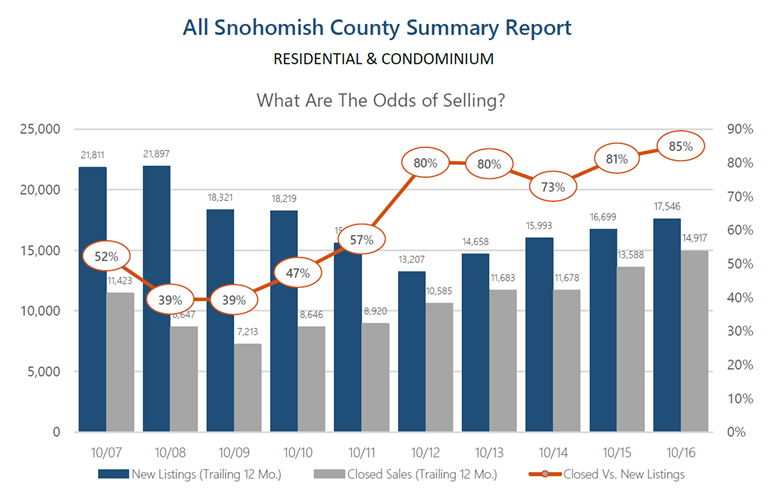 These graphs (click to view larger) above provide a 10-year history of the odds of selling in the month of October for both King and Snohomish Counties. As you can see, the odds of selling are at a 10-year high, hitting 86% in King and 85% in Snohomish. These are quite favorable odds for sellers and indicate what one might expect moving toward 2017.
Buyer demand remains very strong! In fact, pending sales reached peak levels in May of this year and continued with steady momentum throughout the summer and fall. Every month this year recorded a higher pending level than the same month the previous year. This illustrates strong buyer demand and is coupled with lower inventory levels than the year before. This combination has created very low months of available inventory, and we anticipate this continuing as we complete 2016 and head into 2017. For a potential seller, this means the market is in your favor, and waiting until the tulips bloom in April might have you lined up against more competition. Historically, we see inventory peak April through June, however pending sales have closely matched supply all throughout the year. With that said, one might consider bringing their home to market in the first quarter of the year versus the second, because they will have less competition, but still enjoy an engaged buyer audience.
Most recently we have seen interest rates bump up a bit, and this has created more urgency in the market. While still historically low, buyers are smart enough to know that cheap money is a huge long-term savings. Paying attention to all of these market factors will empower one to make the best real estate decisions. Please reach out if you are considering a move over the next year, and I’d be happy to apply this research and weigh in on your options.
Affordability: Commute Times & Interest Rates
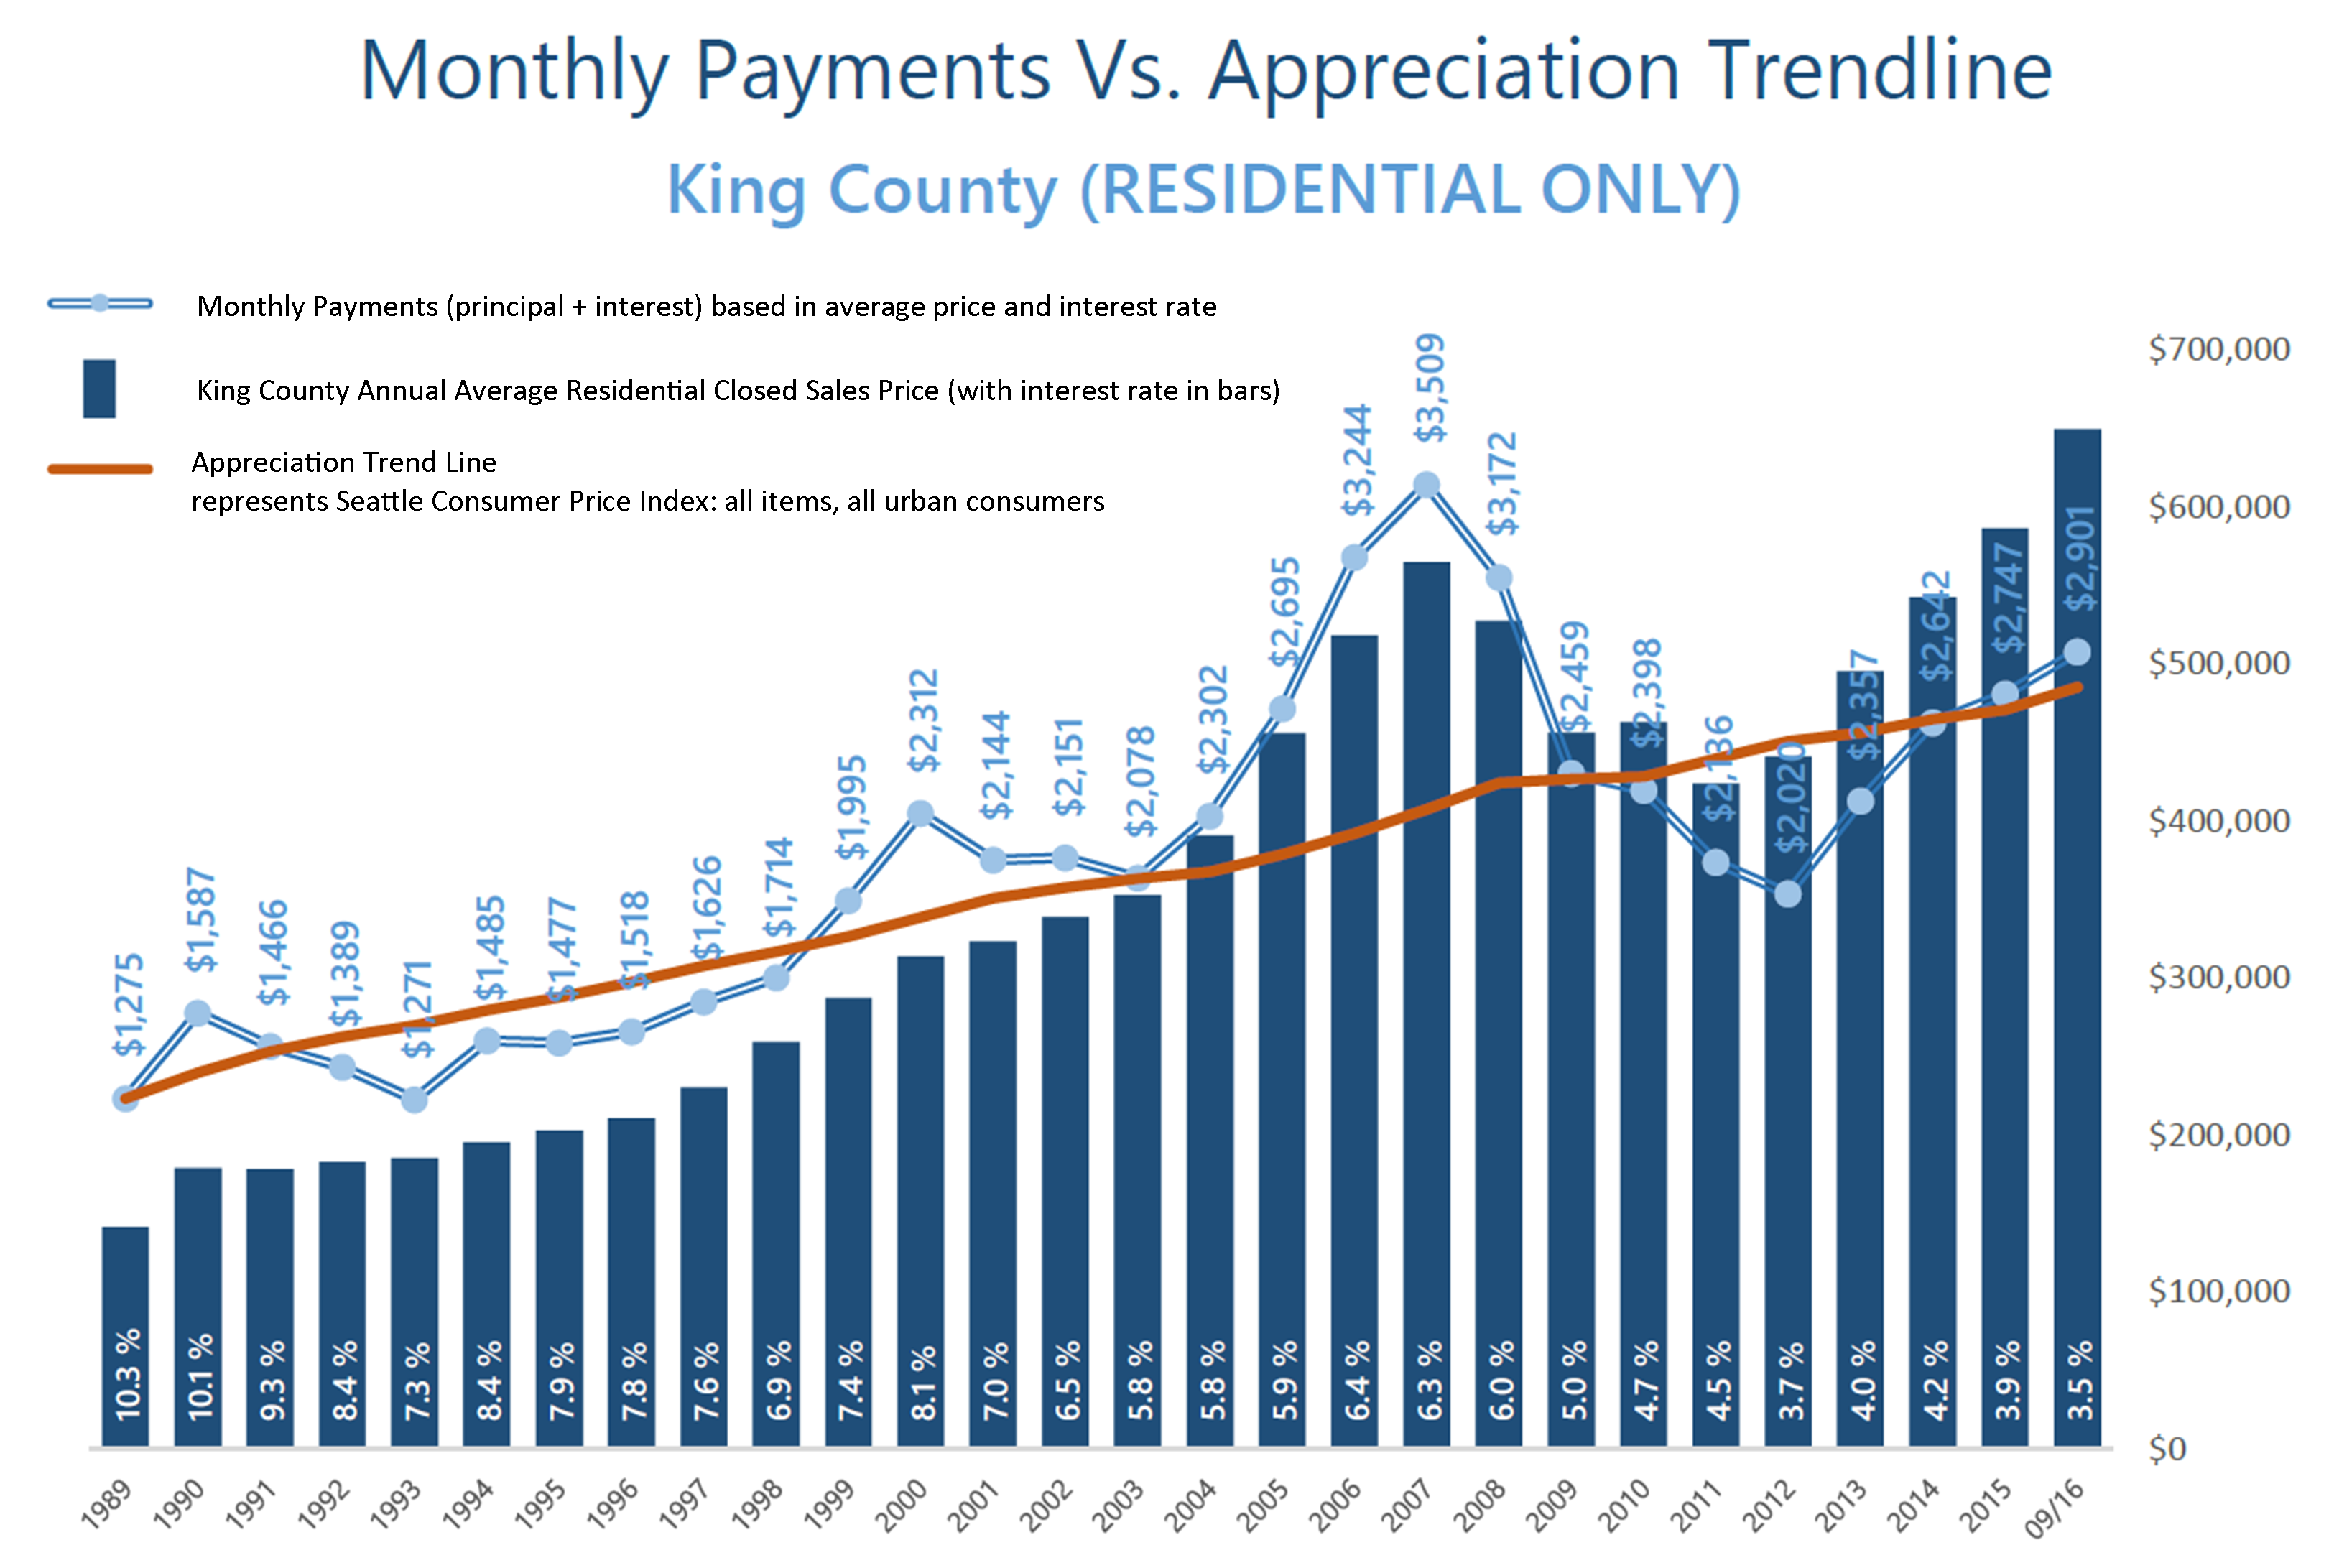
 These graphs illustrate the brass tacks of affordability between King and Snohomish Counties, measured by the average monthly payment. Most recently in September, the average monthly payment was 35% higher in King County compared to Snohomish County. What is fascinating, though, is comparing today’s average monthly payment to peak monthly payments back in 2007! In King County, monthly payments are currently 21% less than during the peak, and in Snohomish County, 36% less. That is a lot of saved monthly overhead. Note that this has everything to do with today’s historical interest rates, as average prices are higher now than in 2007. When one buys or refinances a house, they are not only securing the property, but securing the rate for the life of the loan.
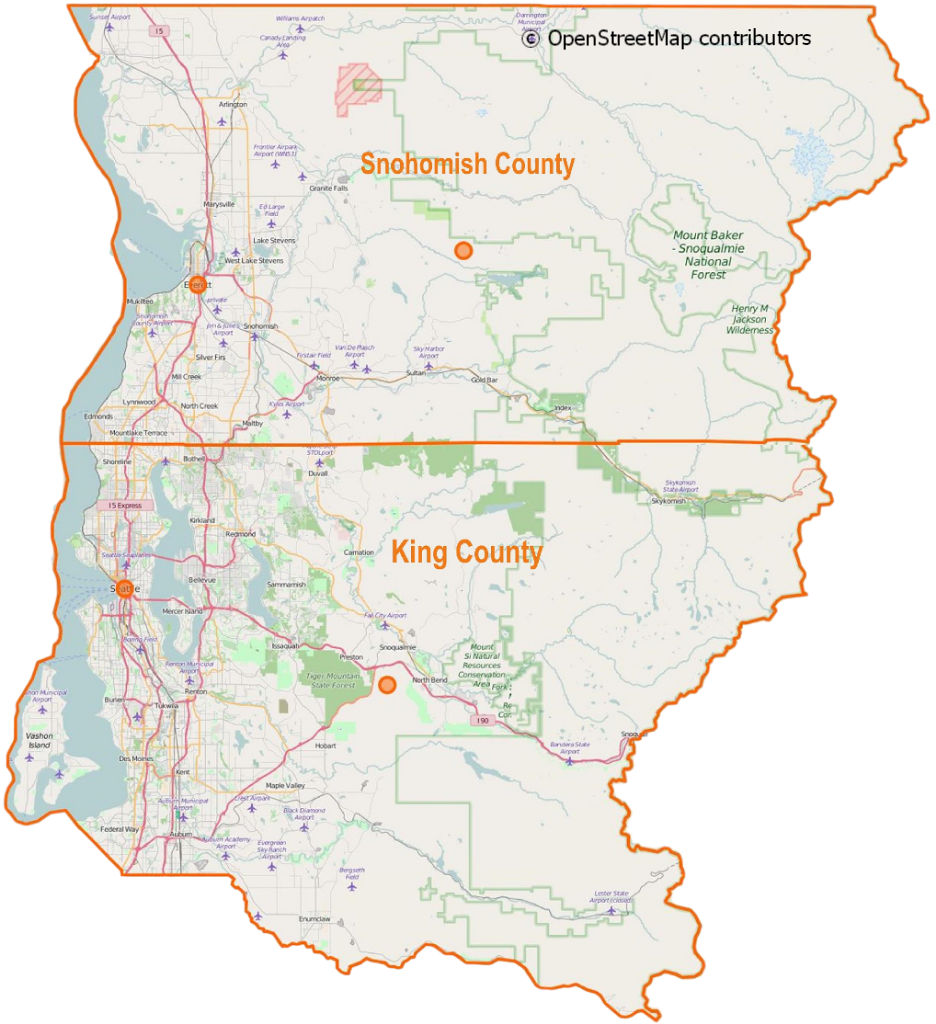
Close proximity to the work place and affordability is often near the top of a buyer’s list of preferred features. 2016 has continued to be a year when commute times to major job centers widened the price divide between key market areas in the greater Seattle area. Over the last 12 months, the average sales price for a single-family residential home in the Seattle Metro area was $696,000! In south Snohomish County (Everett to the King County line), the average sales price for a single-family residential home was $471,000 – 48% less than Seattle Metro. Further, if you jump across Lake Washington to the Eastside, the average sales price for a single-family residential home was $881,000 – 27% more than Seattle Metro!
The “drive to qualify” mentality has been proven by the pending sales rate in south Snohomish County over the last 12 months. Pending sales are up 7% complete year-over-year, whereas in Seattle Metro pending sales are down 1%, and down 2% on the Eastside. We believe this is a result of affordability, more inventory choices in south Snohomish County, new construction options, lower taxes, strong school district choices, and manageable commute times. Newer transit centers and telecommuting have also opened up doors to King County’s little brother to the north as well. If you are curious about possible commute times, you can search for properties on our website based on commutes times, which is a feature provided by INRIX Drive Time. Also, we track the market in several ways, so if the graphs here are interesting to you, any of our agents would be happy to provide additional information relative to your specific neighborhood. Please contact us anytime, as it is our goal to help keep you informed and empower you to make strong real estate decisions.
Market Update – Q3
Inventory levels providing more choices for buyers; is the market starting to stabilize?
As we head into the fall and winter months after an incredibly eventful spring and summer, available inventory levels are starting to ease. It is still a seller’s market (3 months of inventory or less) in most areas, but one that is providing buyers increased options. The increase in available inventory is due to pent-up seller demand starting to come to market. The return of strong equity levels have brought sellers to market that have been waiting to jump in for some time. Continued buyer demand due to our flourishing job market and historically low interest rates have steadily absorbed new inventory, but we are finally starting to see a trend toward some more balance. This is good news! Additionally, lending requirements remain stringent and down payments are bigger, unlike the dreaded bubble market we experienced in 2007/2008. Educated pricing and sound condition is what will drive a buyer’s interest in a home. As the market stabilizes, it will be important for consumers to partner with a broker who closely follows the market to help them make informed decisions and develop winning strategies.
Read below for market details from Snohomish County down through south King County.
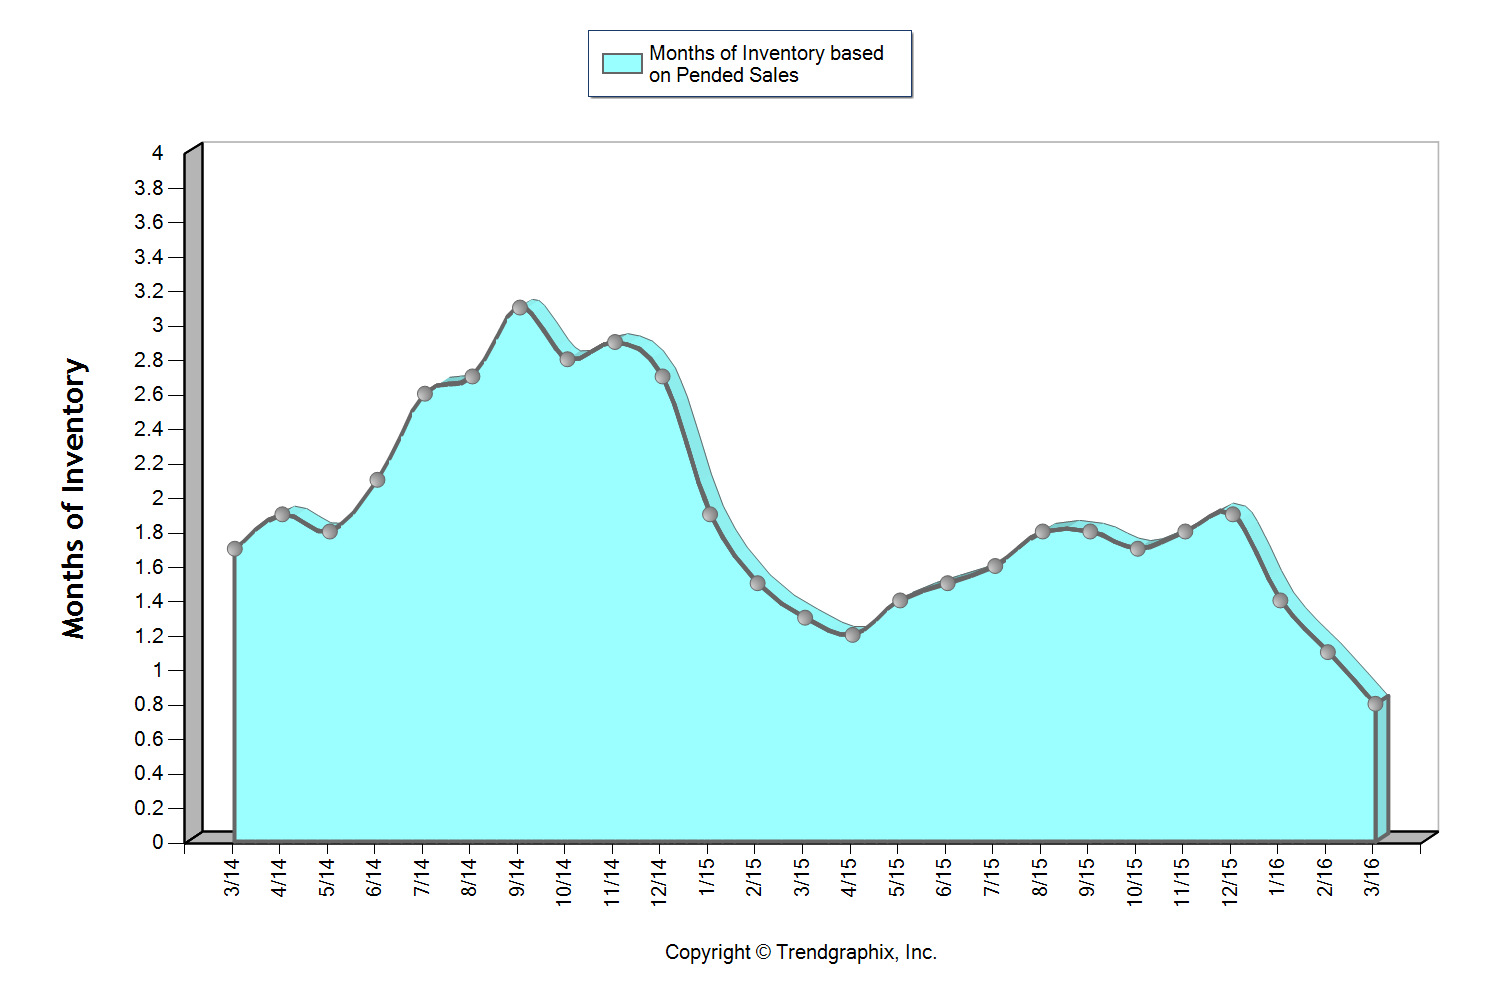
Snohomish County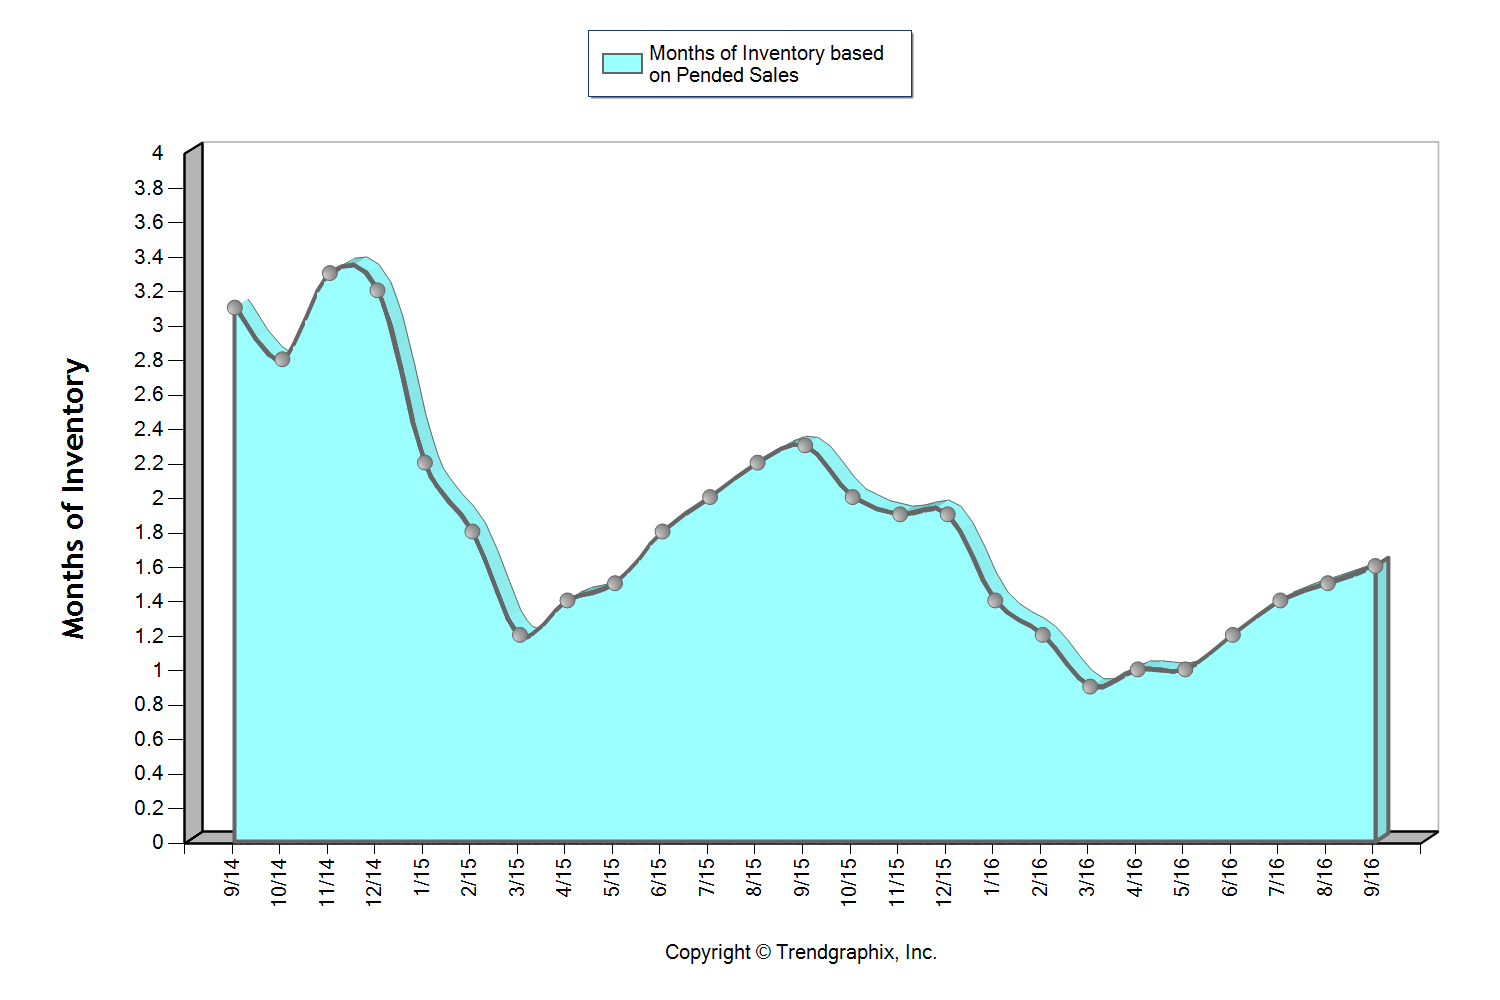
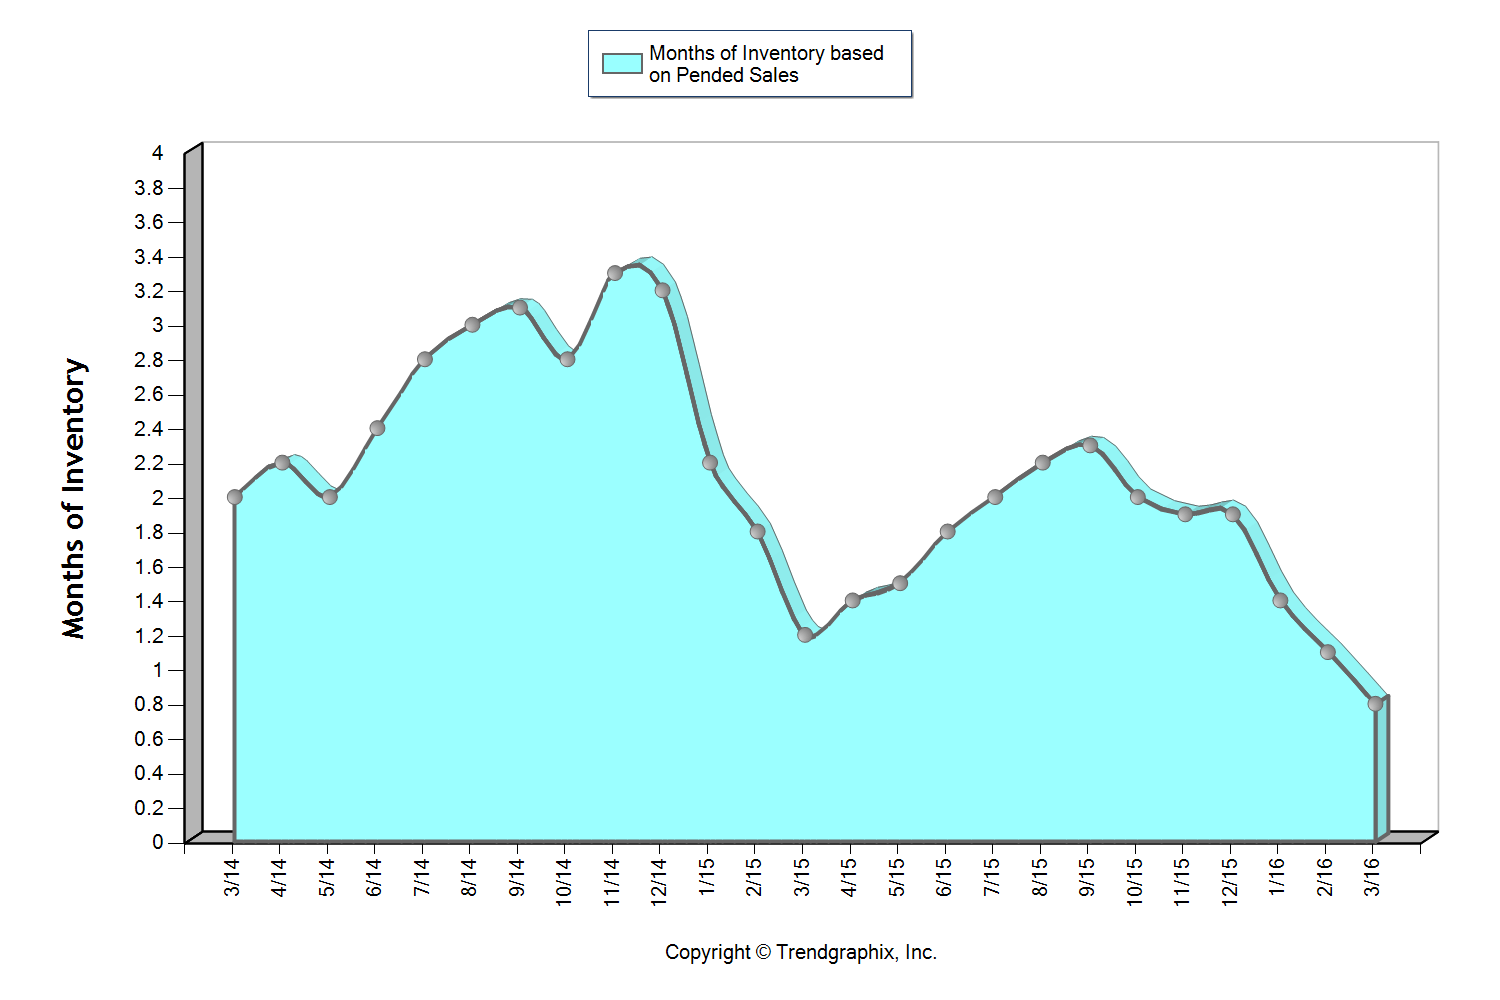
This graph shows that we currently sit at 1.6 months of inventory based on pending sales, which is the highest level we have seen in all of 2016! It is still a seller’s market (3 months or less), but one that is providing buyers increased options. The average cumulative days on market reached 28 days in September, which was up 8% over August. Median price peaked in August at $401,000 and settled at $397,000 in September after hovering between $380,000 and $400,000 since April. For the first time since February, the average list to sale price ratio was 99% after sitting at 100-101% over the last six months.
The return of strong equity levels have brought sellers to market that have been waiting to jump in for some time. In fact, average prices have grown just over 20% over the last two years, freeing up sellers to make the moves they have been waiting for. Continued buyer demand due to our flourishing job market and historically low interest rates have steadily absorbed new inventory, but we are finally starting to see a trend toward some more balance. This is good news! We are still seeing multiple offers and quick market times, but not quite the frenzy that we experienced earlier this year.
All of these factors indicate that we may finally be headed towards a more stabilized market with positive attributes for both buyers and sellers.
South Snohomish County 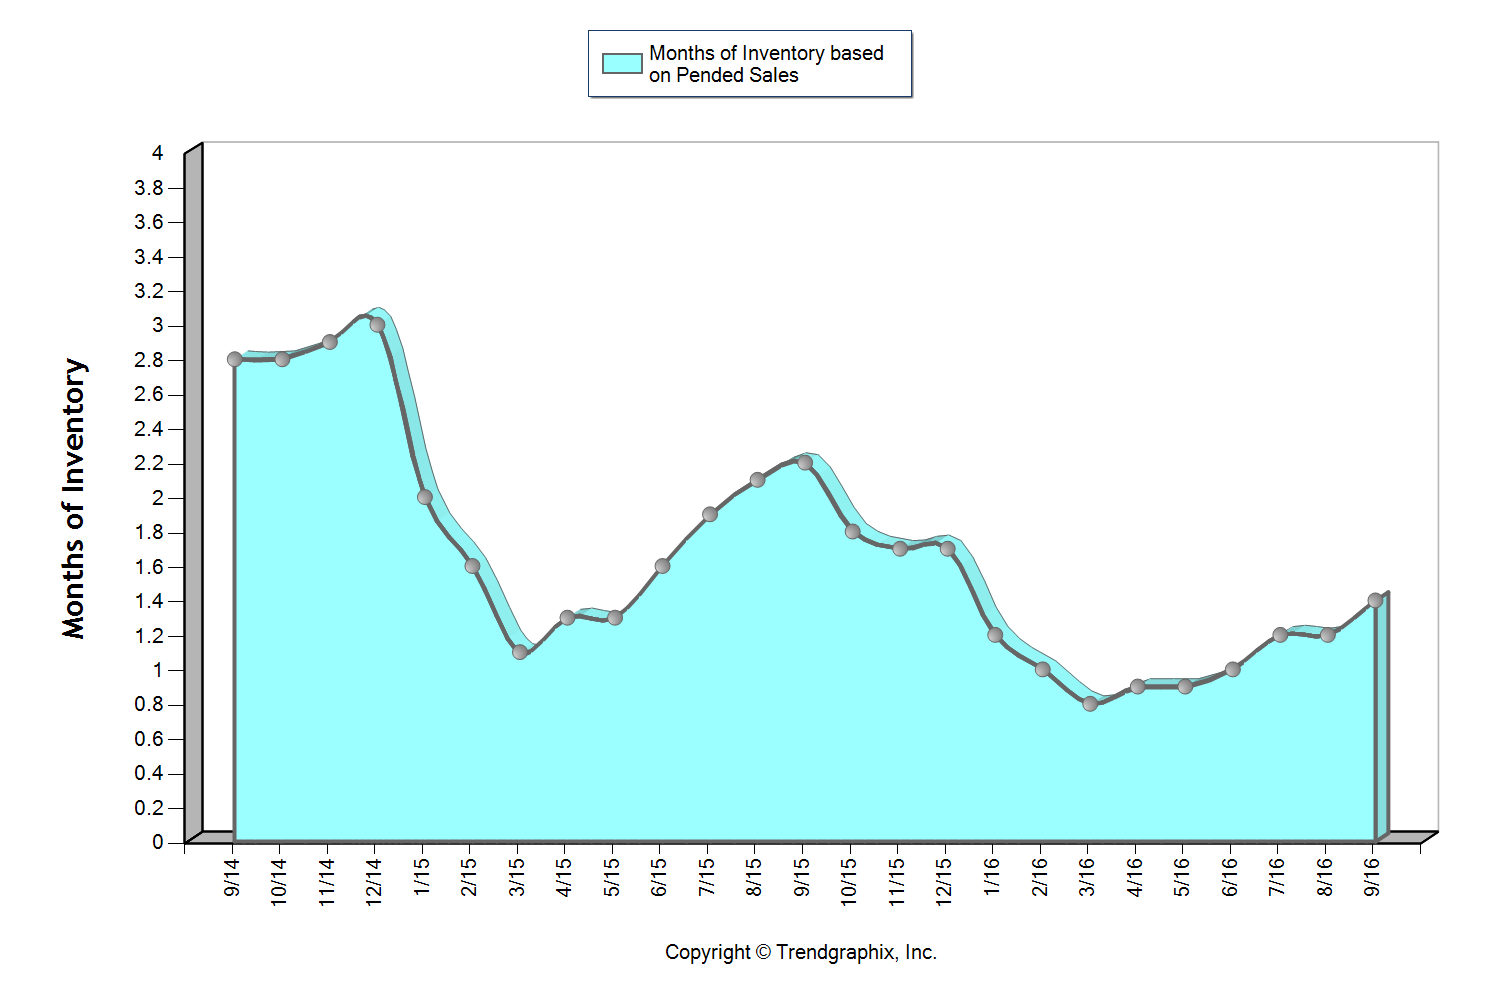
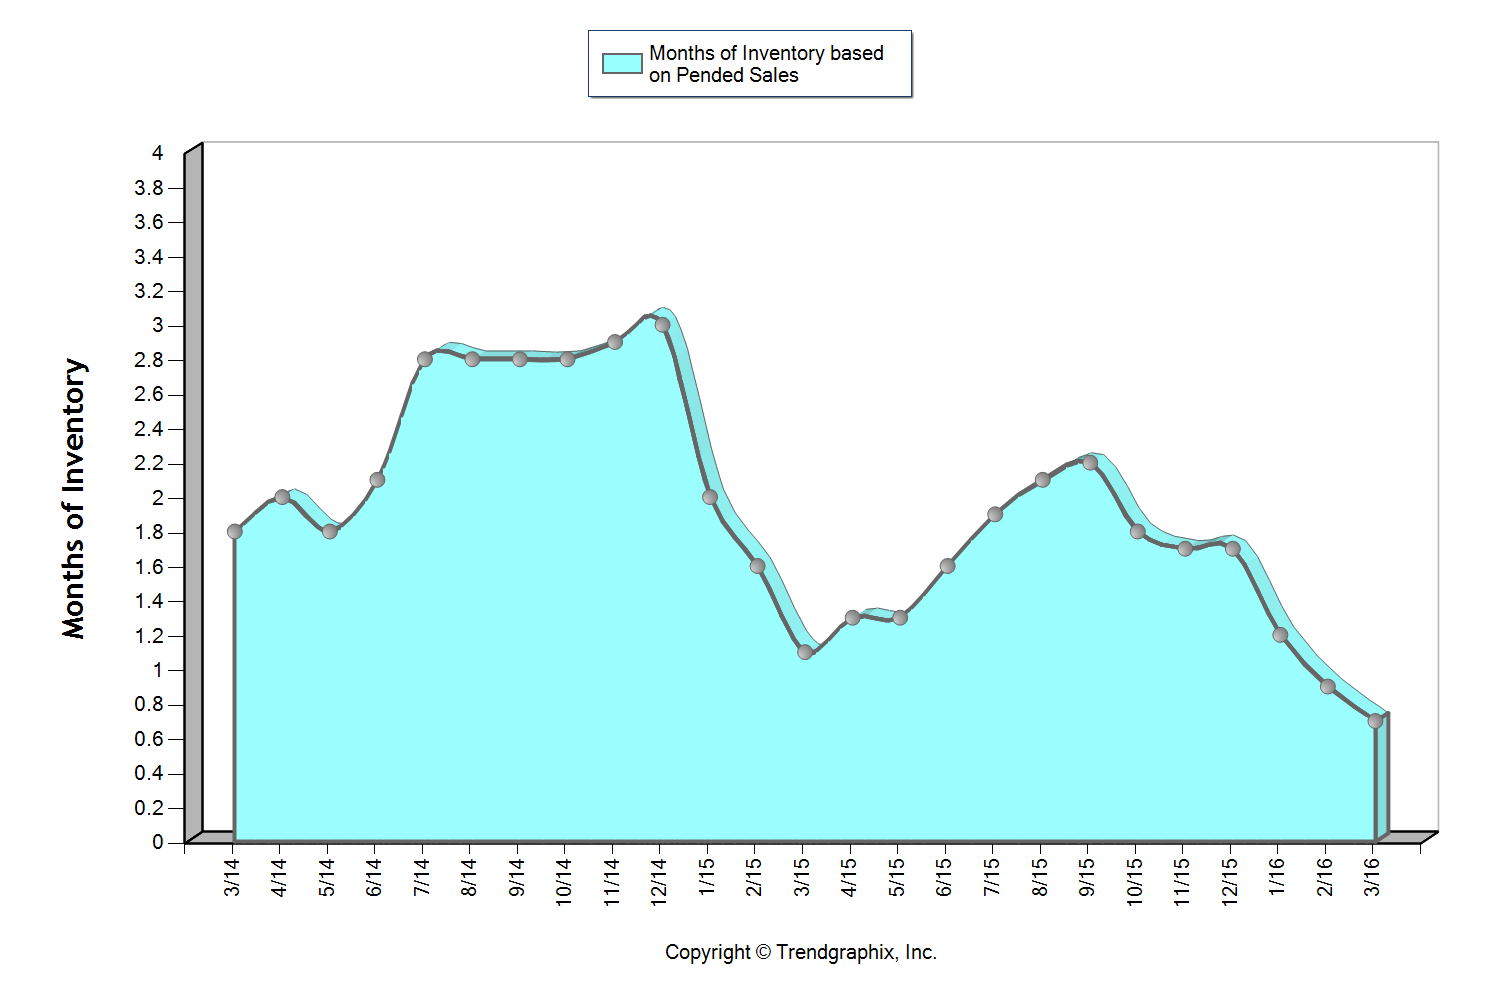
This graph shows that we currently sit at 1.4 months of inventory based on pending sales, which is the highest level we have seen in all of 2016! It is still a seller’s market (three months or less), but one that is providing buyers increased options. The average cumulative days on market reached 24 days in September, which was up 14% over August. Median price peaked in August at $453,000 and settled at $440,000 in September after hovering between $440,000 and $450,000 since March. For the first time since February, the average list to sale price ratio was 99% after sitting at 100-101% over the last six months.
The return of strong equity levels have brought sellers to market that have been waiting to jump in for some time. In fact, average prices have grown just over 20% over the last two years, freeing up sellers to make the moves they have been waiting for. Continued buyer demand due to our flourishing job market and historically low interest rates have steadily absorbed new inventory, but we are finally starting to see a trend toward some more balance. This is good news! We are still seeing multiple offers and quick market times, but not quite the frenzy that we experienced earlier this year.
All of these factors indicate that we may finally be headed towards a more stabilized market with positive attributes for both buyers and sellers.
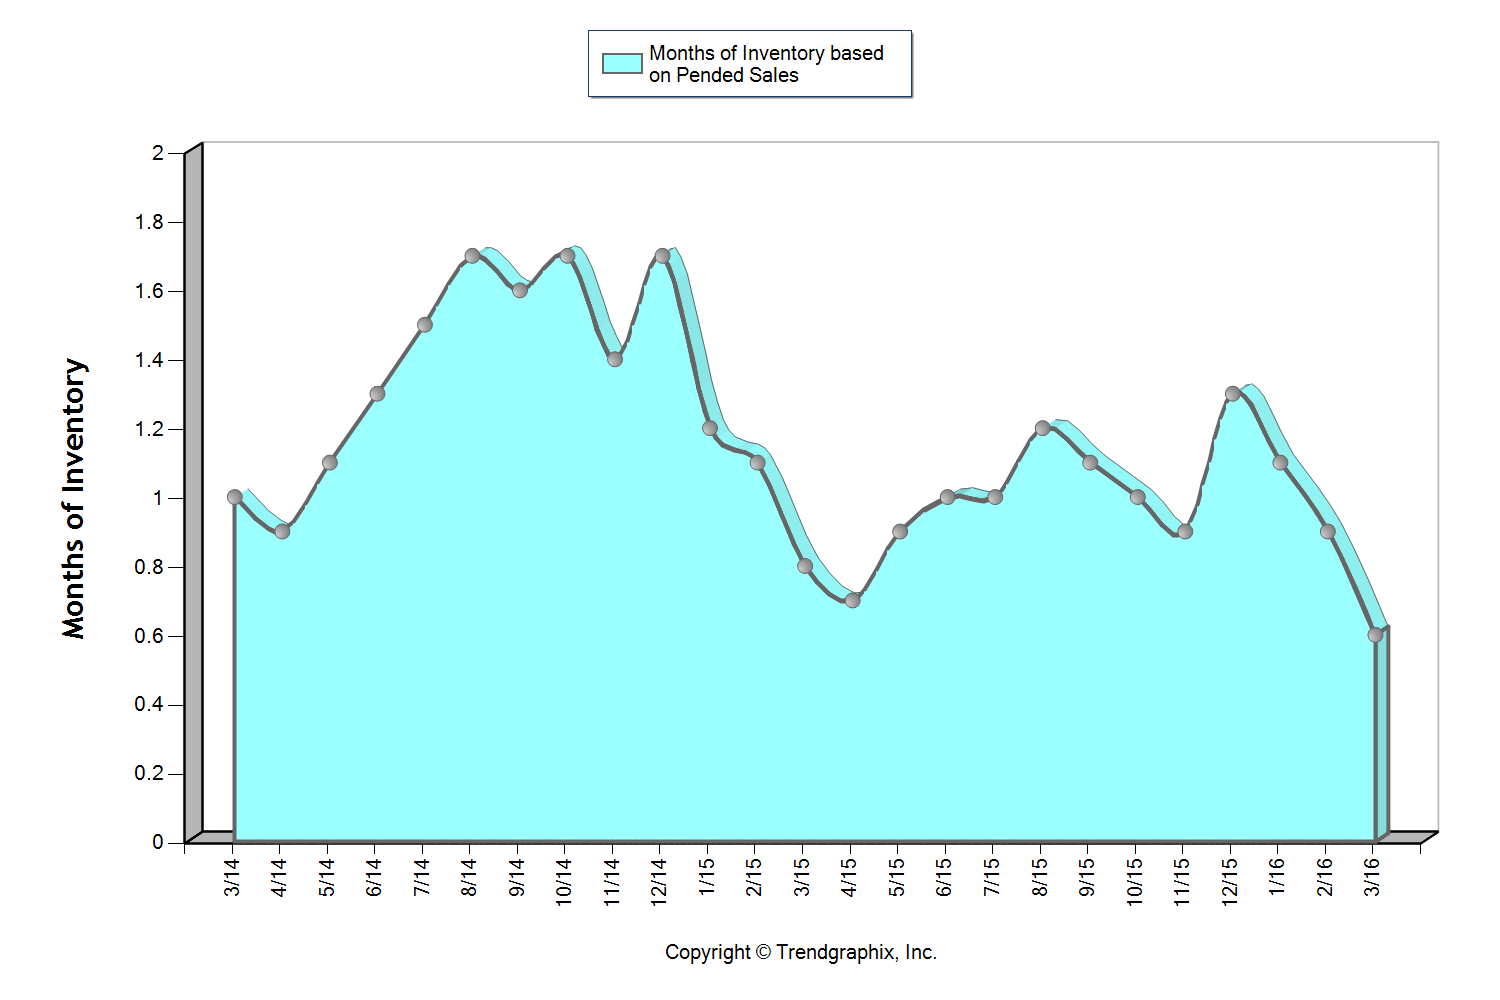
North King County 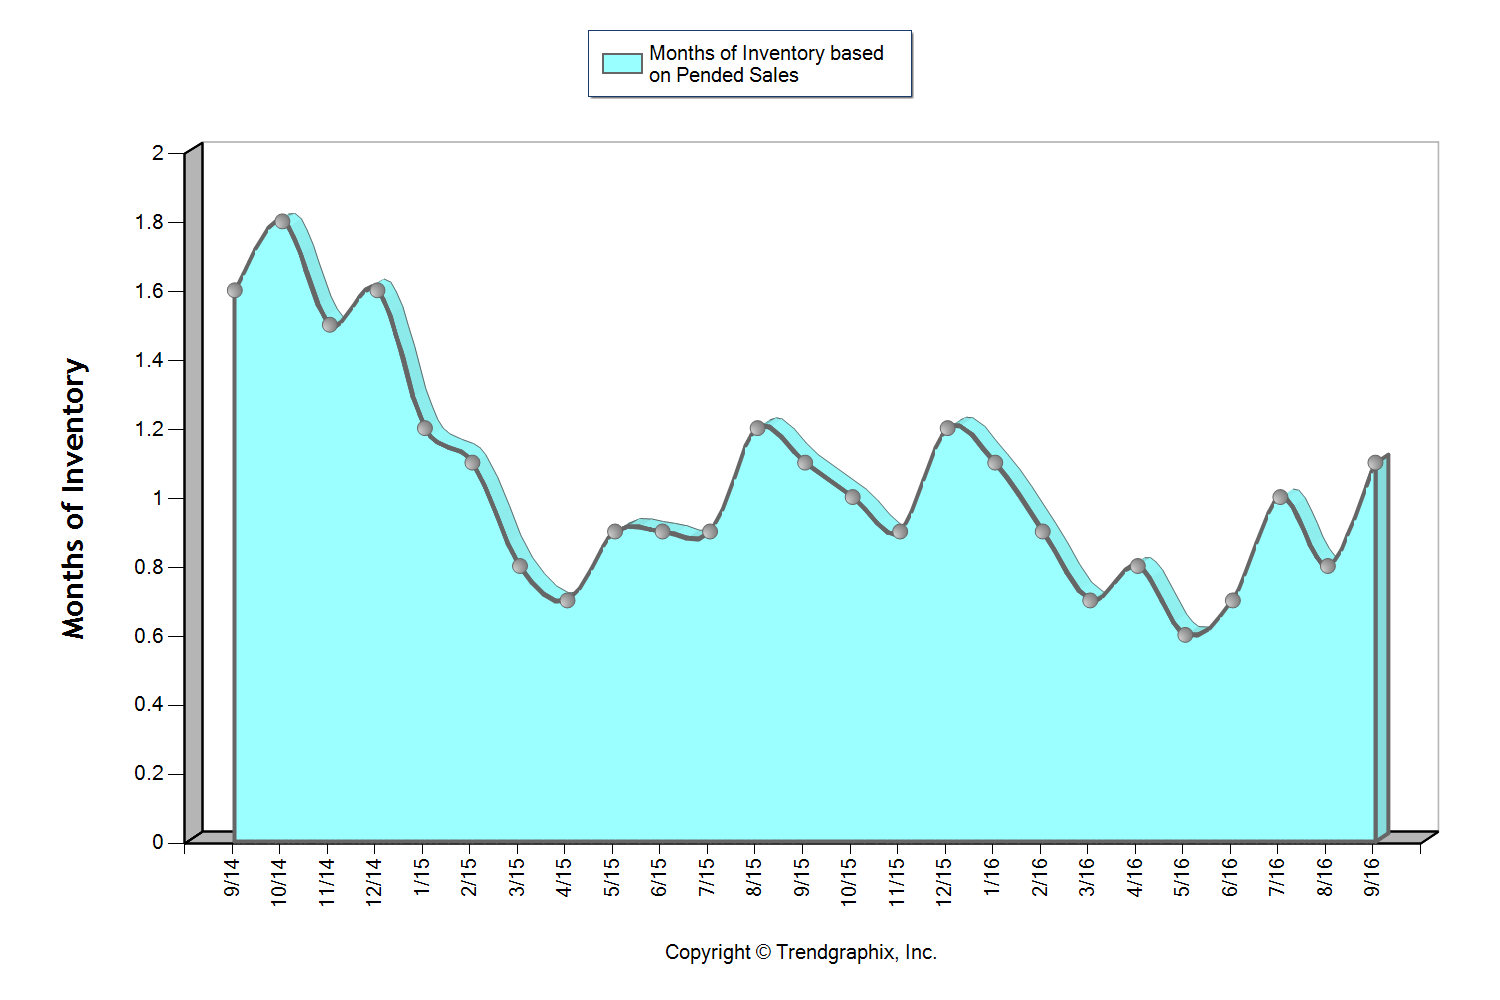
This graph shows that we currently sit at 1.1 months of inventory based on pending sales, which is the highest level we have seen since January! It is certainly still a seller’s market (3 months or less), but one that is starting to provide buyers increased options. In fact, we saw a 13% jump in new listings month-over-month. The average cumulative days on market reached 20 days in September, which was up 18% over August. Median price peaked in June at $650,000 and settled at $600,000 in September after hovering between $605,000 and $650,000 since March. In June, there were 95% more home sales above $1M over September. For the first time since February, the average list to sale price ratio was 101% after sitting at 102-104% over the last seven months.
The return of strong equity levels have brought sellers to market that have been waiting to jump in for some time. In fact, average prices have grown 21% over the last two years, freeing up sellers to make the moves they have been waiting for. Continued buyer demand due to our flourishing job market and historically low interest rates have steadily absorbed new inventory, but we are finally starting to see a trend toward some more balance. This is good news! We are still seeing multiple offers and quick market times, but not quite the frenzy that we experienced earlier this year.
All of these factors indicate that we may finally be headed towards a more stabilized market with positive attributes for both buyers and sellers.
Eastside 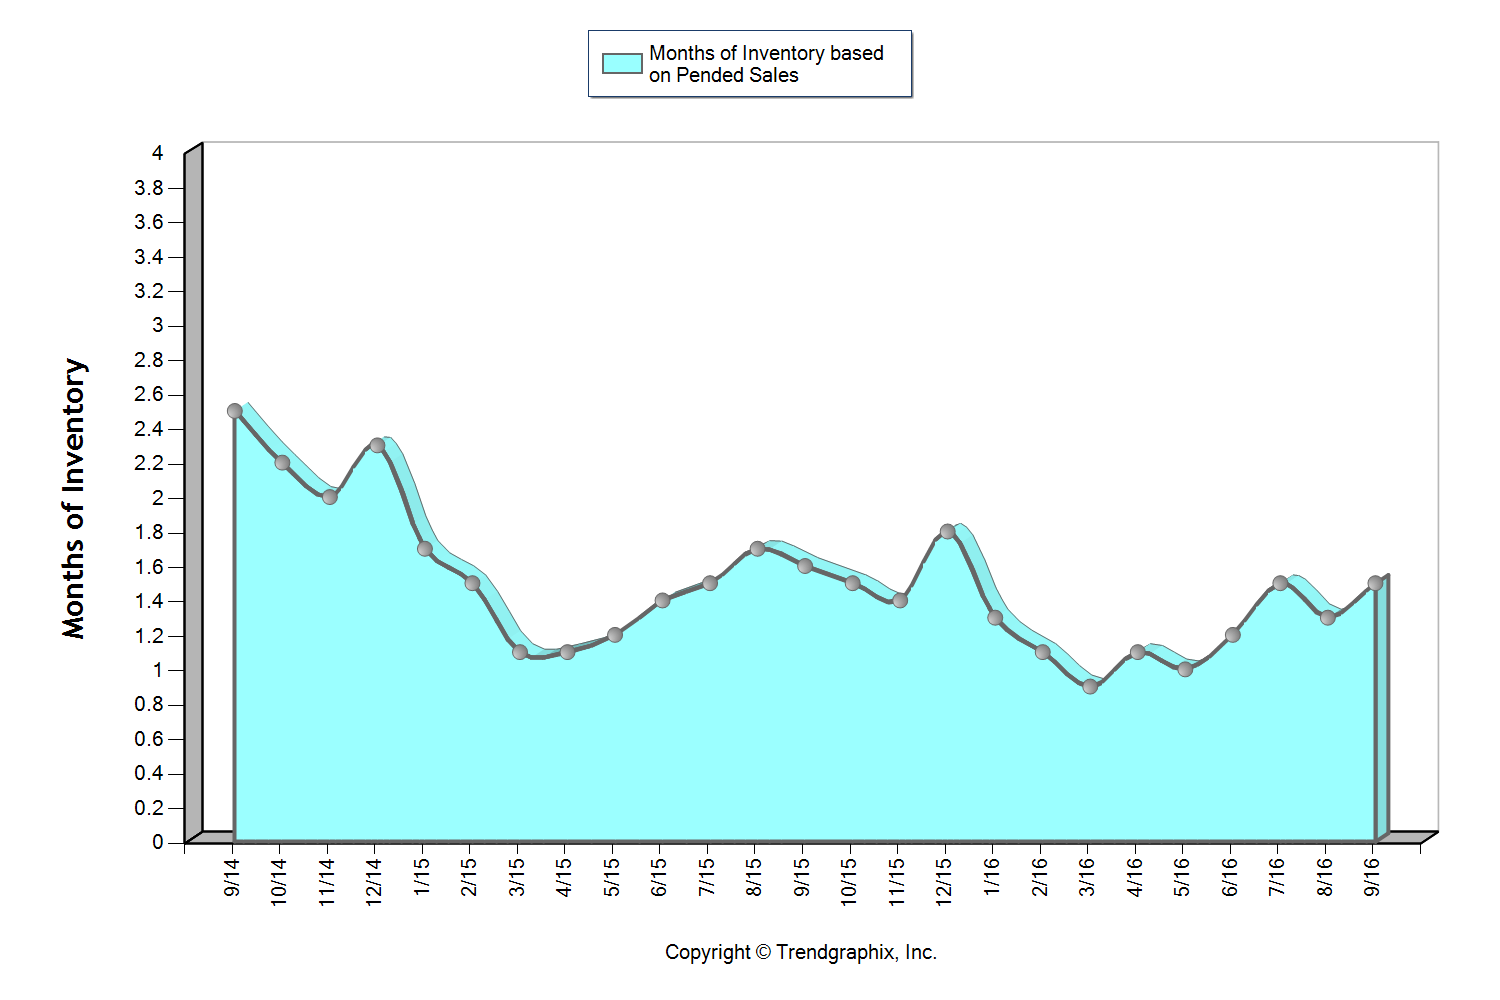
This graph shows that we currently sit at 1.5 months of inventory based on pending sales, which is the highest level we have seen in all of 2016! It is still a seller’s market (3 months or less), but one that is starting to provide buyers increased options. The average cumulative days on market reached 31 days in September which was up 24% over August. Median price peaked in August at $770,000 and settled at $750,000 in September after hovering between $737,000 and $770,000 since March. In June, there were 18% more home sales above $1M over September. Over the last two months, the average list to sale price ratio was 99% after sitting at 101-102% over the five months prior.
The return of strong equity levels have brought sellers to market that have been waiting to jump in for some time. In fact, average prices have grown 25% over the last two years, freeing up sellers to make the moves they have been waiting for. Continued buyer demand due to our flourishing job market and historically low interest rates have steadily absorbed new inventory, but we are finally starting to see a trend toward some more balance. This is good news! We are still seeing multiple offers and quick market times, but not quite the frenzy that we experienced earlier this year.
All of these factors indicate that we may finally be headed towards a more stabilized market with positive attributes for both buyers and sellers.
Seattle Metro 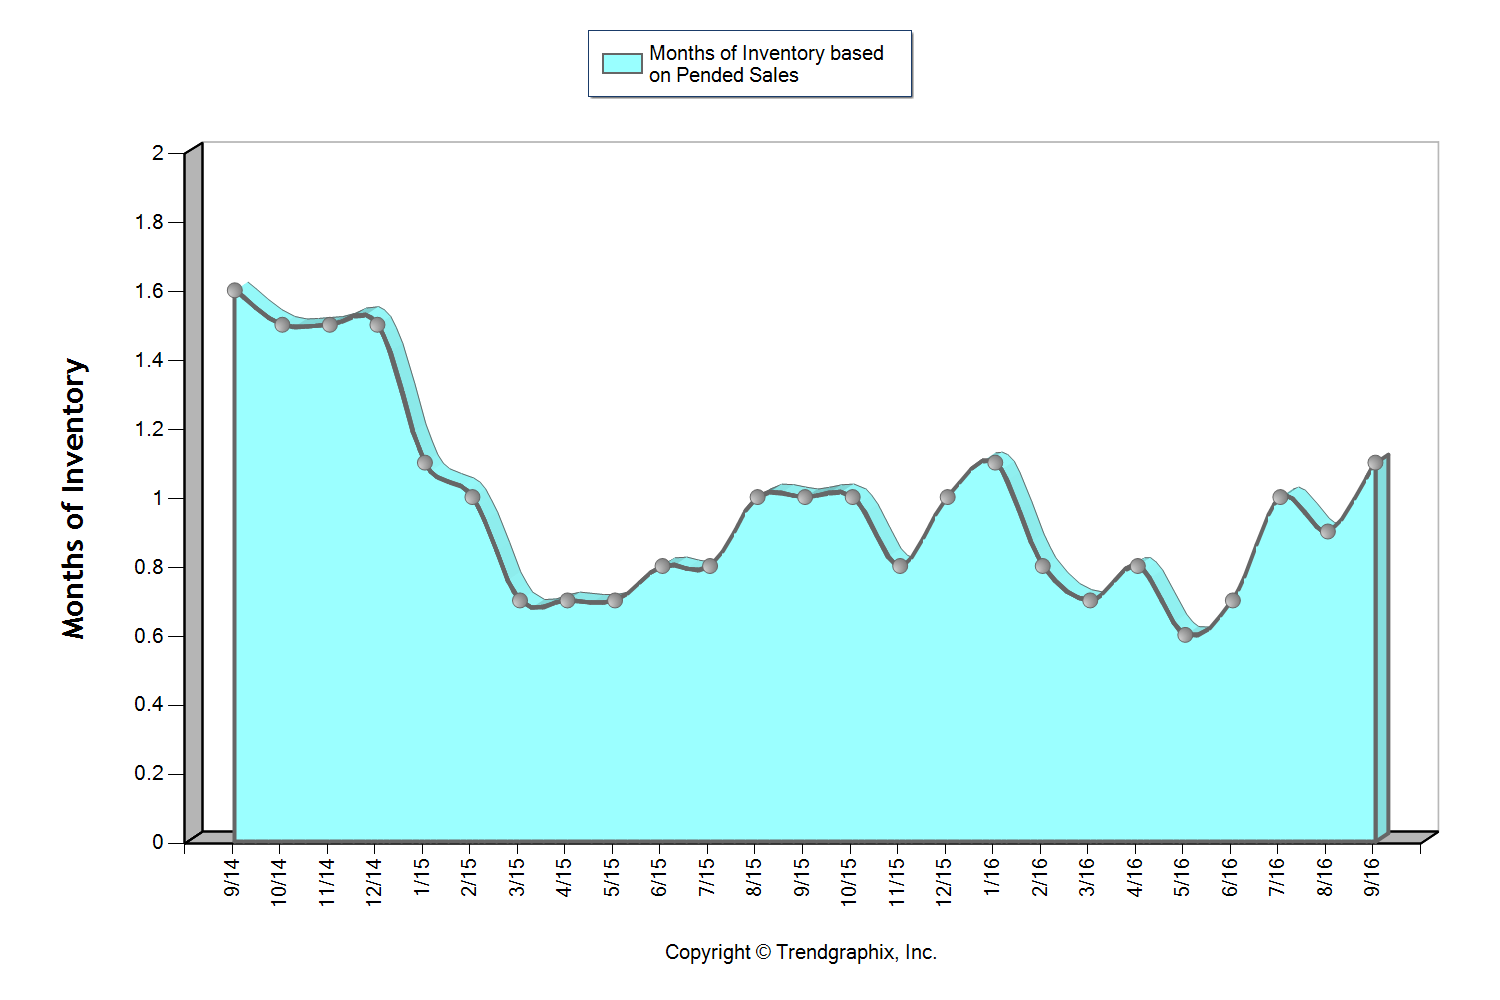
This graph shows that we currently sit at 1.1 months of inventory based on pending sales, which is the highest level we have seen since January! It is certainly still a seller’s market (3 months or less), but one that is starting to provide buyers increased options. In fact, we saw a 16% jump in new listings month-over-month. The average cumulative days on market reached 21 days in September, which was up 31% over August. Median price peaked in June at $650,000 and settled at $605,000 in September after hovering between $608,000 and $650,000 since March. In June, there were 23% more home sales above $1M over September. For the first time since February, the average list to sale price ratio was 101% after sitting at 102-104% over the last seven months.
The return of strong equity levels have brought sellers to market that have been waiting to jump in for some time. In fact, average prices have grown 22% over the last two years, freeing up sellers to make the moves they have been waiting for. Continued buyer demand due to our flourishing job market and historically low interest rates have steadily absorbed new inventory, but we are finally starting to see a trend toward some more balance. This is good news! We are still seeing multiple offers and quick market times, but not quite the frenzy that we experienced earlier this year.
All of these factors indicate that we may finally be headed towards a more stabilized market with positive attributes for both buyers and sellers.
South King County 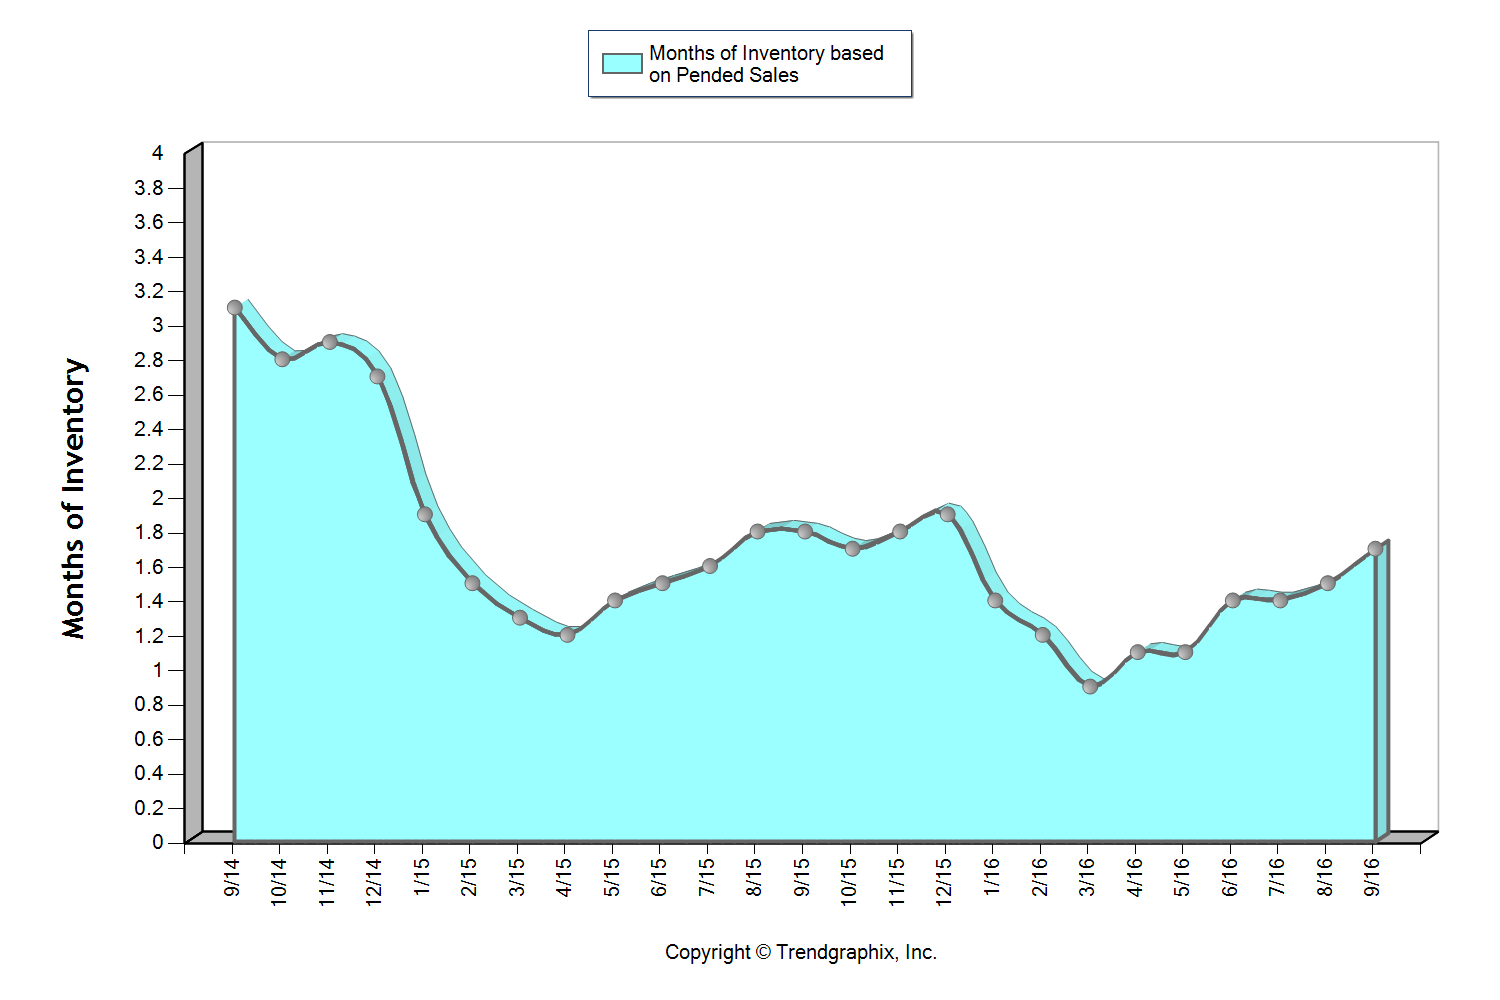
This graph shows that we currently sit at 1.7 months of inventory based on pending sales, which is the highest level we have seen in all of 2016! It is still a seller’s market (3 months or less), but one that is providing buyers increased options. The average cumulative days on market reached 27 days in both August and September, which was up 23% over July. Median price peaked in June at $371,000 and settled at $360,000 in September after hovering between $350,000 and $371,000 since March. For the first time since March, the average list to sale price ratio was 99% in August and September after sitting at 100-101% the prior four months.
The return of strong equity levels have brought sellers to market that have been waiting to jump in for some time. In fact, average prices have grown 16% over the last two years, freeing up sellers to make the moves they have been waiting for. Continued buyer demand due to our flourishing job market and historically low interest rates have steadily absorbed new inventory, but we are finally starting to see a trend toward some more balance. This is good news! We are still seeing multiple offers and quick market times, but not quite the frenzy that we experienced earlier this year.
All of these factors indicate that we may finally be headed towards a more stabilized market with positive attributes for both buyers and sellers.
These are only snapshots of the trends in our area; please contact one of our agents if you would like further explanation of how the latest trends relate to you.
Interest Rates and Your Bottom Line
 Wow, just wow! The interest rate levels that we have experienced in 2016 are seriously unbelievable. Currently we are hanging around 3.5% for a 30-year fixed conventional mortgage, almost a half a point down from a year ago. This is meaningful because the rule of thumb is that for every one-point increase in interest rate a buyer loses ten percent in buyer power. For example, if a buyer is shopping for a $500,000 home and the rate increases by a point during their search, in order to keep the same monthly payment the buyer would need to decrease their purchase price to $450,000. Conversely, for every decrease in interest rate, a buyer can increase their purchase price and keep the same monthly mortgage payment.
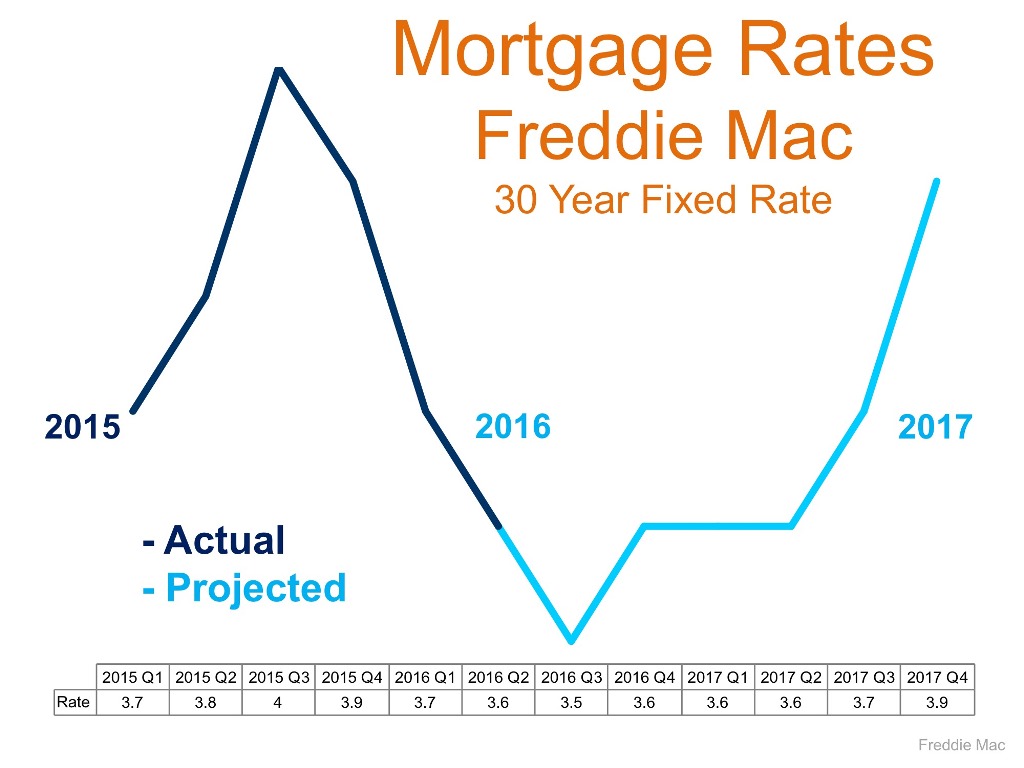
Why is this important to pay attention to? Affordability! If you take the scenario I just described and apply it to the graph on the right, you can see that the folks who jumped into the market this year enjoyed an interest cost savings when securing their mortgage. This cost savings is doubly important because we are in a price appreciating market. In fact, the median price in King County has increased by 13% complete year-over-year and 10% in Snohomish County. Interest rates are helping to keep payments more manageable in our appreciating market. Most recently we have started to see a slight increase in inventory compared to the spring/summer market, which is a plus for buyers and something to be taken advantage of.
Will these rates last forever? Simply put, no! The graph above provided by Freddie Mac shows a prediction for rates to start rising. While still staying well below the 30-year average of 7.65%, increases are increases, and securing these rates could be downright historical. Just like the 1980’s when folks were securing mortgages at 18%, the people that lock down on a rate from today will be telling these stories to their grandchildren. Another factor to consider is that it is an election year, and rates historically remain level during these times. What 2017 and beyond hold for rates will likely not mirror these historical lows under 4%. Note the 30-year average – one must think that rates closer to that must be in our future at some point.
So what does this mean for you? If you have considered making a move, or even your first purchase, today’s rates are a huge plus in helping make that transition more affordable. If you are a seller, bear in mind that today’s interest rate market is creating strong buyer demand, providing a healthy buyer pool for your home. As a homeowner who has no intention to make a move, now might be the time to consider a refinance. What is so exciting about these refinances, is that it is not only possible to reduce your monthly payment, but also your term, depending on which rate you would be coming down from.
If you would like additional information on how today’s historical interest rates pertain to your housing goals, please contact any of our agents. We would be happy to educate you on homes that are available, do a market analysis on your current home, and/or put you in touch with a reputable mortgage professional to help you crunch numbers. Real estate success is rooted in being accurately informed, and it is our goal to help empower you to make sound decisions for you and your family.
Many Factors to Consider When Choosing to Rent vs. Own
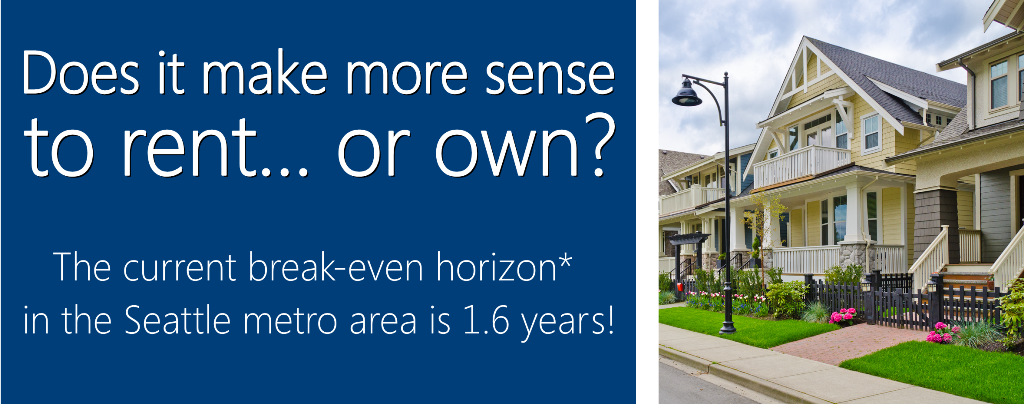
*The amount of time you need to own your home in order for owning to be a superior financial decision.
There has been a lot of talk lately about the cost of living in the Greater Seattle area. Whether it has to do with home prices or rental rates the story is the same: it is becoming more and more expensive by the month. With rising rental rates, historically low interest rates, and home prices on the rise, the advantage of buying vs. renting has become clear for folks that have a down payment saved, good debt to income ratios and strong credit. In fact, Seattle is now the 10th most expensive city to rent in the country according to a new study from Zumper.com. The average monthly rental price for a one-bedroom apartment in the city of Seattle is $1,740! Snohomish County has seen an increase in apartment growth and rising rental rates as well. Currently, the breakeven horizon in the Greater Seattle area (the amount of time you need to own your home in order for owning to be a superior financial decision versus renting) is 1.6 years according to Zillow research.
There are several factors to consider that will lead you to make the best decision for your lifestyle and your financial bottom line. One of the biggest factors is interest rates! Currently, the rate for a 30-year fixed, conventional, conforming loan is hovering around 3.5%. That is amazingly and historically low, making the advantage of securing a mortgage huge. What is nice about having a mortgage is that the payment stays the same over the term of the loan. With renting, rates can be increased at any time, and you are paying down someone else's asset, not your own. Owning gives the homeowner control over their overhead while getting to make their house their home. What is also so great about owning is that once you have hit the breakeven horizon, every month that ticks away thereafter is building your nest egg in value. Did you know that American homeowners’ net worth is 36 times the amount of renters? The long term benefits of owning are abundant. These are important factors to consider for everyone, but especially the younger folks that are enjoying the benefits of Seattle’s attractive job market and competitive wages.
Where folks are having to compromise most due to affordability is commute times and settling in less urban neighborhoods. Some people, mainly millennials, have not been willing to give up living in the more core urban neighborhoods that have high walk scores and shorter commute times. That should be apt to change as rents are rising fastest in those areas. The advantages of moving out a little further and securing a home will start people on the track of building long term wealth. If you or anyone you know is currently renting and is considering a change, please let us know, as we would be happy to get your questions answered to help you make an informed decision.
A Thirteen-Year Overview of Inventory Levels- Where’s the Balance?
The two graphs here illustrate a thirteen-year overview of inventory levels in both King and Snohomish Counties, highlighting the 2007 crash. Inventory levels are measured by the months of available inventory. For example, if there were 60 homes available in July and 30 homes sold in July, you would be left with two months of inventory; meaning that if no new homes came to market, the demand of 30 homes per month would absorb the 60 available homes in two months. A buyer's market is defined by 6+ months of inventory, a balanced market, 3-6 months and a seller's market, 0-3 months. From March to June of this year we averaged 1.1 months of inventory in King County and 1.2 months in Snohomish County, both extreme seller's markets.
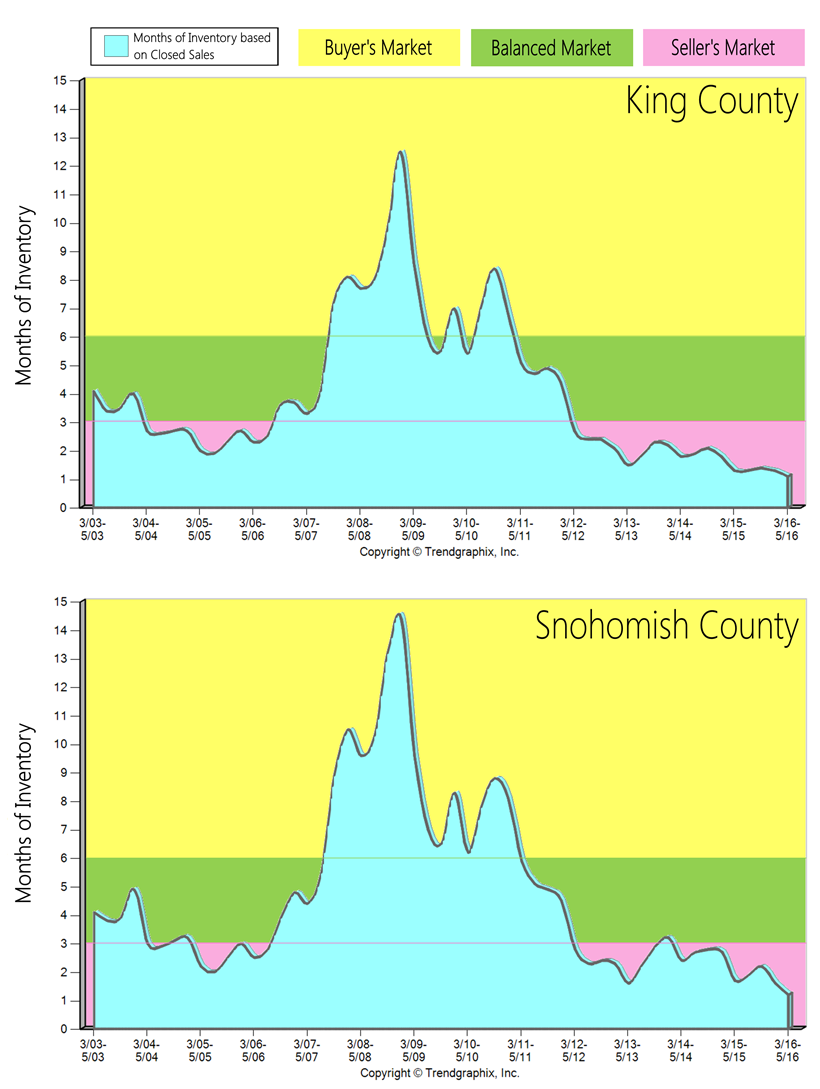 In King County over the last 13 years we saw three years of a buyer's market, which happened during the biggest economic downturn since the Great Depression, after the crash of the housing market in 2007. This economic fallout was a result of predatory lending practices, which created a large population of buyers who were not truly qualified to purchase a home. This oversaturated the market and then led it to its crash when those lending practices were shut down. These severe influences on the market led to quick jumps from a seller's to a buyer's market and then a buyer's to a seller's market. It only took one short year to transition from the seller's market of 2004-2006 to the three-year long buyer's market after the housing crash. Once the sub-prime lending options were shut down in July 2007, it eliminated many buyers, creating an extreme buyer's market. It also only took one short year to transition out of the downturn and back to a seller's market as the economy started to recover. It has been a seller's market in King County since May of 2012 – four years!
In Snohomish County over the last 13 years we saw four years of a buyer's market. Snohomish County was hit a bit harder by the Great Recession than our neighbor to the south, as it took longer to recover. It has been a seller's market in Snohomish County since May of 2012, except for one quarter of a balanced market in the beginning of 2014, when we saw a surge of new construction come to market due to the national builders releasing some neighborhoods they had acquired in the downturn.
Interestingly, the market shifts were brief because the downturn was so severe, which changed the market environment quickly. In order to clean up the predatory lending mistakes of 2004-2007, the market essentially had to come to a standstill and flush out all of the bad loans via foreclosure and short sales, which took five years. The only time we found ourselves in such an extreme buyer's market, was after one of the biggest economic fallouts of the last century. Once that corrected itself we quickly returned to a seller's market due to many positive factors.
Our available housing stock is affected by the limited land left to build on, a thriving job sector (especially in tech), historically low interest rates and the Greater Seattle area being a nice place to live. All four of these indicators have shrunk inventory and put upward pressure on prices. Sellers continue to enjoy great market returns, and buyers continue to fight to secure a home with a 4% interest rate, and not too far from their workplace. Additional inventory would be more than welcomed, it is very clear that we have the demand to absorb it. If you are curious about the value of your home in today's market or securing a purchase please contact one of our agents. We are always happy to help educate you on how this market can benefit your bottom line.
Market Update – Q1 2016
The 2016 real estate market is off to an extreme start! Strong buyer demand due to our flourishing job market and historically low interest rates are the driving force behind this market. Buyers often find themselves competing due to multiple offers which require seller-centric terms in order to win. Prices have continued to grow over the last two years, putting sellers in a very favorable equity position, freeing them up to make the moves they have been waiting for. Additional inventory would help slow price growth and make it less competitive for buyers, creating positive outcomes for everyone. Lending requirements remain stringent, unlike the past “up” market which created the bubble we experienced in 2008.
Scroll down for more details about the first quarter market in Snohomish County, south Snohomish County, north King County, the Eastside, Seattle Metro and south King County.
Snohomish County
More inventory is needed to quench buyer demand as we head into spring and summer.
Snohomish County ended 2015 with a larger-than-seasonally-normal surge of closed sales, leaving us with only 1.4 months of inventory based on pending sales to start the year, which is not much! The first quarter saw a frenzy of buyer activity but only a small trickle of new inventory, leaving us with only 0.8 months of inventory heading into the second quarter. This has caused days on market to shrink and list-to-sale price ratios to rise. These conditions are very favorable to sellers. In fact, average and median prices were up 5% and 4% respectively in March over February! The good news is that new listings were up 25% in that same time frame. We hope to see that trend continue as we head into spring as the buyer demand is there to absorb it and it is needed to slow price growth.
South Snohomish County
More inventory is needed to quench buyer demand as we head into spring and summer.
South Snohomish County ended 2015 with a larger-than-seasonally-normal surge of closed sales, leaving us with only 1.2 months of inventory based on pending sales to start the year, which is not much! The first quarter saw a frenzy of buyer activity but only a small trickle of new inventory, leaving us with only 0.7 months of inventory heading into the second quarter. This has caused days on market to shrink and list-to-sale price ratios to rise. These conditions are very favorable to sellers. In fact, average and median prices were up 5% in March over February! The good news is that new listings were up 27% in that same time frame. We hope to see that trend continue as we head into spring as the buyer demand is there to absorb it and it is needed to slow price growth.
North King County
More inventory is needed to quench buyer demand as we head into spring and summer.
North King County ended 2015 with a larger-than-seasonally-normal surge of closed sales, leaving us with only 1.1 months of inventory based on pending sales to start the year, which is not much! The first quarter saw a frenzy of buyer activity but only a small trickle of new inventory, leaving us with only 0.6 months of inventory heading into the second quarter. This has caused days on market to shrink and list-to-sale price ratios to rise. These conditions are very favorable to sellers. In fact, the average price was up 2% in March over February! The good news is that new listings were up 49% in that same time frame. We hope to see that trend continue as we head into spring as the buyer demand is there to absorb it and it is needed to slow price growth.
Eastside
More inventory is needed to quench buyer demand as we head into spring and summer.

The Eastside ended 2015 with a larger-than-seasonally-normal surge of closed sales, leaving us with only 1.3 months of inventory based on pending sales to start the year, which is not much! The first quarter saw a frenzy of buyer activity but only a small trickle of new inventory, leaving us with only 0.9 months of inventory heading into the second quarter. This has caused days on market to shrink and list-to-sale price ratios to rise. These conditions are very favorable to sellers. In fact, average and median prices were up 4% in March over February! The good news is that new listings were up 43% in that same time frame. We hope to see that trend continue as we head into spring as the buyer demand is there to absorb it and it is needed to slow price growth.
Seattle Metro
More inventory is needed to quench buyer demand as we head into spring and summer.

The Seattle Metro area ended 2015 with a larger-than-seasonally-normal surge of closed sales, leaving us with only 1.1 months of inventory based on pending sales to start the year, which is not much! The first quarter saw a frenzy of buyer activity but only a small trickle of new inventory, leaving us with only 0.6 months of inventory heading into the second quarter. This has caused days on market to shrink and list-to-sale price ratios to rise. These conditions are very favorable to sellers. In fact, average and median prices were up 3% in March over February! The good news is that new listings were up 47% in that same time frame. We hope to see that trend continue as we head into spring as the buyer demand is there to absorb it and it is needed to slow price growth.
South King County
More inventory is needed to quench buyer demand as we head into spring and summer.
South King County ended 2015 with a larger-than-seasonally-normal surge of closed sales, leaving us with only 1.4 months of inventory based on pending sales to start the year, which is not much! The first quarter saw a frenzy of buyer activity but only a small trickle of new inventory, leaving us with only 0.8 months of inventory heading into the second quarter. This has caused days on market to shrink and list-to-sale price ratios to rise. These conditions are very favorable to sellers. In fact, average and median prices were up 6% and 3% respectively in March over February! The good news is that new listings were up 39% in that same time frame. We hope to see that trend continue as we head into spring, as the buyer demand is there to absorb it and it is needed to slow price growth.
This is only snapshots of the trends in our area. Please contact one of our agents if you would like further explanation of how the latest trends relate to you.
Strategy is Key in an Extreme Market
 The beginning of 2016 has been quite the ride so far in our local real estate market. It has been the most extreme seller's market we've ever seen. At the end of February, both King and Snohomish Counties ended the month with only one month of inventory based on pending sales. Pending numbers (the amount of homes going under contract) were up 35% in King County from the previous month and up 24% in Snohomish over the previous month. Demand is strong! How we manage that demand is critical. Every type of market calls upon different skills to achieve the best outcome for our clients. In this extreme seller's market the strategy one creates for their sellers to gain the best possible outcome is a fine-tuned, high-effort approach.
First, market research and price positioning not only takes studying the history of the market, but anticipating what is next, so no opportunities are missed. Second, properly bringing the home to market is still paramount. Even though there are less homes to choose from in this market, how a home "shows up" could make a difference of thousands of dollars in return for a seller. An investment in professional photography, staging and marketing only adds to the exposure, increasing interest from the buying public. Third, managing the demand – this is huge! This is where communication and being the calm in the storm is key. It is always our goal to harness control and bring calm during the intense initial market time. It is not our goal to take the first offer that comes our seller's way. Instead it is our goal to massage what the home has to offer over a set period of time in order to garner a great price for our Sellers, but also superior terms, such as waived contingencies. Fourth, it is our goal to end with a contract that has a great price, but also one that will make it to the closing table. There are obstacles in this accelerating market, such as passing appraisal, which we anticipate up front to insure a smooth journey through closing.
 By completing extensive market research, studying upcoming trends, highlighting a property's features with superior marketing, executing a strategy to manage the demand and negotiating the best terms for our sellers, we are creating above market-average results! In the first two months of 2016, the average cumulative days on market in King County was 40.5 days and Snohomish County was 50.5. My office averaged 23 days and 25 days respectively. In those same two months the list to sale price ratio in King County was 100.5% and 99.5% in Snohomish County. My office averaged 101.2% and 103.1% respectively. Saved market time and higher price acceleration is resulting in a better bottom line for our clients.
These results do not come without a refined, strategic approach. Understanding the nuances that each market brings equals results in the best interest of our clients. If you or any one you know is contemplating participating in this extreme seller's market please contact one of our agents. It would be our honor to have the opportunity to help create and navigate a successful strategy resulting in a win.
