
 Facebook
 X
X
 Pinterest
 Copy Link
Quarterly Reports: Q4 North Snohomish County
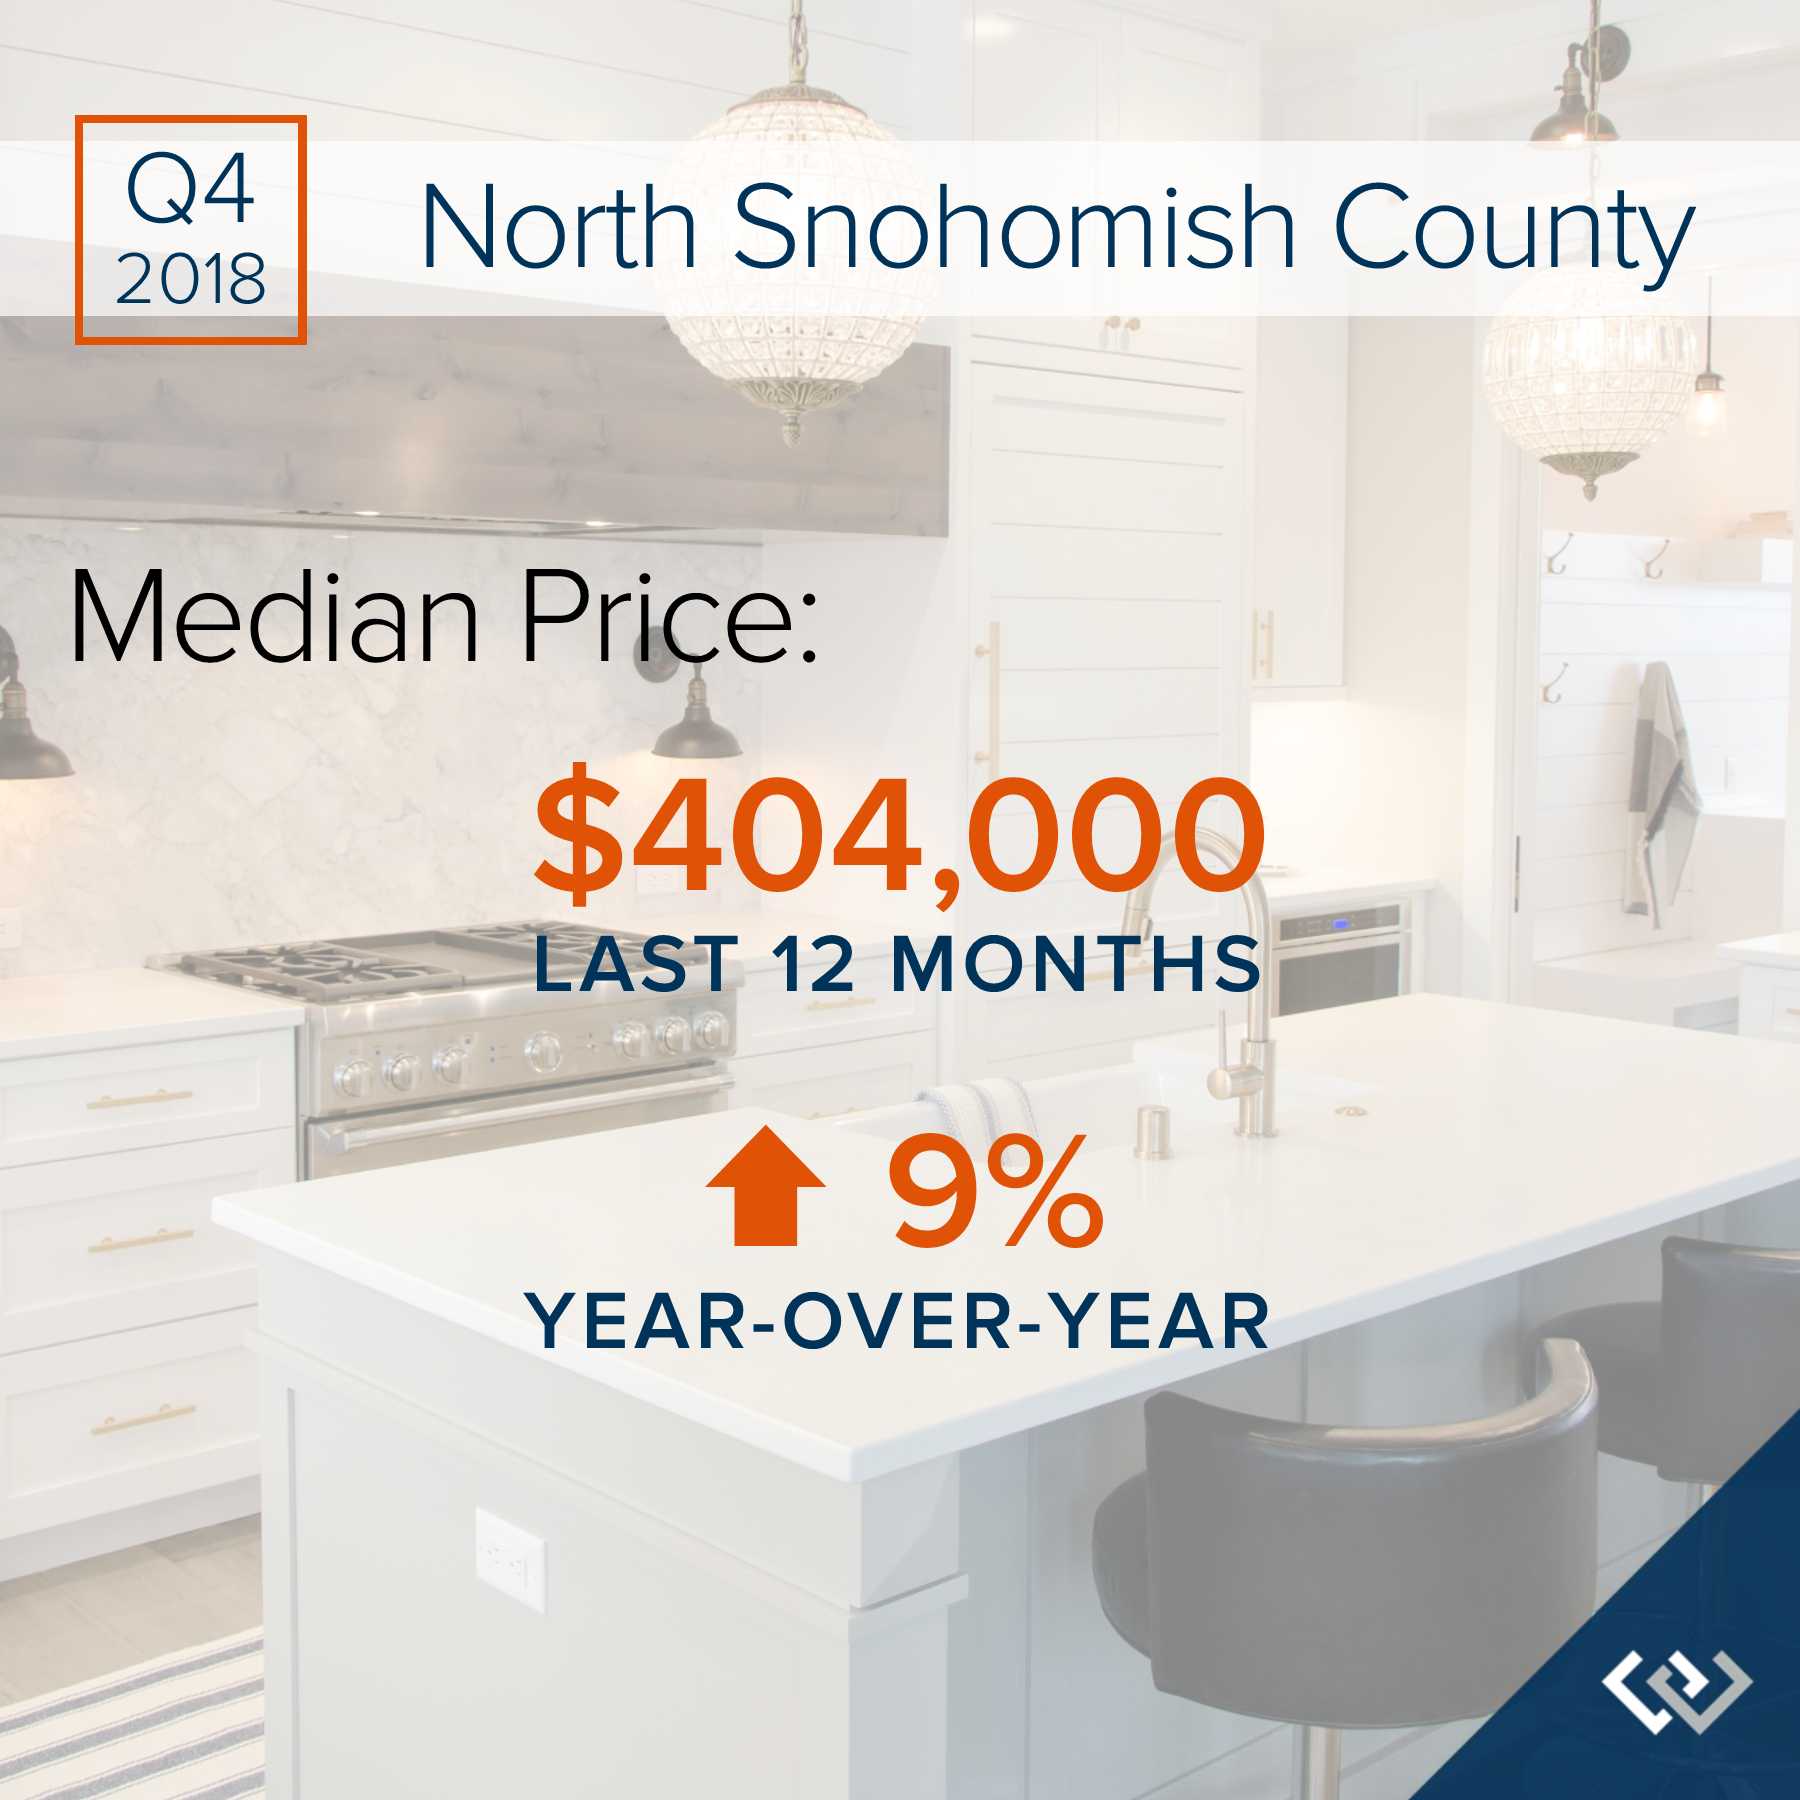
Q4: October 1 – December 31, 2018
NORTH SNOHOMISH COUNTY: 2018 was a year of change and growth. The market shifted from an extreme seller’s market, but still had strong gains. Year-over-year, median price is up 9% and since 2012 has increased 88%! Over the last 19 years, the average year-over-year price increase has been 6%. This puts into perspective the growth we have experienced, resulting in well-established equity levels. In 2018, inventory averaged 1.6 months, higher than 2017. This caused the month-over-month price gains to slow, and we experienced a price correction over the second half of the year. We expect to see more average levels of price appreciation in 2019 as the market continues to balance out.
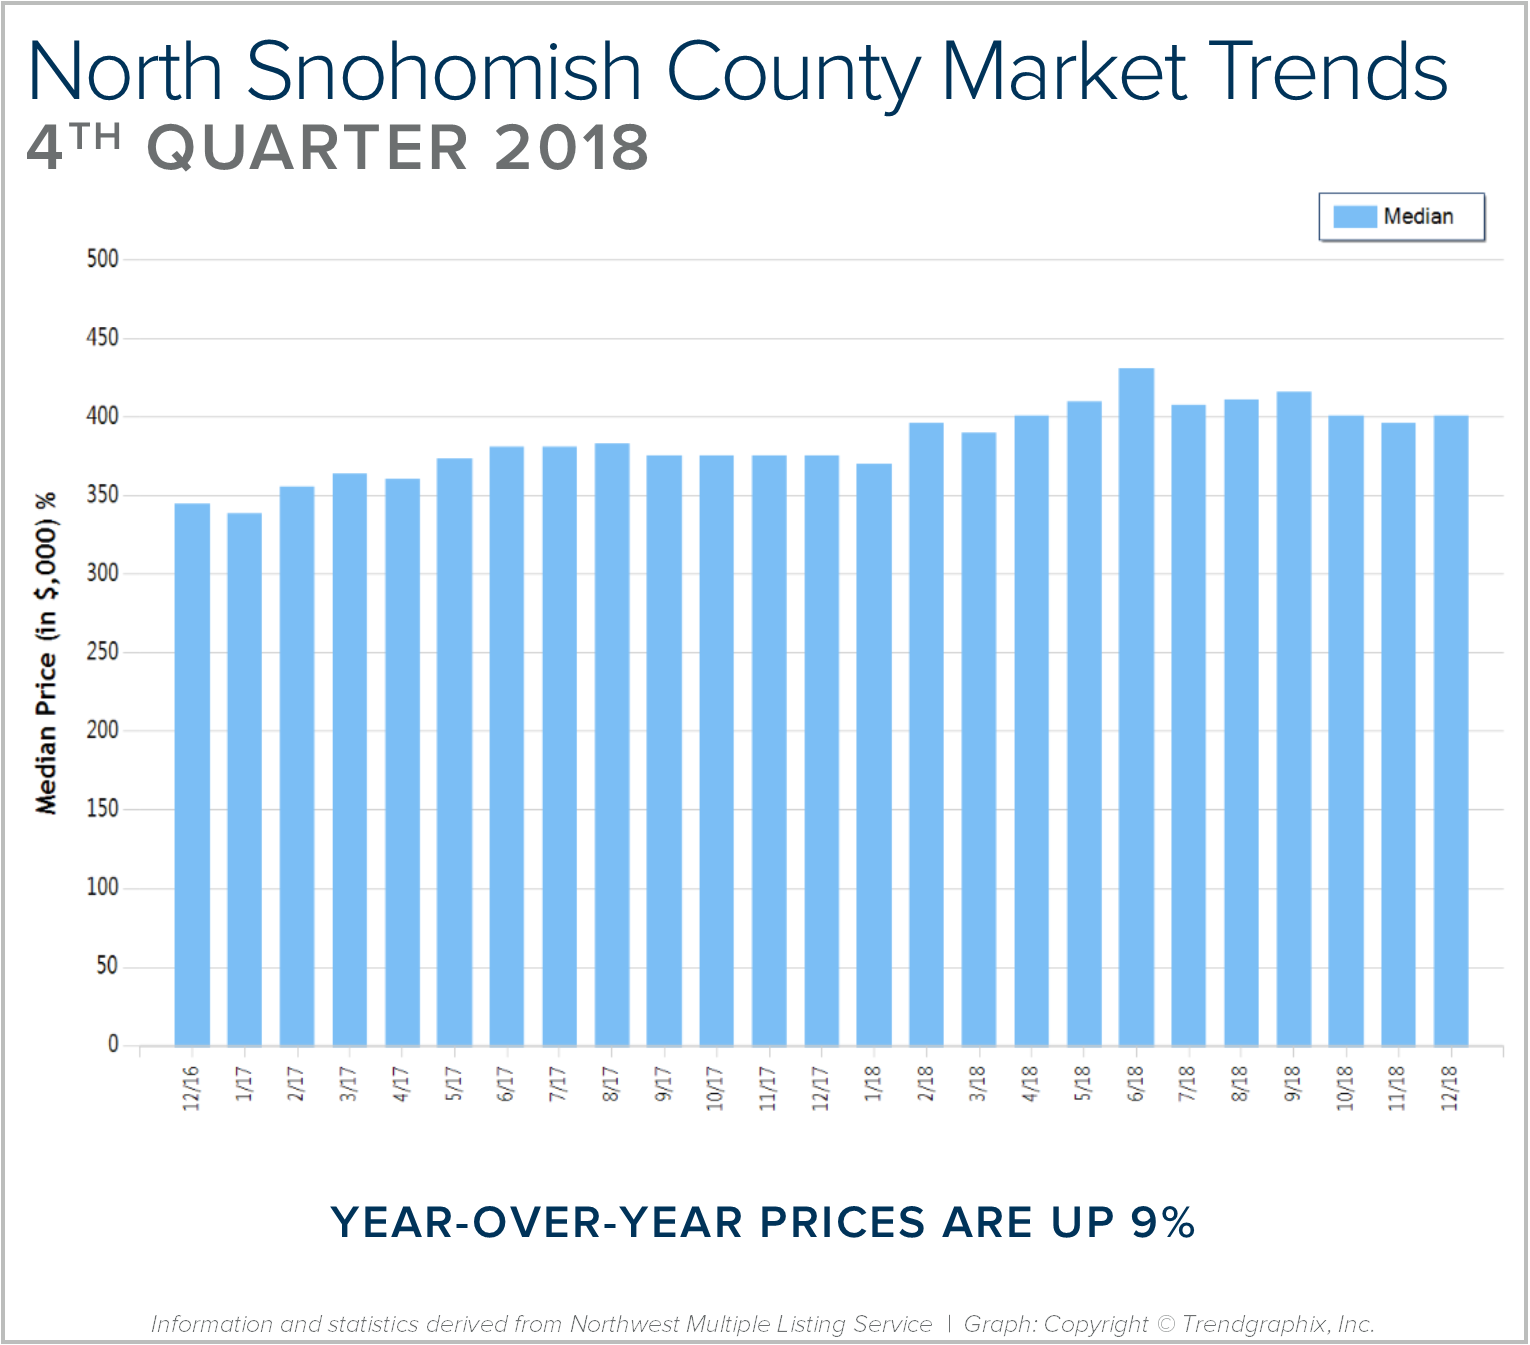
After six years of expansion resulting in an extreme seller’s market, in 2018 we encountered a market shift in the late spring. Inventory increased, interest rates took a jump, and demand took a step back to re-evaluate the new playing field. This resulted in a tempering of month-over-month price appreciation, and has established some long-awaited balance. This balance has brought opportunities for both buyers and sellers. Buyers have more selection and are negotiating terms like inspection items and concessions. Sellers are sitting on 6+ years of equity growth, and are now able to sell their home and make a move without fearing where they will land next. Interest rates are still well below the 30-year average, currently hovering just under 5%. We are seeing demand start to re-engage now that the new normal has settled in.
This is only a snapshot of the trends in north Snohomish County; please contact us if you would like further explanation of how the latest trends relate to you.
Quarterly Reports: Q3 North King
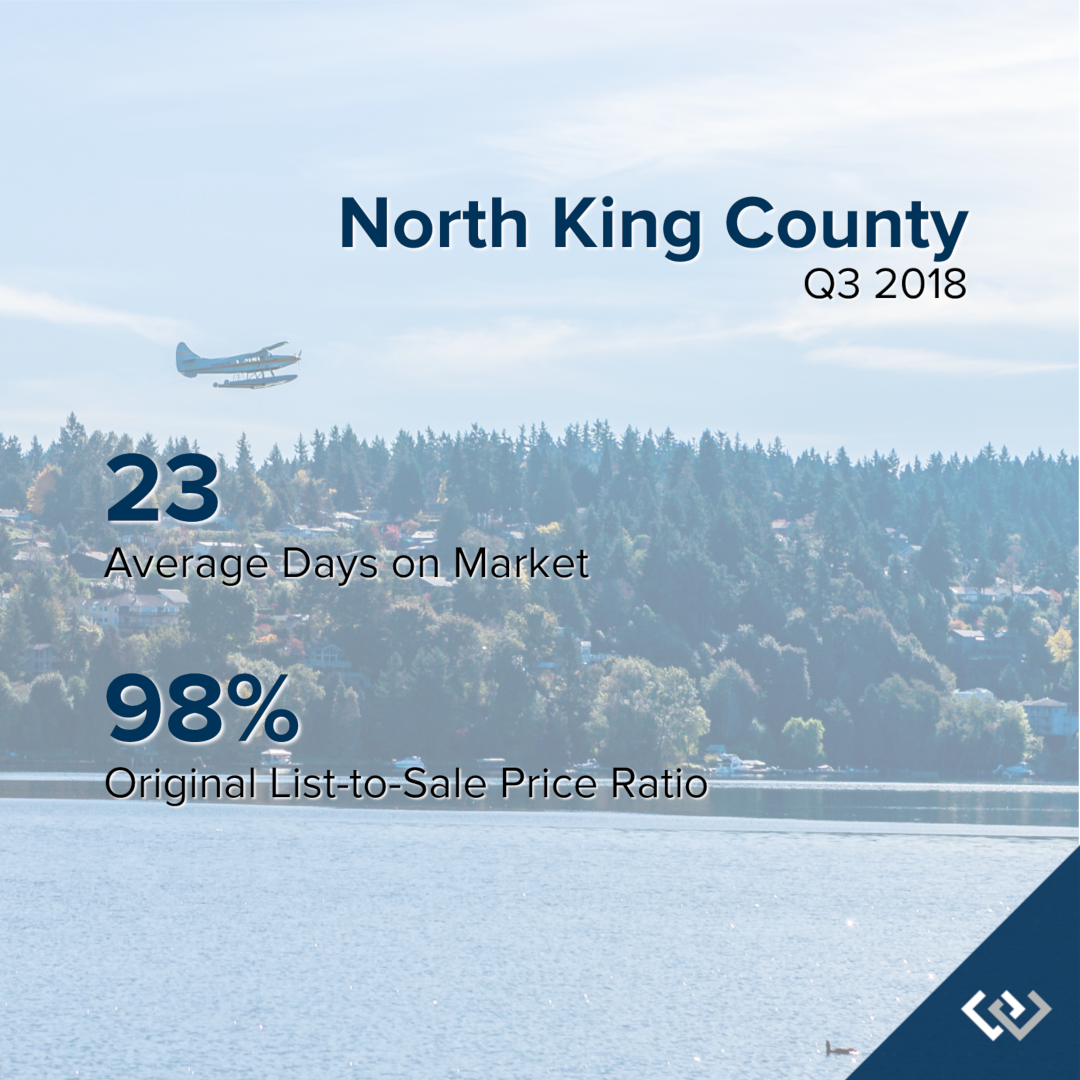
Q3: July 1 – September 30, 2018
NORTH KING COUNTY: In September, the average days on market landed at 23 days and the original list-to-sale price ratio 98%. Since May, inventory growth has been noticeable, and has given buyers more options. This has led to more negotiations and fewer bidding wars, which is tempering month-over-month price growth to a more sustainable level.
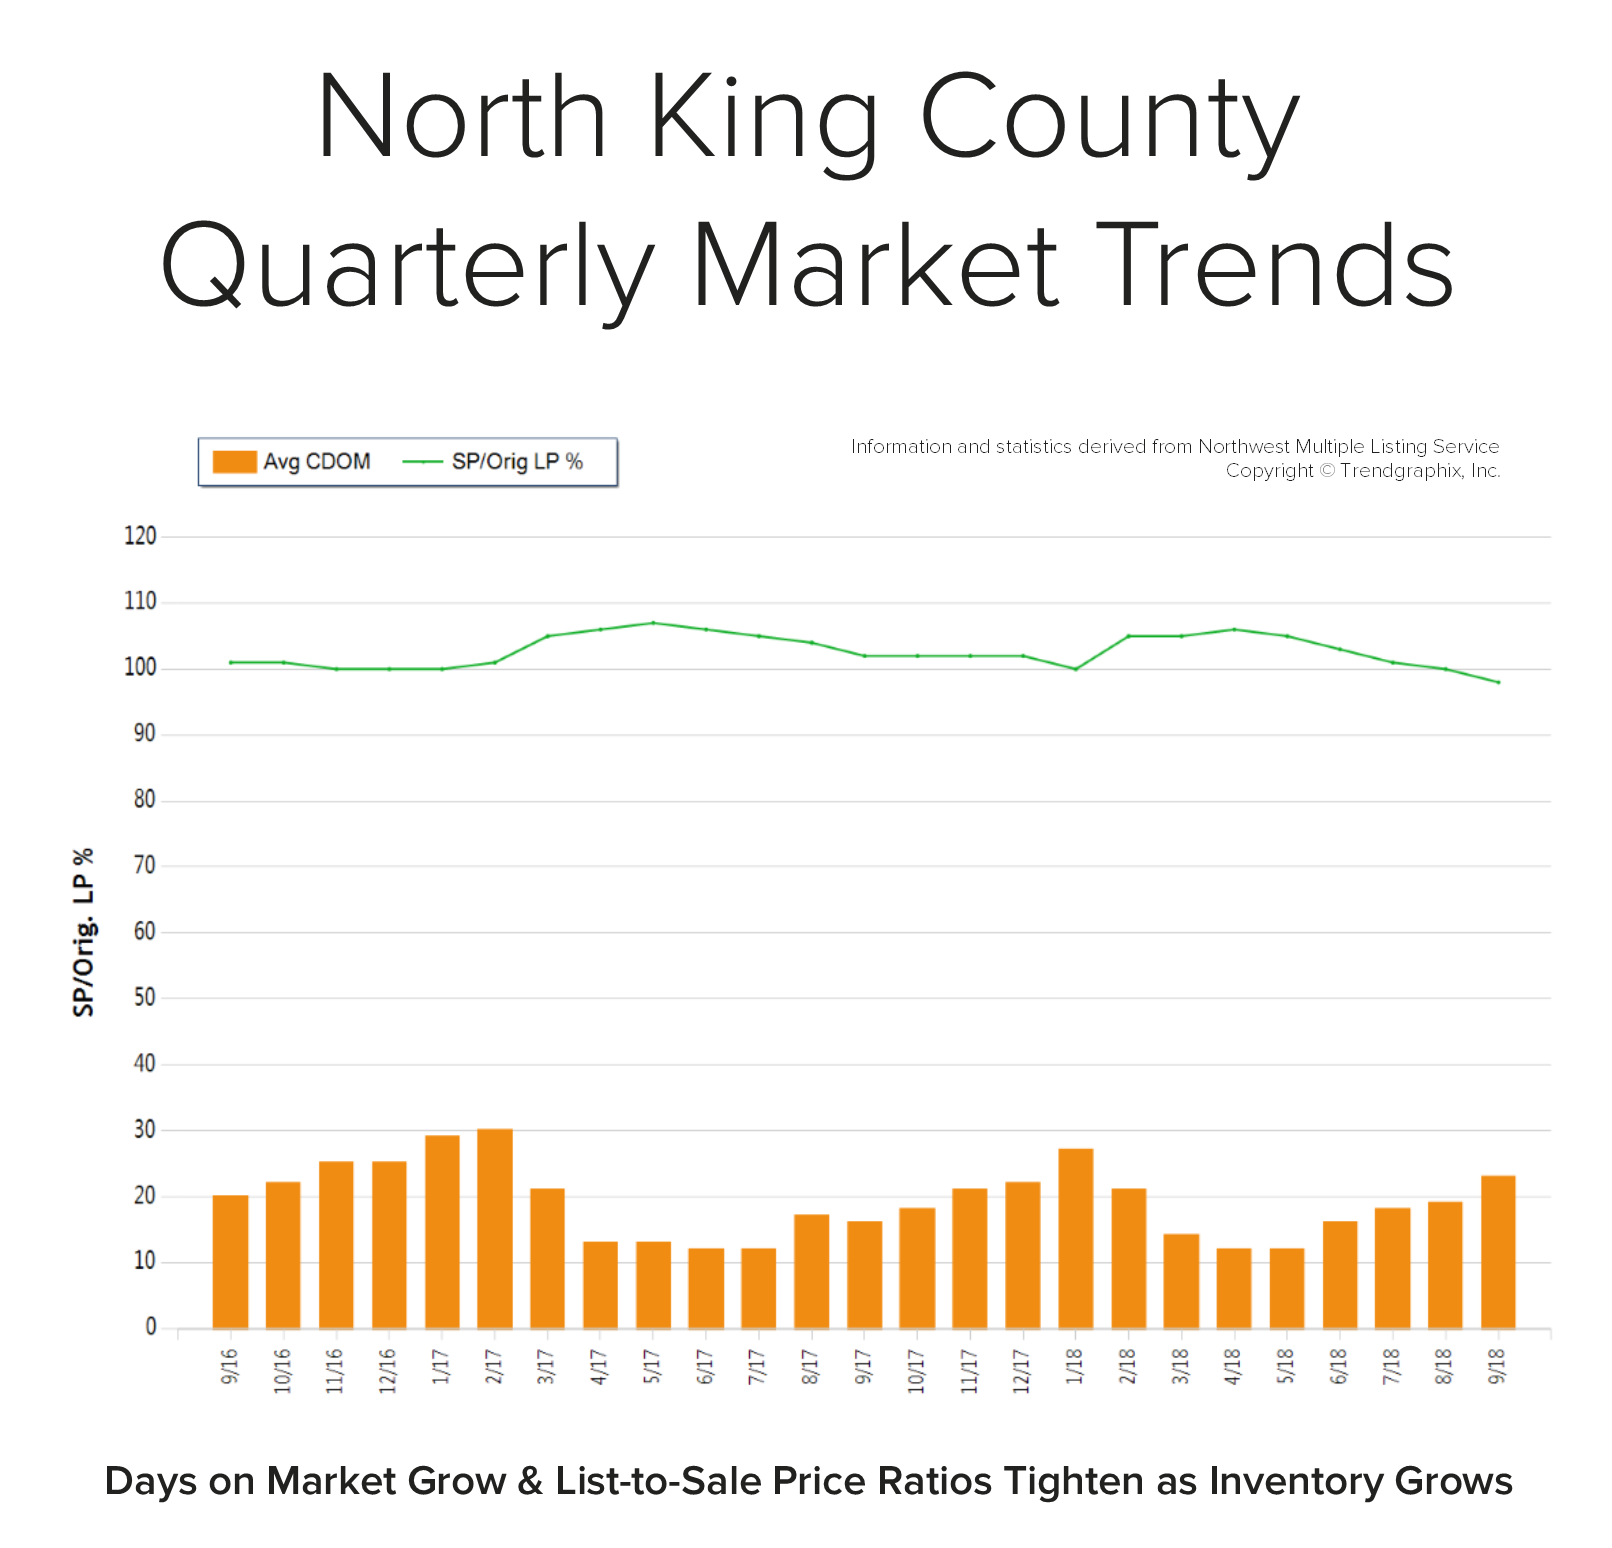 Back in April, the average days on market was 12 days and the original list-to-sale price ratio 106%; but months of inventory based on pending sales was 0.8 months, compared to 2.2 months currently. Year-over-year, prices are up 10%, still well above the historical norm of 3%-5% year-over-year gains—but note that the majority of this growth happened during the spring, due to constricted inventory levels.
Supply has increased, creating more options for buyers and helping to buffer affordability issues. Many sellers are deciding to make moves and cash in on the equity gained over the last six years. An average original list-to-sale price ratio of 98% is a positive return, yet illustrates a softening in the market after some very extreme times. With 10% price growth over the last 12-months in a seller’s favor, the increase in selection has led to more nimble moves from one house to another. Where sellers need to be careful is anticipating the month-over-month price growth we saw prior to the shift in inventory. Prospective buyers would be smart to take advantage of today’s historically low interest rates and the added inventory selection.
This is only a snapshot of the trends in north King County; please contact us if you would like further explanation of how the latest trends relate to you.
Quarterly Reports: Q3 Seattle Metro
Q3: July 1 – September 30, 2018
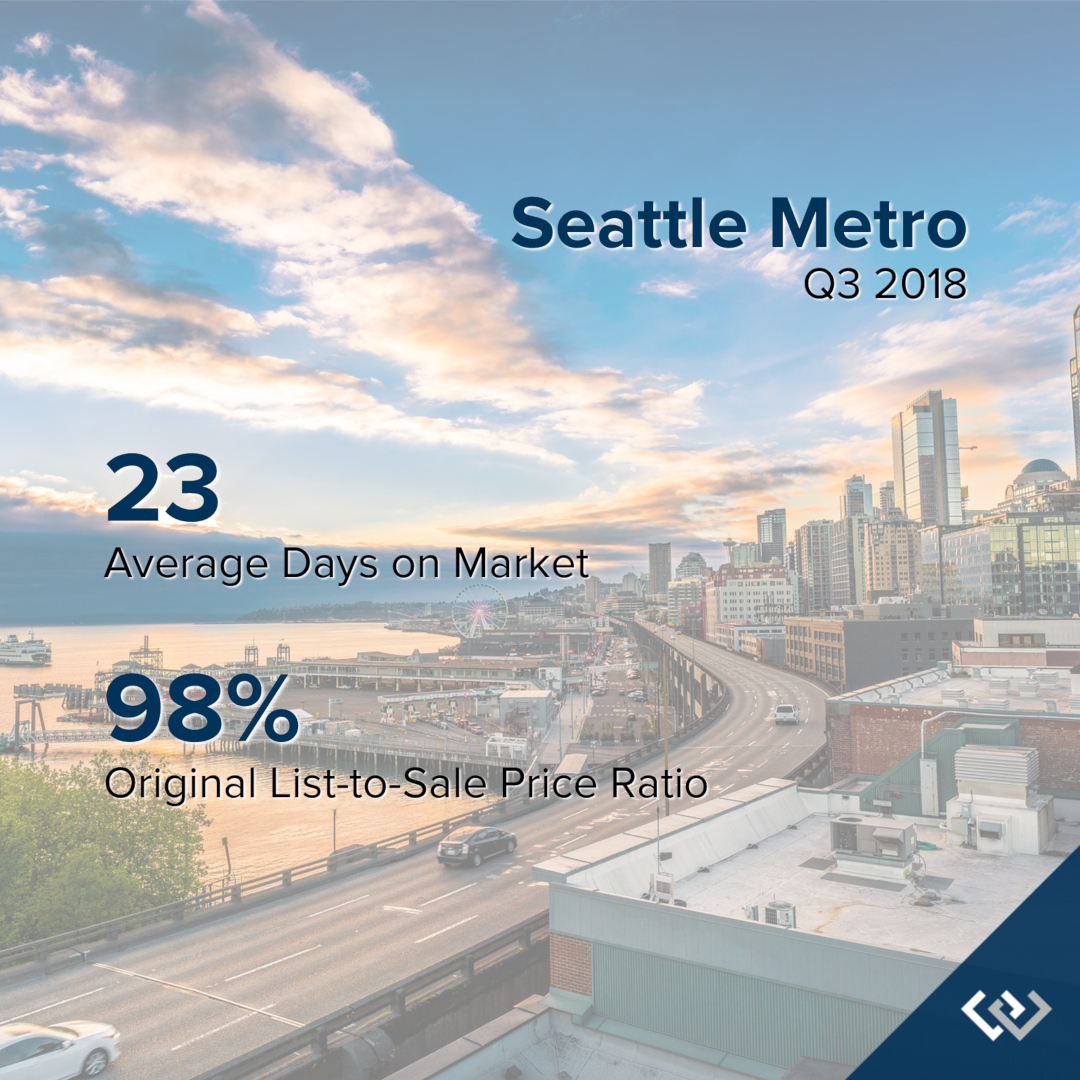
SEATTLE METRO: In September, the average days on market landed at 23 days and the original list-to-sale price ratio 98%. Since May, inventory growth has been noticeable, and has given buyers more options. This has led to more negotiations and fewer bidding wars, which is tempering month-over-month price growth to a more sustainable level.
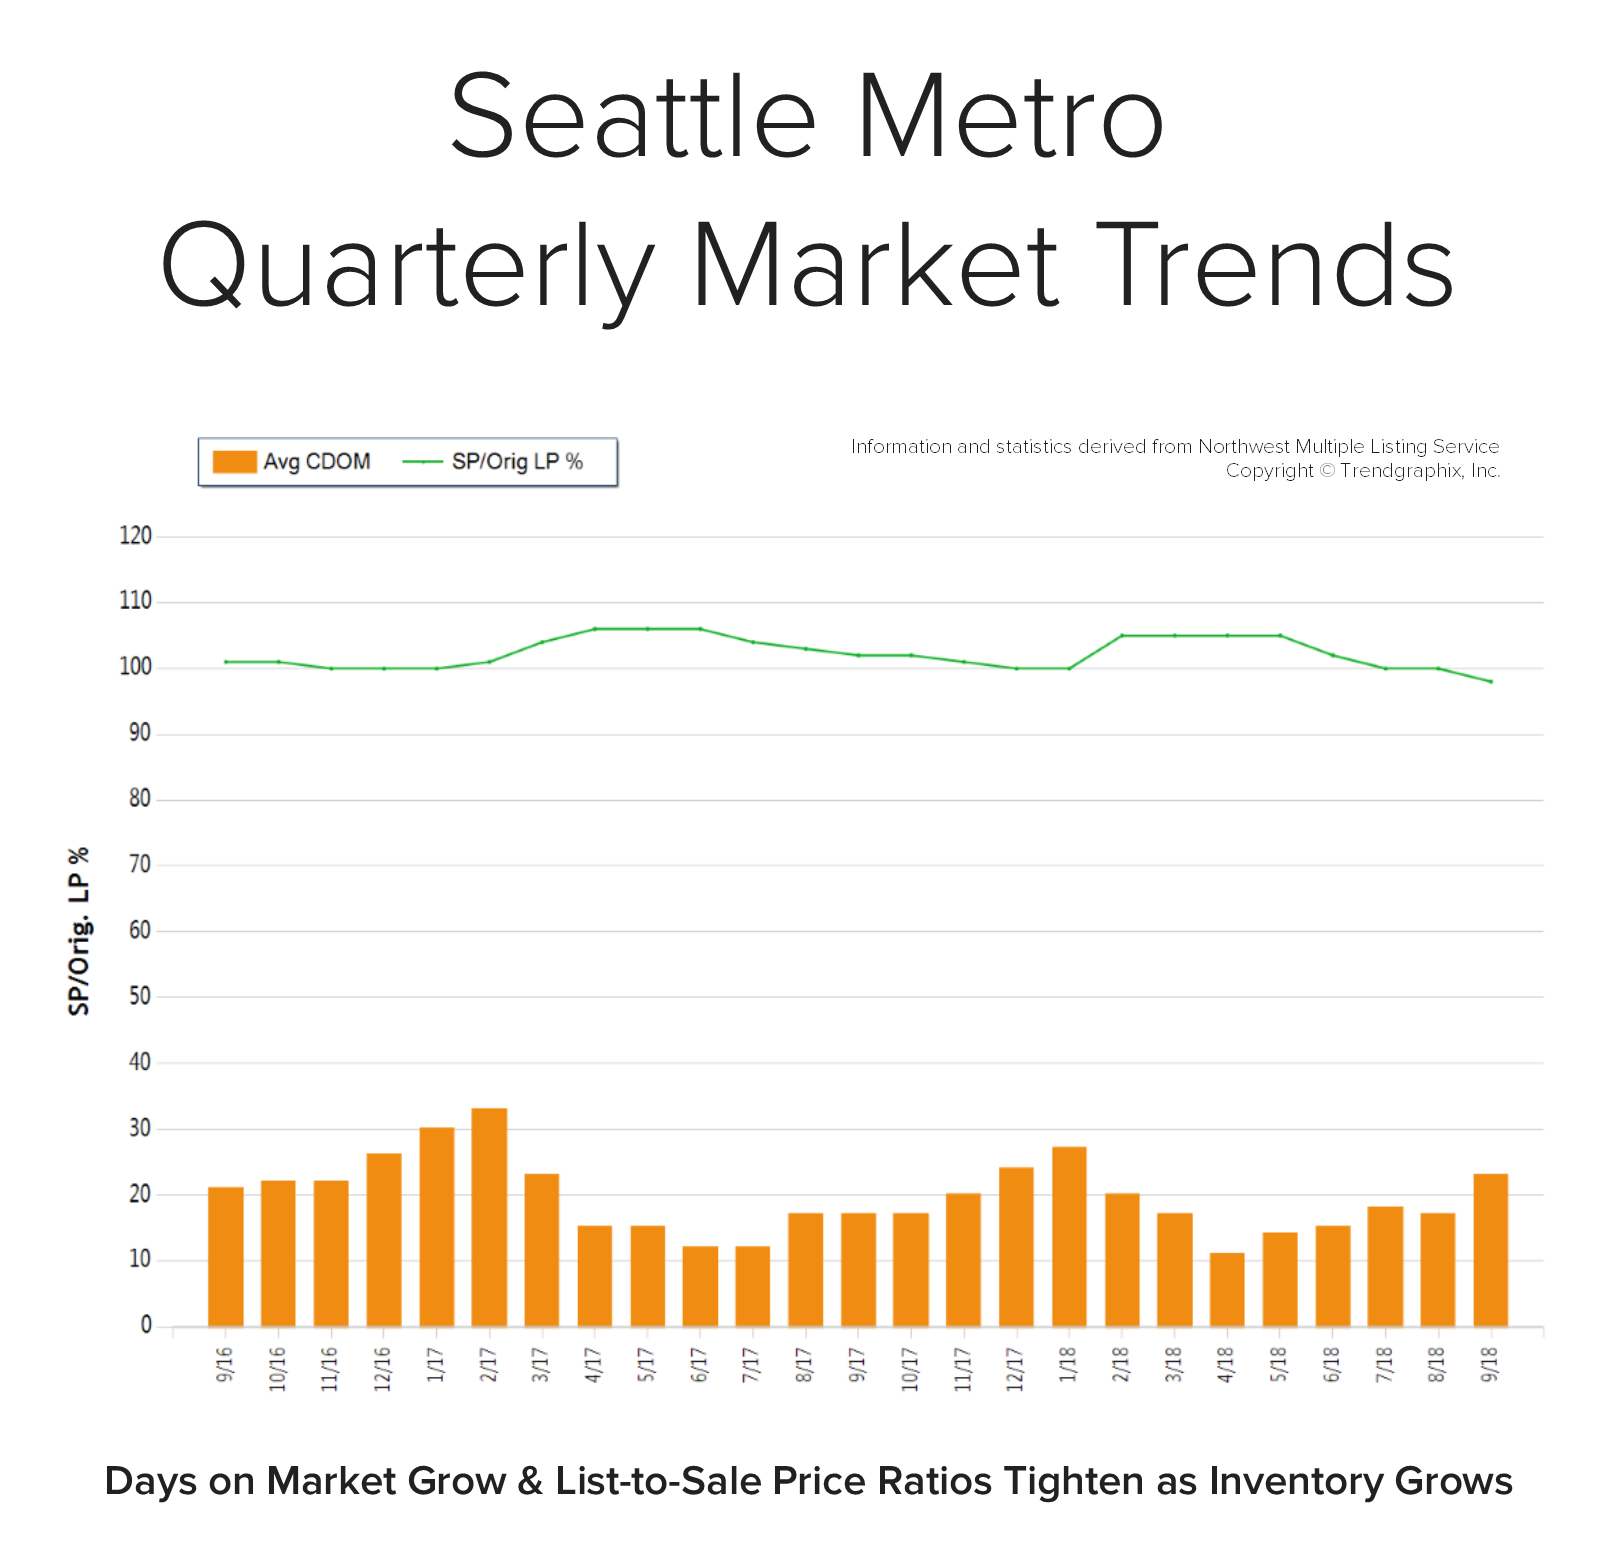 Back in April, the average days on market was 11 days and the original list-to-sale price ratio 105%; but months of inventory based on pending sales was 0.8 months, compared to 2.4 months currently. Year-over-year, prices are up 11%, still well above the historical norm of 3%-5% year-over-year gains—but note that the majority of this growth happened during the spring, due to constricted inventory levels.
Supply has increased, creating more options for buyers and helping to buffer affordability issues. Many sellers are deciding to make moves and cash in on the equity gained over the last six years. An average original list-to-sale price ratio of 98% is a positive return, yet illustrates a softening in the market after some very extreme times. With 10% price growth over the last 12-months in a seller’s favor, the increase in selection has led to more nimble moves from one house to another. Where sellers need to be careful is anticipating the month-over-month price growth we saw prior to the shift in inventory. Prospective buyers would be smart to take advantage of today’s historically low interest rates and the added inventory selection.
This is only a snapshot of the trends in the Seattle Metro area; please contact us if you would like further explanation of how the latest trends relate to you.
Quarterly Reports: Q3 Eastside
Q3: July 1 – September 30, 2018
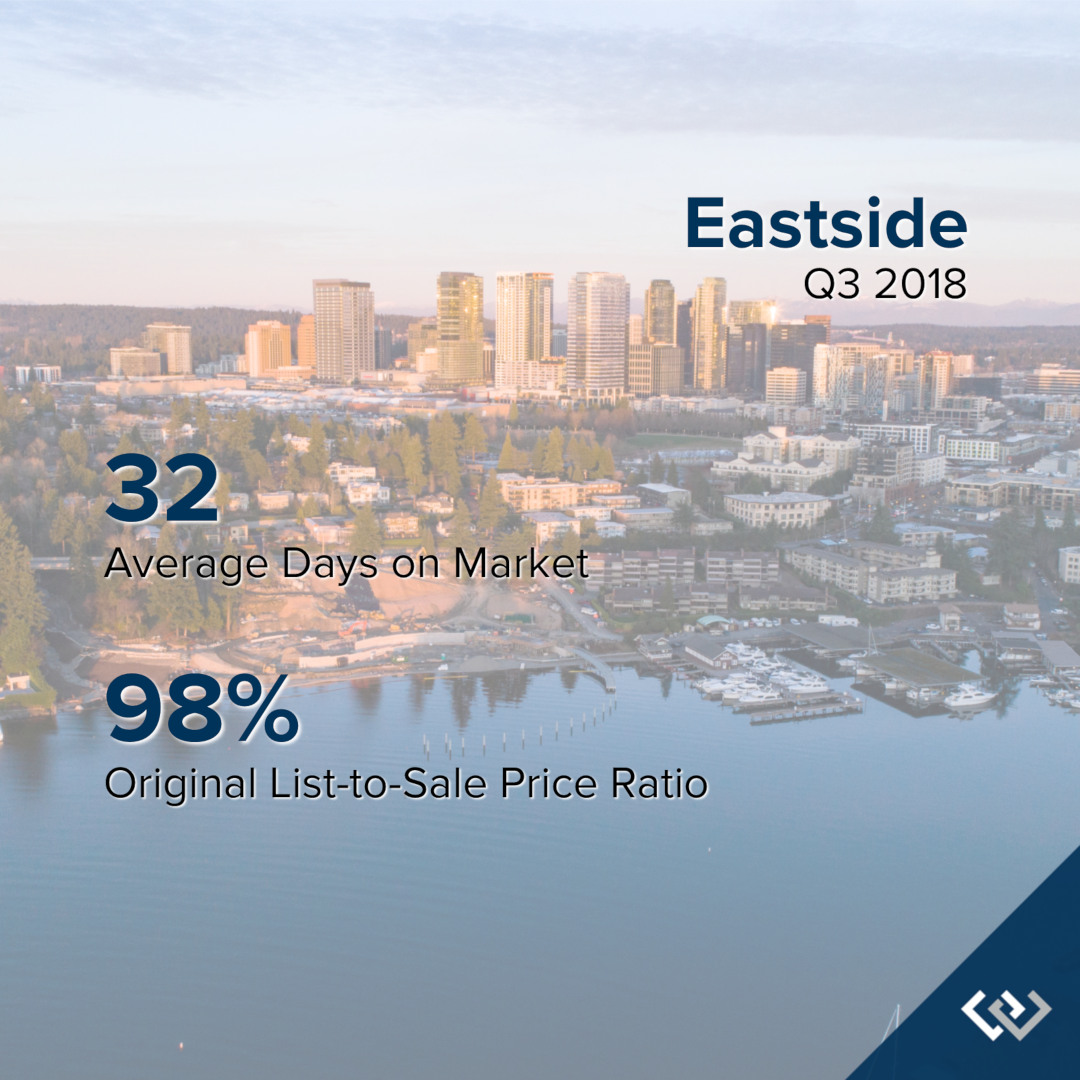
THE EASTSIDE: In September, the average days on market landed at 32 days and the original list-to-sale price ratio 98%. Since May, inventory growth has been noticeable, and has given buyers more options. This has led to more negotiations and fewer bidding wars, which is tempering month-over-month price growth to a more sustainable level.
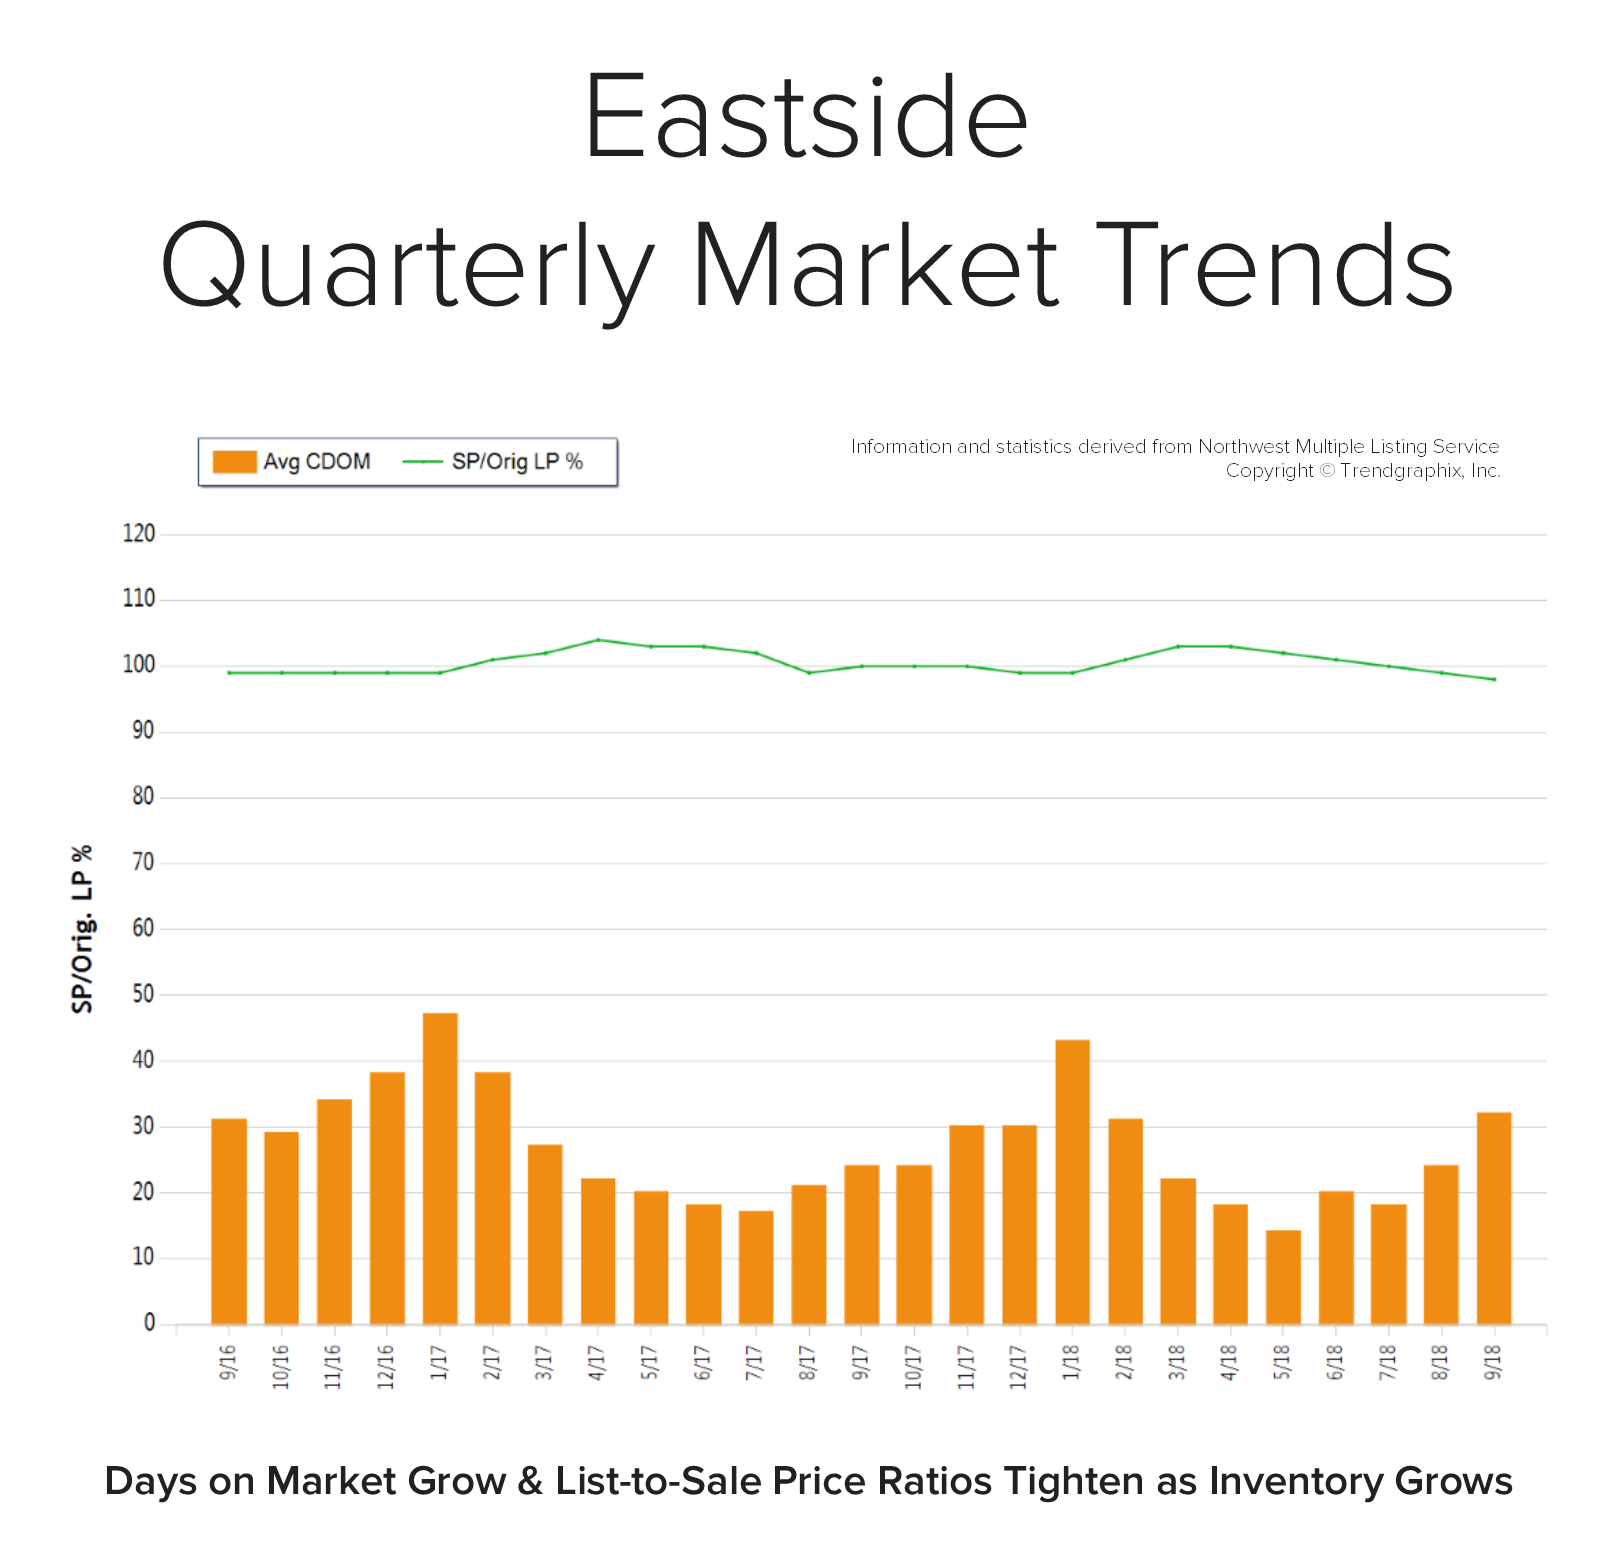 Back in April, the average days on market was 13 days and the original list-to-sale price ratio 103%; but months of inventory based on pending sales was 0.8 months, compared to 2.9 months currently. Year-over-year, prices are up 10%, still well above the historical norm of 3%-5% year-over-year gains—but note that the majority of this growth happened during the spring, due to constricted inventory levels.
Supply has increased, creating more options for buyers and helping to buffer affordability issues. Many sellers are deciding to make moves and cash in on the equity gained over the last six years. An average original list-to-sale price ratio of 98% is a positive return, yet illustrates a softening in the market after some very extreme times. With 10% price growth over the last 12-months in a seller’s favor, the increase in selection has led to more nimble moves from one house to another. Where sellers need to be careful is anticipating the month-over-month price growth we saw prior to the shift in inventory. Prospective buyers would be smart to take advantage of today’s historically low interest rates and the added inventory selection.
This is only a snapshot of the trends on the Eastside; please contact us if you would like further explanation of how the latest trends relate to you.
Quarterly Reports: Q3 North Snohomish
Q3: July 1 – September 30, 2018
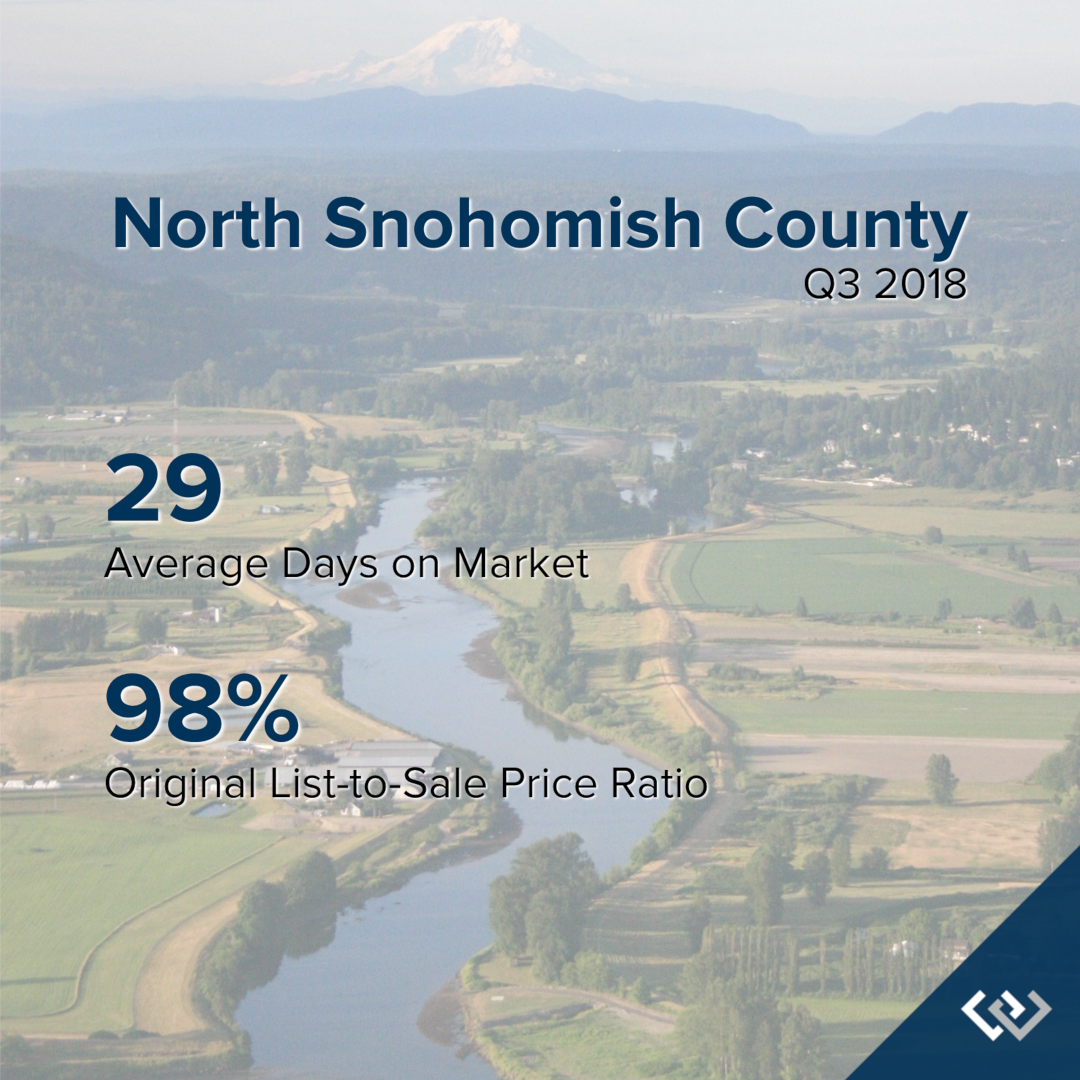
NORTH SNOHOMISH COUNTY: In September, the average days on market landed at 29 days and the original list-to-sale price ratio at 98%. Since May, inventory growth has been noticeable, and has given buyers more options. This has led to more negotiations and fewer bidding wars, which is tempering month-over-month price growth to a more sustainable level.
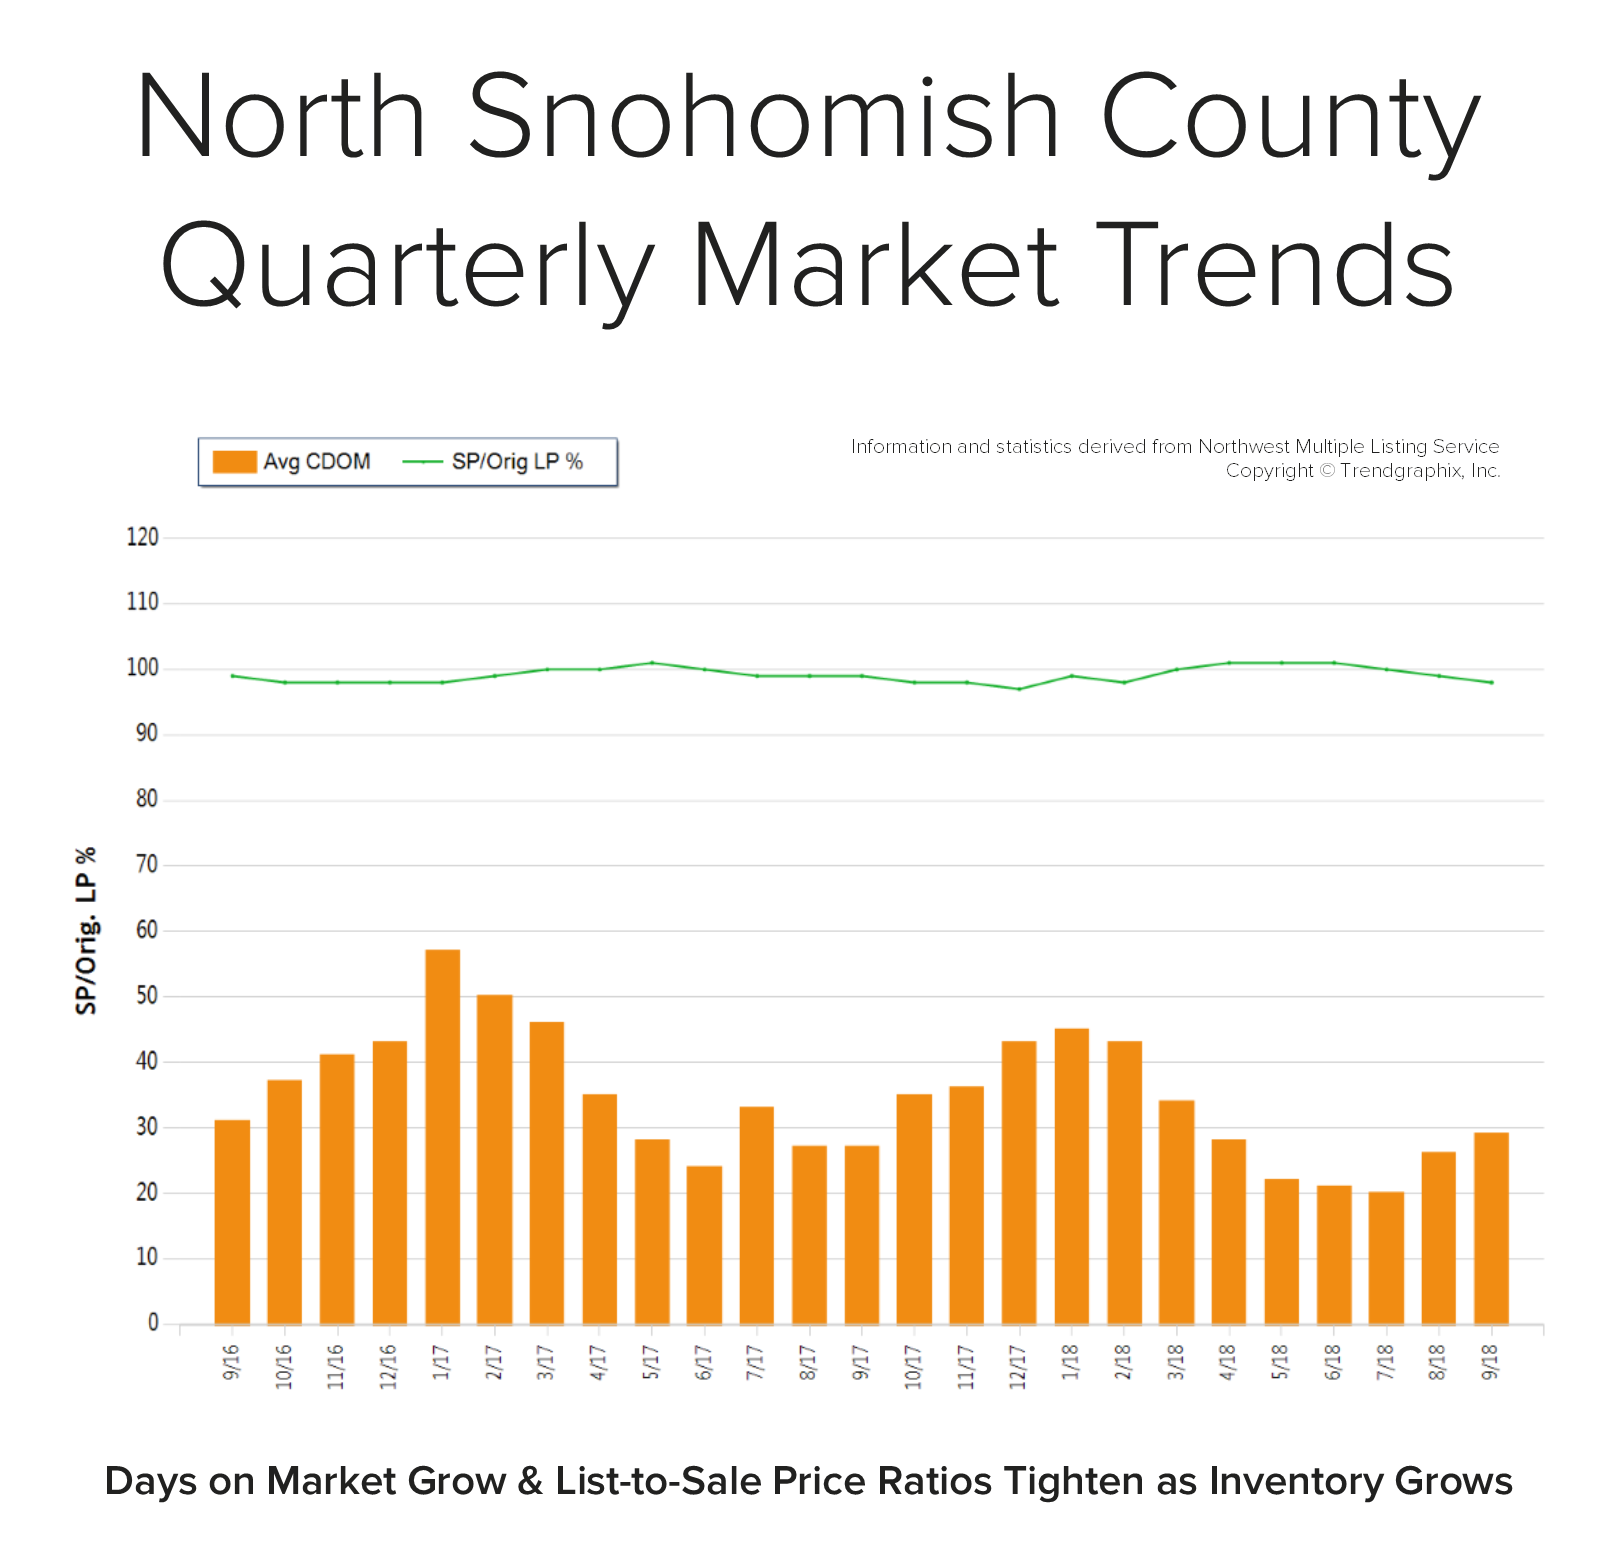 Back in May, the average days on market was 22 days and the original list-to-sale price ratio 101%; but months of inventory based on pending sales was 1 month compared to 2.3 months currently. Year-over-year, prices are up 11%, still well above the historical norm of 3%-5% year-over-year gains—but note that the majority of this growth happened during the spring, due to constricted inventory levels.
Supply has increased, creating more options for buyers and helping to buffer affordability issues. Many sellers are deciding to make moves and cash in on the equity gained over the last six years. An average original list-to-sale price ratio of 98% is a positive return, yet illustrates a softening in the market after some very extreme times. With 11% price growth over the last 12-months in a seller’s favor, the increase in selection has led to more nimble moves from one house to another. Where sellers need to be careful is anticipating the month-over-month price growth we saw prior to the shift in inventory. Prospective buyers would be smart to take advantage of today’s historically low interest rates and the added inventory selection.
This is only a snapshot of the trends in north Snohomish County; please contact me if you would like further explanation of how the latest trends relate to you.
Quarterly Reports: Q3 South King County
Q3: July 1 – September 30, 2018
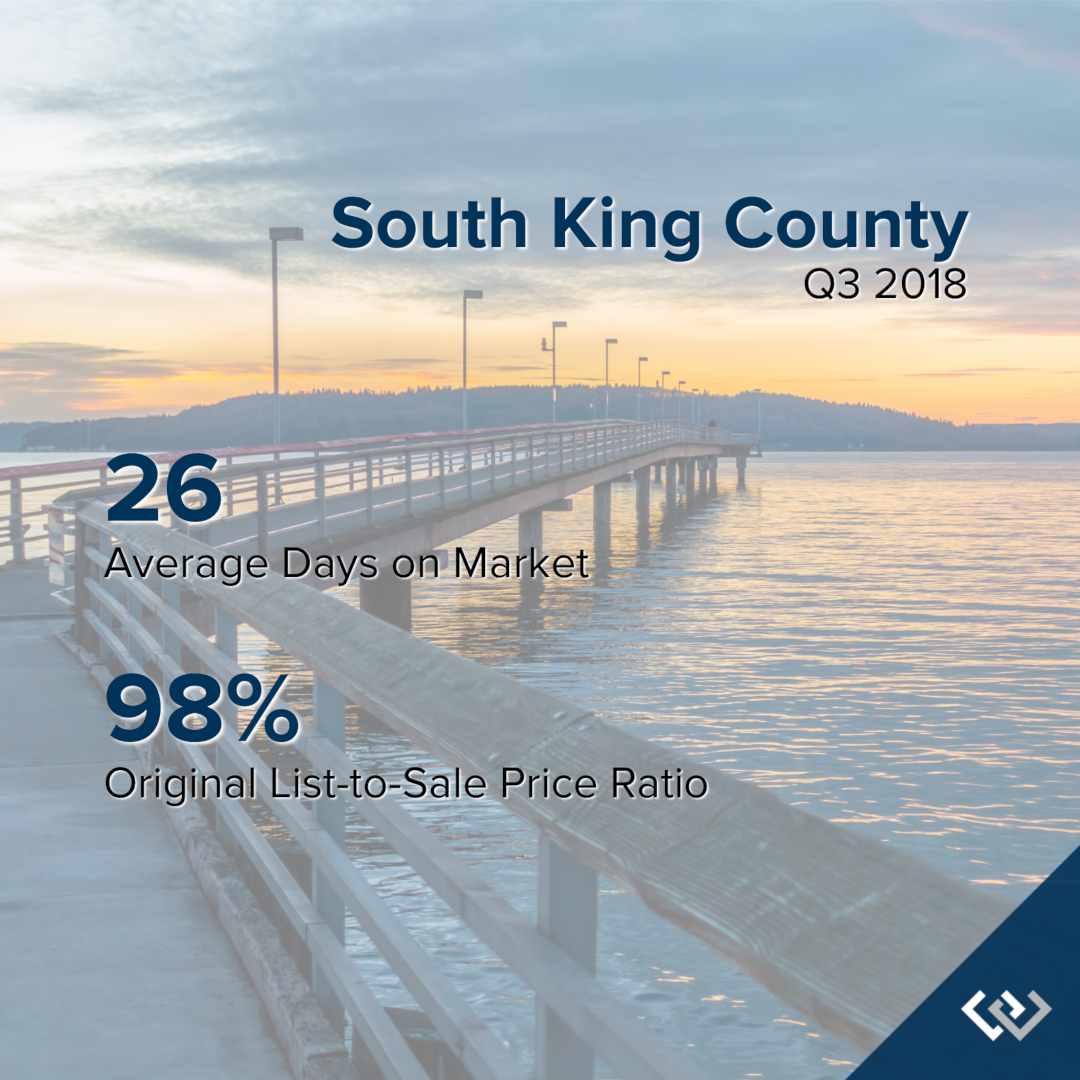
SOUTH KING COUNTY: In September, the average days on market landed at 26 days and the original list-to-sale price ratio 98%. Since May, inventory growth has been noticeable, and has given buyers more options. This has led to more negotiations and fewer bidding wars, which is tempering month-over-month price growth to a more sustainable level.
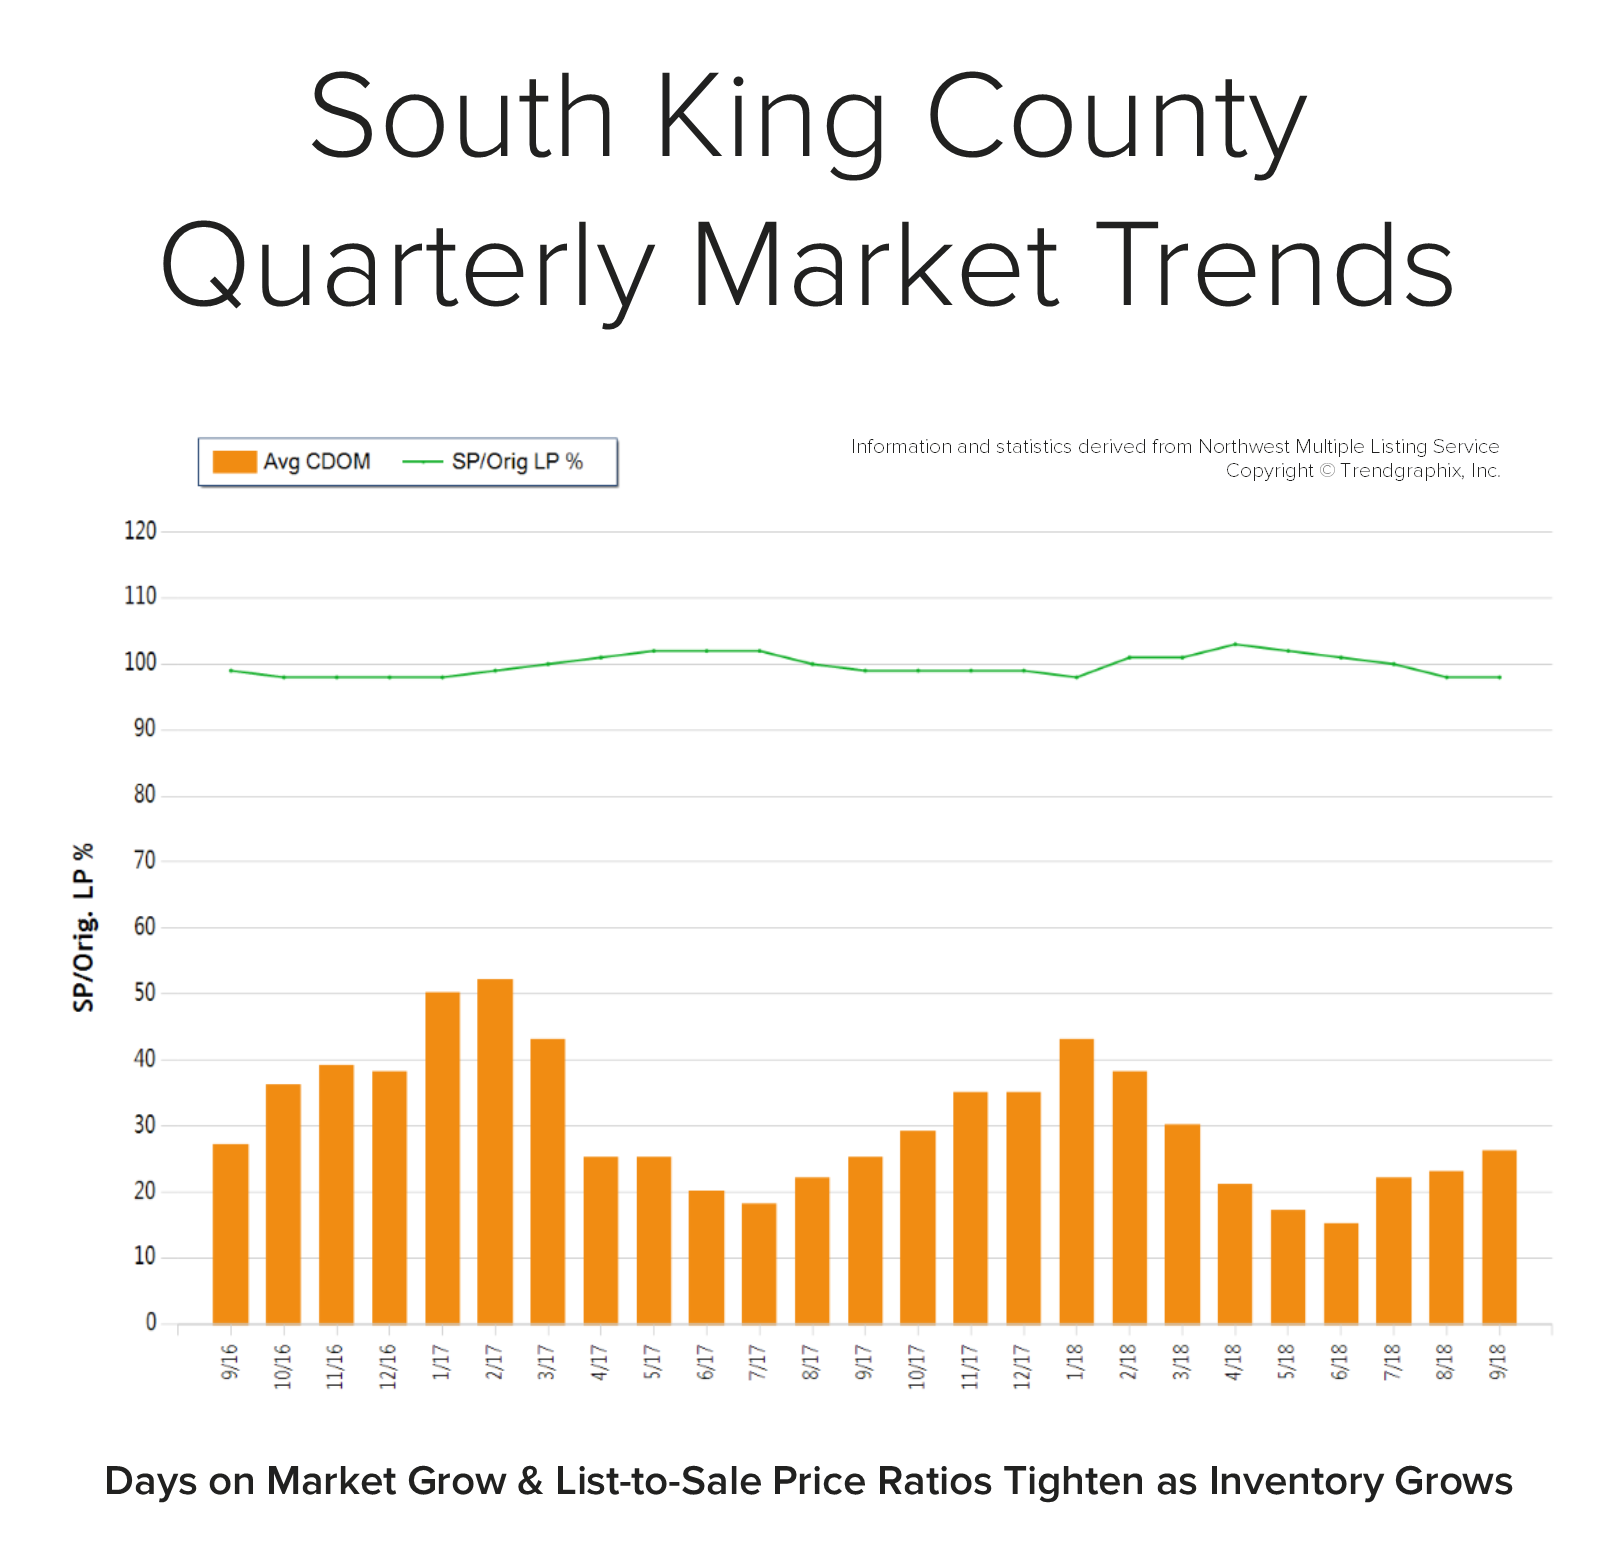 Back in April, the average days on market was 21 days and the original list-to-sale price ratio 103%; but months of inventory based on pending sales was 0.9 months, compared to 2.6 months currently. Year-over-year, prices are up 10%, still well above the historical norm of 3%-5% year-over-year gains—but note that the majority of this growth happened during the spring, due to constricted inventory levels.
Supply has increased, creating more options for buyers and helping to buffer affordability issues. Many sellers are deciding to make moves and cash in on the equity gained over the last six years. An average original list-to-sale price ratio of 98% is a positive return, yet illustrates a softening in the market after some very extreme times. With 10% price growth over the last 12-months in a seller’s favor, the increase in selection has led to more nimble moves from one house to another. Where sellers need to be careful is anticipating the month-over-month price growth we saw prior to the shift in inventory. Prospective buyers would be smart to take advantage of today’s historically low interest rates and the added inventory selection.
This is only a snapshot of the trends in south King County; please contact us if you would like further explanation of how the latest trends relate to you.
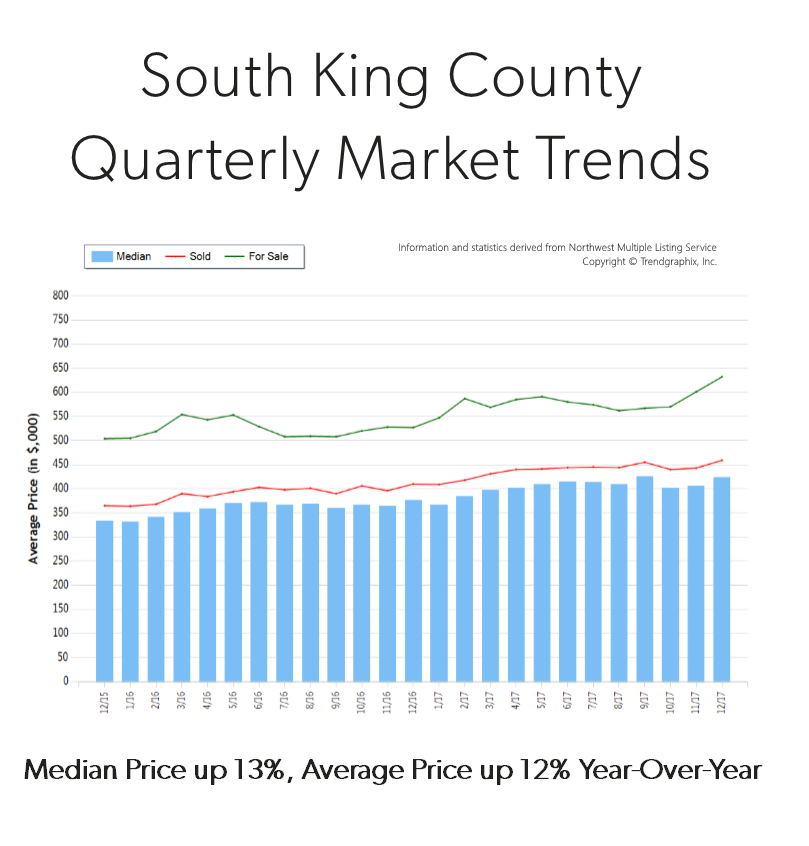
Quarterly Market Trends: South King County
 Q4 2017
 Q4 2017
Price growth was particularly strong in 2017! Median was up 13% and average price up 12% over 2016. Median price in 2017 landed at $405,000 and the average at $440,000. The average amount of days it took to sell a house in 2017 was 30 days which is 9% faster than 2016. The average list-to-sale price ratio over the last year was 100%, with the spring months as high as 102%! In 2017, inventory growth continued to be a challenge, with a 7% decrease in new listings compared to 2016. Even with inventory limitations there were 2% more sales! This phenomenon illustrates strong buyer demand and a need for more listings.
South King County real estate has seen a steady stream of buyers come our way due to affordability, reasonable commute times and quality of life. In fact, the median price in 2017 was 75% higher in Seattle Metro. Historically low interest rates continue to drive the market as well, they have helped offset the increase in prices. Sellers are enjoying great returns due to this phenomenon and buyers are securing mortgages with minor debt service.
This is only a snapshot of the trends in south King County; please contact me if you would like further explanation of how the latest trends relate to you.
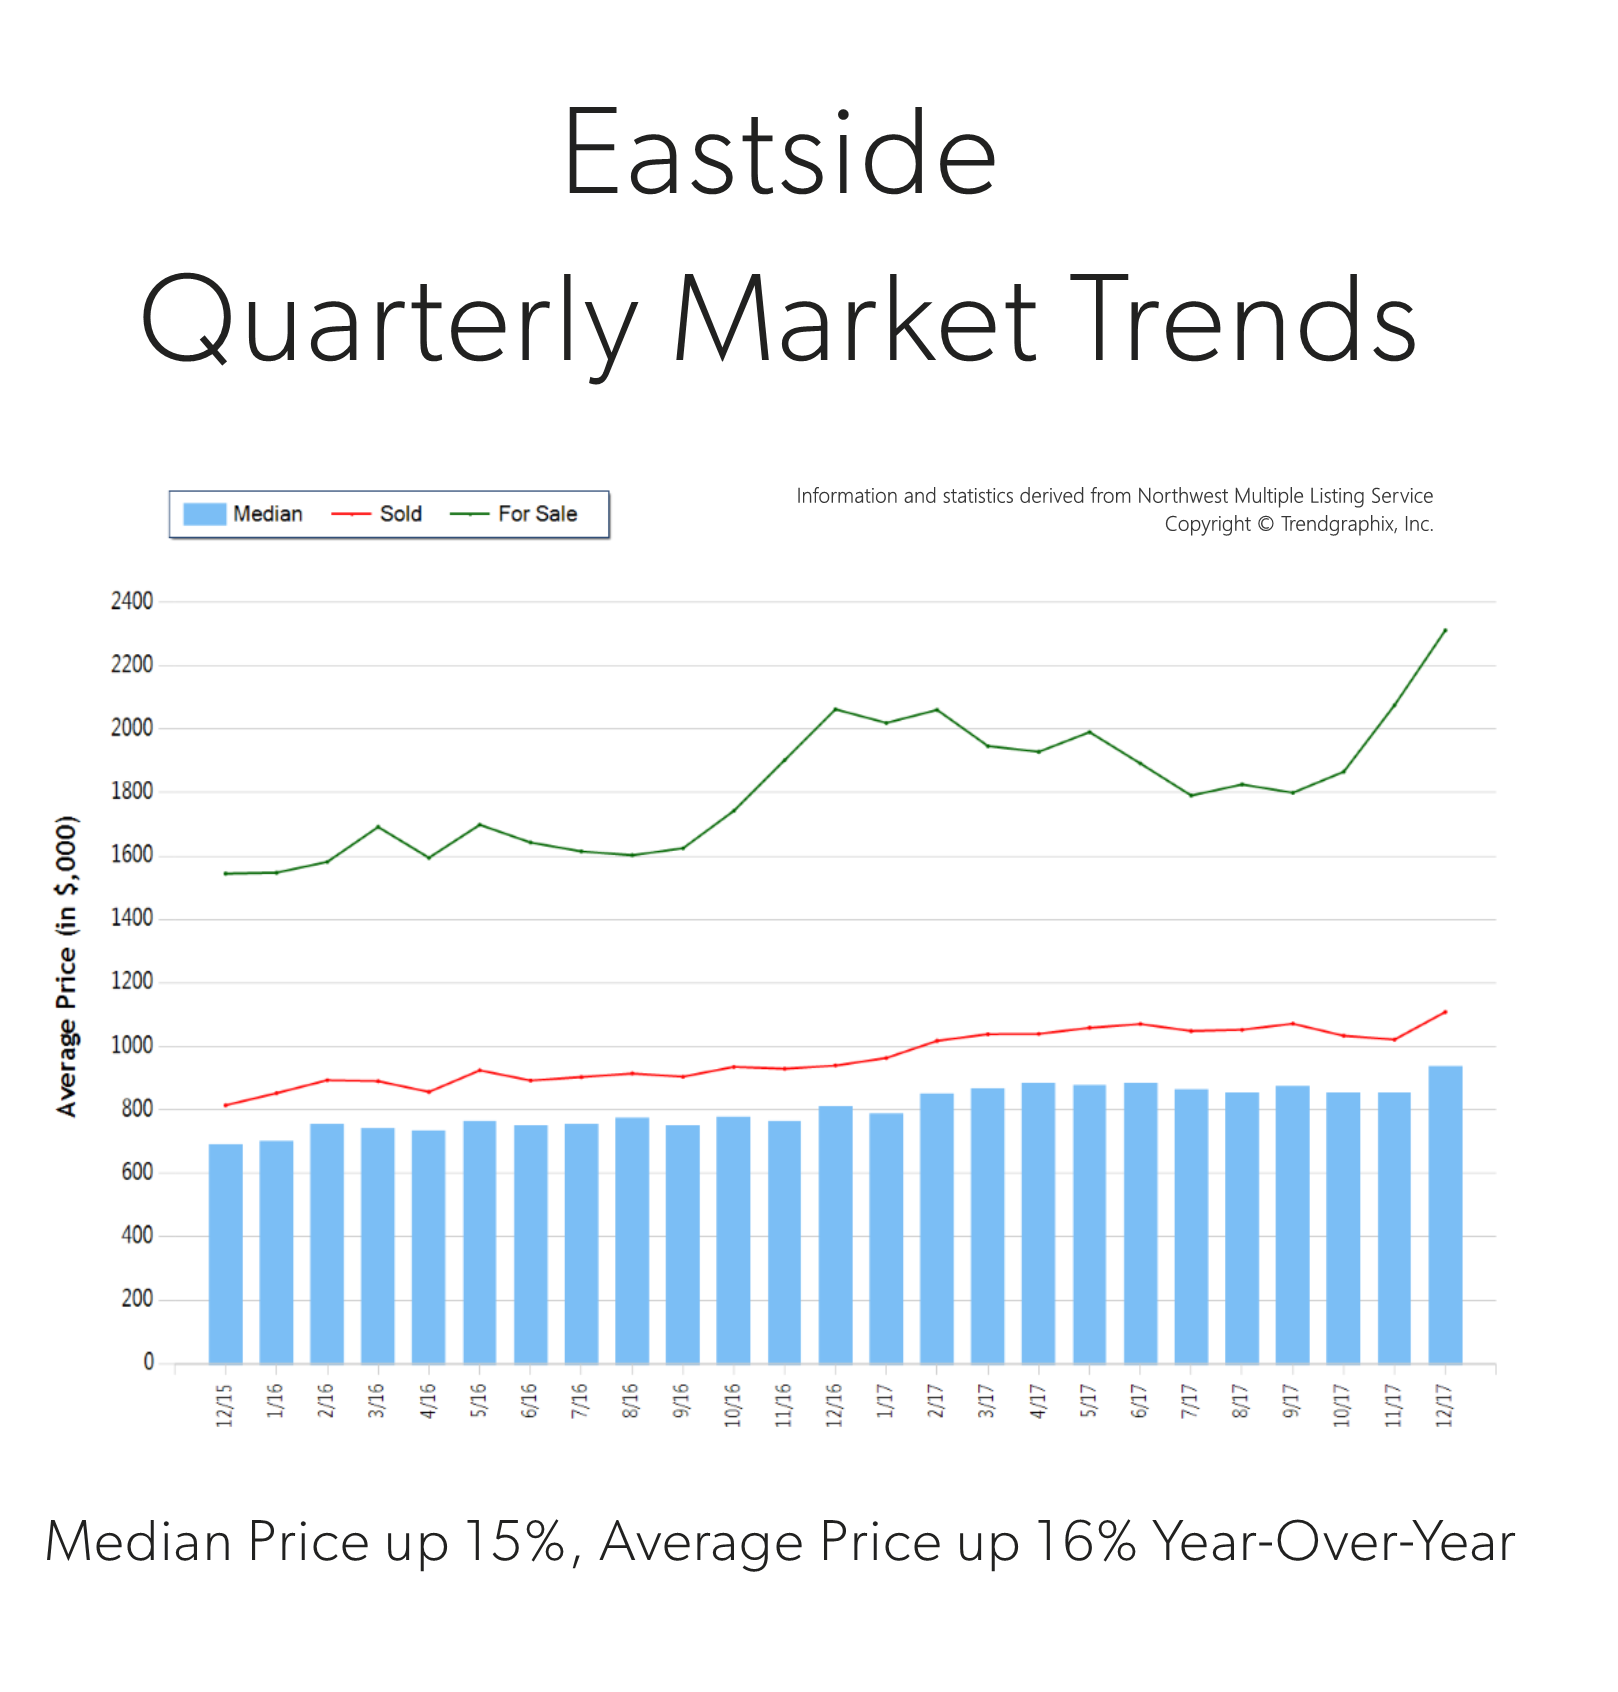
Quarterly Market Trends: Eastside
Q4 2017
 Price growth was particularly strong in 2017! Median was up 15% and average price up 16% over 2016. Median price in 2017 landed at $865,000 and the average at $1,049,000. The average amount of days it took to sell a house in 2017 was 24 days, which is 17% faster than 2016. The average list-to-sale price ratio over the last year was 101%, with the spring months as high as 103%! In 2017, inventory growth continued to be a challenge, with a 4% decrease in new listings compared to 2016. Even with inventory limitations there were a near equal amount of sales! This phenomenon illustrates strong buyer demand and a need for more listings.
Demand for Eastside real estate has grown due to close proximity to job centers, great schools and quality of life. Over the last year, the Eastside was 70% more expensive than south Snohomish County and 22% over Seattle Metro. Historically low interest rates continue to drive the market as well, they have helped offset the increase in prices. Sellers are enjoying great returns due to this phenomenon and buyers are securing mortgages with minor debt service.
This is only a snapshot of the trends on the Eastside area; please contact us if you would like further explanation of how the latest trends relate to you.
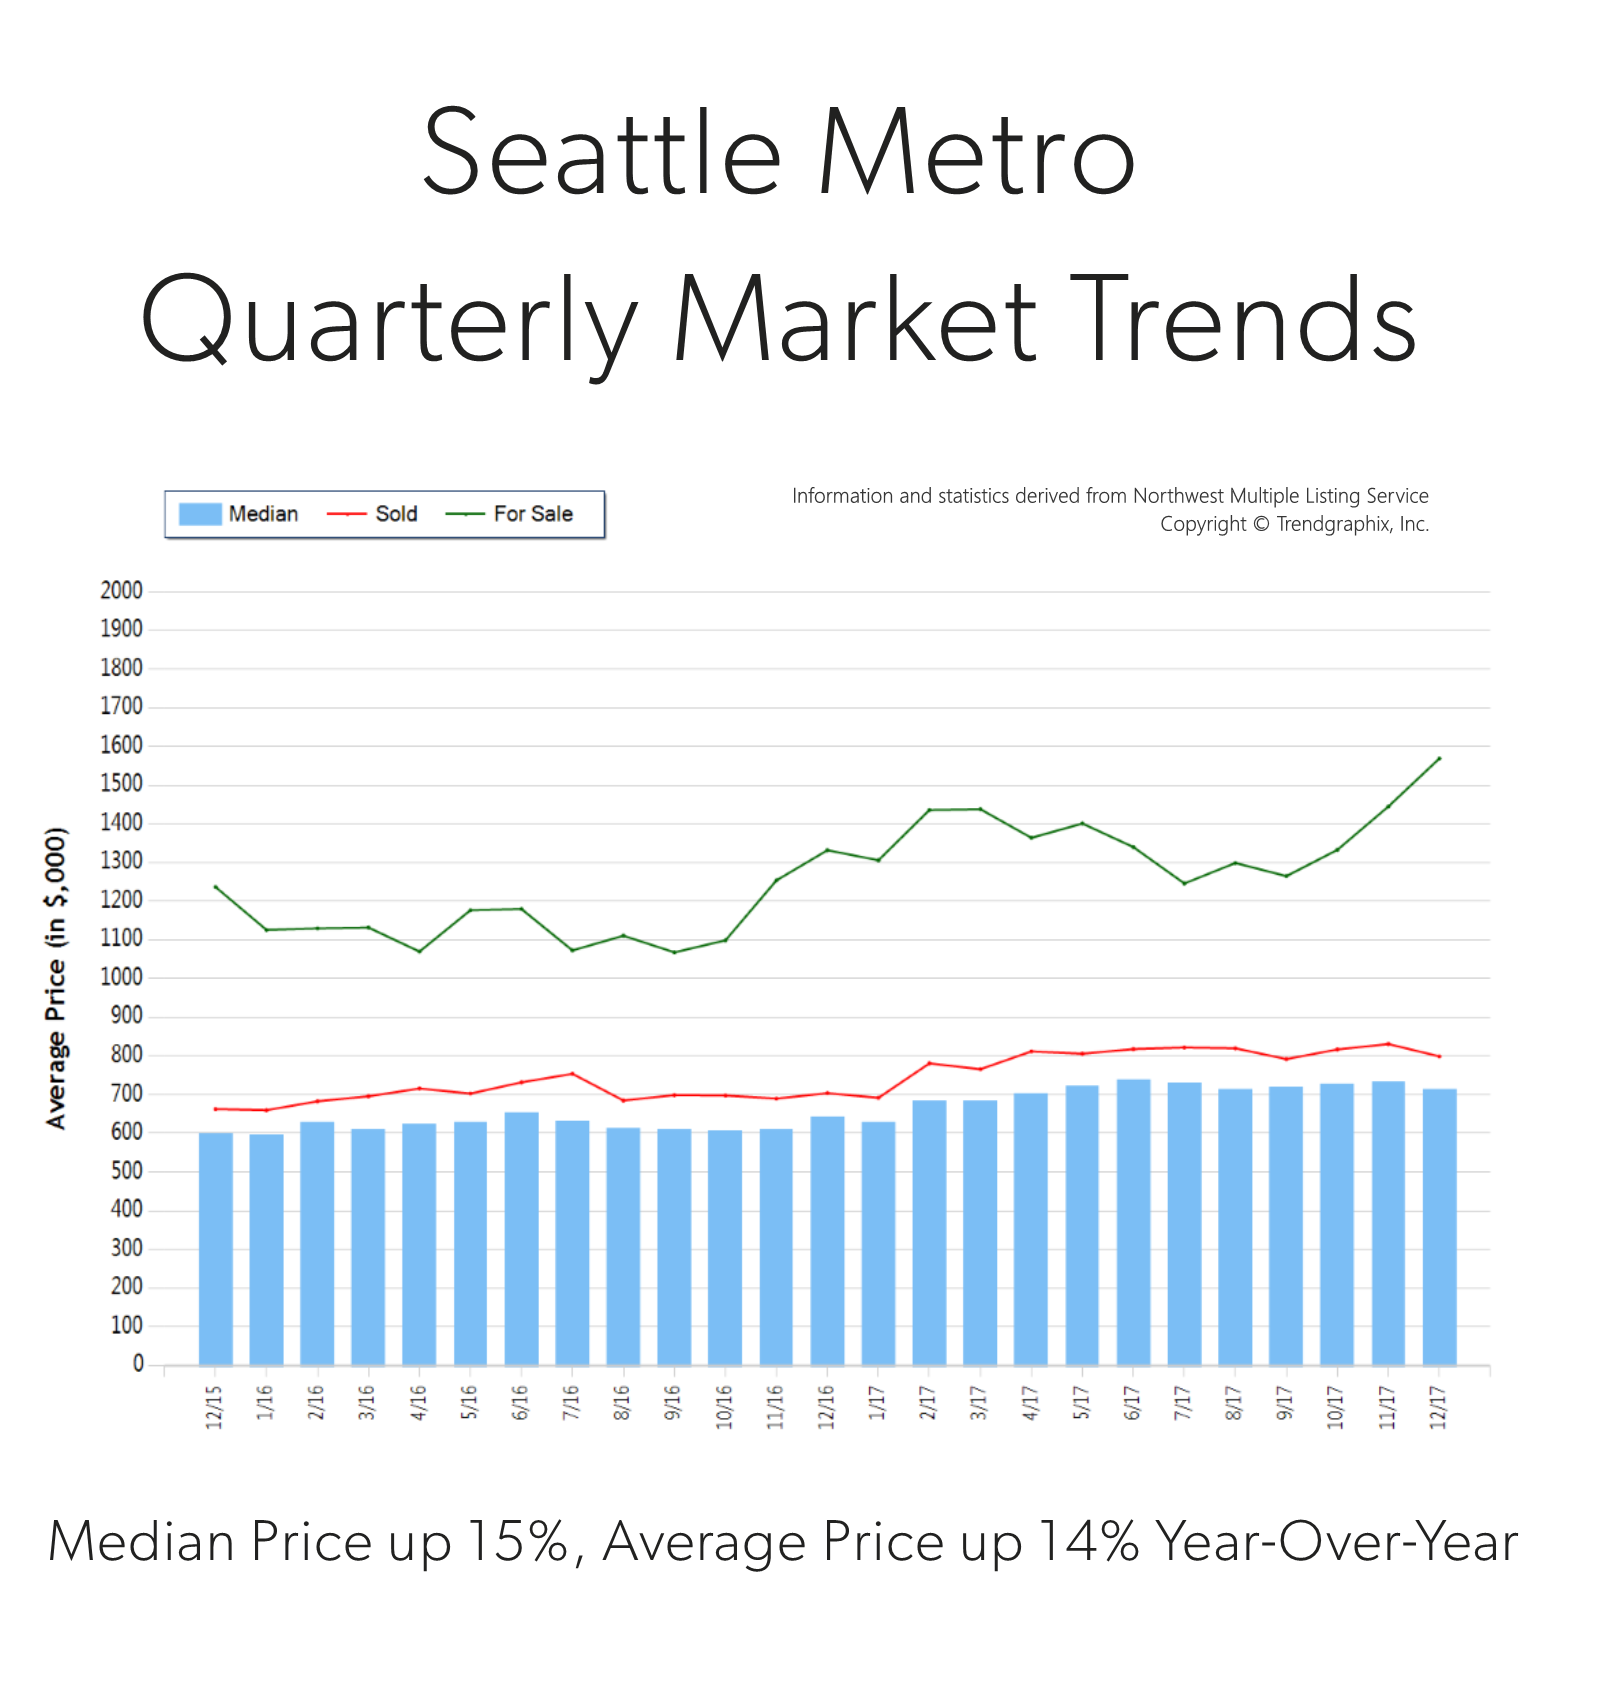
Quarterly Market Trends: Seattle Metro
Q4 2017
 Price growth was particularly strong in 2017! Median was up 15% and average price up 14% over 2016. Median price in 2017 landed at $710,000 and the average at $801,000. The average amount of days it took to sell a house in 2017 was 18 days, which is 10% faster than 2016. The average list-to-sale price ratio over the last year was 103%, with the spring months as high as 106%! In 2017, inventory growth continued to be a challenge, with a 3% decrease in new listings compared to 2016. Even with inventory limitations there were 4% more sales! This phenomenon illustrates strong buyer demand and a need for more listings.
Demand for Seattle Metro area real estate has grown due to close proximity to job centers. Over the last year, Seattle Metro was 40% more expensive than south Snohomish County and 75% over south King County. Historically low interest rates continue to drive the market as well, they have helped offset the increase in prices. Sellers are enjoying great returns due to this phenomenon and buyers are securing mortgages with minor debt service.
This is only a snapshot of the trends in the Seattle Metro area; please contact us if you would like further explanation of how the latest trends relate to you.
Quarterly Market Trends: North King County

Q4 2017
 Price growth was particularly strong in 2017! Median and average prices were up 14% over 2016. Median price in 2017 landed at $715,000 and the average at $787,000. The average amount of days it took to sell a house in 2017 was 17 days, which is 19% faster than 2016. The average list-to-sale price ratio over the last year was 104%, with the spring months as high as 107%! In 2017, inventory growth continued to be a challenge, with a 4% decrease in new listings compared to 2016. Even with inventory limitations there were a near equal amount sales! This phenomenon illustrates strong buyer demand and a need for more listings.
Demand for north King County real estate has grown due to close proximity to job centers while maintaining a neighborhood feel. Over the last year, north King County was 41% more expensive than south Snohomish County and 77% over south King County. Historically low interest rates continue to drive the market as well, they have helped offset the increase in prices. Sellers are enjoying great returns due to this phenomenon and buyers are securing mortgages with minor debt service.
This is only a snapshot of the trends in north King County; please contact us if you would like further explanation of how the latest trends relate to you.
