
 Facebook
 X
X
 Pinterest
 Copy Link
You Don’t Need Tulips for a Strong Home Sale
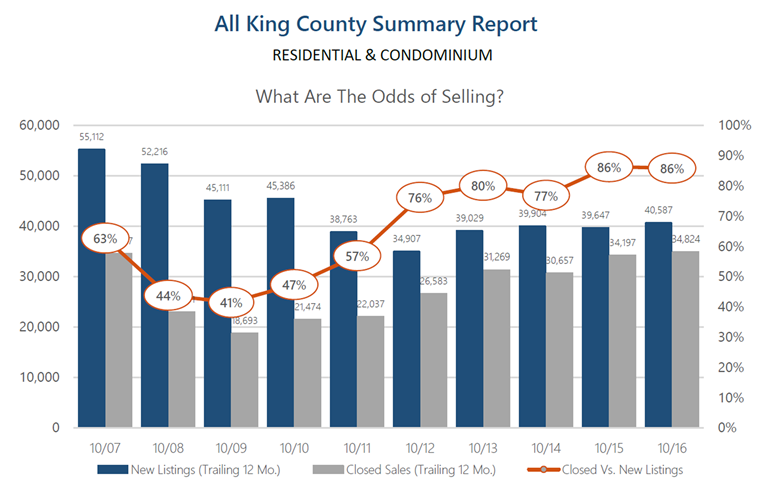
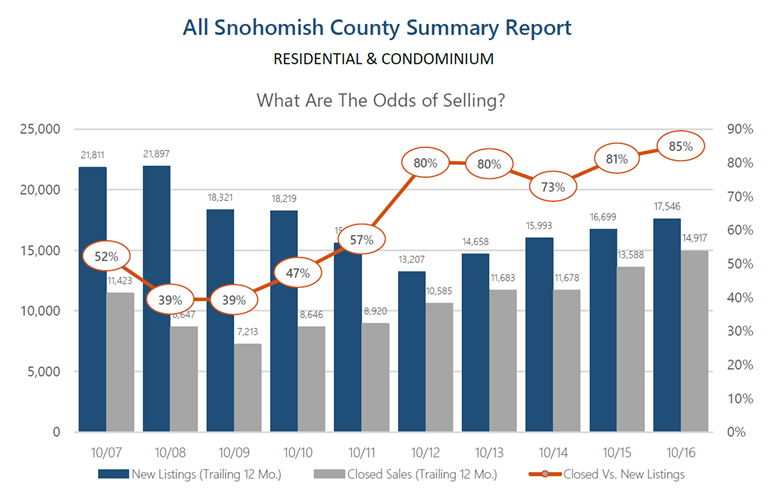 These graphs (click to view larger) above provide a 10-year history of the odds of selling in the month of October for both King and Snohomish Counties. As you can see, the odds of selling are at a 10-year high, hitting 86% in King and 85% in Snohomish. These are quite favorable odds for sellers and indicate what one might expect moving toward 2017.
Buyer demand remains very strong! In fact, pending sales reached peak levels in May of this year and continued with steady momentum throughout the summer and fall. Every month this year recorded a higher pending level than the same month the previous year. This illustrates strong buyer demand and is coupled with lower inventory levels than the year before. This combination has created very low months of available inventory, and we anticipate this continuing as we complete 2016 and head into 2017. For a potential seller, this means the market is in your favor, and waiting until the tulips bloom in April might have you lined up against more competition. Historically, we see inventory peak April through June, however pending sales have closely matched supply all throughout the year. With that said, one might consider bringing their home to market in the first quarter of the year versus the second, because they will have less competition, but still enjoy an engaged buyer audience.
Most recently we have seen interest rates bump up a bit, and this has created more urgency in the market. While still historically low, buyers are smart enough to know that cheap money is a huge long-term savings. Paying attention to all of these market factors will empower one to make the best real estate decisions. Please reach out if you are considering a move over the next year, and I’d be happy to apply this research and weigh in on your options.
Affordability: Commute Times & Interest Rates
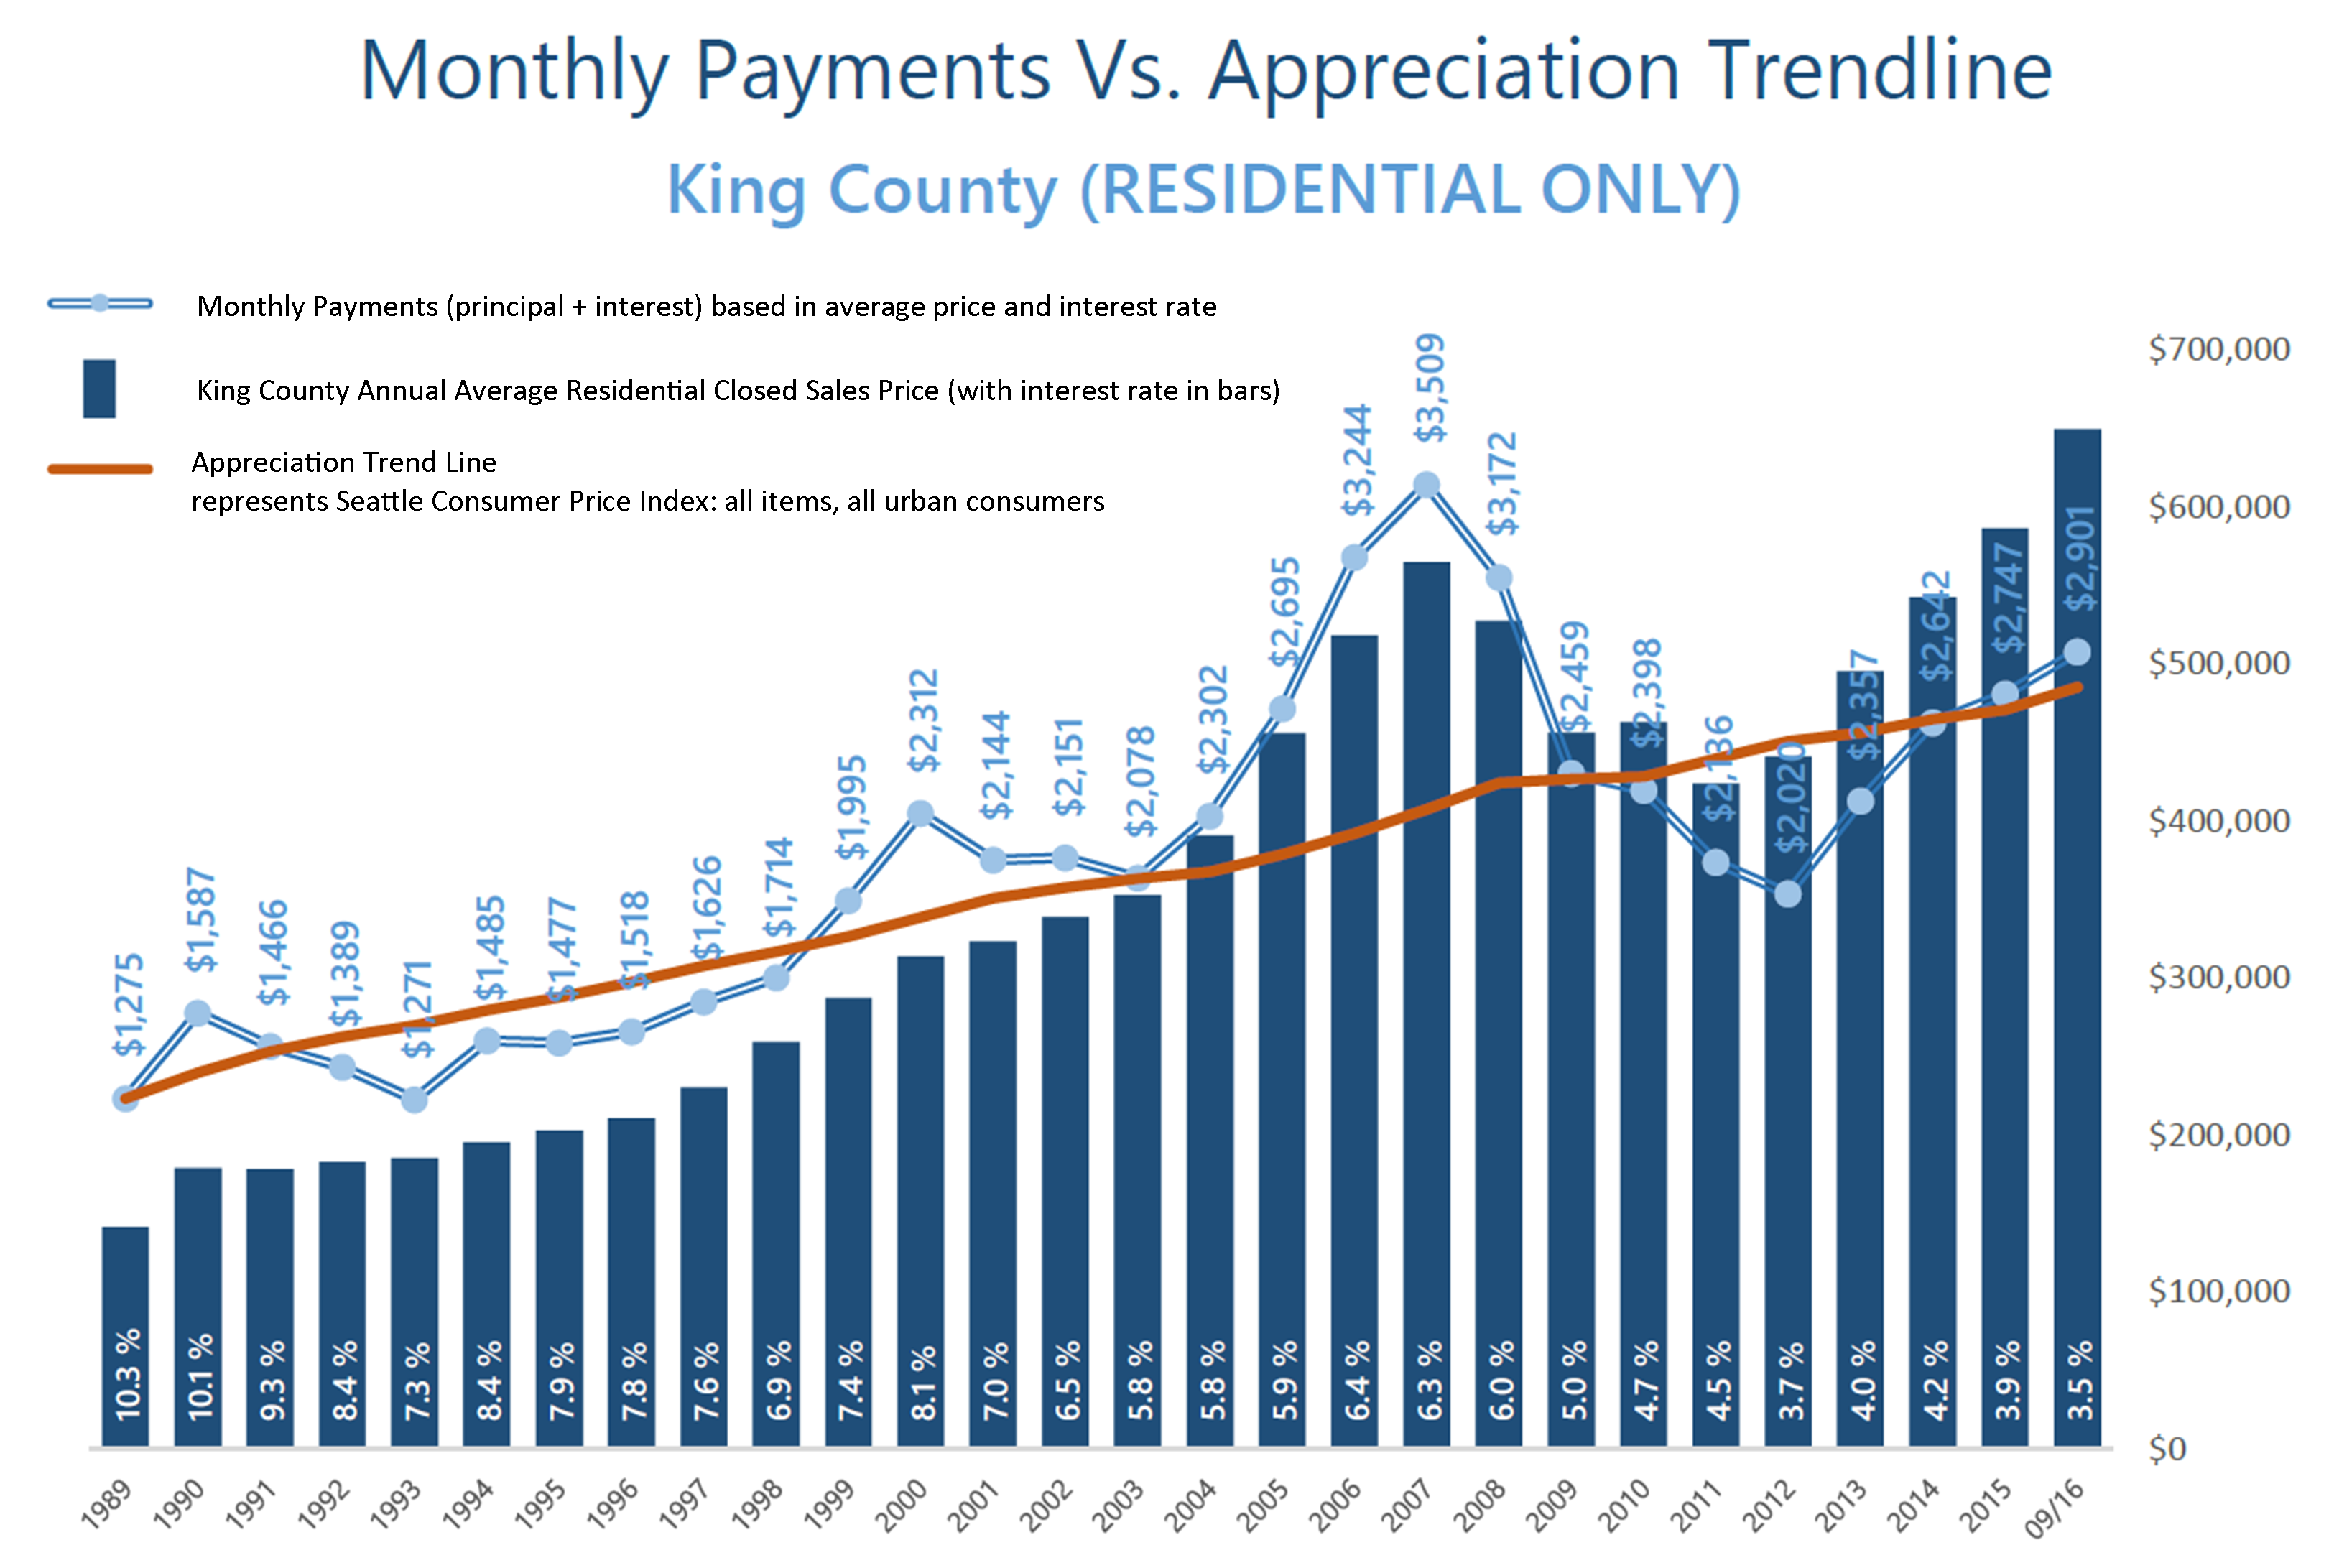
 These graphs illustrate the brass tacks of affordability between King and Snohomish Counties, measured by the average monthly payment. Most recently in September, the average monthly payment was 35% higher in King County compared to Snohomish County. What is fascinating, though, is comparing today’s average monthly payment to peak monthly payments back in 2007! In King County, monthly payments are currently 21% less than during the peak, and in Snohomish County, 36% less. That is a lot of saved monthly overhead. Note that this has everything to do with today’s historical interest rates, as average prices are higher now than in 2007. When one buys or refinances a house, they are not only securing the property, but securing the rate for the life of the loan.
Close proximity to the work place and affordability is often near the top of a buyer’s list of preferred features. 2016 has continued to be a year when commute times to major job centers widened the price divide between key market areas in the greater Seattle area. Over the last 12 months, the average sales price for a single-family residential home in the Seattle Metro area was $696,000! In south Snohomish County (Everett to the King County line), the average sales price for a single-family residential home was $471,000 – 48% less than Seattle Metro. Further, if you jump across Lake Washington to the Eastside, the average sales price for a single-family residential home was $881,000 – 27% more than Seattle Metro!
The “drive to qualify” mentality has been proven by the pending sales rate in south Snohomish County over the last 12 months. Pending sales are up 7% complete year-over-year, whereas in Seattle Metro pending sales are down 1%, and down 2% on the Eastside. We believe this is a result of affordability, more inventory choices in south Snohomish County, new construction options, lower taxes, strong school district choices, and manageable commute times. Newer transit centers and telecommuting have also opened up doors to King County’s little brother to the north as well. If you are curious about possible commute times, you can search for properties on our website based on commutes times, which is a feature provided by INRIX Drive Time. Also, we track the market in several ways, so if the graphs here are interesting to you, any of our agents would be happy to provide additional information relative to your specific neighborhood. Please contact us anytime, as it is our goal to help keep you informed and empower you to make strong real estate decisions.
Interest Rates and Your Bottom Line
 Wow, just wow! The interest rate levels that we have experienced in 2016 are seriously unbelievable. Currently we are hanging around 3.5% for a 30-year fixed conventional mortgage, almost a half a point down from a year ago. This is meaningful because the rule of thumb is that for every one-point increase in interest rate a buyer loses ten percent in buyer power. For example, if a buyer is shopping for a $500,000 home and the rate increases by a point during their search, in order to keep the same monthly payment the buyer would need to decrease their purchase price to $450,000. Conversely, for every decrease in interest rate, a buyer can increase their purchase price and keep the same monthly mortgage payment.
Why is this important to pay attention to? Affordability! If you take the scenario I just described and apply it to the graph on the right, you can see that the folks who jumped into the market this year enjoyed an interest cost savings when securing their mortgage. This cost savings is doubly important because we are in a price appreciating market. In fact, the median price in King County has increased by 13% complete year-over-year and 10% in Snohomish County. Interest rates are helping to keep payments more manageable in our appreciating market. Most recently we have started to see a slight increase in inventory compared to the spring/summer market, which is a plus for buyers and something to be taken advantage of.
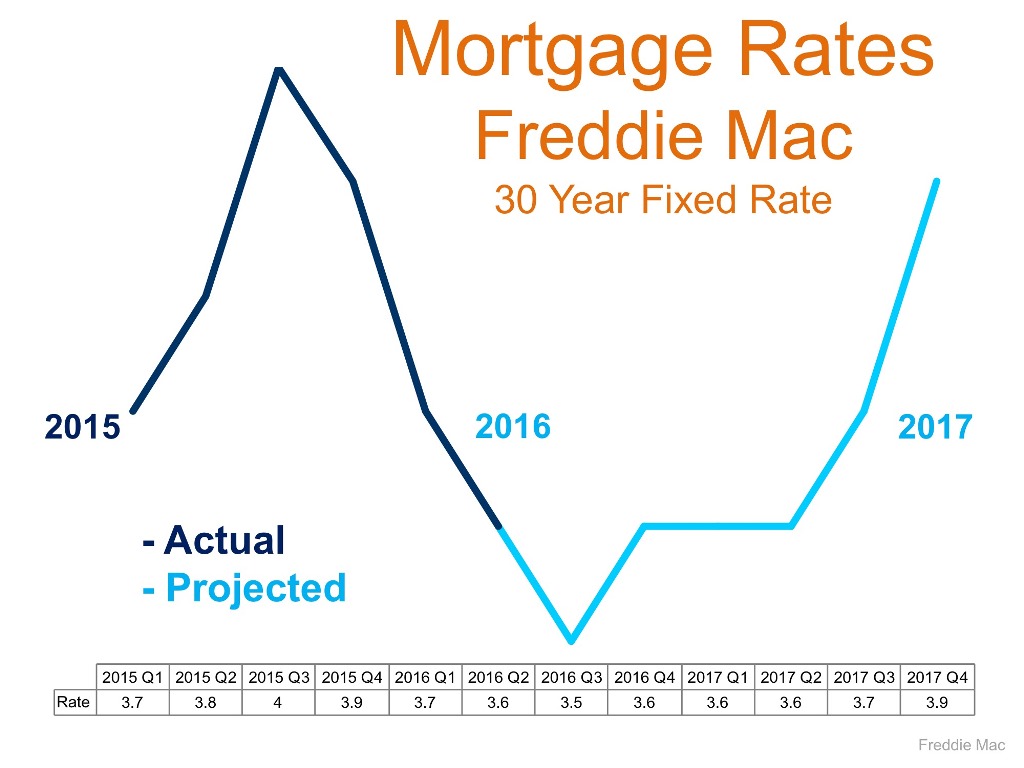
Will these rates last forever? Simply put, no! The graph above provided by Freddie Mac shows a prediction for rates to start rising. While still staying well below the 30-year average of 7.65%, increases are increases, and securing these rates could be downright historical. Just like the 1980’s when folks were securing mortgages at 18%, the people that lock down on a rate from today will be telling these stories to their grandchildren. Another factor to consider is that it is an election year, and rates historically remain level during these times. What 2017 and beyond hold for rates will likely not mirror these historical lows under 4%. Note the 30-year average – one must think that rates closer to that must be in our future at some point.
So what does this mean for you? If you have considered making a move, or even your first purchase, today’s rates are a huge plus in helping make that transition more affordable. If you are a seller, bear in mind that today’s interest rate market is creating strong buyer demand, providing a healthy buyer pool for your home. As a homeowner who has no intention to make a move, now might be the time to consider a refinance. What is so exciting about these refinances, is that it is not only possible to reduce your monthly payment, but also your term, depending on which rate you would be coming down from.
If you would like additional information on how today’s historical interest rates pertain to your housing goals, please contact any of our agents. We would be happy to educate you on homes that are available, do a market analysis on your current home, and/or put you in touch with a reputable mortgage professional to help you crunch numbers. Real estate success is rooted in being accurately informed, and it is our goal to help empower you to make sound decisions for you and your family.
Many Factors to Consider When Choosing to Rent vs. Own
*The amount of time you need to own your home in order for owning to be a superior financial decision.
There has been a lot of talk lately about the cost of living in the Greater Seattle area. Whether it has to do with home prices or rental rates the story is the same: it is becoming more and more expensive by the month. With rising rental rates, historically low interest rates, and home prices on the rise, the advantage of buying vs. renting has become clear for folks that have a down payment saved, good debt to income ratios and strong credit. In fact, Seattle is now the 10th most expensive city to rent in the country according to a new study from Zumper.com. The average monthly rental price for a one-bedroom apartment in the city of Seattle is $1,740! Snohomish County has seen an increase in apartment growth and rising rental rates as well. Currently, the breakeven horizon in the Greater Seattle area (the amount of time you need to own your home in order for owning to be a superior financial decision versus renting) is 1.6 years according to Zillow research.
There are several factors to consider that will lead you to make the best decision for your lifestyle and your financial bottom line. One of the biggest factors is interest rates! Currently, the rate for a 30-year fixed, conventional, conforming loan is hovering around 3.5%. That is amazingly and historically low, making the advantage of securing a mortgage huge. What is nice about having a mortgage is that the payment stays the same over the term of the loan. With renting, rates can be increased at any time, and you are paying down someone else's asset, not your own. Owning gives the homeowner control over their overhead while getting to make their house their home. What is also so great about owning is that once you have hit the breakeven horizon, every month that ticks away thereafter is building your nest egg in value. Did you know that American homeowners’ net worth is 36 times the amount of renters? The long term benefits of owning are abundant. These are important factors to consider for everyone, but especially the younger folks that are enjoying the benefits of Seattle’s attractive job market and competitive wages.
Where folks are having to compromise most due to affordability is commute times and settling in less urban neighborhoods. Some people, mainly millennials, have not been willing to give up living in the more core urban neighborhoods that have high walk scores and shorter commute times. That should be apt to change as rents are rising fastest in those areas. The advantages of moving out a little further and securing a home will start people on the track of building long term wealth. If you or anyone you know is currently renting and is considering a change, please let us know, as we would be happy to get your questions answered to help you make an informed decision.
Looking Towards the 2016 Real Estate Market
 As we round out a very strong 2015 in the real estate market, it is time to look towards 2016 and what it may bring. After two straight years of inventory challenges, multiple offer madness and steep price appreciation, will things start to temper? Below is a list of my predictions for what 2016 might hold for the real estate market. These are fun, educated guesses based on studying the market and paying attention to important indicators. I hope you enjoy and I welcome your questions or discussions.
1. Interest Rates: They have been saying for a few years now that interest rates are going to go up, and they really haven't. Since 2012 they have ebbed as low as 3.375% and as high as 4.25%, and are currently leveled out at 4% on a 30-year fixed conventional loan. By the end of 2016, I predict that they will be just under 5%. As the economy continues to improve and consumer confidence grows, an increase in rates will be important for the health of our overall economy and the public should be able to handle this rise. Plus, we must not lose sight that the average interest rate over the last 30 years has been 6.959% and we are still WAY below that.
2. Listing Inventory: Inventory has been the biggest challenge this year, with King County hovering between one and two months of inventory and Snohomish Country hovering between two and three months of inventory in 2015. That is LOW!! There are two reasons it has been that way; we have had 21% less homes come to market in King County year-over-year, and 15% less in Snohomish County. There have also been more buyers in the market, causing demand to heavily outweigh supply. In 2016 I think we will see more homes come to market, due to the fact that as prices have appreciated, homeowners have gained much more favorable equity positions, giving them options to make the moves they've been dreaming of and waiting for. Folks are ready to upgrade their lifestyle, whether that means buying a bigger home or transitioning to a "right" size home due to retirement. Pent up seller demand due to these equity and lifestyle factors will lead to an increase in homes coming to market.
3. Buyer Demand: Buyer demand will remain strong! This is largely related to our booming job market and the expanding tech sector. Our unemployment rate is 4%, meaning jobs are more abundant than they have been in years, and wages are growing in every county. Couple this with low interest rates, and it equals a more-than-plentiful pool of buyers. One factor to look out for as we head into 2016, is if the strong buyer demand we have will quickly absorb any increase in inventory, keeping months of inventory basically the same as 2015. This will be a fun one to watch.
4. Prices: We will indeed continue to see price appreciation due to the factors above. Year-to-date, median price appreciation in King County is up 8% complete year-over-year and up 9% in Snohomish County. A year from now I anticipate price appreciation to slow to 6% in King and 5% in Snohomish, due to a bit more inventory, and meet peak levels. This is still higher than the normal 3-4% year-over-year appreciation, but it is below the double-digit appreciation we saw in 2013 and 2014, thank goodness! As we have dug out of the Great Recession's hole and regained equity levels after the fall of the sub-prime mortgage fiasco it is important to retreat back to more sustainable appreciation levels.
5. First-Time Home Buyers: The big talk of 2015 was the Millennial generation, and when they would jump into the housing market. They have started to make their play as they are getting some of those great tech sector jobs, but many are limited in purchasing due to high student loan debt. We are starting to see FICO scores loosen up a bit for this reason. Interestingly enough, the average FICO score for a denied borrower for a conventional loan was 700, and 754 for an approved borrower. Average FICO score for a FHA borrower who was denied was 635, and 687 for an approved borrower. These are important factors to pay attention to along with debt-to-income ratios. Also important to note is that rents are extremely high in the Greater Seattle area, so the cost of owning over the long term is more favorable. Once the Millennials decide that they are ready to settle down, what they are willing to have their commute look like and pay down some of that debt they will be ready to start building household wealth by buying vs. renting.
If you or anyone you know has any questions about real estate, please don't hesitate to contact any one of our agents. We are here to help!
