
 Facebook
 X
X
 Pinterest
 Copy Link
You’d Like to Sell Your Home, but Where to Next… and How?


Homeowners across our region are enjoying very healthy equity levels due to an upswing in the real estate market over the last five years. In fact, the median price in King County is up 50% over the last five years and up 47% in Snohomish County. This growth in equity has given homeowners the exciting option to sell their home for a high price and move on to their next chapter, such as a move-up, down-size or second home. This price growth is great news and provides many opportunities, however we have also faced some challenges in how to make these transitions.
Our biggest challenge in the marketplace right now is inventory levels; sometimes requiring a buyer to compete in multiple offers for their next home. Currently King County sits at 0.7 months of inventory and 0.8 in Snohomish. Historically, buyers that are also sellers would commonly secure a new home contingent on the sale of their current home. Meaning the seller of the new home they are buying would give them a month or so to get their current house sold in order to buy theirs. Well in this market, that is only rarely an option. So, the million-dollar question is this: how does one who has gained so much equity, now itching to get that bigger house, different location, or perfect rambler for settling into retirement, make this transition without having to move twice? We need to get creative and have a strategy. Two options that have recently proved to be successful, are negotiating a rent-back for sellers or using the Windermere Bridge Loan program.
First, negotiating a rent-back has become a great option for someone who needs to first sell their current home in order to buy. The way it works is we put their home on the market, price it competitively to create demand, and ask for a rent-back as one of the preferred terms. If this rent-back is successfully negotiated, then the seller closes on their home and collects their funds, but gets to stay in the house anywhere from 30-60 days. This enables the seller, who is now a buyer, to have their cash in-hand, time to find a new house, get it under contract and close the sale when their rent-back is ending. This eliminates the need to move twice. There is a bit of calculated risk in this plan, but we’ve seen it work several times, always with a plan B ready just in case. Rarely has plan B needed to be executed, and often times we’ve even been able to pay little to no rent during this time.
The second option is the Windermere Bridge Loan program. This is an amazing tool for homeowners that own their homes free and clear, or have paid down their debt quite a bit. This is a low-cost alternative to pull the equity out of one’s house prior to selling it in order to make a non-contingent offer. The way it works is we take the market value of the house the homeowner current lives in, established by a comparative market analysis completed by your Windermere agent and signed off by the Broker. We then take 65% of that value and subtract any debt owed, and that is the maximum amount the homeowner can borrow for their next down payment. They can then make a non-contingent offer on a new home. What is really great about this, is that it doesn’t require an appraisal (like a HELOC does), and these can easily be turned around in 3-5 business days. This tool provides the opportunity to quickly and inexpensively pull your equity out, be competitive, and eliminates the double move.
The fees associated with this program are a 1% loan fee on the equity that is pulled, a title report, and interest that is incurred between the loan funding and being paid off once the subject home is sold. That interest is conveniently wrapped up in the closing costs when they close the sale of their home, eliminating the need to make monthly interest payments. In a strategy that is somewhat mind blowing- we can sometimes use these bridge loans and never have to actually fund them. For example, if we secure a property non-contingent with the bridge loan and immediately get the subject home on the market, we can often secure a sale with a simultaneous closing, and never have to fund the loan. This eliminates the loan fee, interest, and the need to carry two mortgages.
If you are excited about equity levels and today’s low interest rates and have thought about making that move you’ve been waiting for, but have been fearful of how to do it all – we can help. These two options, along with great attention to detail, hand-holding, and careful planning have helped many people make these exciting transitions. It is our goal to help keep our clients informed and empower strong decisions. Please contact any one of our agents if you would like further information on how this might work for you or someone you know.
Demand is High, Inventory Low… Here we Go!
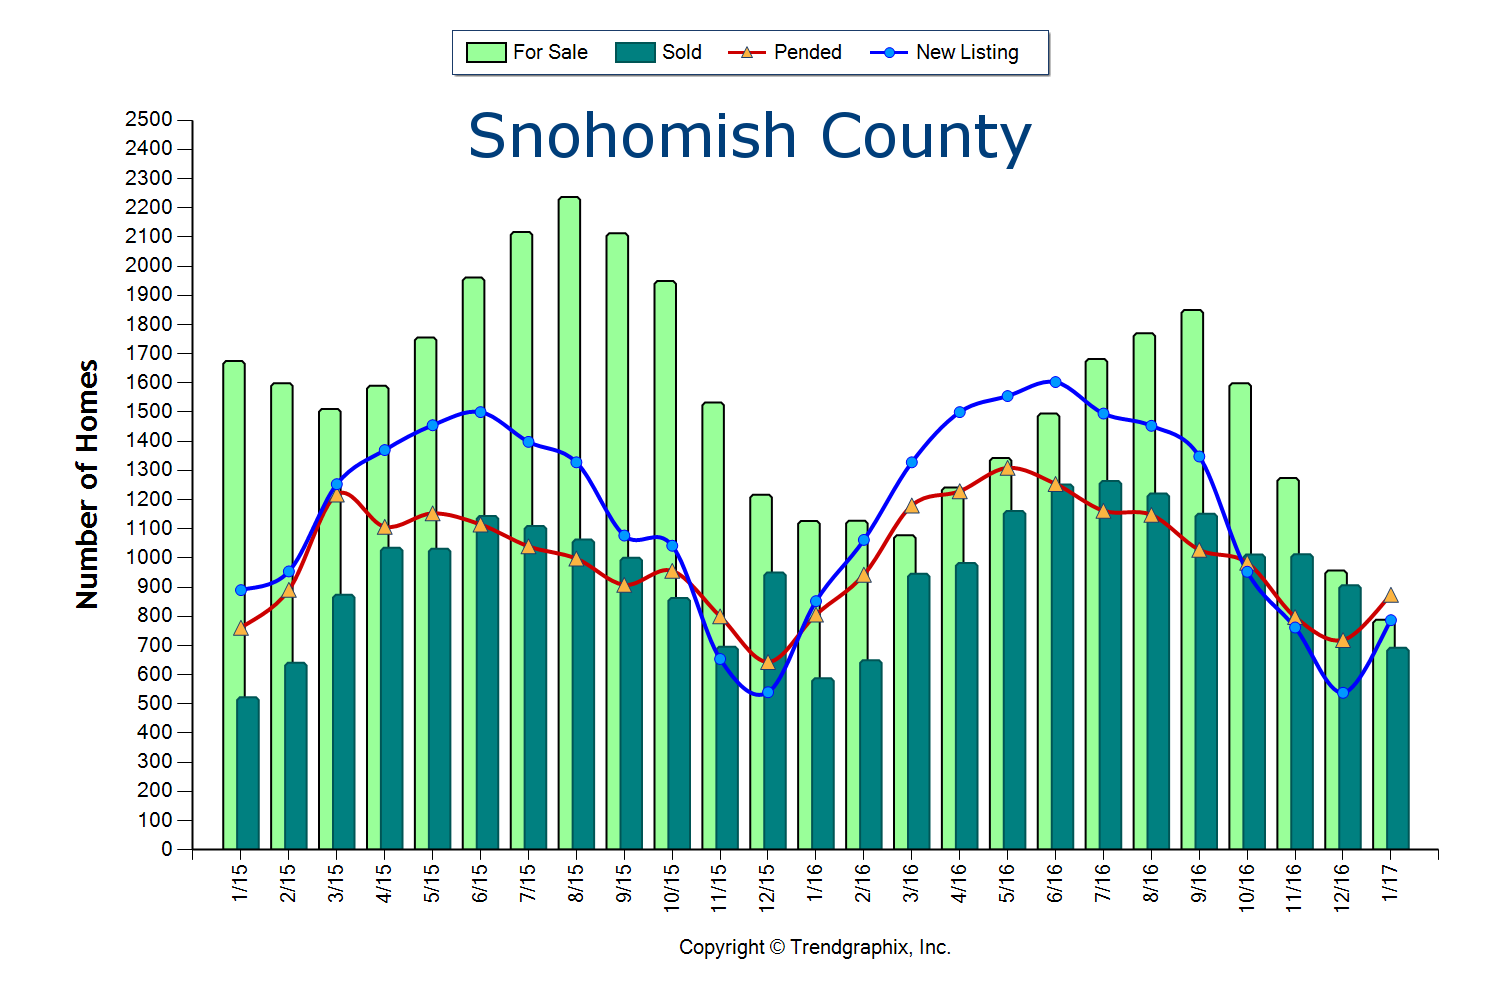
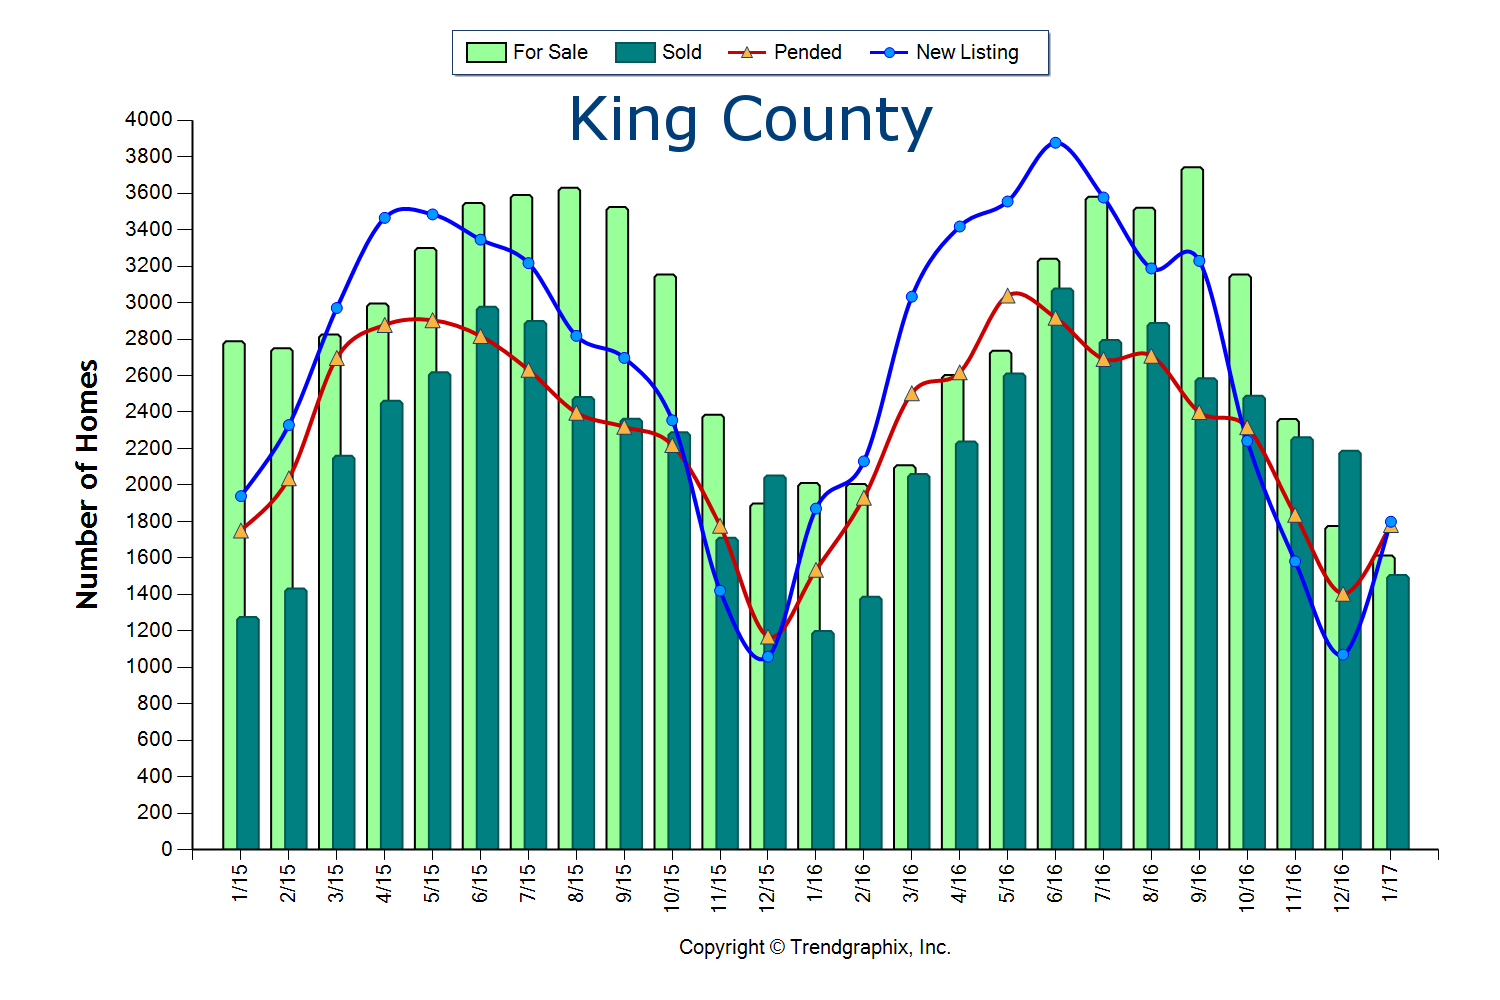
The two graphs here illustrate the amount of homes for sale, the amount of homes that sold, pending sales and new listings over the past two years in King and Snohomish Counties. This gives us a good look at the simple principle of supply and demand. We are currently experiencing one of the strongest Seller’s markets in recent history. A Seller’s market is defined by having three or less months of available inventory. Currently, King and Snohomish counties have only 0.9 months of inventory based on pending sales. This means that if no new homes came to market, we would be sold out of homes in less than a month. What is crazy is that this inventory count is down 30% from the year prior, which was also an extreme Seller’s market!
 Where this particular Seller’s market is unique, is that a decrease in new listings is not creating this environment, but very high buyer demand is. In fact, King County new listings were up 5% over the last year, but so were sales. In Snohomish County new listings were up 7% over last year, but sales were up 11%! Despite the increase in homes coming to market, demand has matched or outpaced, leaving us with the lowest inventory levels ever.
We can thank our local, thriving job market. So much so, that many people from out-of-state are relocating here to be a part of our economy and the quality of life the Greater Seattle area has to offer. We also have poised move-up buyers ready to cash in on their equity and first-timers ready for action. Combine the healthy local economy with strong equity levels and still historically low interest rates, and the audience for homes that come to market is huge!
Multiple offers are very common and prices are increasing. Median price is up complete year over year in King County by 13% and Snohomish County by 10%. This growth in equity has provided home owners the option to make the moves they have been waiting for, such as a move-up, right-size or relocating out of the area for retirement.
These graphs predict that we will see an increase in new listings as we head into the Spring and Summer months, which is needed to meet demand. If you are considering putting your home on the market this year I would advise the sooner the better, as buyers did not hibernate for the winter and will not be worried about flowers blooming in your front yard. Sellers that beat the second quarter increase in listings will enjoy a larger audience due to less competition.
 The importance of both buyers and sellers aligning with a knowledgeable, well-researched and responsive broker is paramount. One might think that it is “easy” to sell a house in this market, but how the preparation, exposure, marketing, management of all the communication and negotiations are handled can make or break a seller’s net return on the sale. While market times are short, they are intense! Negotiations are starting as soon as the property hits the market by educating buyers and their brokers on exactly what a seller would like by the time offers are due. The goal is to bring the sellers I work with not only the highest price, but the best-termed offer that I know is going to close.
If you’re a buyer, it is overwhelmingly important that you are aligned with an agent that knows how to win in this market. Terms, negotiations, financial preparation, communication, responsiveness and market knowledge are what set a highly capable selling agent apart, and are required to prevail. While the market for buyers is fierce, we can assure you that with a well thought out and executed plan, we have helped buyers win.
If you have any curiosities or questions regarding the value of your current home or purchase opportunities in today’s market, please contact us. It is my goal to help keep you informed and empower strong decisions.
Affordability: Commute Times & Interest Rates
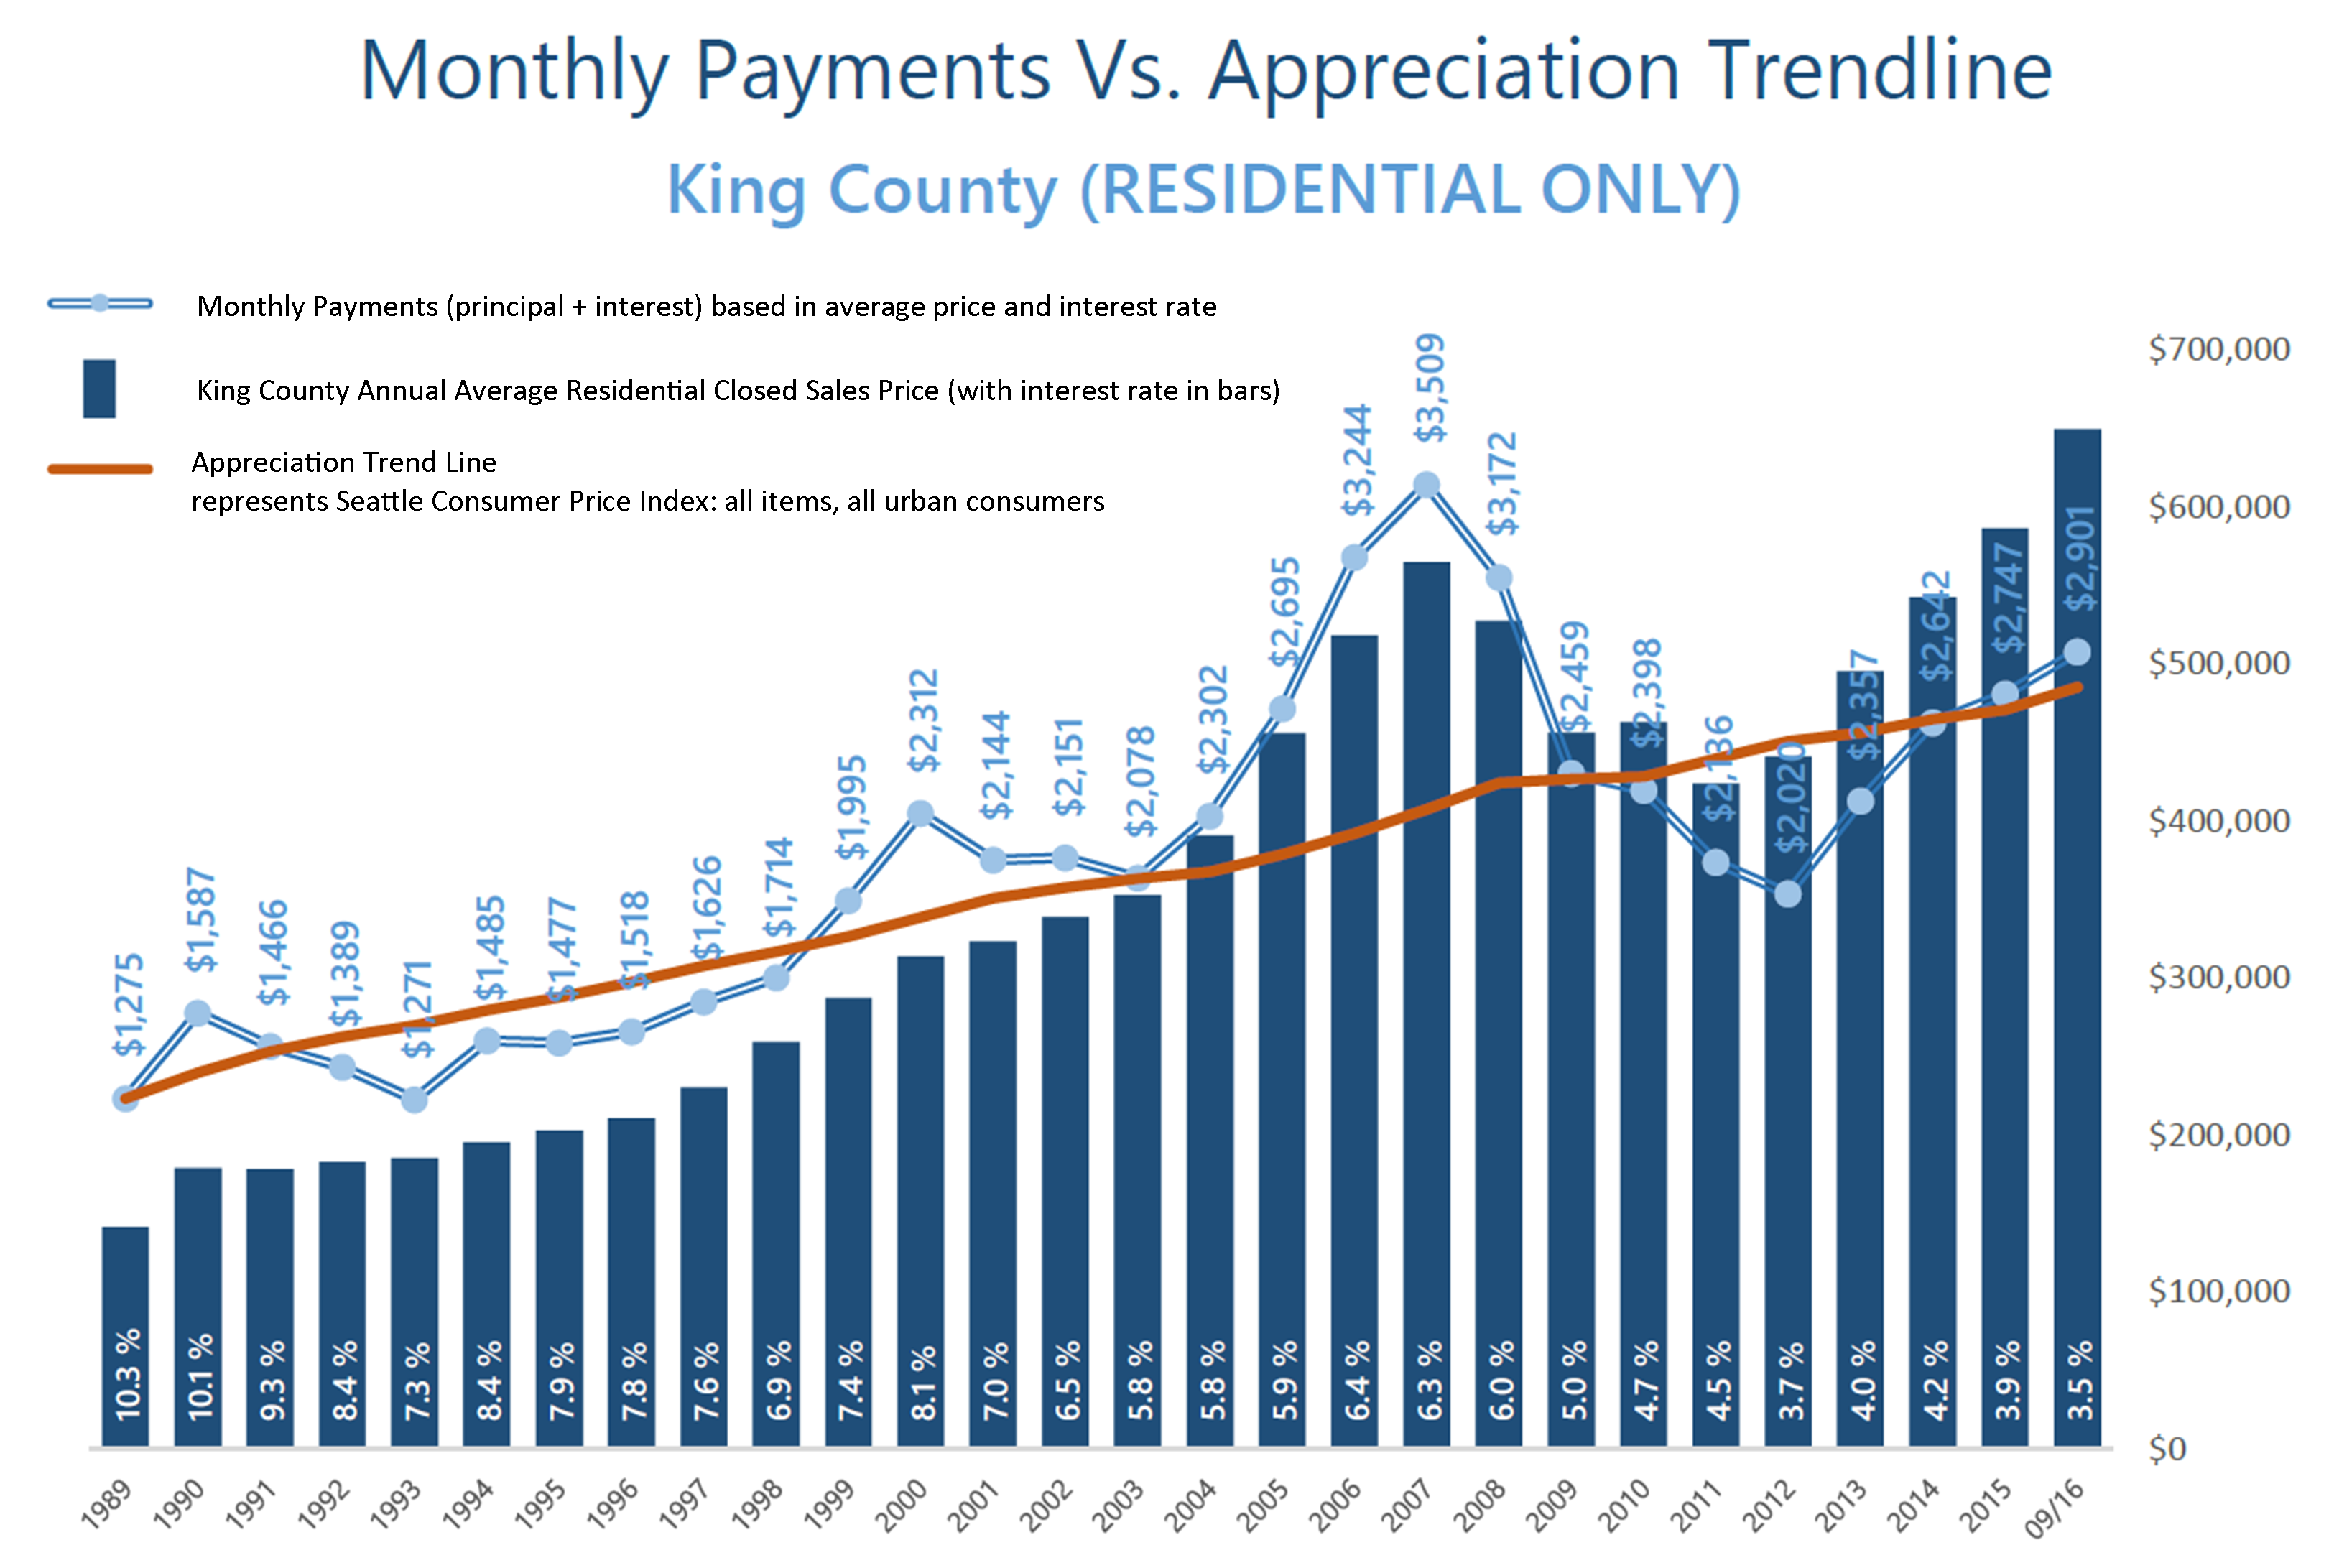
 These graphs illustrate the brass tacks of affordability between King and Snohomish Counties, measured by the average monthly payment. Most recently in September, the average monthly payment was 35% higher in King County compared to Snohomish County. What is fascinating, though, is comparing today’s average monthly payment to peak monthly payments back in 2007! In King County, monthly payments are currently 21% less than during the peak, and in Snohomish County, 36% less. That is a lot of saved monthly overhead. Note that this has everything to do with today’s historical interest rates, as average prices are higher now than in 2007. When one buys or refinances a house, they are not only securing the property, but securing the rate for the life of the loan.
Close proximity to the work place and affordability is often near the top of a buyer’s list of preferred features. 2016 has continued to be a year when commute times to major job centers widened the price divide between key market areas in the greater Seattle area. Over the last 12 months, the average sales price for a single-family residential home in the Seattle Metro area was $696,000! In south Snohomish County (Everett to the King County line), the average sales price for a single-family residential home was $471,000 – 48% less than Seattle Metro. Further, if you jump across Lake Washington to the Eastside, the average sales price for a single-family residential home was $881,000 – 27% more than Seattle Metro!
The “drive to qualify” mentality has been proven by the pending sales rate in south Snohomish County over the last 12 months. Pending sales are up 7% complete year-over-year, whereas in Seattle Metro pending sales are down 1%, and down 2% on the Eastside. We believe this is a result of affordability, more inventory choices in south Snohomish County, new construction options, lower taxes, strong school district choices, and manageable commute times. Newer transit centers and telecommuting have also opened up doors to King County’s little brother to the north as well. If you are curious about possible commute times, you can search for properties on our website based on commutes times, which is a feature provided by INRIX Drive Time. Also, we track the market in several ways, so if the graphs here are interesting to you, any of our agents would be happy to provide additional information relative to your specific neighborhood. Please contact us anytime, as it is our goal to help keep you informed and empower you to make strong real estate decisions.
Many Factors to Consider When Choosing to Rent vs. Own
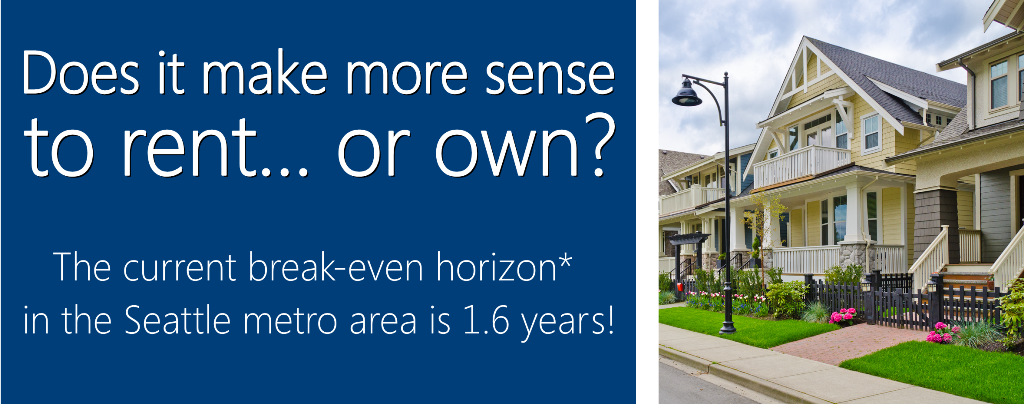
*The amount of time you need to own your home in order for owning to be a superior financial decision.
There has been a lot of talk lately about the cost of living in the Greater Seattle area. Whether it has to do with home prices or rental rates the story is the same: it is becoming more and more expensive by the month. With rising rental rates, historically low interest rates, and home prices on the rise, the advantage of buying vs. renting has become clear for folks that have a down payment saved, good debt to income ratios and strong credit. In fact, Seattle is now the 10th most expensive city to rent in the country according to a new study from Zumper.com. The average monthly rental price for a one-bedroom apartment in the city of Seattle is $1,740! Snohomish County has seen an increase in apartment growth and rising rental rates as well. Currently, the breakeven horizon in the Greater Seattle area (the amount of time you need to own your home in order for owning to be a superior financial decision versus renting) is 1.6 years according to Zillow research.
There are several factors to consider that will lead you to make the best decision for your lifestyle and your financial bottom line. One of the biggest factors is interest rates! Currently, the rate for a 30-year fixed, conventional, conforming loan is hovering around 3.5%. That is amazingly and historically low, making the advantage of securing a mortgage huge. What is nice about having a mortgage is that the payment stays the same over the term of the loan. With renting, rates can be increased at any time, and you are paying down someone else's asset, not your own. Owning gives the homeowner control over their overhead while getting to make their house their home. What is also so great about owning is that once you have hit the breakeven horizon, every month that ticks away thereafter is building your nest egg in value. Did you know that American homeowners’ net worth is 36 times the amount of renters? The long term benefits of owning are abundant. These are important factors to consider for everyone, but especially the younger folks that are enjoying the benefits of Seattle’s attractive job market and competitive wages.
Where folks are having to compromise most due to affordability is commute times and settling in less urban neighborhoods. Some people, mainly millennials, have not been willing to give up living in the more core urban neighborhoods that have high walk scores and shorter commute times. That should be apt to change as rents are rising fastest in those areas. The advantages of moving out a little further and securing a home will start people on the track of building long term wealth. If you or anyone you know is currently renting and is considering a change, please let us know, as we would be happy to get your questions answered to help you make an informed decision.
How Much is Your Home Worth?
A Look at Local Home Value Growth Since 2012
Since 2012, home values have grown by around 10% each year, resulting in substantial return in pricing. Below are some examples of actual homes sold in 2012 and again in 2015 that were not remodeled or significantly improved in between sales. These examples show the return in home values that we have experienced since the economic downturn. We pulled these examples to show you actual pound-for-pound market data versus the statistical percentages often quoted in market updates. We think these examples are pretty telling and quite exciting!
As you can see in the current economic update from Matthew Gardner, inventory has been a challenge. Many folks have been waiting for their current home values to return in order to make big moves involving their retirement, upgrading homes, investing or even buying a second home. If you are one of those people, we hope these examples provide you insight on the increase in home values and how they might pertain to you. As we head into the New Year, if you'd like a Comparable Market Analysis (CMA) on your home so you have a better understanding of your home's value, any one of our agents would be happy to do that. This would be an important component in charting your 2016 financial goals, and what a great time of year to gather that information.
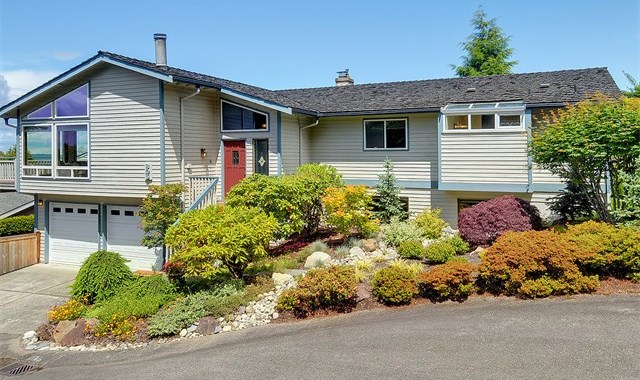
3 bedroom 3200 sq ft Edmonds home: |
|
 |
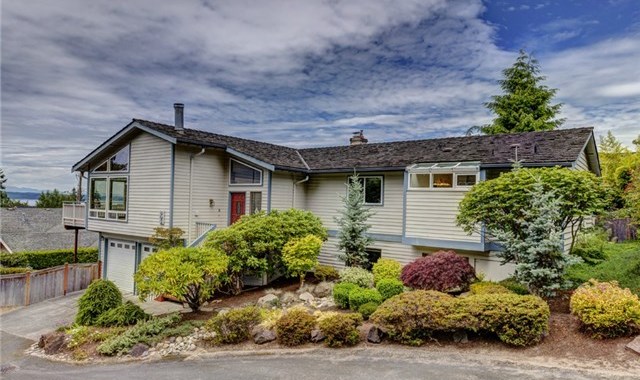 |
Sold in August 2012
|
Sold in July 2015
|
$185,050 INCREASE IN HOME VALUE: 32%! |
|
4 bedroom 2100 sq ft Bothell home: |
|
 |
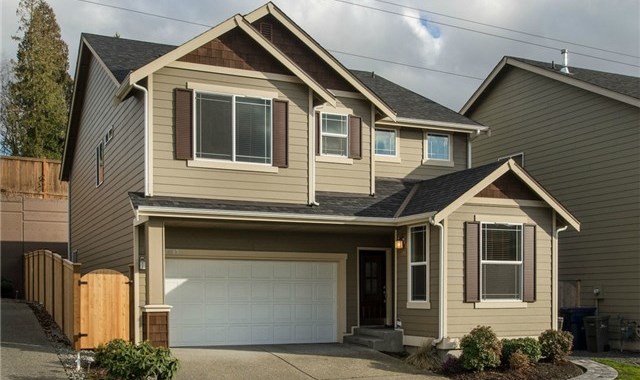 |
Sold in February 2012
|
Sold in February 2015
|
$114,872 INCREASE IN HOME VALUE: 36%! |
|
3 bedroom 1400 sq ft Shoreline home: |
|
 |
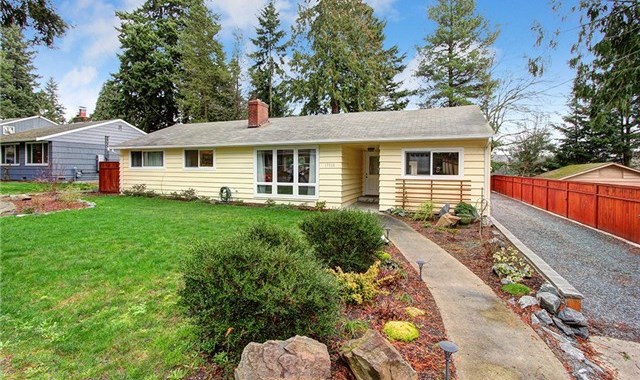 |
Sold in June 2012
|
Sold in March 2015
|
$102,250 INCREASE IN HOME VALUE: 33%! |
|
3 bedroom 1800 sq ft Lynnwood home: |
|
 |
 |
Sold in December 2011
|
Sold in May 2015
|
$95,000 INCREASE IN HOME VALUE: 43%! |
|
We are currently working on more examples in surrounding communities… check out our Price Appreciation Study for more. And contact any one of our agents for a Comparable Market Analysis on your home.
A Check-up on Prices & Appreciation
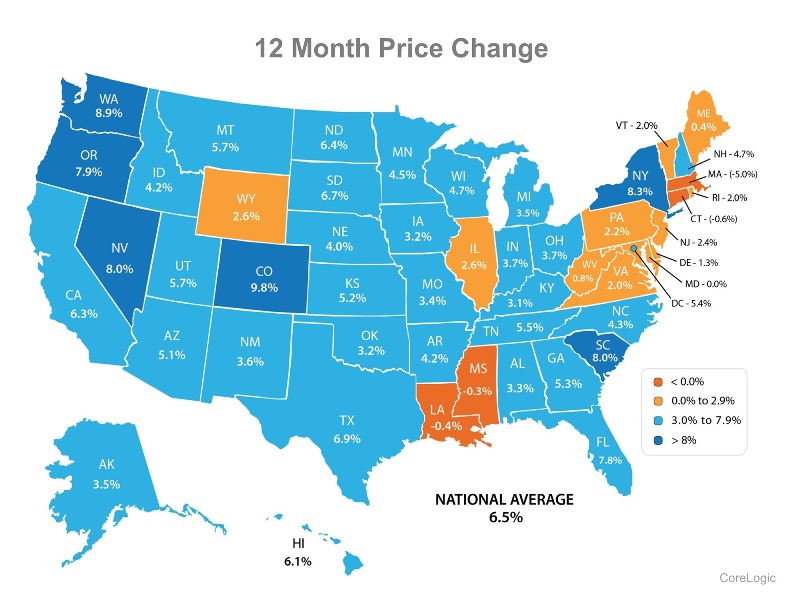
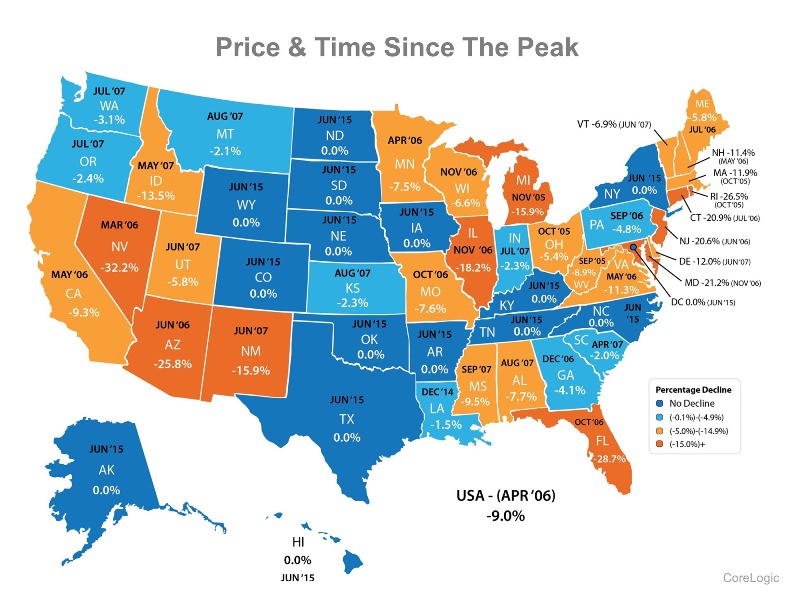
As we finish up the 2015 summer selling market and head into fall it is a good time to take a look at where we are at regarding appreciation. The two maps below are from CoreLogic, a global real estate data analytic company. According to the top map, Washington has seen 8.9% in appreciation over the last 12 months. When I pull those same numbers for King county the appreciation rate is 8.5% and Snohomish county is 9.2%. Appreciation has continued to be strong, but it has tempered a bit compared to the previous year, which is a good thing. The biggest driver of the strong appreciation rates is high demand and low inventory. Our robust local economy has provided a lot of opportunity for buyers, and they are out there with force. Inventory levels continue to not provide enough selection to support the amount of buyers in the market. If you look at the map on the bottom you will see how today's price levels relate to peak prices from 2006/2007. Washington State is 3.1% from the peak, which means that many folks are at healthy equity levels. Surprisingly, not everyone knows this, and I think that is why we may not be seeing the amount of inventory that would better support the demand in the market and would slow appreciation levels to more traditional (and sustainable) rates of 3-5% a year.In fact, according to a Fannie Mae survey 23% thought they were in negative equity positions when only 9% where. Further, only 37% surveyed thought they had less than 20% equity when 69% actually did! Those are big discrepancies that could be crippling to a productive decision on what to do with your real estate. If you or someone you know is ever curious about your equity position please do not hesitate to contact us to get a clear picture. Any of our agents would be happy to do a comparative market analysis (CMA) for you to help keep you informed on your biggest asset, your home.
