
 Facebook
 X
X
 Pinterest
 Copy Link
Quarterly Reports: Q3 Eastside
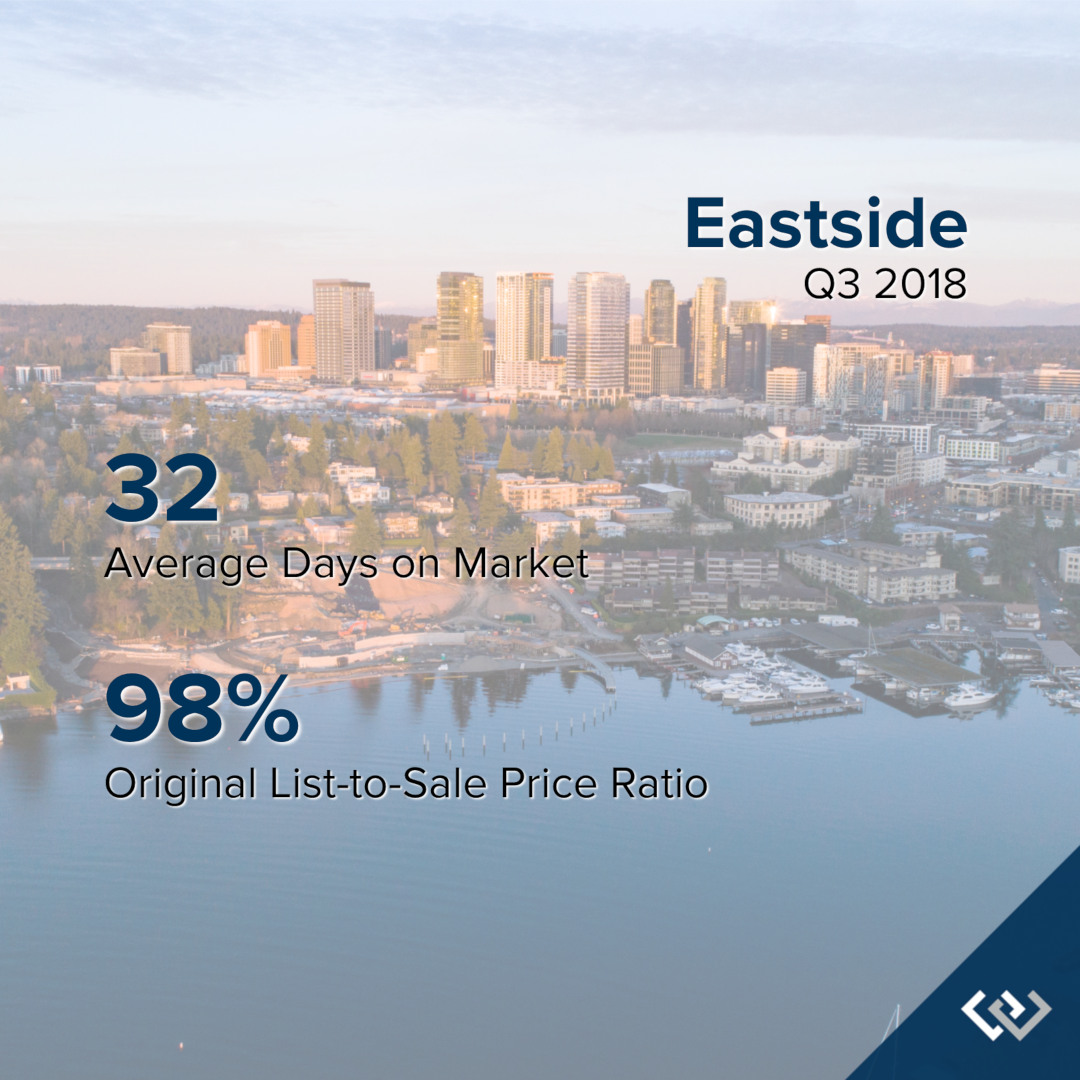
Q3: July 1 – September 30, 2018
THE EASTSIDE: In September, the average days on market landed at 32 days and the original list-to-sale price ratio 98%. Since May, inventory growth has been noticeable, and has given buyers more options. This has led to more negotiations and fewer bidding wars, which is tempering month-over-month price growth to a more sustainable level.
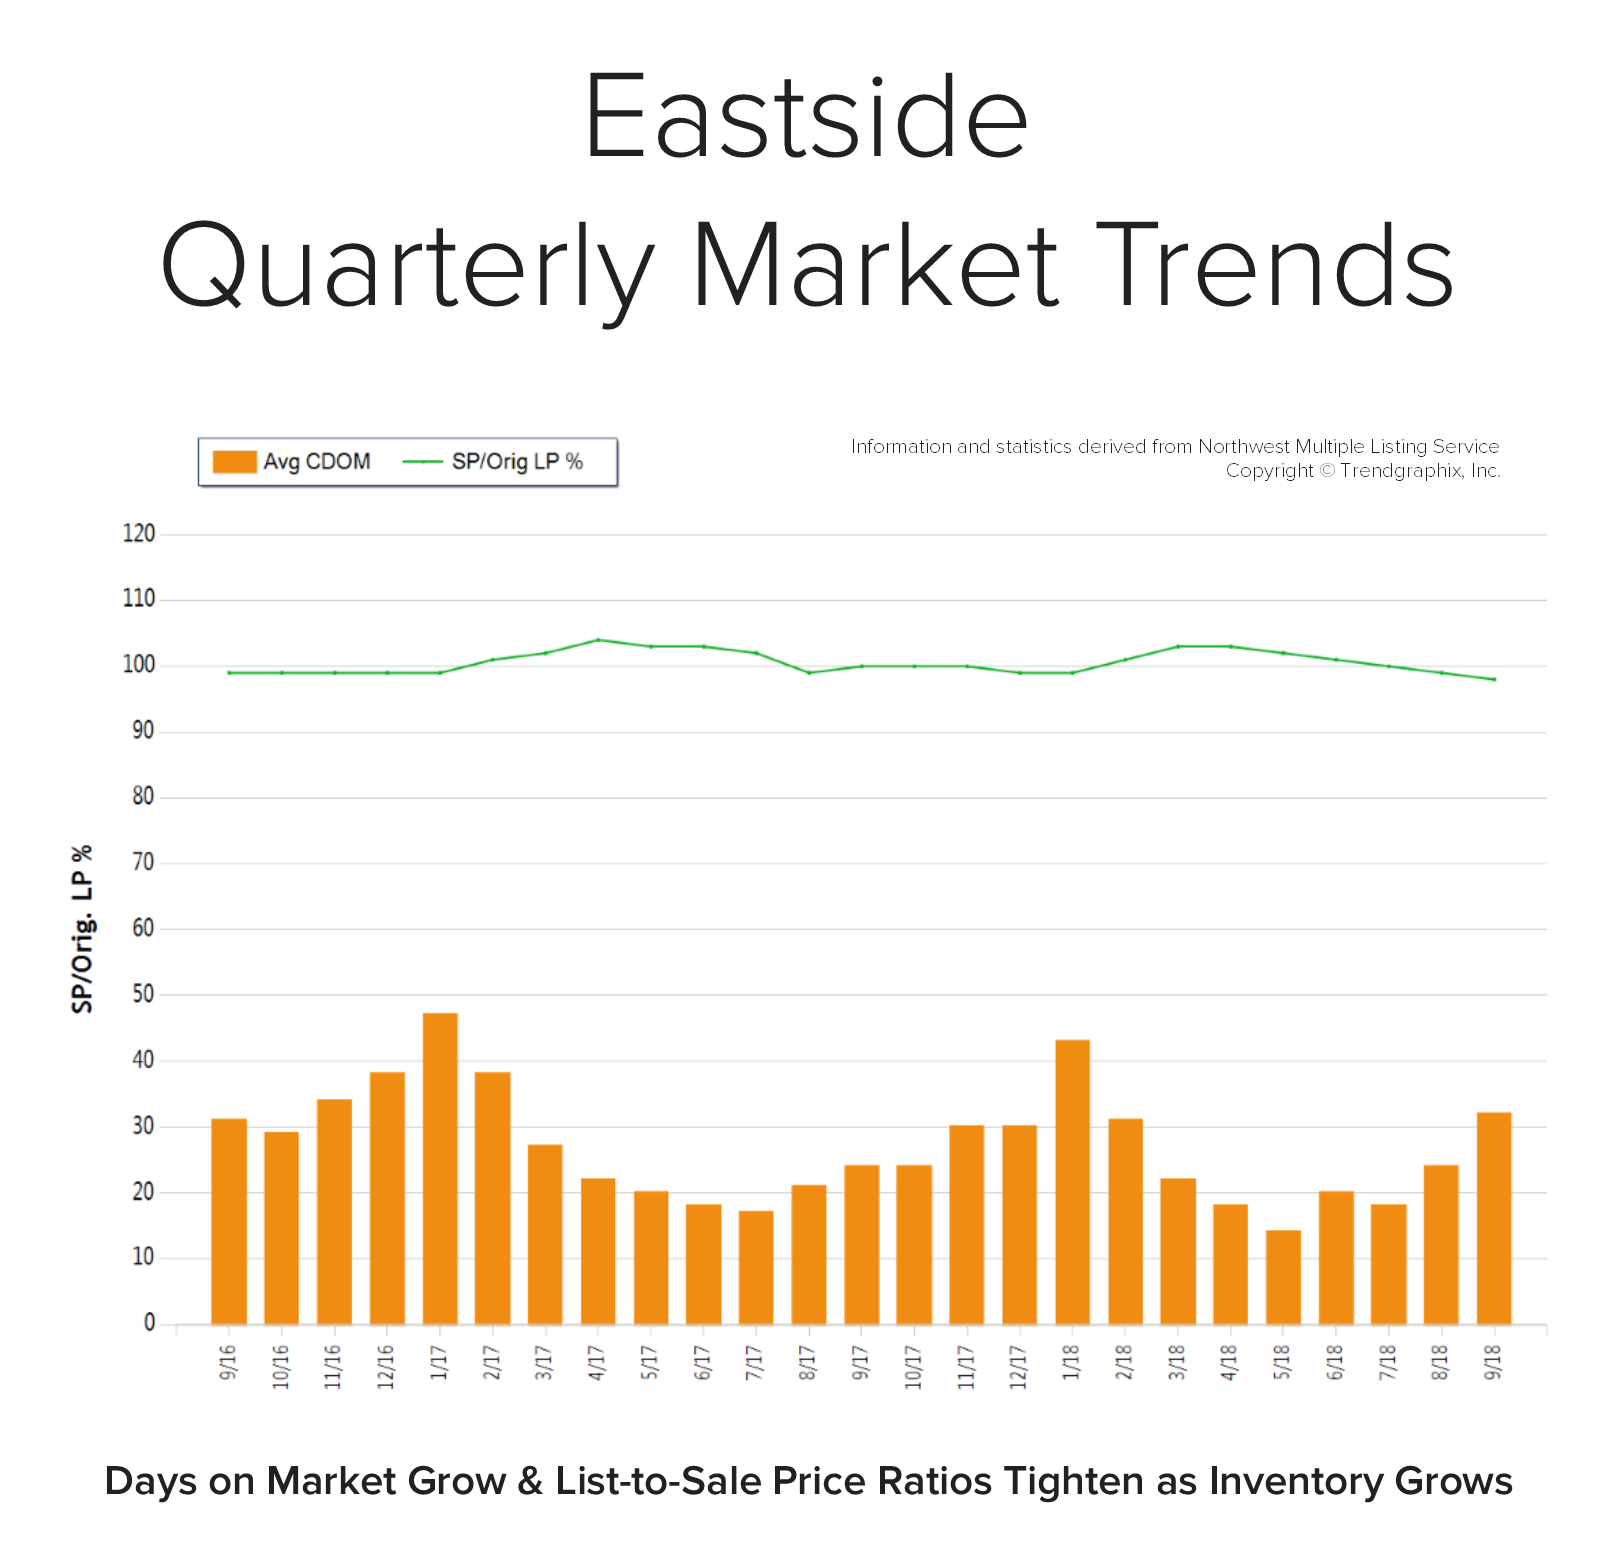 Back in April, the average days on market was 13 days and the original list-to-sale price ratio 103%; but months of inventory based on pending sales was 0.8 months, compared to 2.9 months currently. Year-over-year, prices are up 10%, still well above the historical norm of 3%-5% year-over-year gains—but note that the majority of this growth happened during the spring, due to constricted inventory levels.
Supply has increased, creating more options for buyers and helping to buffer affordability issues. Many sellers are deciding to make moves and cash in on the equity gained over the last six years. An average original list-to-sale price ratio of 98% is a positive return, yet illustrates a softening in the market after some very extreme times. With 10% price growth over the last 12-months in a seller’s favor, the increase in selection has led to more nimble moves from one house to another. Where sellers need to be careful is anticipating the month-over-month price growth we saw prior to the shift in inventory. Prospective buyers would be smart to take advantage of today’s historically low interest rates and the added inventory selection.
This is only a snapshot of the trends on the Eastside; please contact us if you would like further explanation of how the latest trends relate to you.
Quarterly Reports: Q3 North Snohomish
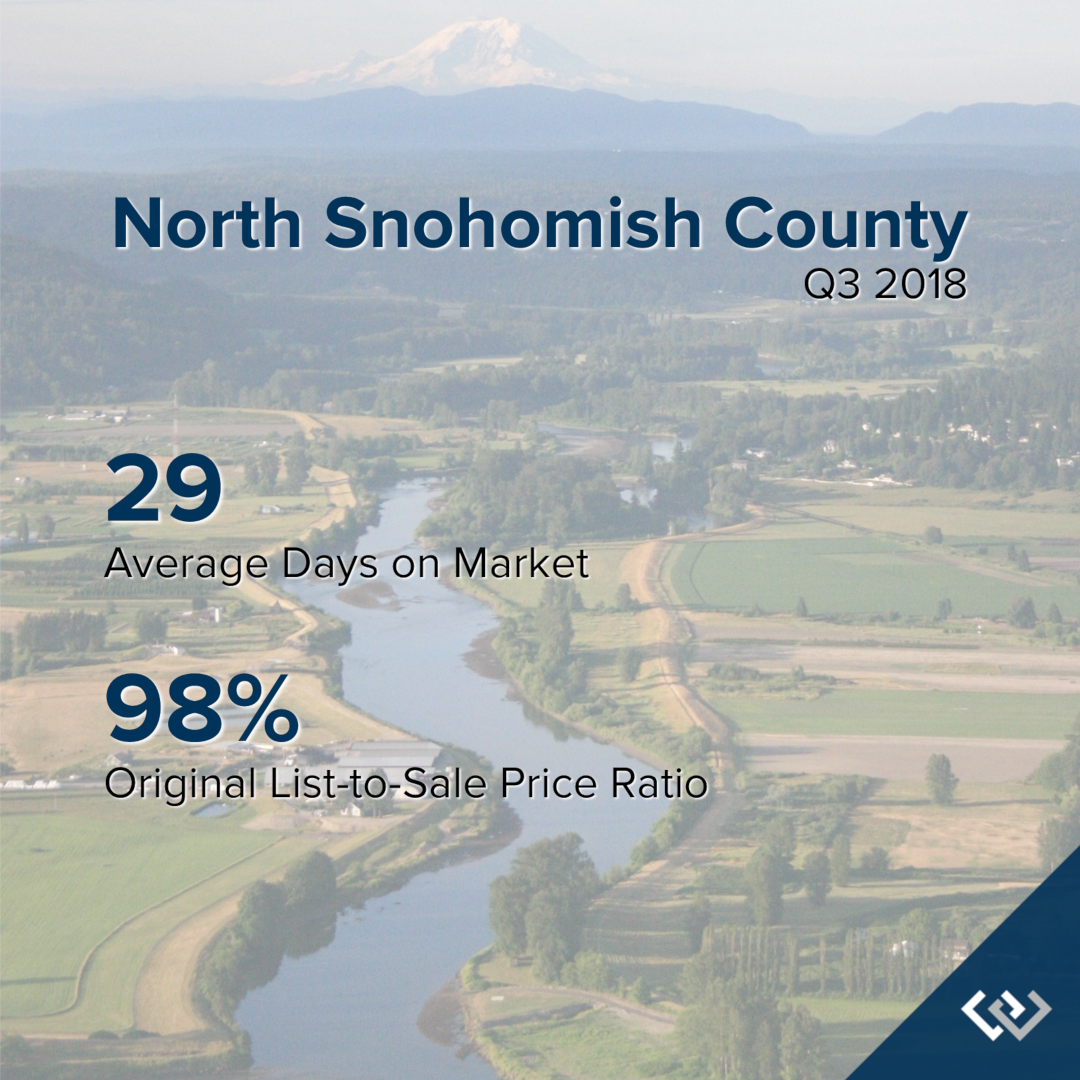
Q3: July 1 – September 30, 2018
NORTH SNOHOMISH COUNTY: In September, the average days on market landed at 29 days and the original list-to-sale price ratio at 98%. Since May, inventory growth has been noticeable, and has given buyers more options. This has led to more negotiations and fewer bidding wars, which is tempering month-over-month price growth to a more sustainable level.
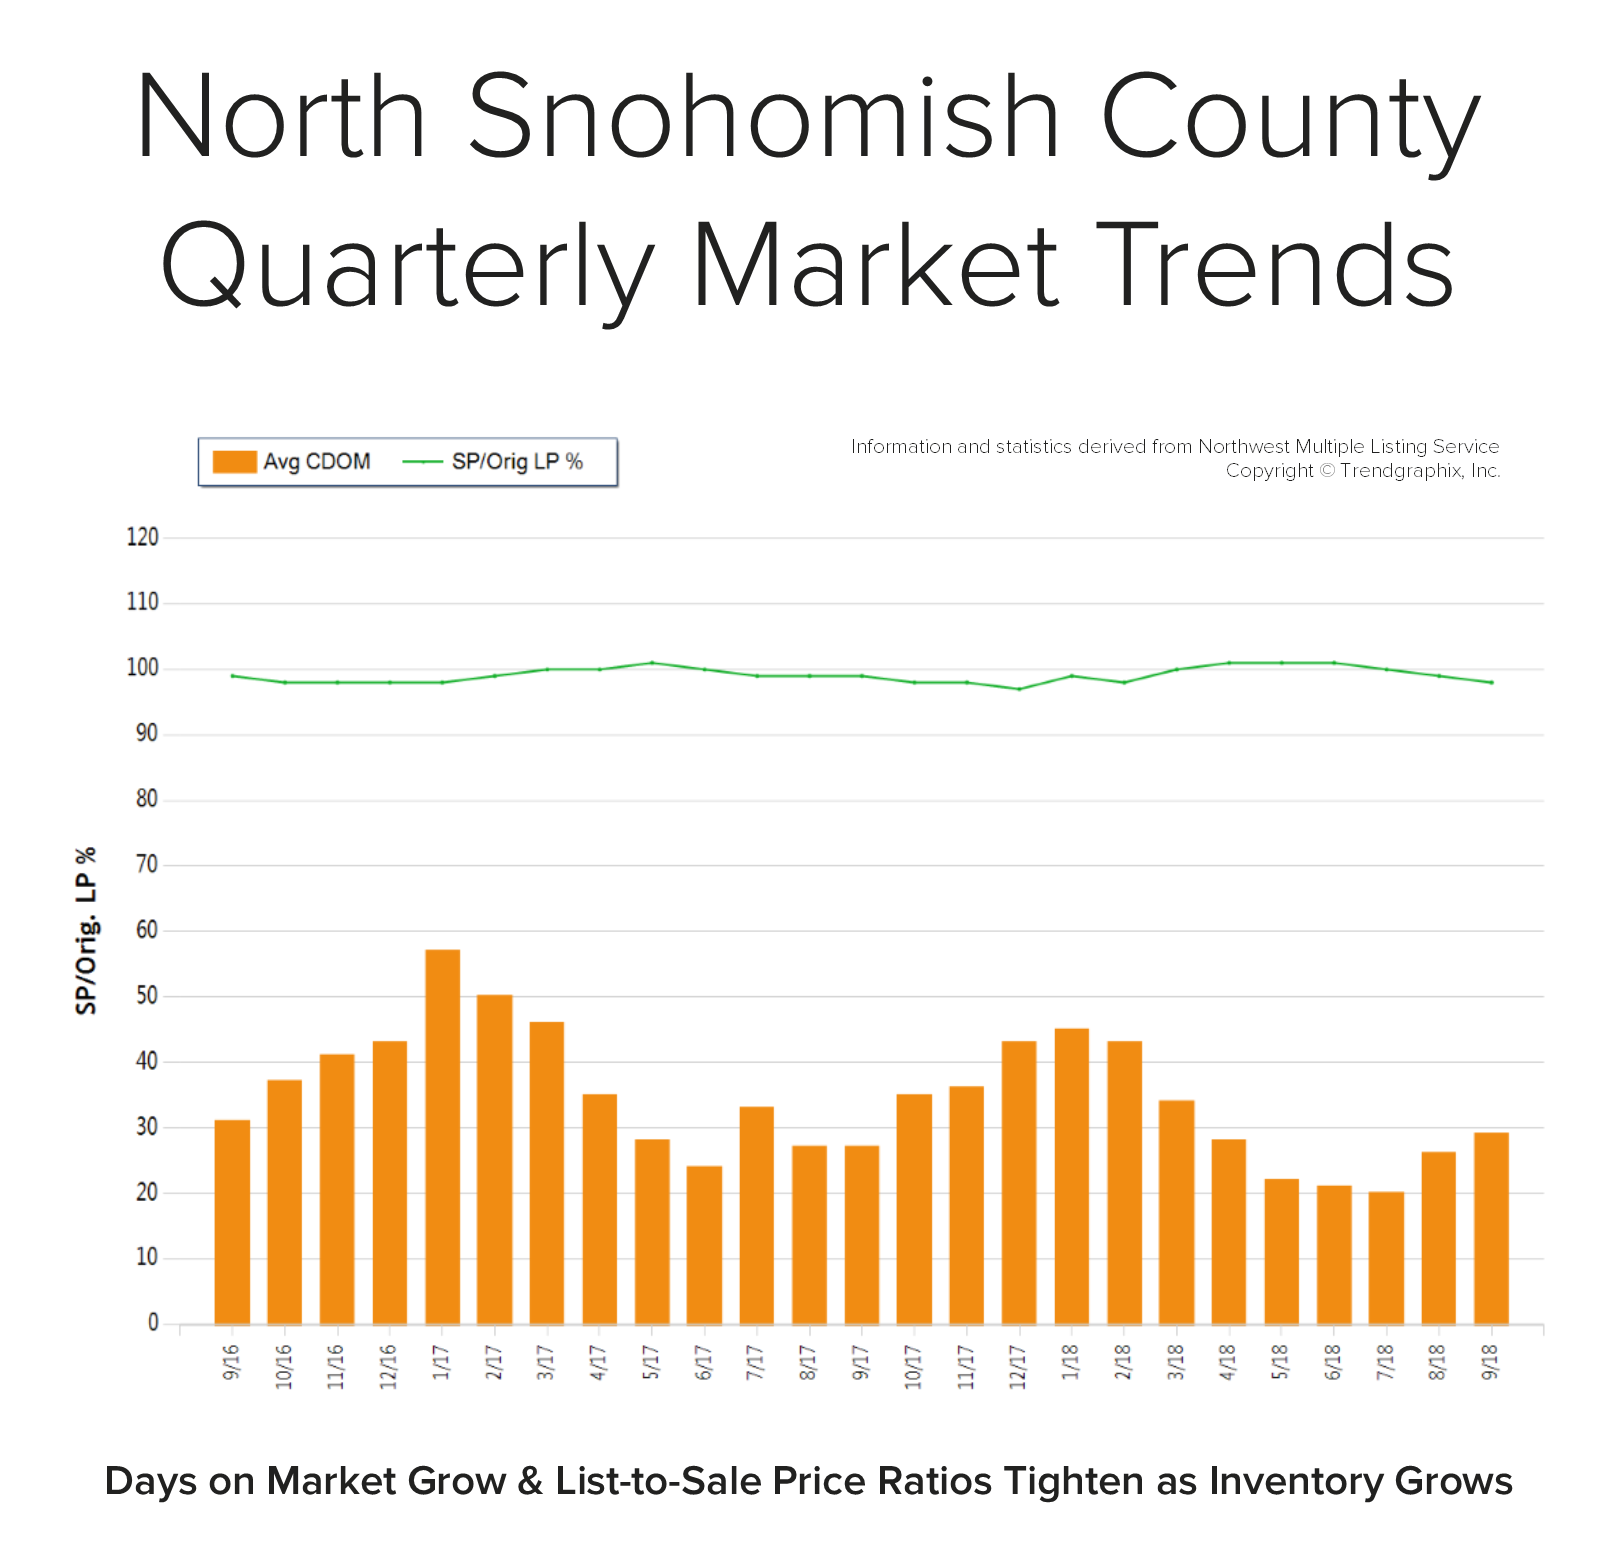 Back in May, the average days on market was 22 days and the original list-to-sale price ratio 101%; but months of inventory based on pending sales was 1 month compared to 2.3 months currently. Year-over-year, prices are up 11%, still well above the historical norm of 3%-5% year-over-year gains—but note that the majority of this growth happened during the spring, due to constricted inventory levels.
Supply has increased, creating more options for buyers and helping to buffer affordability issues. Many sellers are deciding to make moves and cash in on the equity gained over the last six years. An average original list-to-sale price ratio of 98% is a positive return, yet illustrates a softening in the market after some very extreme times. With 11% price growth over the last 12-months in a seller’s favor, the increase in selection has led to more nimble moves from one house to another. Where sellers need to be careful is anticipating the month-over-month price growth we saw prior to the shift in inventory. Prospective buyers would be smart to take advantage of today’s historically low interest rates and the added inventory selection.
This is only a snapshot of the trends in north Snohomish County; please contact me if you would like further explanation of how the latest trends relate to you.
Quarterly Reports: Q3 South King County
Q3: July 1 – September 30, 2018
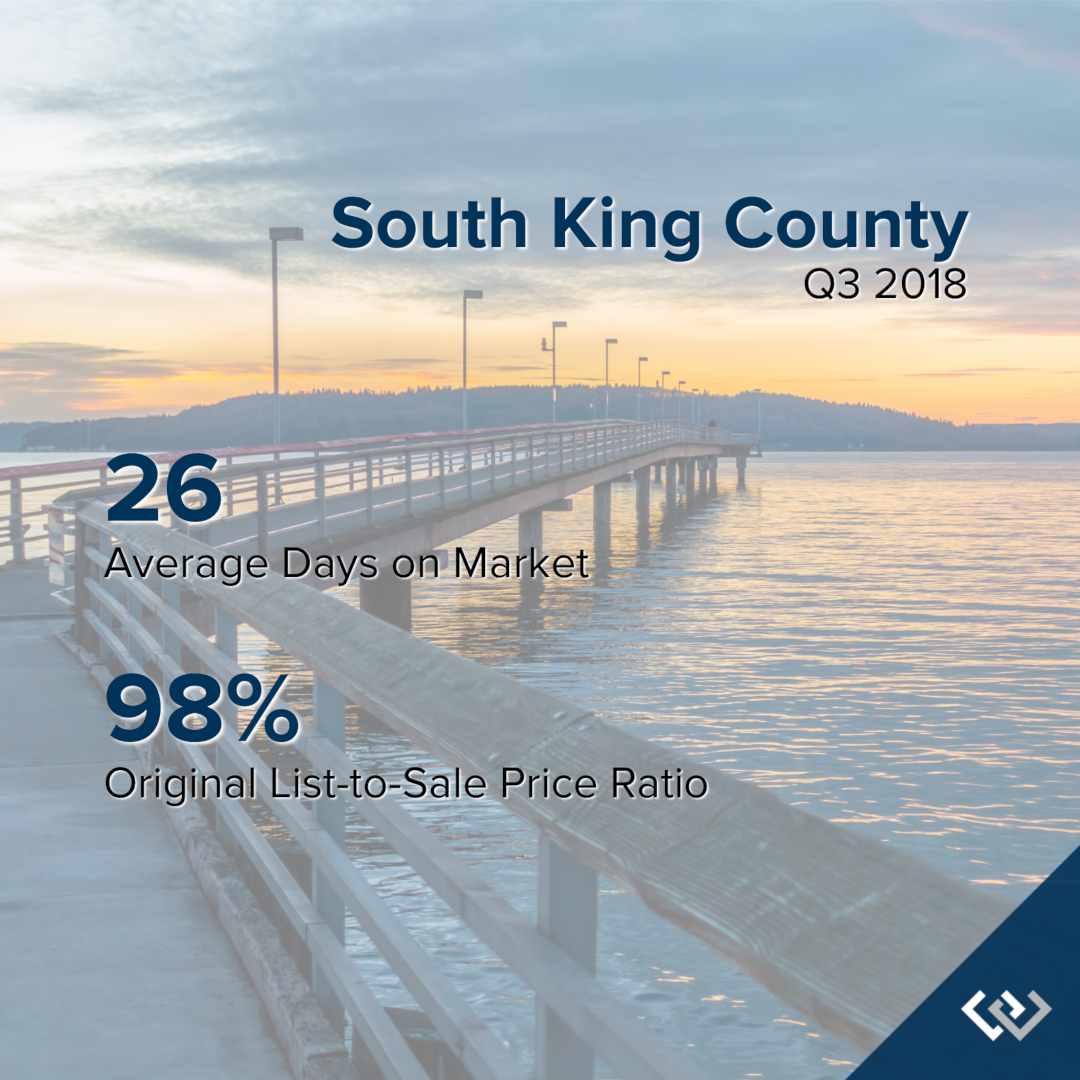
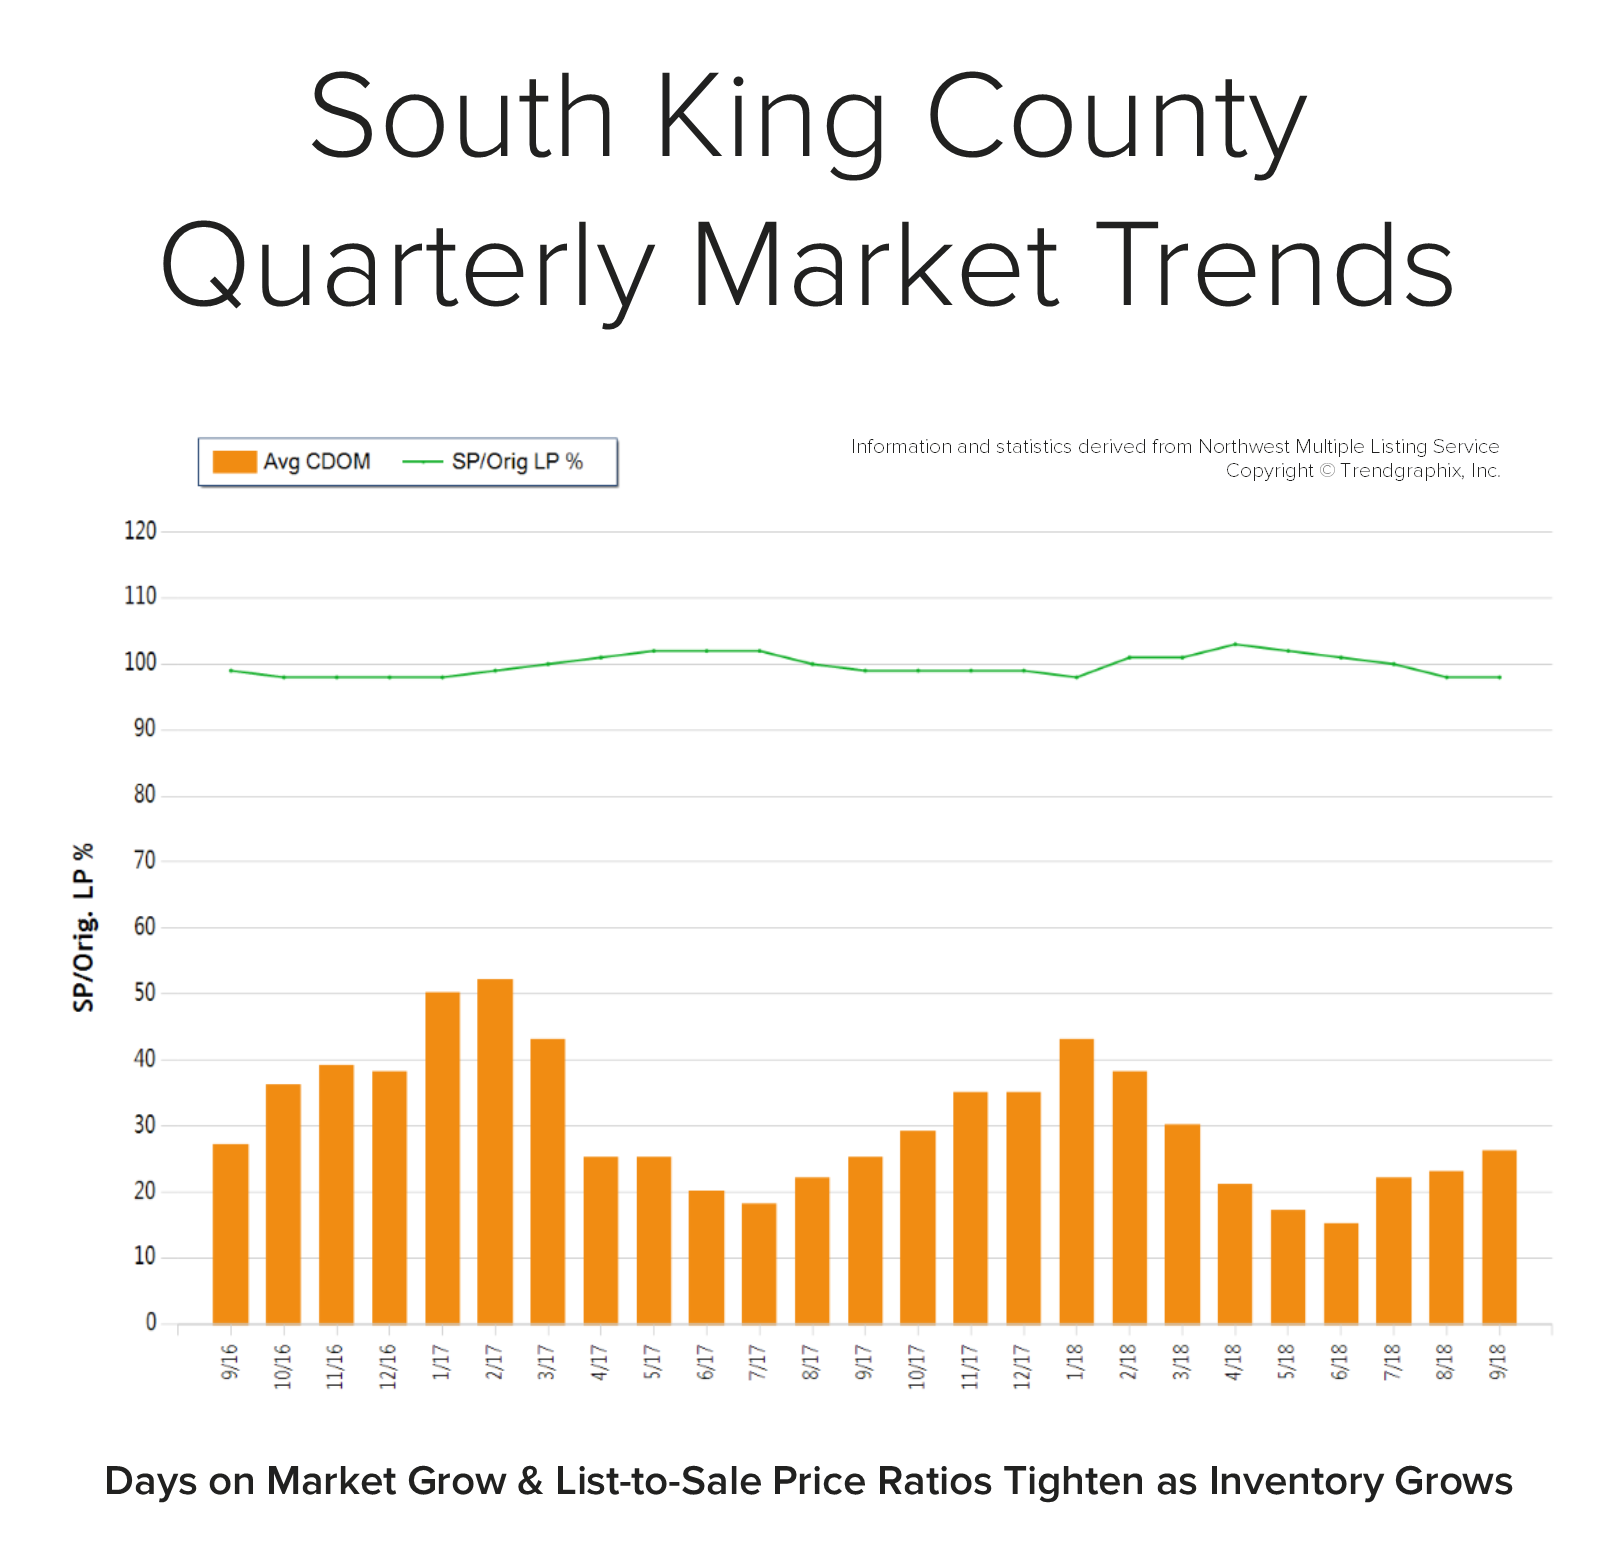
SOUTH KING COUNTY: In September, the average days on market landed at 26 days and the original list-to-sale price ratio 98%. Since May, inventory growth has been noticeable, and has given buyers more options. This has led to more negotiations and fewer bidding wars, which is tempering month-over-month price growth to a more sustainable level.
 Back in April, the average days on market was 21 days and the original list-to-sale price ratio 103%; but months of inventory based on pending sales was 0.9 months, compared to 2.6 months currently. Year-over-year, prices are up 10%, still well above the historical norm of 3%-5% year-over-year gains—but note that the majority of this growth happened during the spring, due to constricted inventory levels.
Supply has increased, creating more options for buyers and helping to buffer affordability issues. Many sellers are deciding to make moves and cash in on the equity gained over the last six years. An average original list-to-sale price ratio of 98% is a positive return, yet illustrates a softening in the market after some very extreme times. With 10% price growth over the last 12-months in a seller’s favor, the increase in selection has led to more nimble moves from one house to another. Where sellers need to be careful is anticipating the month-over-month price growth we saw prior to the shift in inventory. Prospective buyers would be smart to take advantage of today’s historically low interest rates and the added inventory selection.
This is only a snapshot of the trends in south King County; please contact us if you would like further explanation of how the latest trends relate to you.
What’s in Your Toolbox to Navigate the Changing Market?


The late spring market brought about some welcomed change to our local real estate markets. In May, we experienced the largest increase in inventory in a decade! North King County and South Snohomish County are two examples of what is happening in all the markets across the Puget Sound as we head into the second half of 2018. Below is a breakdown of the current environment; further is an explanation of what it all means.
North King County (Ship Canal to Snohomish County Line):
- 38% increase in new listings from April to May 2018
- 16% more new listings in May 2018 vs. May 2017
- Overall 5% more new listings over the last 12 months vs. the previous 12 months
- Average list-to-sale price ratios reduce to 104% from 105% in May 2018
- Median Price up 15% complete year over year, but down 1% vs. the previous month, landing at $815K.
South Snohomish County (Snohomish County Line to Everett):
- 27% increase in new listings from April to May 2018
- 10% more new listings in May 2018 vs. May 2017
- Overall 2% more new listings over the last 12 months vs. the previous 12 months
- Average list-to-sale price ratios reduce to 102% from 103% in May 2018
- Median price up 12% complete year over year, but equal with the previous month, landing at $500K.
This increase in inventory is awesome! It is providing more selection for buyers and is helping temper price growth, which was increasing at an unsustainable level. It is still a Seller’s market by all means, which is defined by having three or less months of available inventory. Both market areas are still just under one month of inventory based on pending sales, but not as low as the two-week mark they were experiencing in March.
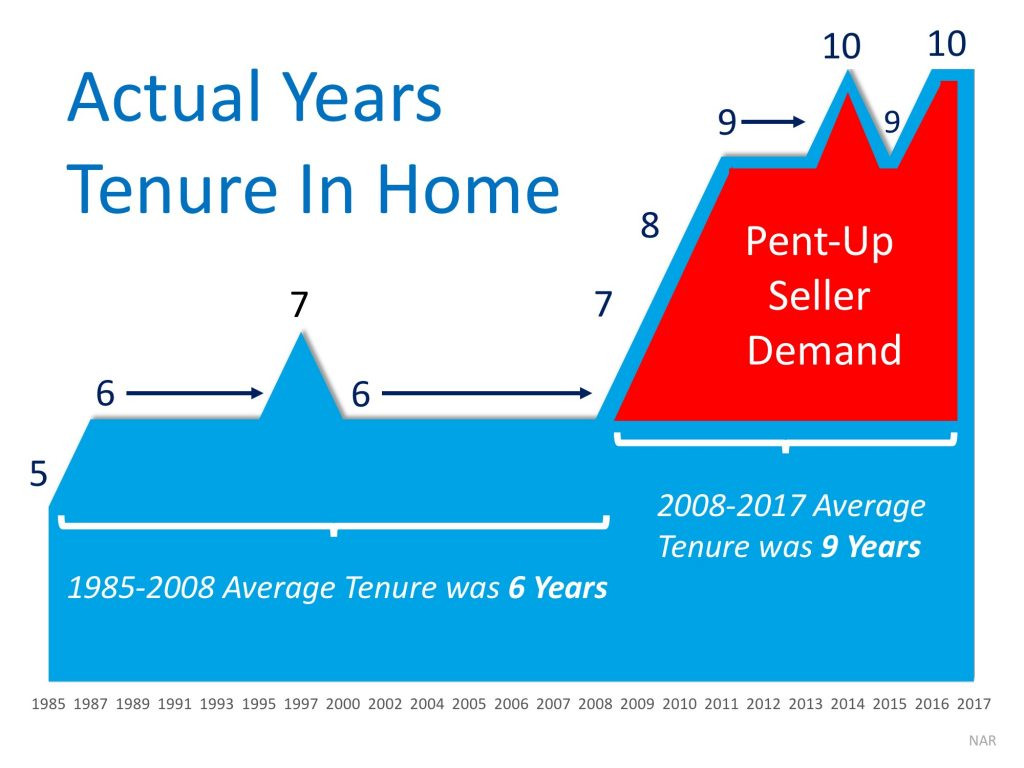
The increase in inventory is the result of pent up seller demand. From 1985-2008 the average amount of time a homeowner stayed in their home was 6 years. From 2008-2017 it grew to 9 years. With a resounding amount of equity under their belts, many homeowners are now deciding to make moves. Some are moving up to the next best thing and others are cashing out and leaving the area for a new beginning or retirement. This is providing buyers with the selection they have been waiting for after a very tenuous, inventory-starved start to 2018. The buyers that have stayed on the forefront of the market are now being rewarded with choices. These choices are best accompanied with keen discernment in order to craft the best negotiations – the broker they choose to align with is key.
The price analysis above indicates strong equity positions for sellers, but also a leveling off in price growth. Over the first quarter we saw prices increase month-over-month quite handily; now that more inventory is appearing and demand is being absorbed, price growth is not as extreme. This has highlighted the importance of having a strategic pricing and marketing plan for sellers wanting the highest price and shortest market time. The broker they choose to align with is key.
The importance of both buyers and sellers aligning with a knowledgeable, well-researched and responsive broker is paramount. One might think that it is “easy” to sell a house in this market, but the pricing research, home preparation, market exposure, varied marketing mediums, close management of all the communication, and how negotiations are handled can make or break a seller’s net return on the sale. With market times increasing, having a broker with a tight grasp on the changing environment will help create an efficient market time, resulting in the best price and terms for a successful closing. It is important that sellers do not overshoot this market, and it takes a broker with a keen gut sense rooted in in-depth research to help get them their desired results.
If you’re a buyer, it is overwhelmingly important that you are aligned with a broker that knows how to win in this market. The increase in selection has left some room for contemplation in some cases. Considering possible terms and price based on thorough market research as you head into negotiations are what set a highly capable selling broker apart and are required to prevail. With more selection coming to market, buyers have more to consider, and having a broker alongside them to help craft a strategy of negotiations will ensure they don’t overpay.
If you have any curiosities or questions regarding the value of your current home or purchase opportunities in today’s market, please contact us. It is our goal to help keep you informed and empower strong decisions.
Does it make more sense to rent or own?

The current break-even horizon* in the Seattle metro area is 1.6 years!
*The amount of time you need to own your home in order for owning to be a superior financial decision.

With rising rental rates, historically low interest rates, and home prices on the rise, the advantage of buying vs. renting is becoming clearer each month.
In fact, Seattle has seen some of the sharpest rent hikes in the country over the last year! Snohomish County has seen a huge increase in apartment growth and rising rental rates as well. There are several factors to consider that will lead you to make the best decision for your lifestyle and your financial bottom line. Zillow Research has determined the break-even point for renting vs. buying in our metro area. In other words, the amount of time you need to own your home in order for owning to be a superior financial decision. Currently in Seattle the break-even point is 1.6 years – that is quick! What is so great about every month that ticks away thereafter is that your nest egg is building in value.
We are happy to help you or someone you know assess your options; please contact us anytime.
These assumptions are based on a home buyer purchasing a home with a 30-year, fixed-rate mortgage and a 20 percent down payment; and a renter earning five percent annually on investments in the stock market.
Quarterly Market Trends: North King County

Q4 2017
 Price growth was particularly strong in 2017! Median and average prices were up 14% over 2016. Median price in 2017 landed at $715,000 and the average at $787,000. The average amount of days it took to sell a house in 2017 was 17 days, which is 19% faster than 2016. The average list-to-sale price ratio over the last year was 104%, with the spring months as high as 107%! In 2017, inventory growth continued to be a challenge, with a 4% decrease in new listings compared to 2016. Even with inventory limitations there were a near equal amount sales! This phenomenon illustrates strong buyer demand and a need for more listings.
Demand for north King County real estate has grown due to close proximity to job centers while maintaining a neighborhood feel. Over the last year, north King County was 41% more expensive than south Snohomish County and 77% over south King County. Historically low interest rates continue to drive the market as well, they have helped offset the increase in prices. Sellers are enjoying great returns due to this phenomenon and buyers are securing mortgages with minor debt service.
This is only a snapshot of the trends in north King County; please contact us if you would like further explanation of how the latest trends relate to you.
6 Predictions for the 2018 Housing Market & Economy Header


At Windermere, we have the privilege of working with esteemed economist, Matthew Gardner. Throughout the year, I have shared his quarterly Gardner Reports which delineate out all the different housing markets in Western Washington and reports on price appreciation and sales data. Below is a recent article he wrote about predictions for the 2018 real estate market; which was picked up by several news sources, including Inman News.
As a bonus, I recently had the opportunity to chat with him and get some specific insights on the Greater Seattle real estate market for 2018 and have included those at the end of this article. 2018 looks to be another strong year in real estate. If you are curious about how the market might affect your bottom line, please contact me. It is my goal to help keep my clients informed, empower strong decisions and create exceptional results. Here’s to a very happy New Year!
What Can We Expect From the 2018 Housing Market?
by Matthew Gardner, Chief Economist, Windermere Real EstateMillennial Home Buyers
Last year, I predicted that the big story for 2017 would be millennial home buyers and it appears I was a little too bullish. To date, first-time buyers have made up 34% of all home purchases this year – still below the 40% that is expected in a normalized market. Although they are buying, it is not across all regions of the country, but rather in less expensive markets such as North Dakota, Ohio, and Maryland.For the coming year, I believe the number of millennial buyers will expand further and be one of the biggest influencers in the U.S. housing market. I also believe that they will begin buying in more expensive markets. That’s because millennials are getting older and further into their careers, enabling them to save more money and raise their credit profiles.
Existing Home Sales
As far as existing home sales are concerned, in 2018 we should expect a reasonable increase of 3.7% – or 5.62 million housing units. In many areas, demand will continue to exceed supply, but a slight increase in inventory will help take some heat off the market. Because of this, home prices are likely to rise but by a more modest 4.4%.New Home Sales
New home sales in 2018 should rise by around 8% to 655,000 units, with prices increasing by 4.1%. While housing starts – and therefore sales – will rise next year, they will still remain well below the long-term average due to escalating land, labor, materials, and regulatory costs. I do hold out hope that home builders will be able to help meet the high demand we’re expecting from first-time buyers, but in many markets it’s very difficult for them to do so due to rising construction costs.Interest Rates
Interest rates continue to baffle forecasters. The anticipated rise that many of us have been predicting for several years has yet to materialize. As it stands right now, my forecast for 2018 is for interest rates to rise modestly to an average of 4.4% for a conventional 30-year fixed-rate mortgage – still remarkably low when compared to historic averages.Tax Reform
There are changes to the income tax structure that could potentially have a significant impact on homeowners and the housing market. The first is the mortgage interest rate deduction which will be capped at $750,000 – down from $1,000,000. In theory this can be considered a tax on wealthy households, but there have been nearly 100,000 home sales this year where the mortgage loan was over $750,000 (almost 4% of total sales), so the effect will be felt more broadly.That said, this change will disproportionately affect high-cost markets in California, New York, and Hawaii, and to a somewhat lesser degree, it will also be felt in Seattle, and parts of Colorado and Arizona. The capping of the deduction for state and local property taxes (SALT) at $10,000 will also negatively impact states with high property taxes, such as California, New York, and New Hampshire.
The final tax bill also eliminates the deduction for interest on home equity loans which is currently allowed on loans up to $100,000. This is significant because it will largely affect the growing number of homeowners who are choosing to remodel their home rather than try to find a new home in supply-starved markets like Seattle.
While these measures will likely have a dampening effect on housing, I do not believe they will lead to a substantial drop in home values. However, there is a concern that it will lead to fewer home sales, as households choose to stay put so they can continue to take advantage of the current mortgage interest deduction. The result could be fewer listings, which could actually cause home prices to rise at above-average rates for a longer period of time.
Housing Bubble
I continue to be concerned about housing affordability. Home prices have been rising across much of the country at unsustainable rates, and although I still contend that we are not in “bubble” territory, it does represent a substantial impediment to the long-term health of the housing market. But if home price growth begins to taper, as I predict it will in 2018, that should provide some relief in many markets where there are concerns about a housing bubble.In summary, along with slowing home price growth, there should be a modest improvement in the number of homes for sale in 2018, and the total home sales will be higher than 2017. First-time buyers will continue to play a substantial role in the nation’s housing market, but their influence may be limited depending on where the government lands on tax reform.
https://www.windermere.com/blogs/windermere/posts/1701
Gardner, Matthew. “What Can We Expect From The 2018 Housing Market?” Windermere Real Estate. Windermere.com, 8 December 2017. Web. 27 December 2017.
A Conversation with Matthew
It is always a pleasure to talk with Matthew. We recently discussed his thoughts on the Greater Seattle real estate market and what he sees shaping up for 2018.
Millennial homebuyers were more of an influence in the Greater Seattle market in 2017 because of the robust hiring that corporations such as Amazon have made. He thinks that this will continue to grow in 2018, because the cost of rent continues to rise at a rapid pace and in many cases owning makes superior financial sense. For example, it is not unheard of to pay $3,000 a month in rent for a unit in South Lake Union. While this eliminates a commute, it is an incredibly costly payment that goes entirely towards the landlord’s investment. If one is willing and able to pay that much in rent, it is important to look at the fact that that number is equivalent to a mortgage payment on a $550,000 home! He predicts that we will see more millennial homebuyers move out to the more traditional suburbs to start building their wealth in real estate. Ideally, Millennials would love to live in “ex-urban” areas that are still close to their places of work; however, listings are slim and prices very high for this type of product.Therefore, he expects to see Millennials having to look at the suburbs when deciding where to buy.
In 2017, net in-migration totaled 50,000 in the Greater Seattle area. Matthew predicts that we will see the same in 2018 due to our robust job market and Californians continuing to move to the area. Employment in the region will continue to expand, but at lower rates than seen in 2017. That said, he sees more wage growth than job growth in 2018 as companies have done so much hiring over the last 3 years, and now they are focused on maintaining their employee base. Amazon has signed on to occupy 5 million additional square feet of space over and above the 8+ million square feet that they currently occupy, so we will continue to see job growth there. The unemployment rate will stay below 4% in 2018.
Matthew believes we will see a slight increase in inventory taking our market to hot from boiling. Some new construction will help this increase and he does expect to see some Baby Boomers deciding to either cash-out and leave the area, or downsize. This inventory growth should temper price growth and increase sales by 6%. In 2017, we saw a year-over-year price appreciation rate of 13% in the Greater Seattle area, and he predicts 8-8.5% for 2018. This is still well above the normal rate of 5.5%, but certainly much more sustainable than 13%!
Lastly, Matthew is adamant that we are not headed toward another bubble. The average down payment in the Greater Seattle area is now over $100,000 and home owners have great equity positions, which is a critical ingredient to a non-bubble market. Additionally, credit is still very tight and buyers are very highly qualified, and the rampant speculation that is the key sign of a bubble is not being seen locally. His biggest concern is affordability, and that we need to continue to find ways to create more housing through zoning changes and decreasing the cost of regulation for builders. This density would create more affordable housing.
3 Reasons why we are NOT Headed Towards Another Bubble


Are we headed for another housing collapse?
We get asked this question often, and we can understand why. With the 2008 Great Recession not too far back in our rear-view mirror it is understandable that folks don’t want history to repeat itself, as that was a very painful time for many. Also, price appreciation has been rapid across the country, but especially in our region. The large price gains might seem familiar to the gains of the previous up market of 2004-2007, but the environment is much different. Here are three reasons why we are not headed towards (or in) another real estate bubble:
1. Lending Requirements
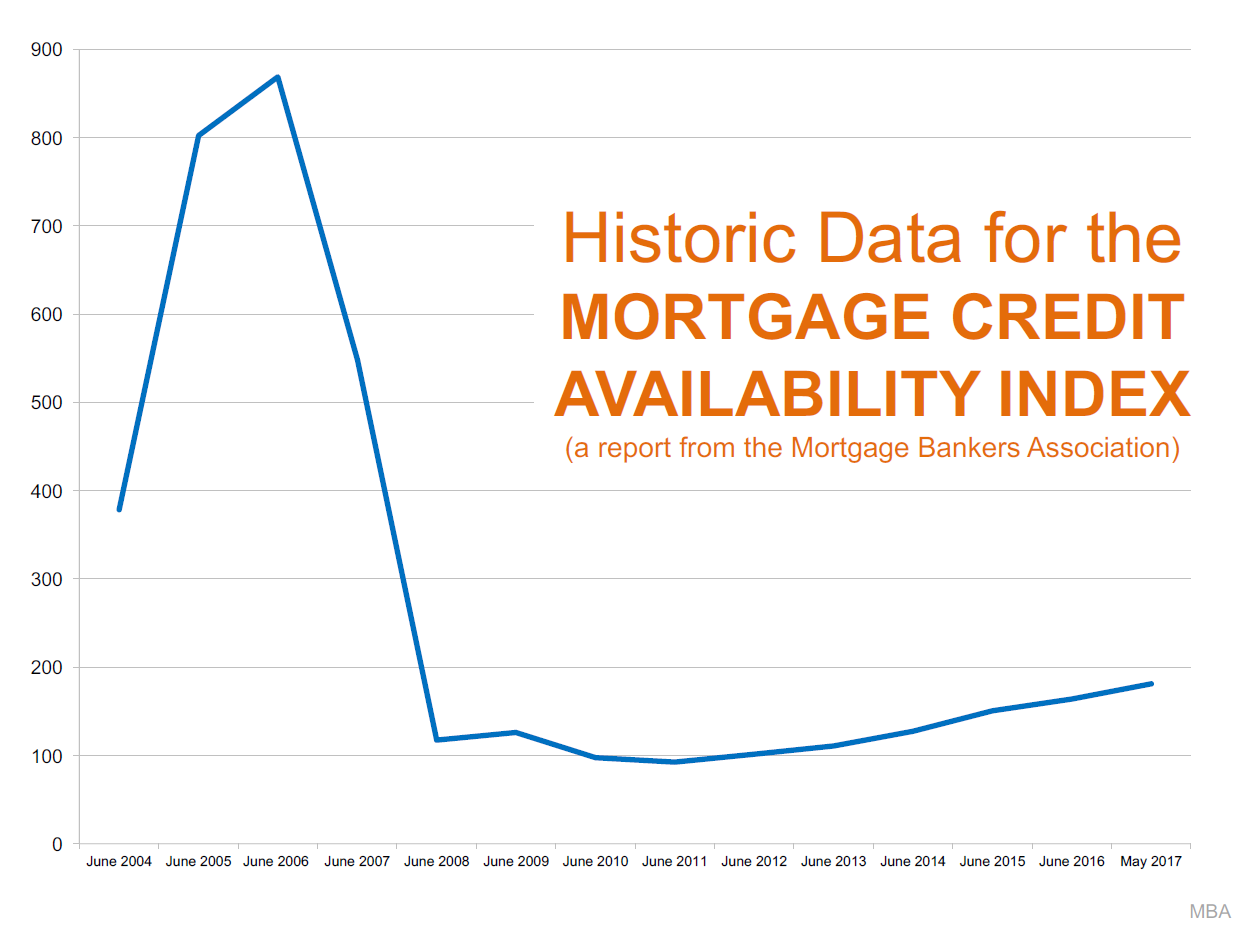 As this graph shows, lending requirements are much more stringent now than what they were prior to the fall of the housing market.
Previous lending practices allowed people to get into homes with risky debt-to-income ratios, low credit scores and undocumented incomes. They called this sub-prime lending. A large part of why the housing bubble burst 10 years ago was due to people getting into mortgages they were not equipped to handle, which lend to the eventual fall of sub-prime lending. Currently, the average credit score of secured mortgages over the last 12 months according to Ellie Mae was 724. During the days of sub-prime lending people were funding loans with scores as low as 560! This, coupled with many zero-down loan programs and the risky terms mentioned above left many new homeowners with little to no equity. When you have little or no equity it very easy to just walk away.
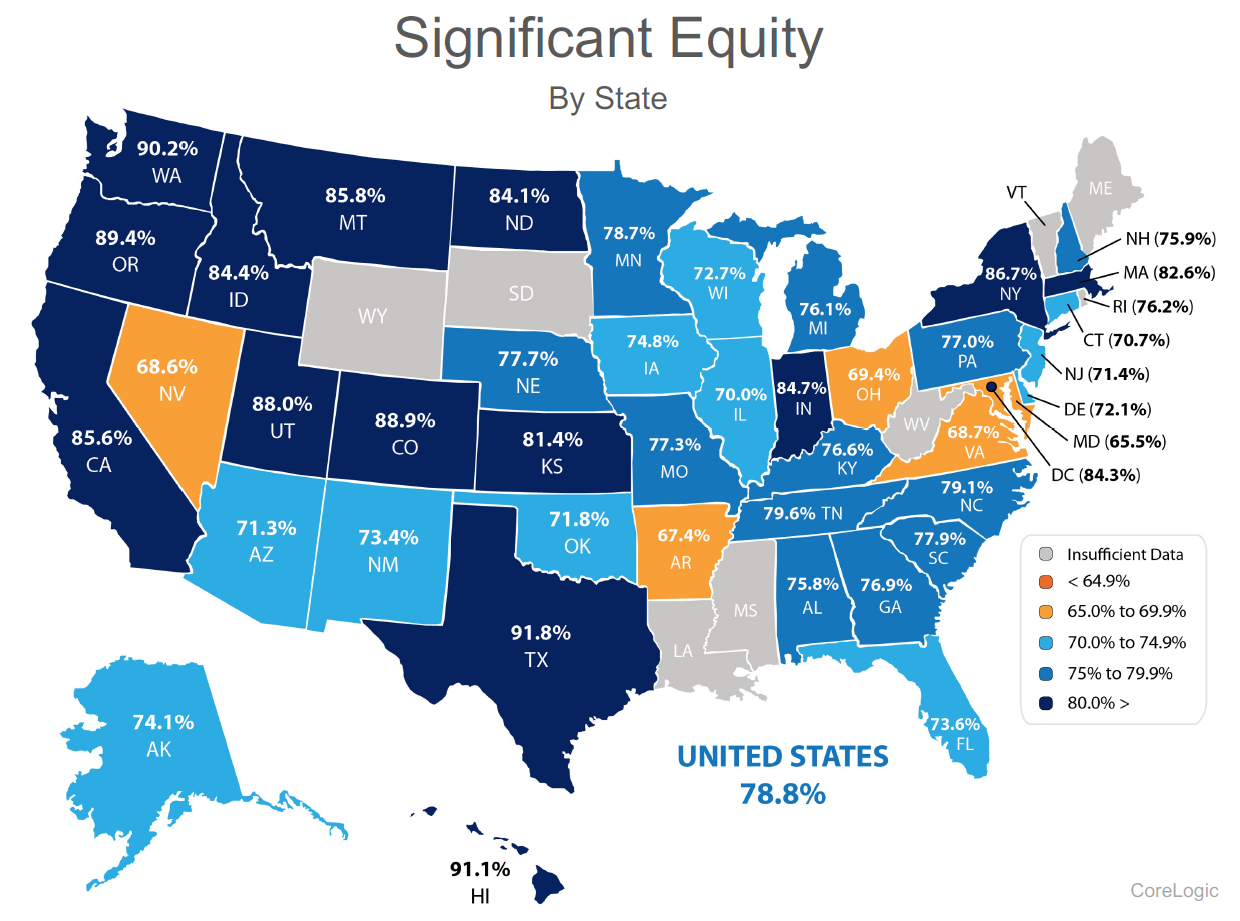
The graph above shows the percentage of homes in our state with significant equity (20% or more) according to CoreLogic. Today many homeowners, especially in our region are making large down payments to begin with. Believe me, when competing with multiple offers on a house, the size of down payment matters – hence many buyers landing homes today are making large down payments. Unlike the market prior to the crash, when people have high equity levels they are not likely to abandon their home or miss payments.
2. Inventory Levels & 3. Our Job Market
The biggest challenge in our market has been low inventory levels and high housing demand. It’s simply the concept of supply and demand. Our thriving job market has afforded folks already in our area the ability to make moves, and it is bringing people into our area from other parts of the country. Washington State’s net in-migration is 43% higher than it was 10 years ago. This has created increased demand, especially for homes closer to job centers resulting is shorter commutes. When you have increased demand and not enough homes to absorb the buyers, prices go up. Over the last three years we have easily seen a 10% increase in prices year-over-year. That is above the norm and should slow down as inventory increases. As inventory increases we anticipate a leveling out of appreciation rates to historical norms of 3-4% annually, but not decreasing home values like the 2008-2010 crash.
 We understand that the recent increase in home prices has been big and that it might remind you of the previous up market before the crash. Hopefully digging into the topics above has shed some light on how it is different. According to Matthew Gardner, Windermere’s Chief Economist and nationally sought after expert on all things real estate, buyers should not wait this market out, due to future price appreciation and today’s historically low interest rates. Check out his latest vlog that addresses this topic.
As always, it is our goal to help keep the community informed, and empower strong decisions. Please let us know if we can answer any questions or help you or anyone you know with their real estate needs.
You’d Like to Sell Your Home, but Where to Next… and How?


Homeowners across our region are enjoying very healthy equity levels due to an upswing in the real estate market over the last five years. In fact, the median price in King County is up 50% over the last five years and up 47% in Snohomish County. This growth in equity has given homeowners the exciting option to sell their home for a high price and move on to their next chapter, such as a move-up, down-size or second home. This price growth is great news and provides many opportunities, however we have also faced some challenges in how to make these transitions.
Our biggest challenge in the marketplace right now is inventory levels; sometimes requiring a buyer to compete in multiple offers for their next home. Currently King County sits at 0.7 months of inventory and 0.8 in Snohomish. Historically, buyers that are also sellers would commonly secure a new home contingent on the sale of their current home. Meaning the seller of the new home they are buying would give them a month or so to get their current house sold in order to buy theirs. Well in this market, that is only rarely an option. So, the million-dollar question is this: how does one who has gained so much equity, now itching to get that bigger house, different location, or perfect rambler for settling into retirement, make this transition without having to move twice? We need to get creative and have a strategy. Two options that have recently proved to be successful, are negotiating a rent-back for sellers or using the Windermere Bridge Loan program.
First, negotiating a rent-back has become a great option for someone who needs to first sell their current home in order to buy. The way it works is we put their home on the market, price it competitively to create demand, and ask for a rent-back as one of the preferred terms. If this rent-back is successfully negotiated, then the seller closes on their home and collects their funds, but gets to stay in the house anywhere from 30-60 days. This enables the seller, who is now a buyer, to have their cash in-hand, time to find a new house, get it under contract and close the sale when their rent-back is ending. This eliminates the need to move twice. There is a bit of calculated risk in this plan, but we’ve seen it work several times, always with a plan B ready just in case. Rarely has plan B needed to be executed, and often times we’ve even been able to pay little to no rent during this time.
The second option is the Windermere Bridge Loan program. This is an amazing tool for homeowners that own their homes free and clear, or have paid down their debt quite a bit. This is a low-cost alternative to pull the equity out of one’s house prior to selling it in order to make a non-contingent offer. The way it works is we take the market value of the house the homeowner current lives in, established by a comparative market analysis completed by your Windermere agent and signed off by the Broker. We then take 65% of that value and subtract any debt owed, and that is the maximum amount the homeowner can borrow for their next down payment. They can then make a non-contingent offer on a new home. What is really great about this, is that it doesn’t require an appraisal (like a HELOC does), and these can easily be turned around in 3-5 business days. This tool provides the opportunity to quickly and inexpensively pull your equity out, be competitive, and eliminates the double move.
The fees associated with this program are a 1% loan fee on the equity that is pulled, a title report, and interest that is incurred between the loan funding and being paid off once the subject home is sold. That interest is conveniently wrapped up in the closing costs when they close the sale of their home, eliminating the need to make monthly interest payments. In a strategy that is somewhat mind blowing- we can sometimes use these bridge loans and never have to actually fund them. For example, if we secure a property non-contingent with the bridge loan and immediately get the subject home on the market, we can often secure a sale with a simultaneous closing, and never have to fund the loan. This eliminates the loan fee, interest, and the need to carry two mortgages.
If you are excited about equity levels and today’s low interest rates and have thought about making that move you’ve been waiting for, but have been fearful of how to do it all – we can help. These two options, along with great attention to detail, hand-holding, and careful planning have helped many people make these exciting transitions. It is our goal to help keep our clients informed and empower strong decisions. Please contact any one of our agents if you would like further information on how this might work for you or someone you know.
Affordability: Commute Times & Interest Rates
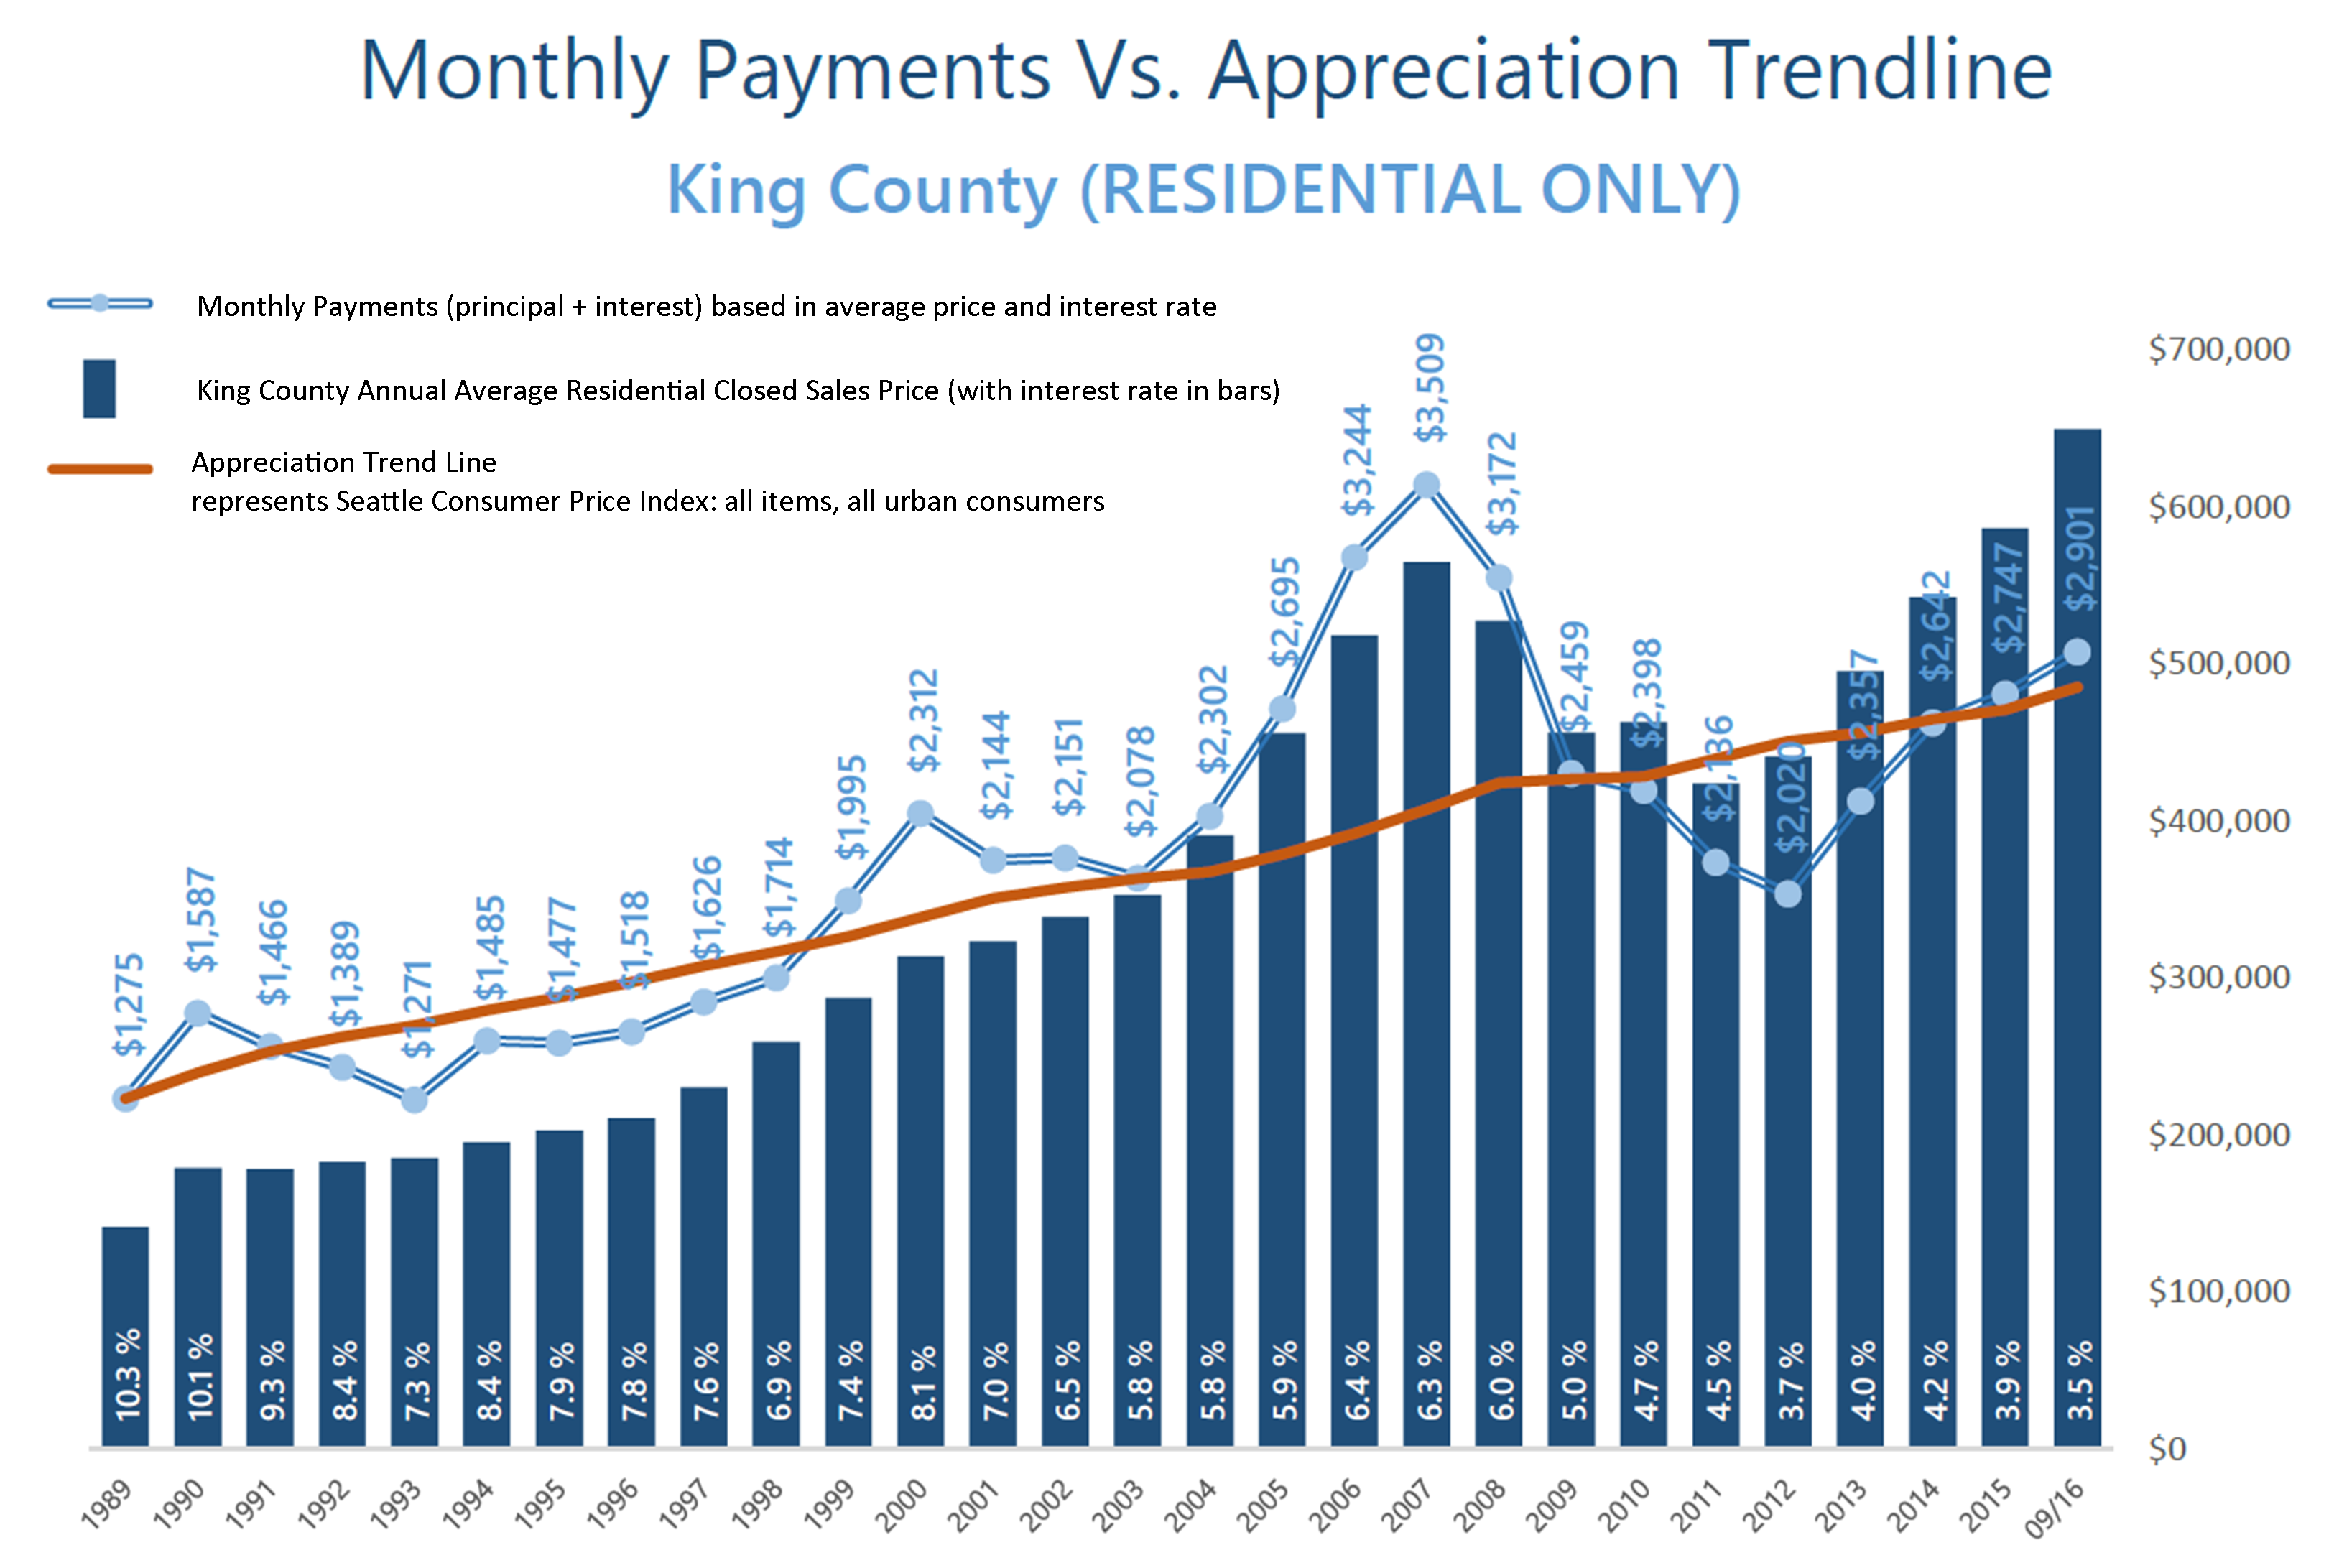
 These graphs illustrate the brass tacks of affordability between King and Snohomish Counties, measured by the average monthly payment. Most recently in September, the average monthly payment was 35% higher in King County compared to Snohomish County. What is fascinating, though, is comparing today’s average monthly payment to peak monthly payments back in 2007! In King County, monthly payments are currently 21% less than during the peak, and in Snohomish County, 36% less. That is a lot of saved monthly overhead. Note that this has everything to do with today’s historical interest rates, as average prices are higher now than in 2007. When one buys or refinances a house, they are not only securing the property, but securing the rate for the life of the loan.
Close proximity to the work place and affordability is often near the top of a buyer’s list of preferred features. 2016 has continued to be a year when commute times to major job centers widened the price divide between key market areas in the greater Seattle area. Over the last 12 months, the average sales price for a single-family residential home in the Seattle Metro area was $696,000! In south Snohomish County (Everett to the King County line), the average sales price for a single-family residential home was $471,000 – 48% less than Seattle Metro. Further, if you jump across Lake Washington to the Eastside, the average sales price for a single-family residential home was $881,000 – 27% more than Seattle Metro!
The “drive to qualify” mentality has been proven by the pending sales rate in south Snohomish County over the last 12 months. Pending sales are up 7% complete year-over-year, whereas in Seattle Metro pending sales are down 1%, and down 2% on the Eastside. We believe this is a result of affordability, more inventory choices in south Snohomish County, new construction options, lower taxes, strong school district choices, and manageable commute times. Newer transit centers and telecommuting have also opened up doors to King County’s little brother to the north as well. If you are curious about possible commute times, you can search for properties on our website based on commutes times, which is a feature provided by INRIX Drive Time. Also, we track the market in several ways, so if the graphs here are interesting to you, any of our agents would be happy to provide additional information relative to your specific neighborhood. Please contact us anytime, as it is our goal to help keep you informed and empower you to make strong real estate decisions.
