
 Facebook
 X
X
 Pinterest
 Copy Link
Quarterly Market Trends: North Snohomish County
Q4 2017
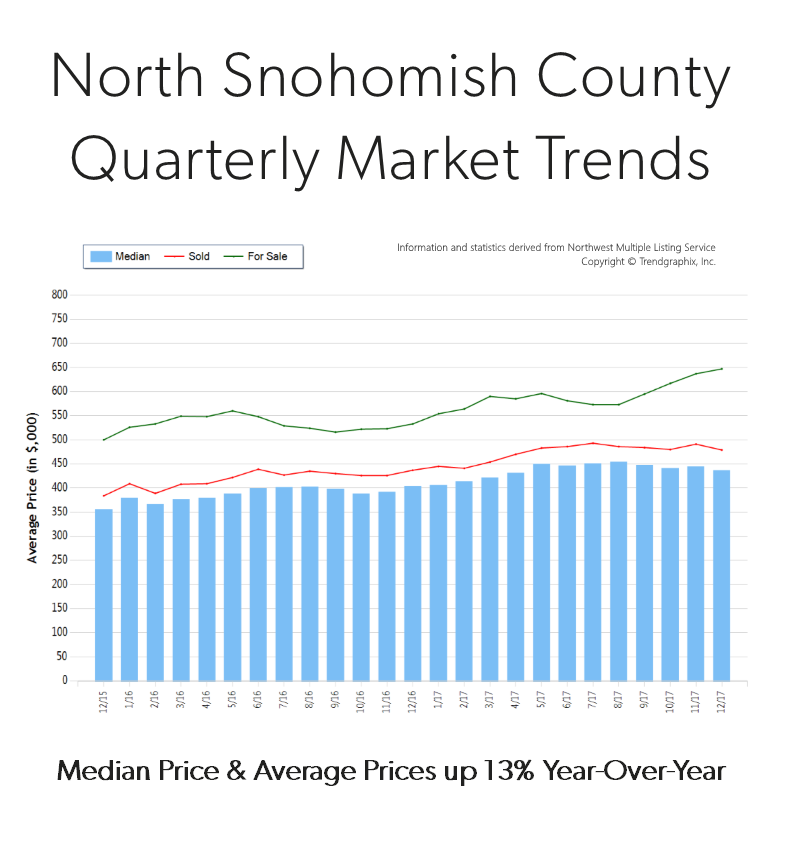
 Price growth was particularly strong in 2017! Median and average prices were up 13% over 2016. Median price in 2017 landed at $371,000 and the average at $400,000. The average amount of days it took to sell a house in 2017 was 35 days, which is 10% faster than 2016. The average list-to-sale price ratio over the last year was 99%, with the spring months as high as 101%! In 2017, inventory growth continued to be a challenge, with an 8% decrease in new listings compared to 2016. Even with inventory limitations there were 3% more sales! This phenomenon illustrates strong buyer demand and a need for more listings.
North Snohomish County real estate has seen a steady stream of buyers come our way due to affordability and quality of life. In fact, the median price in 2017 was 37% higher in south Snohomish County. Historically low interest rates continue to drive the market as well, they have helped offset the increase in prices. Sellers are enjoying great returns due to this phenomenon and buyers are securing mortgages with minor debt service.
This is only a snapshot of the trends in north Snohomish County; please contact us if you would like further explanation of how the latest trends relate to you.
6 Predictions for the 2018 Housing Market & Economy Header


At Windermere, we have the privilege of working with esteemed economist, Matthew Gardner. Throughout the year, I have shared his quarterly Gardner Reports which delineate out all the different housing markets in Western Washington and reports on price appreciation and sales data. Below is a recent article he wrote about predictions for the 2018 real estate market; which was picked up by several news sources, including Inman News.
As a bonus, I recently had the opportunity to chat with him and get some specific insights on the Greater Seattle real estate market for 2018 and have included those at the end of this article. 2018 looks to be another strong year in real estate. If you are curious about how the market might affect your bottom line, please contact me. It is my goal to help keep my clients informed, empower strong decisions and create exceptional results. Here’s to a very happy New Year!
What Can We Expect From the 2018 Housing Market?
by Matthew Gardner, Chief Economist, Windermere Real EstateMillennial Home Buyers
Last year, I predicted that the big story for 2017 would be millennial home buyers and it appears I was a little too bullish. To date, first-time buyers have made up 34% of all home purchases this year – still below the 40% that is expected in a normalized market. Although they are buying, it is not across all regions of the country, but rather in less expensive markets such as North Dakota, Ohio, and Maryland.For the coming year, I believe the number of millennial buyers will expand further and be one of the biggest influencers in the U.S. housing market. I also believe that they will begin buying in more expensive markets. That’s because millennials are getting older and further into their careers, enabling them to save more money and raise their credit profiles.
Existing Home Sales
As far as existing home sales are concerned, in 2018 we should expect a reasonable increase of 3.7% – or 5.62 million housing units. In many areas, demand will continue to exceed supply, but a slight increase in inventory will help take some heat off the market. Because of this, home prices are likely to rise but by a more modest 4.4%.New Home Sales
New home sales in 2018 should rise by around 8% to 655,000 units, with prices increasing by 4.1%. While housing starts – and therefore sales – will rise next year, they will still remain well below the long-term average due to escalating land, labor, materials, and regulatory costs. I do hold out hope that home builders will be able to help meet the high demand we’re expecting from first-time buyers, but in many markets it’s very difficult for them to do so due to rising construction costs.Interest Rates
Interest rates continue to baffle forecasters. The anticipated rise that many of us have been predicting for several years has yet to materialize. As it stands right now, my forecast for 2018 is for interest rates to rise modestly to an average of 4.4% for a conventional 30-year fixed-rate mortgage – still remarkably low when compared to historic averages.Tax Reform
There are changes to the income tax structure that could potentially have a significant impact on homeowners and the housing market. The first is the mortgage interest rate deduction which will be capped at $750,000 – down from $1,000,000. In theory this can be considered a tax on wealthy households, but there have been nearly 100,000 home sales this year where the mortgage loan was over $750,000 (almost 4% of total sales), so the effect will be felt more broadly.That said, this change will disproportionately affect high-cost markets in California, New York, and Hawaii, and to a somewhat lesser degree, it will also be felt in Seattle, and parts of Colorado and Arizona. The capping of the deduction for state and local property taxes (SALT) at $10,000 will also negatively impact states with high property taxes, such as California, New York, and New Hampshire.
The final tax bill also eliminates the deduction for interest on home equity loans which is currently allowed on loans up to $100,000. This is significant because it will largely affect the growing number of homeowners who are choosing to remodel their home rather than try to find a new home in supply-starved markets like Seattle.
While these measures will likely have a dampening effect on housing, I do not believe they will lead to a substantial drop in home values. However, there is a concern that it will lead to fewer home sales, as households choose to stay put so they can continue to take advantage of the current mortgage interest deduction. The result could be fewer listings, which could actually cause home prices to rise at above-average rates for a longer period of time.
Housing Bubble
I continue to be concerned about housing affordability. Home prices have been rising across much of the country at unsustainable rates, and although I still contend that we are not in “bubble” territory, it does represent a substantial impediment to the long-term health of the housing market. But if home price growth begins to taper, as I predict it will in 2018, that should provide some relief in many markets where there are concerns about a housing bubble.In summary, along with slowing home price growth, there should be a modest improvement in the number of homes for sale in 2018, and the total home sales will be higher than 2017. First-time buyers will continue to play a substantial role in the nation’s housing market, but their influence may be limited depending on where the government lands on tax reform.
https://www.windermere.com/blogs/windermere/posts/1701
Gardner, Matthew. “What Can We Expect From The 2018 Housing Market?” Windermere Real Estate. Windermere.com, 8 December 2017. Web. 27 December 2017.
A Conversation with Matthew
It is always a pleasure to talk with Matthew. We recently discussed his thoughts on the Greater Seattle real estate market and what he sees shaping up for 2018.
Millennial homebuyers were more of an influence in the Greater Seattle market in 2017 because of the robust hiring that corporations such as Amazon have made. He thinks that this will continue to grow in 2018, because the cost of rent continues to rise at a rapid pace and in many cases owning makes superior financial sense. For example, it is not unheard of to pay $3,000 a month in rent for a unit in South Lake Union. While this eliminates a commute, it is an incredibly costly payment that goes entirely towards the landlord’s investment. If one is willing and able to pay that much in rent, it is important to look at the fact that that number is equivalent to a mortgage payment on a $550,000 home! He predicts that we will see more millennial homebuyers move out to the more traditional suburbs to start building their wealth in real estate. Ideally, Millennials would love to live in “ex-urban” areas that are still close to their places of work; however, listings are slim and prices very high for this type of product.Therefore, he expects to see Millennials having to look at the suburbs when deciding where to buy.
In 2017, net in-migration totaled 50,000 in the Greater Seattle area. Matthew predicts that we will see the same in 2018 due to our robust job market and Californians continuing to move to the area. Employment in the region will continue to expand, but at lower rates than seen in 2017. That said, he sees more wage growth than job growth in 2018 as companies have done so much hiring over the last 3 years, and now they are focused on maintaining their employee base. Amazon has signed on to occupy 5 million additional square feet of space over and above the 8+ million square feet that they currently occupy, so we will continue to see job growth there. The unemployment rate will stay below 4% in 2018.
Matthew believes we will see a slight increase in inventory taking our market to hot from boiling. Some new construction will help this increase and he does expect to see some Baby Boomers deciding to either cash-out and leave the area, or downsize. This inventory growth should temper price growth and increase sales by 6%. In 2017, we saw a year-over-year price appreciation rate of 13% in the Greater Seattle area, and he predicts 8-8.5% for 2018. This is still well above the normal rate of 5.5%, but certainly much more sustainable than 13%!
Lastly, Matthew is adamant that we are not headed toward another bubble. The average down payment in the Greater Seattle area is now over $100,000 and home owners have great equity positions, which is a critical ingredient to a non-bubble market. Additionally, credit is still very tight and buyers are very highly qualified, and the rampant speculation that is the key sign of a bubble is not being seen locally. His biggest concern is affordability, and that we need to continue to find ways to create more housing through zoning changes and decreasing the cost of regulation for builders. This density would create more affordable housing.
3 Reasons why we are NOT Headed Towards Another Bubble


Are we headed for another housing collapse?
We get asked this question often, and we can understand why. With the 2008 Great Recession not too far back in our rear-view mirror it is understandable that folks don’t want history to repeat itself, as that was a very painful time for many. Also, price appreciation has been rapid across the country, but especially in our region. The large price gains might seem familiar to the gains of the previous up market of 2004-2007, but the environment is much different. Here are three reasons why we are not headed towards (or in) another real estate bubble:
1. Lending Requirements
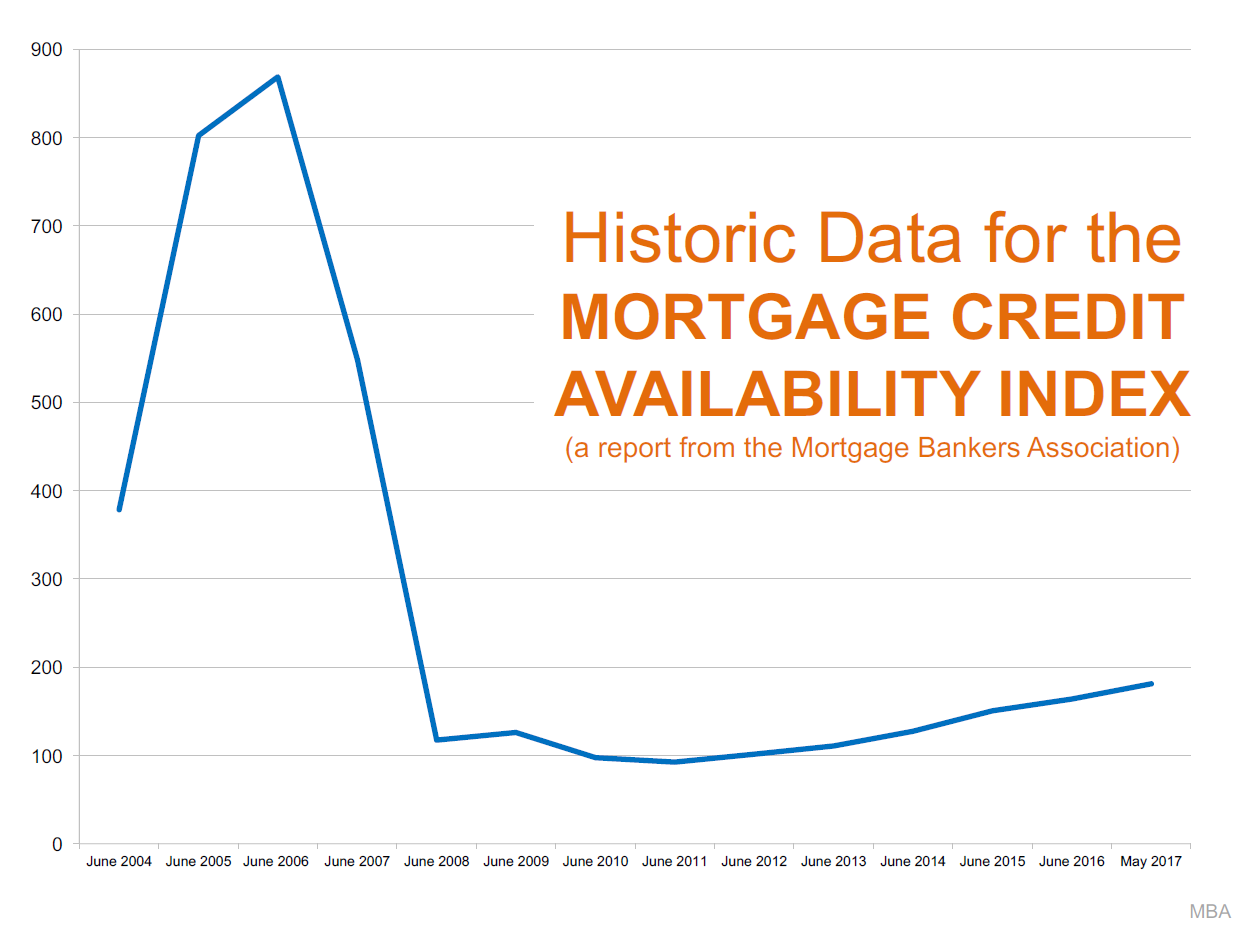 As this graph shows, lending requirements are much more stringent now than what they were prior to the fall of the housing market.
Previous lending practices allowed people to get into homes with risky debt-to-income ratios, low credit scores and undocumented incomes. They called this sub-prime lending. A large part of why the housing bubble burst 10 years ago was due to people getting into mortgages they were not equipped to handle, which lend to the eventual fall of sub-prime lending. Currently, the average credit score of secured mortgages over the last 12 months according to Ellie Mae was 724. During the days of sub-prime lending people were funding loans with scores as low as 560! This, coupled with many zero-down loan programs and the risky terms mentioned above left many new homeowners with little to no equity. When you have little or no equity it very easy to just walk away.
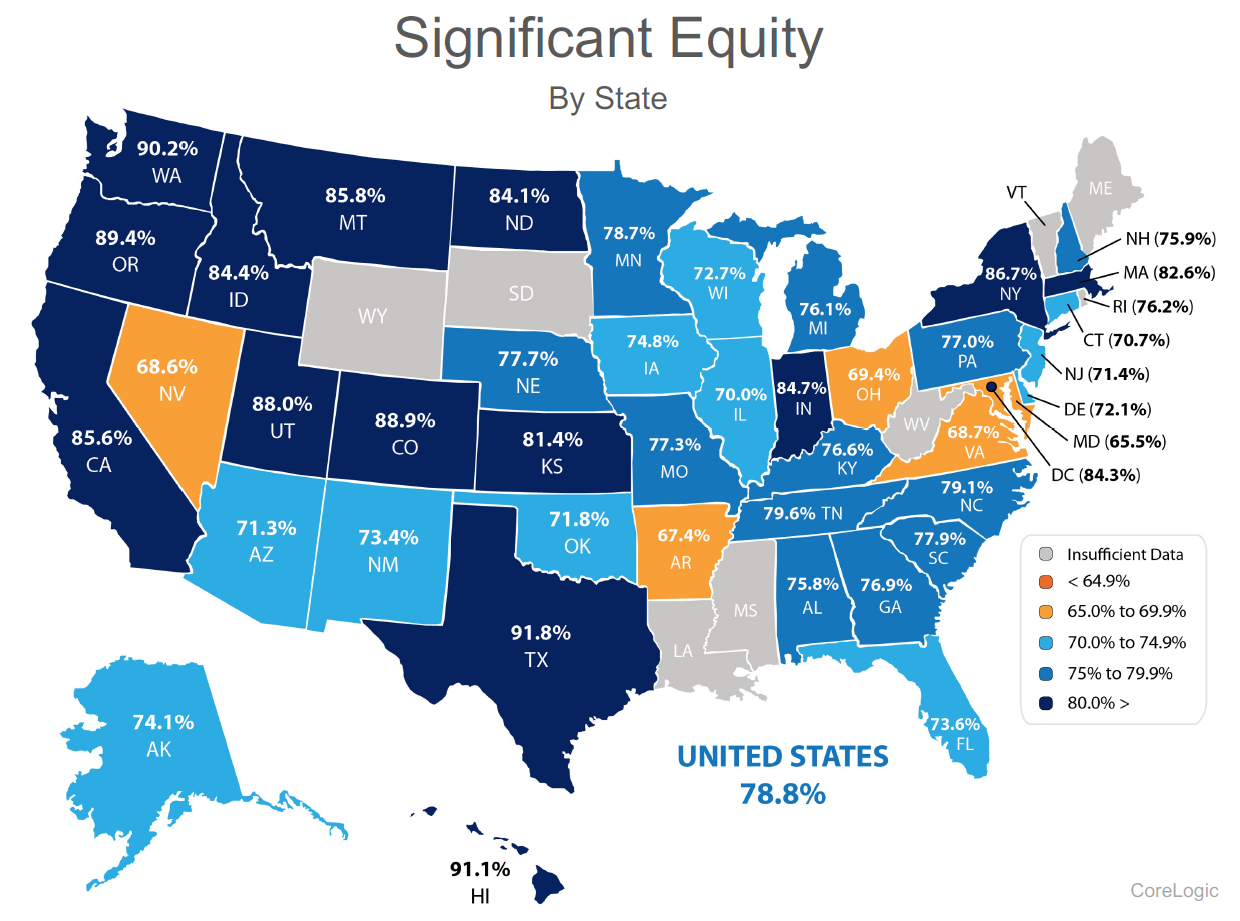
The graph above shows the percentage of homes in our state with significant equity (20% or more) according to CoreLogic. Today many homeowners, especially in our region are making large down payments to begin with. Believe me, when competing with multiple offers on a house, the size of down payment matters – hence many buyers landing homes today are making large down payments. Unlike the market prior to the crash, when people have high equity levels they are not likely to abandon their home or miss payments.
2. Inventory Levels & 3. Our Job Market
The biggest challenge in our market has been low inventory levels and high housing demand. It’s simply the concept of supply and demand. Our thriving job market has afforded folks already in our area the ability to make moves, and it is bringing people into our area from other parts of the country. Washington State’s net in-migration is 43% higher than it was 10 years ago. This has created increased demand, especially for homes closer to job centers resulting is shorter commutes. When you have increased demand and not enough homes to absorb the buyers, prices go up. Over the last three years we have easily seen a 10% increase in prices year-over-year. That is above the norm and should slow down as inventory increases. As inventory increases we anticipate a leveling out of appreciation rates to historical norms of 3-4% annually, but not decreasing home values like the 2008-2010 crash.
 We understand that the recent increase in home prices has been big and that it might remind you of the previous up market before the crash. Hopefully digging into the topics above has shed some light on how it is different. According to Matthew Gardner, Windermere’s Chief Economist and nationally sought after expert on all things real estate, buyers should not wait this market out, due to future price appreciation and today’s historically low interest rates. Check out his latest vlog that addresses this topic.
As always, it is our goal to help keep the community informed, and empower strong decisions. Please let us know if we can answer any questions or help you or anyone you know with their real estate needs.
Affordability: Commute Times & Interest Rates
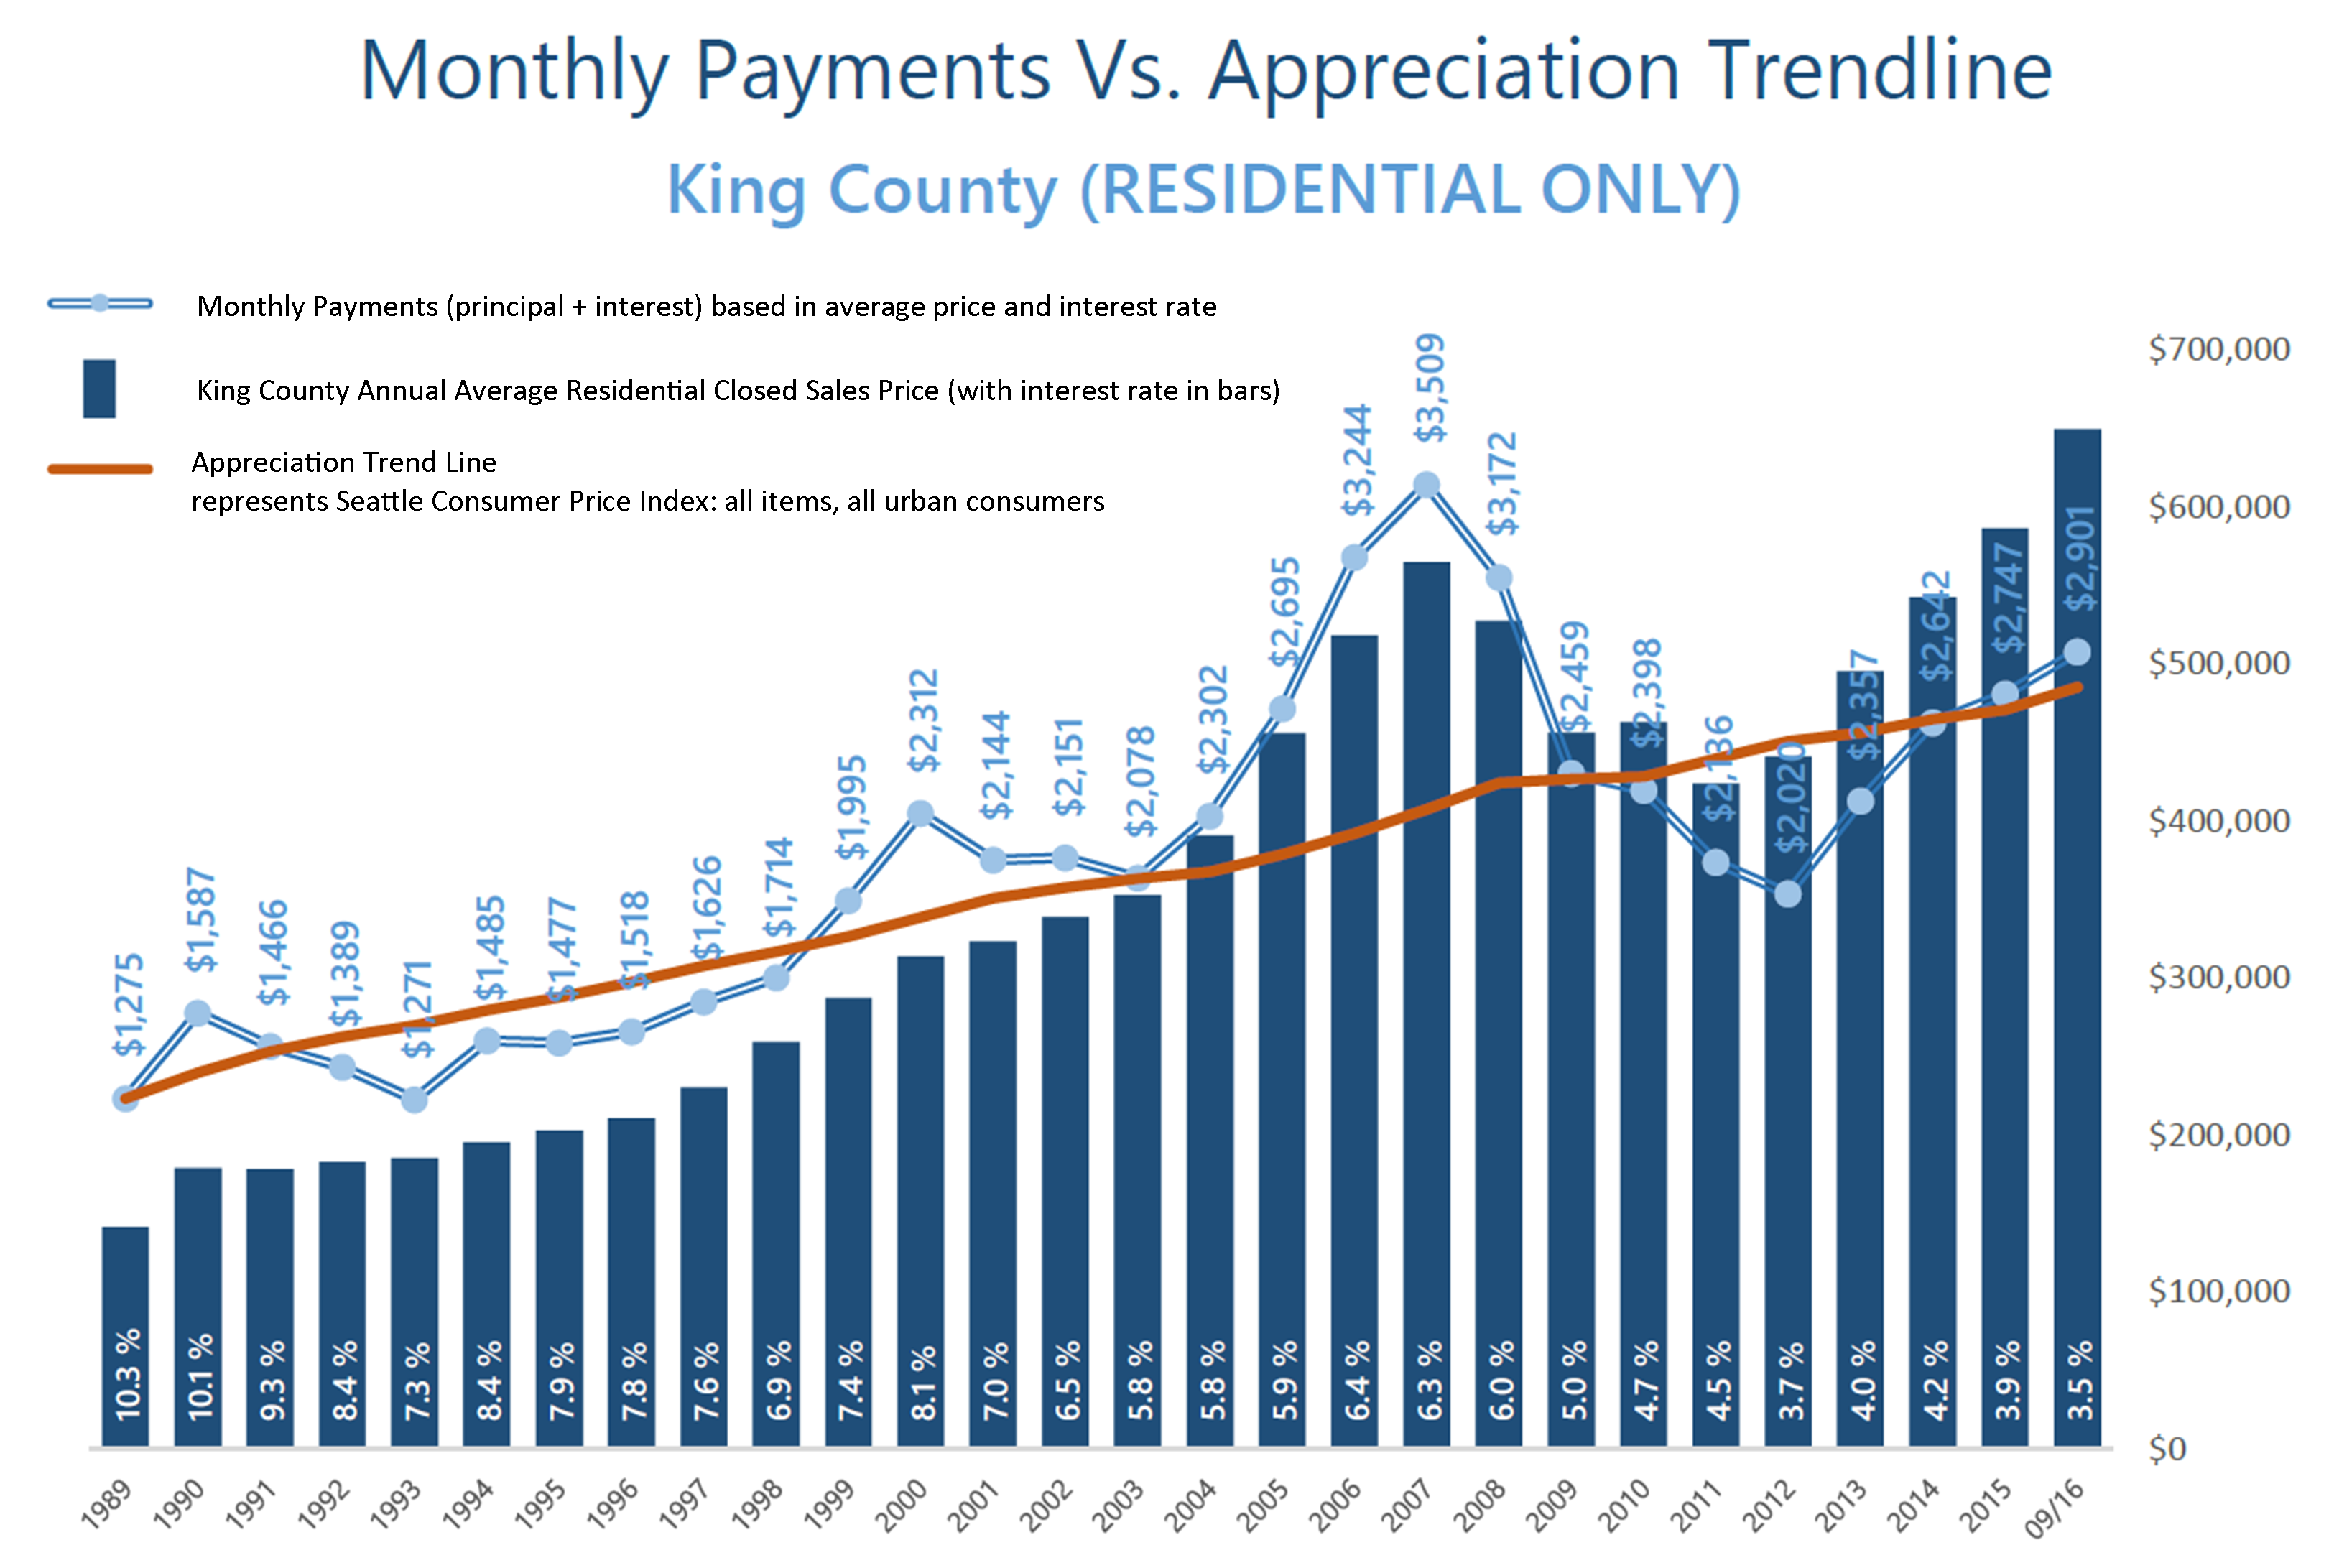
 These graphs illustrate the brass tacks of affordability between King and Snohomish Counties, measured by the average monthly payment. Most recently in September, the average monthly payment was 35% higher in King County compared to Snohomish County. What is fascinating, though, is comparing today’s average monthly payment to peak monthly payments back in 2007! In King County, monthly payments are currently 21% less than during the peak, and in Snohomish County, 36% less. That is a lot of saved monthly overhead. Note that this has everything to do with today’s historical interest rates, as average prices are higher now than in 2007. When one buys or refinances a house, they are not only securing the property, but securing the rate for the life of the loan.
Close proximity to the work place and affordability is often near the top of a buyer’s list of preferred features. 2016 has continued to be a year when commute times to major job centers widened the price divide between key market areas in the greater Seattle area. Over the last 12 months, the average sales price for a single-family residential home in the Seattle Metro area was $696,000! In south Snohomish County (Everett to the King County line), the average sales price for a single-family residential home was $471,000 – 48% less than Seattle Metro. Further, if you jump across Lake Washington to the Eastside, the average sales price for a single-family residential home was $881,000 – 27% more than Seattle Metro!
The “drive to qualify” mentality has been proven by the pending sales rate in south Snohomish County over the last 12 months. Pending sales are up 7% complete year-over-year, whereas in Seattle Metro pending sales are down 1%, and down 2% on the Eastside. We believe this is a result of affordability, more inventory choices in south Snohomish County, new construction options, lower taxes, strong school district choices, and manageable commute times. Newer transit centers and telecommuting have also opened up doors to King County’s little brother to the north as well. If you are curious about possible commute times, you can search for properties on our website based on commutes times, which is a feature provided by INRIX Drive Time. Also, we track the market in several ways, so if the graphs here are interesting to you, any of our agents would be happy to provide additional information relative to your specific neighborhood. Please contact us anytime, as it is our goal to help keep you informed and empower you to make strong real estate decisions.
Market Update – Q3
Inventory levels providing more choices for buyers; is the market starting to stabilize?
As we head into the fall and winter months after an incredibly eventful spring and summer, available inventory levels are starting to ease. It is still a seller’s market (3 months of inventory or less) in most areas, but one that is providing buyers increased options. The increase in available inventory is due to pent-up seller demand starting to come to market. The return of strong equity levels have brought sellers to market that have been waiting to jump in for some time. Continued buyer demand due to our flourishing job market and historically low interest rates have steadily absorbed new inventory, but we are finally starting to see a trend toward some more balance. This is good news! Additionally, lending requirements remain stringent and down payments are bigger, unlike the dreaded bubble market we experienced in 2007/2008. Educated pricing and sound condition is what will drive a buyer’s interest in a home. As the market stabilizes, it will be important for consumers to partner with a broker who closely follows the market to help them make informed decisions and develop winning strategies.
Read below for market details from Snohomish County down through south King County.
Snohomish County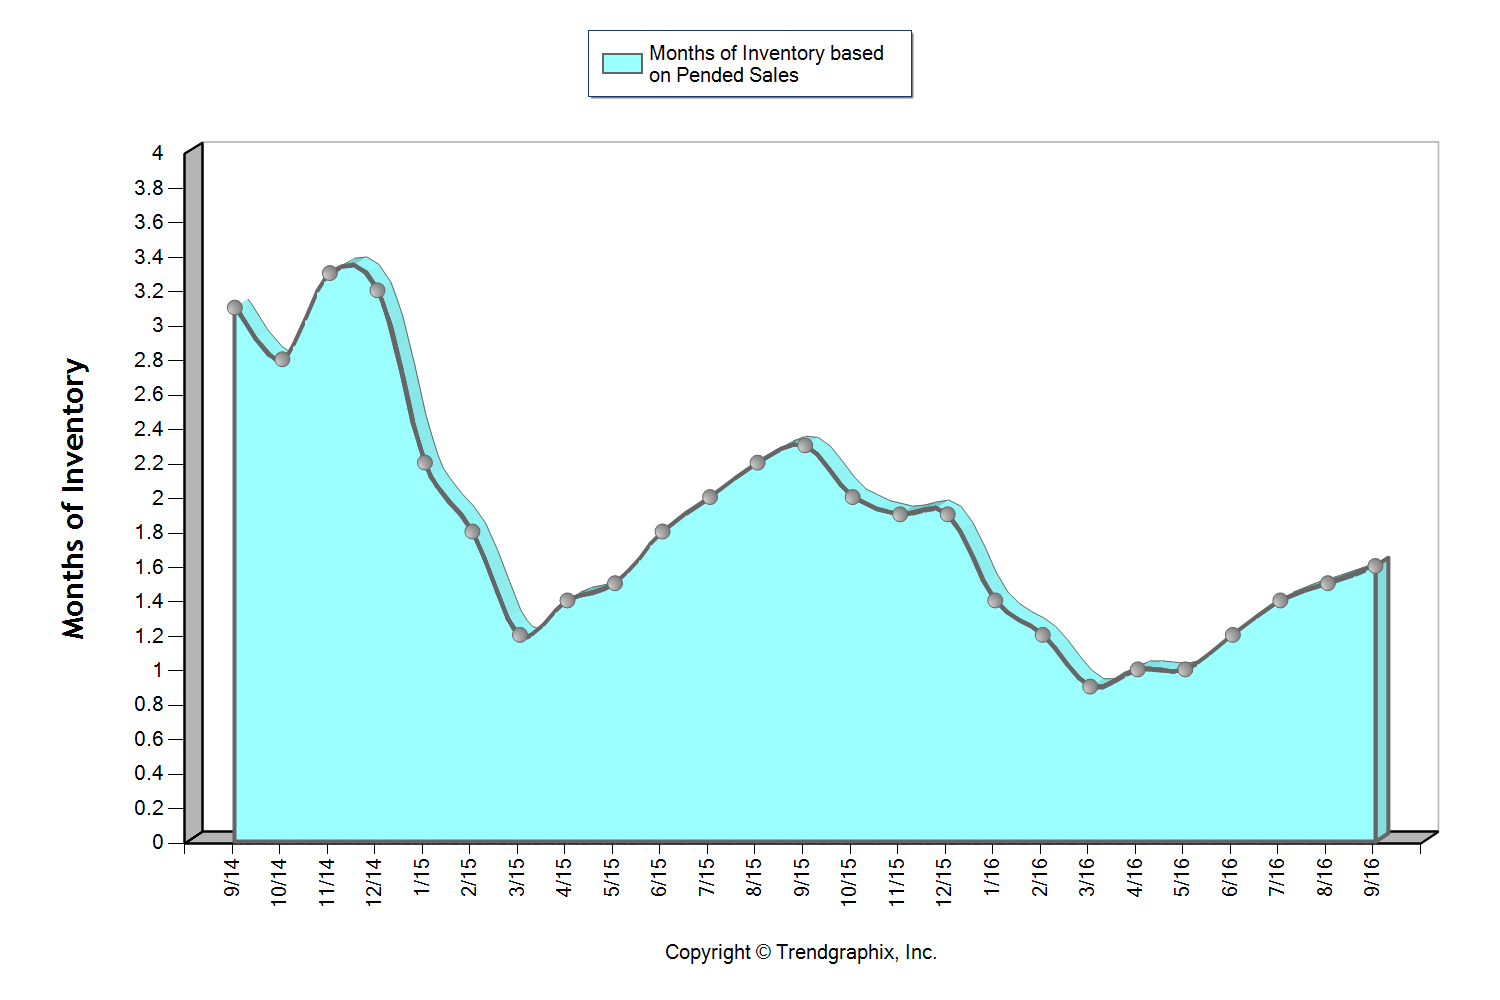
This graph shows that we currently sit at 1.6 months of inventory based on pending sales, which is the highest level we have seen in all of 2016! It is still a seller’s market (3 months or less), but one that is providing buyers increased options. The average cumulative days on market reached 28 days in September, which was up 8% over August. Median price peaked in August at $401,000 and settled at $397,000 in September after hovering between $380,000 and $400,000 since April. For the first time since February, the average list to sale price ratio was 99% after sitting at 100-101% over the last six months.
The return of strong equity levels have brought sellers to market that have been waiting to jump in for some time. In fact, average prices have grown just over 20% over the last two years, freeing up sellers to make the moves they have been waiting for. Continued buyer demand due to our flourishing job market and historically low interest rates have steadily absorbed new inventory, but we are finally starting to see a trend toward some more balance. This is good news! We are still seeing multiple offers and quick market times, but not quite the frenzy that we experienced earlier this year.
All of these factors indicate that we may finally be headed towards a more stabilized market with positive attributes for both buyers and sellers.
South Snohomish County 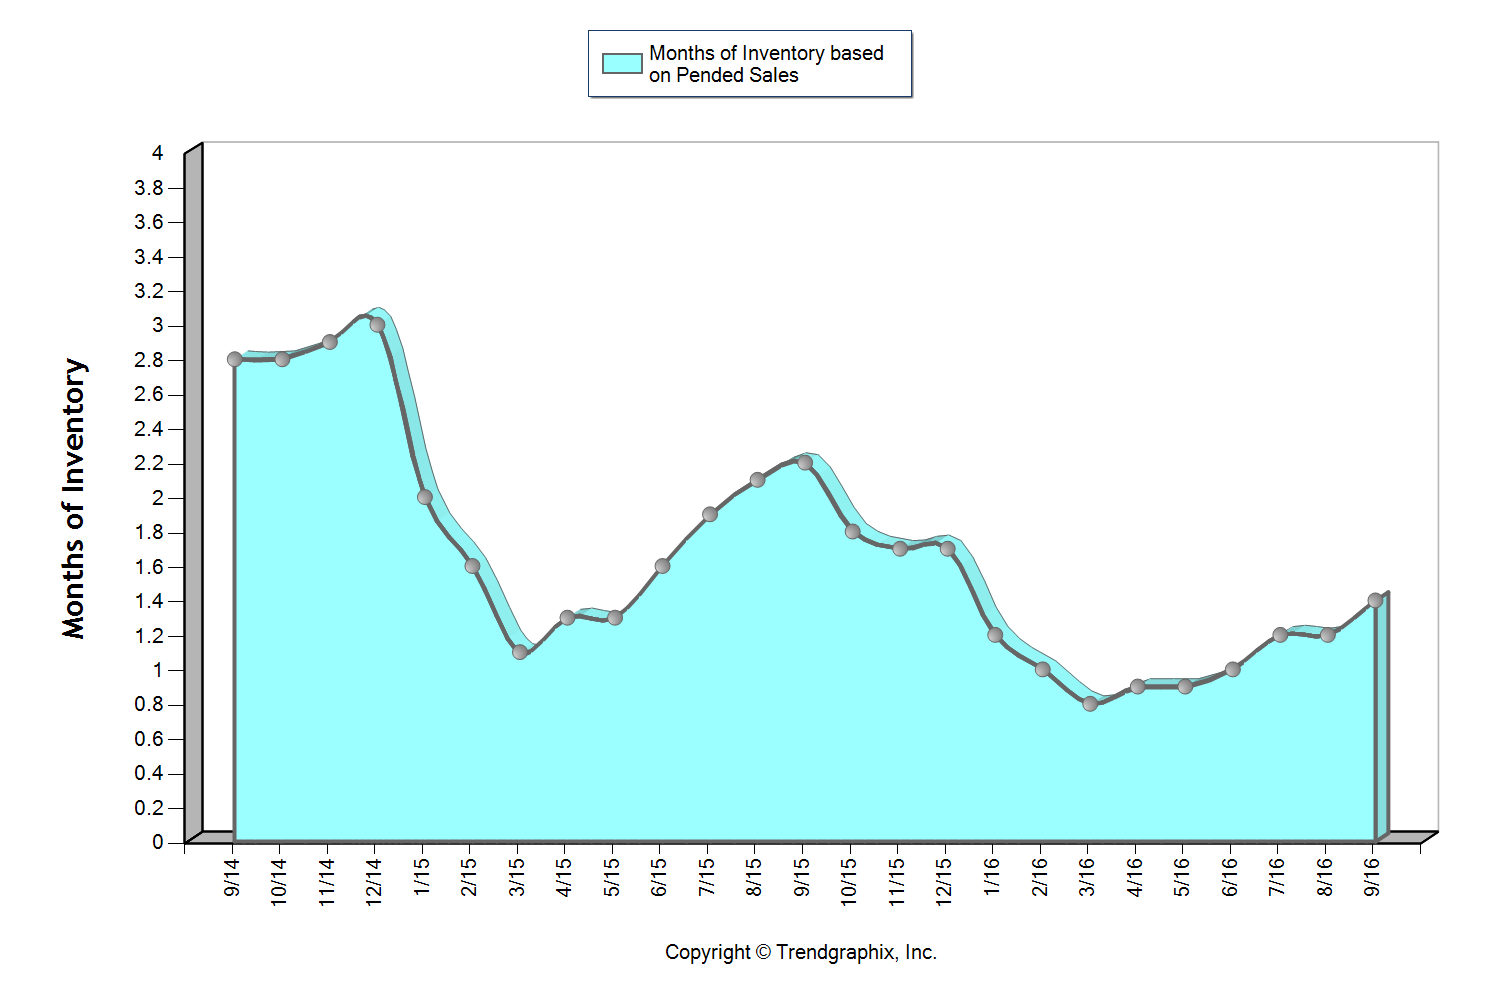
This graph shows that we currently sit at 1.4 months of inventory based on pending sales, which is the highest level we have seen in all of 2016! It is still a seller’s market (three months or less), but one that is providing buyers increased options. The average cumulative days on market reached 24 days in September, which was up 14% over August. Median price peaked in August at $453,000 and settled at $440,000 in September after hovering between $440,000 and $450,000 since March. For the first time since February, the average list to sale price ratio was 99% after sitting at 100-101% over the last six months.
The return of strong equity levels have brought sellers to market that have been waiting to jump in for some time. In fact, average prices have grown just over 20% over the last two years, freeing up sellers to make the moves they have been waiting for. Continued buyer demand due to our flourishing job market and historically low interest rates have steadily absorbed new inventory, but we are finally starting to see a trend toward some more balance. This is good news! We are still seeing multiple offers and quick market times, but not quite the frenzy that we experienced earlier this year.
All of these factors indicate that we may finally be headed towards a more stabilized market with positive attributes for both buyers and sellers.
North King County 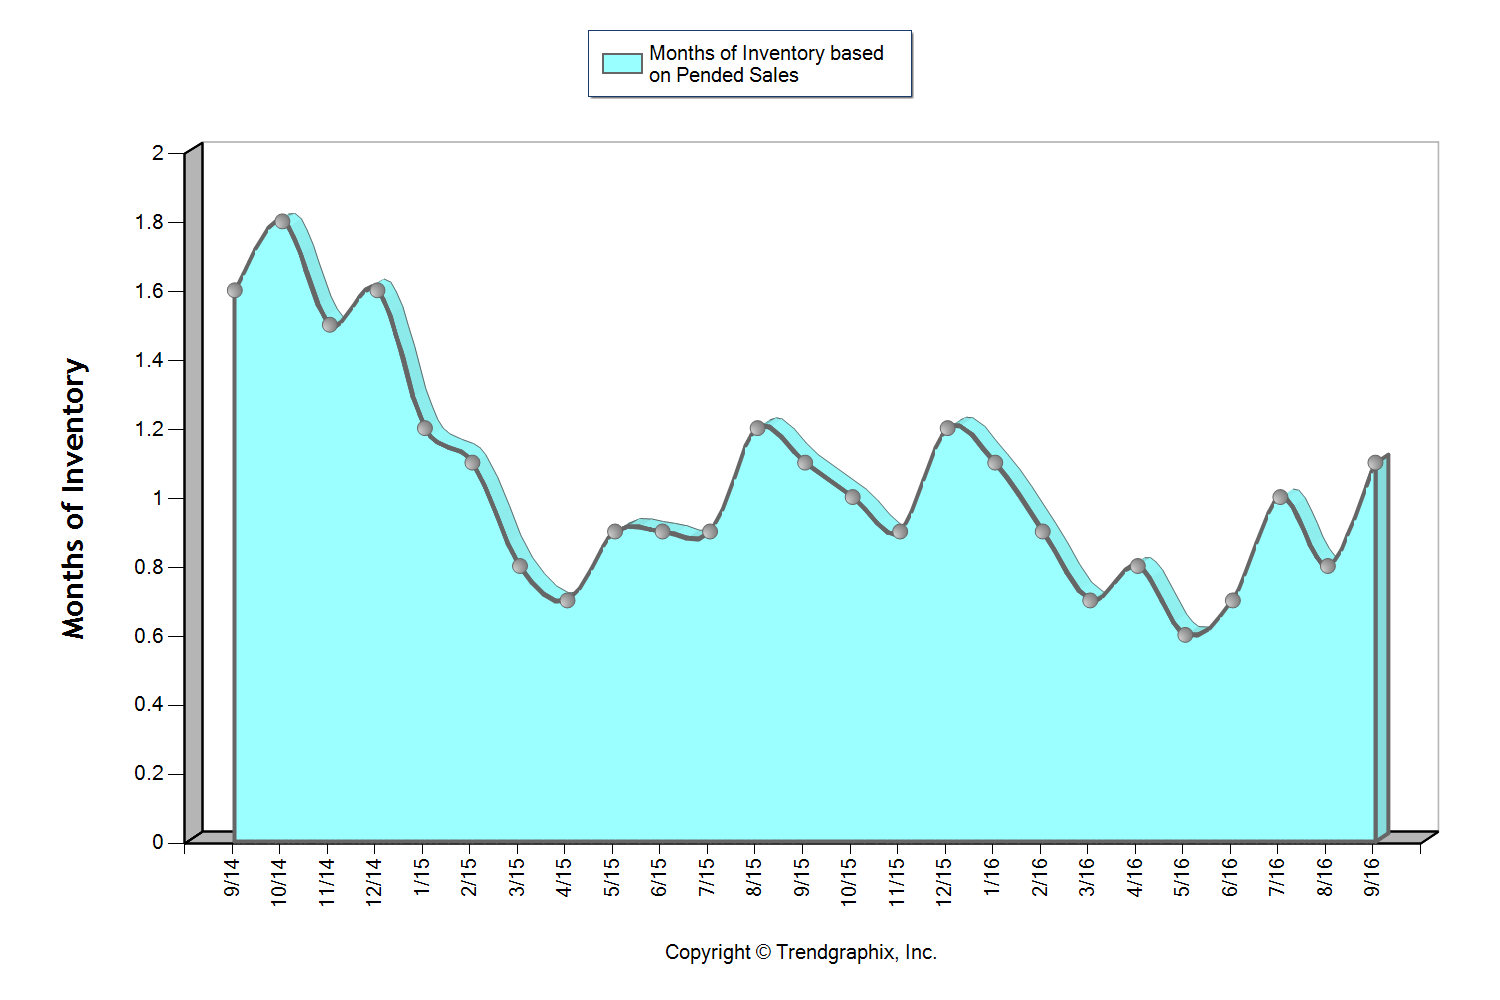
This graph shows that we currently sit at 1.1 months of inventory based on pending sales, which is the highest level we have seen since January! It is certainly still a seller’s market (3 months or less), but one that is starting to provide buyers increased options. In fact, we saw a 13% jump in new listings month-over-month. The average cumulative days on market reached 20 days in September, which was up 18% over August. Median price peaked in June at $650,000 and settled at $600,000 in September after hovering between $605,000 and $650,000 since March. In June, there were 95% more home sales above $1M over September. For the first time since February, the average list to sale price ratio was 101% after sitting at 102-104% over the last seven months.
The return of strong equity levels have brought sellers to market that have been waiting to jump in for some time. In fact, average prices have grown 21% over the last two years, freeing up sellers to make the moves they have been waiting for. Continued buyer demand due to our flourishing job market and historically low interest rates have steadily absorbed new inventory, but we are finally starting to see a trend toward some more balance. This is good news! We are still seeing multiple offers and quick market times, but not quite the frenzy that we experienced earlier this year.
All of these factors indicate that we may finally be headed towards a more stabilized market with positive attributes for both buyers and sellers.
Eastside 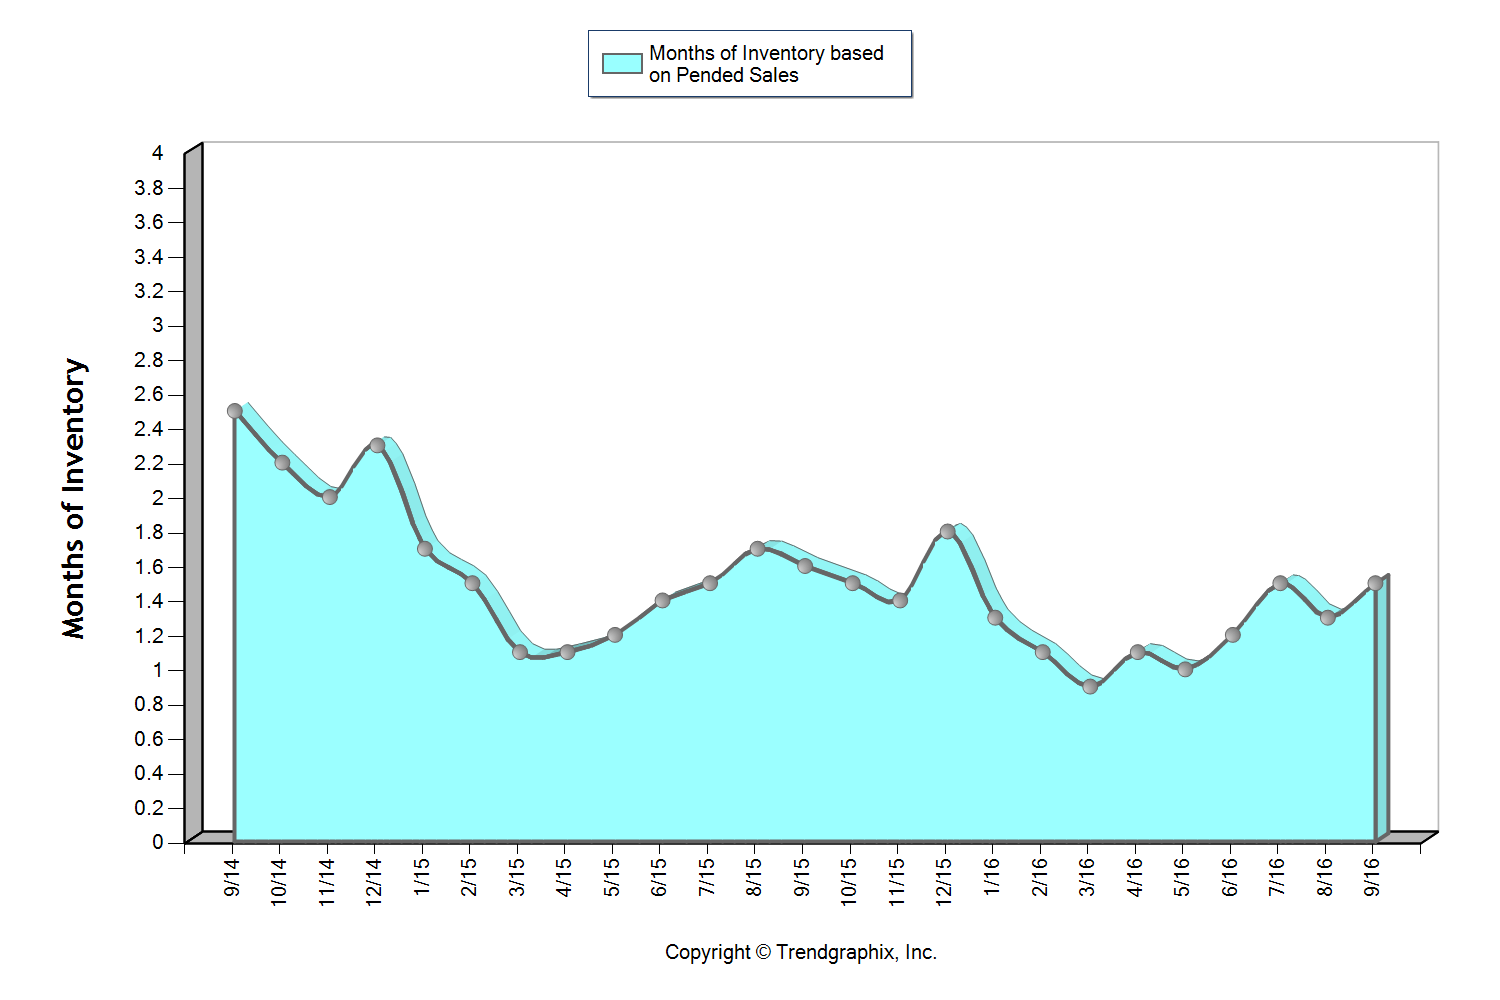
This graph shows that we currently sit at 1.5 months of inventory based on pending sales, which is the highest level we have seen in all of 2016! It is still a seller’s market (3 months or less), but one that is starting to provide buyers increased options. The average cumulative days on market reached 31 days in September which was up 24% over August. Median price peaked in August at $770,000 and settled at $750,000 in September after hovering between $737,000 and $770,000 since March. In June, there were 18% more home sales above $1M over September. Over the last two months, the average list to sale price ratio was 99% after sitting at 101-102% over the five months prior.
The return of strong equity levels have brought sellers to market that have been waiting to jump in for some time. In fact, average prices have grown 25% over the last two years, freeing up sellers to make the moves they have been waiting for. Continued buyer demand due to our flourishing job market and historically low interest rates have steadily absorbed new inventory, but we are finally starting to see a trend toward some more balance. This is good news! We are still seeing multiple offers and quick market times, but not quite the frenzy that we experienced earlier this year.
All of these factors indicate that we may finally be headed towards a more stabilized market with positive attributes for both buyers and sellers.
Seattle Metro 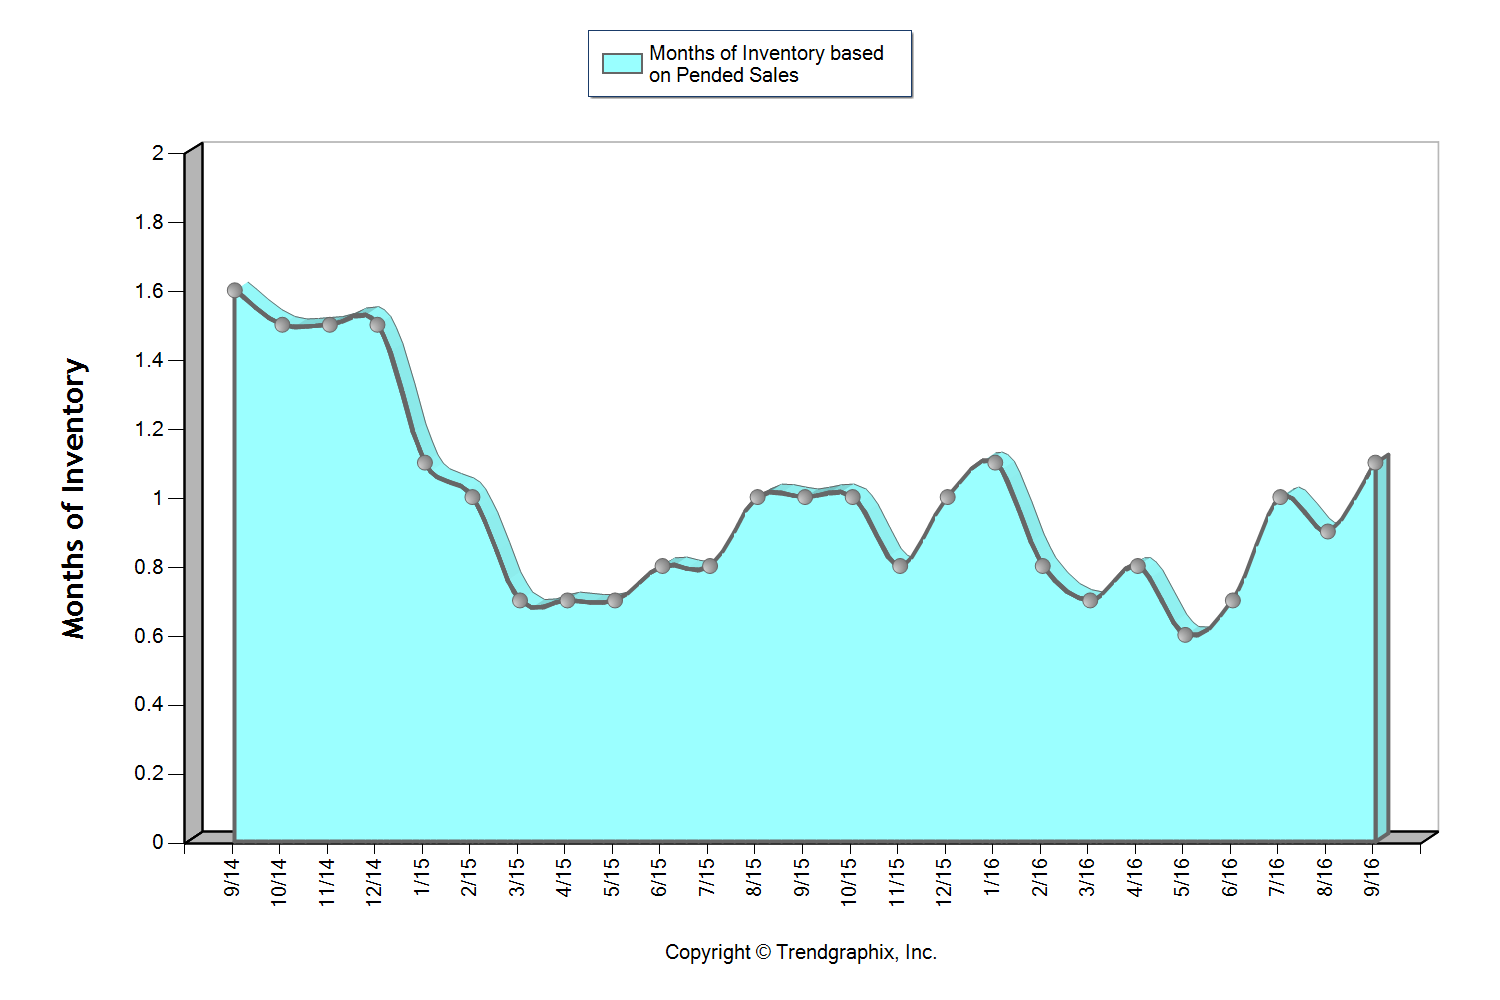
This graph shows that we currently sit at 1.1 months of inventory based on pending sales, which is the highest level we have seen since January! It is certainly still a seller’s market (3 months or less), but one that is starting to provide buyers increased options. In fact, we saw a 16% jump in new listings month-over-month. The average cumulative days on market reached 21 days in September, which was up 31% over August. Median price peaked in June at $650,000 and settled at $605,000 in September after hovering between $608,000 and $650,000 since March. In June, there were 23% more home sales above $1M over September. For the first time since February, the average list to sale price ratio was 101% after sitting at 102-104% over the last seven months.
The return of strong equity levels have brought sellers to market that have been waiting to jump in for some time. In fact, average prices have grown 22% over the last two years, freeing up sellers to make the moves they have been waiting for. Continued buyer demand due to our flourishing job market and historically low interest rates have steadily absorbed new inventory, but we are finally starting to see a trend toward some more balance. This is good news! We are still seeing multiple offers and quick market times, but not quite the frenzy that we experienced earlier this year.
All of these factors indicate that we may finally be headed towards a more stabilized market with positive attributes for both buyers and sellers.
South King County 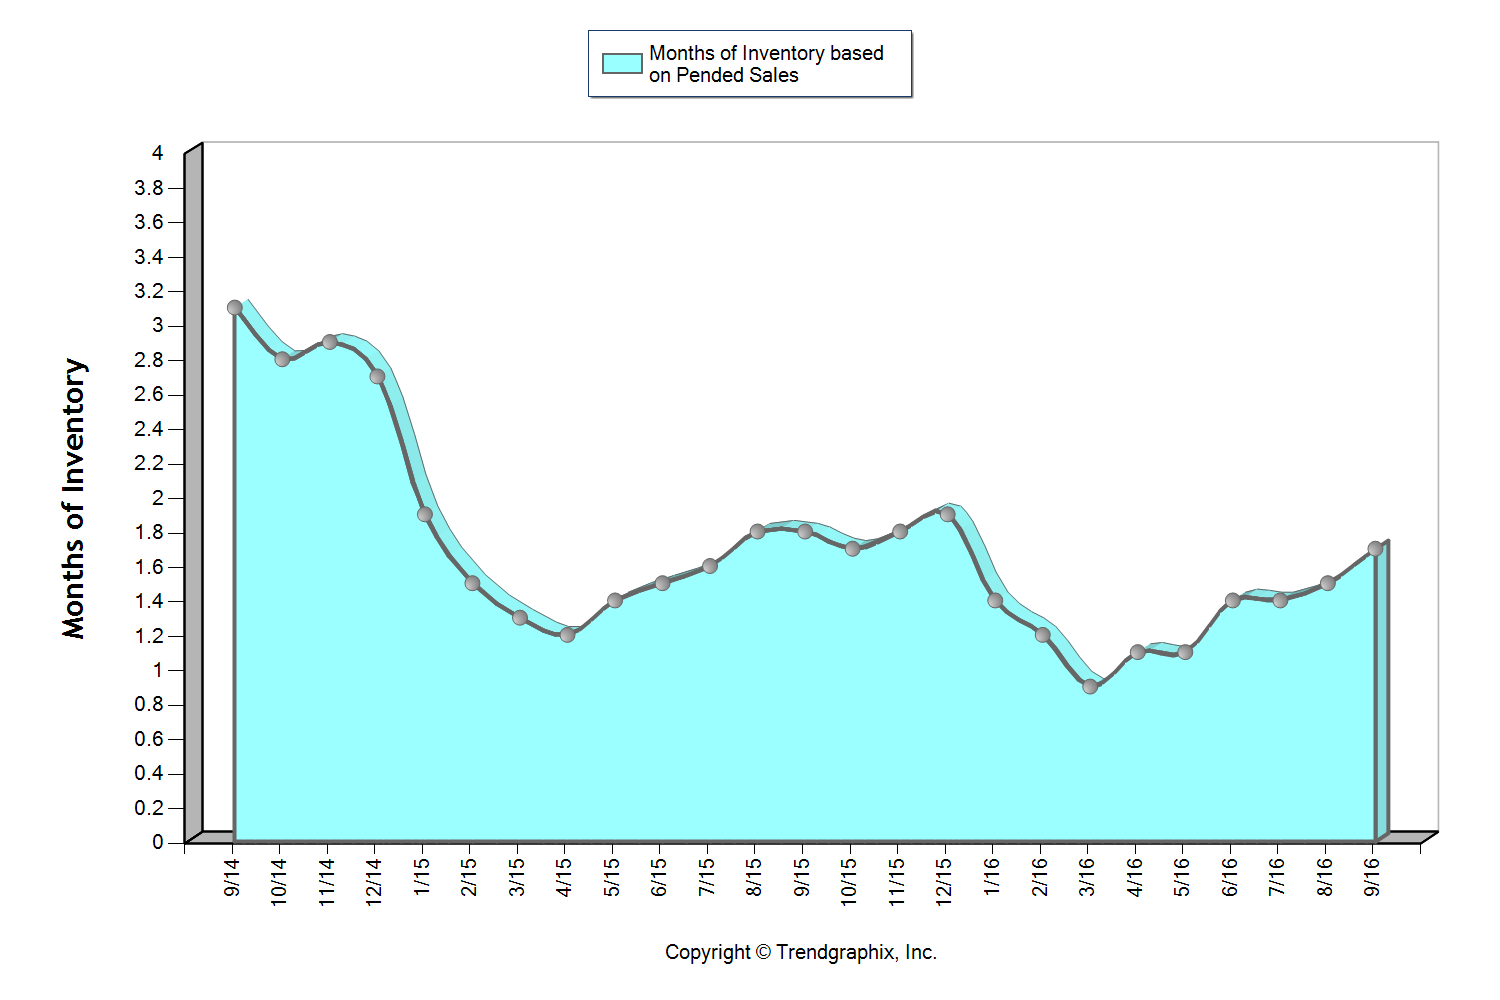
This graph shows that we currently sit at 1.7 months of inventory based on pending sales, which is the highest level we have seen in all of 2016! It is still a seller’s market (3 months or less), but one that is providing buyers increased options. The average cumulative days on market reached 27 days in both August and September, which was up 23% over July. Median price peaked in June at $371,000 and settled at $360,000 in September after hovering between $350,000 and $371,000 since March. For the first time since March, the average list to sale price ratio was 99% in August and September after sitting at 100-101% the prior four months.
The return of strong equity levels have brought sellers to market that have been waiting to jump in for some time. In fact, average prices have grown 16% over the last two years, freeing up sellers to make the moves they have been waiting for. Continued buyer demand due to our flourishing job market and historically low interest rates have steadily absorbed new inventory, but we are finally starting to see a trend toward some more balance. This is good news! We are still seeing multiple offers and quick market times, but not quite the frenzy that we experienced earlier this year.
All of these factors indicate that we may finally be headed towards a more stabilized market with positive attributes for both buyers and sellers.
These are only snapshots of the trends in our area; please contact one of our agents if you would like further explanation of how the latest trends relate to you.
Interest Rates and Your Bottom Line
 Wow, just wow! The interest rate levels that we have experienced in 2016 are seriously unbelievable. Currently we are hanging around 3.5% for a 30-year fixed conventional mortgage, almost a half a point down from a year ago. This is meaningful because the rule of thumb is that for every one-point increase in interest rate a buyer loses ten percent in buyer power. For example, if a buyer is shopping for a $500,000 home and the rate increases by a point during their search, in order to keep the same monthly payment the buyer would need to decrease their purchase price to $450,000. Conversely, for every decrease in interest rate, a buyer can increase their purchase price and keep the same monthly mortgage payment.
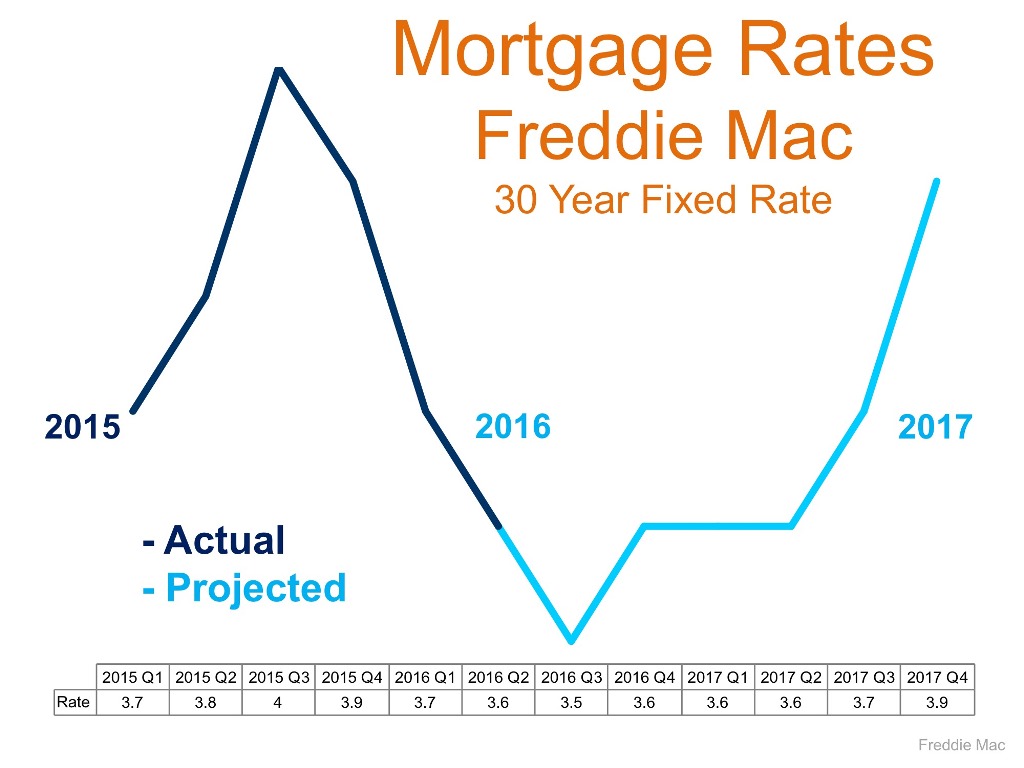
Why is this important to pay attention to? Affordability! If you take the scenario I just described and apply it to the graph on the right, you can see that the folks who jumped into the market this year enjoyed an interest cost savings when securing their mortgage. This cost savings is doubly important because we are in a price appreciating market. In fact, the median price in King County has increased by 13% complete year-over-year and 10% in Snohomish County. Interest rates are helping to keep payments more manageable in our appreciating market. Most recently we have started to see a slight increase in inventory compared to the spring/summer market, which is a plus for buyers and something to be taken advantage of.
Will these rates last forever? Simply put, no! The graph above provided by Freddie Mac shows a prediction for rates to start rising. While still staying well below the 30-year average of 7.65%, increases are increases, and securing these rates could be downright historical. Just like the 1980’s when folks were securing mortgages at 18%, the people that lock down on a rate from today will be telling these stories to their grandchildren. Another factor to consider is that it is an election year, and rates historically remain level during these times. What 2017 and beyond hold for rates will likely not mirror these historical lows under 4%. Note the 30-year average – one must think that rates closer to that must be in our future at some point.
So what does this mean for you? If you have considered making a move, or even your first purchase, today’s rates are a huge plus in helping make that transition more affordable. If you are a seller, bear in mind that today’s interest rate market is creating strong buyer demand, providing a healthy buyer pool for your home. As a homeowner who has no intention to make a move, now might be the time to consider a refinance. What is so exciting about these refinances, is that it is not only possible to reduce your monthly payment, but also your term, depending on which rate you would be coming down from.
If you would like additional information on how today’s historical interest rates pertain to your housing goals, please contact any of our agents. We would be happy to educate you on homes that are available, do a market analysis on your current home, and/or put you in touch with a reputable mortgage professional to help you crunch numbers. Real estate success is rooted in being accurately informed, and it is our goal to help empower you to make sound decisions for you and your family.
Housing Demand Defined
 What defines a housing market? We have had many different markets over the years that have been defined by certain identifiable factors. Will the last person leaving Seattle- turn out the lights, do you remember that billboard from 1971? Or the global housing boom of 2005-2007 that was driven by sub-prime credit lending options (which no longer exist, thank goodness!). Our current market is defined by strong demand and low inventory – the basic economic principle of supply and demand – Economics 101! A market with 0-3 months of inventory is a seller's market, 4-6 a balanced market and 6+ months a buyer's market. The route of the 2007-2011 economic down-turn, where months of available inventory favored buyers and was as high as 13 months, seems like ancient history. Since the Summer of 2012, months of inventory has favored sellers in both King and Snohomish counties, with an average of two months of available inventory between the two counties over the last three years. There is a market divergence going on between King and Snohomish County due to some unique factors each county possesses.
First, King County's lack of inventory has been drastic. Year-to-date, it has hovered at one month of available inventory, which means that each month we are nearly selling out of homes! This is due to the fact that demand is high and inventory is down. In the last 12 months, Seattle has had 27% less homes for sale than the previous 12 months, and closed sales are up 6%. In fact, Auction.com just named Seattle the number one housing market in the nation. This is due to the city's large technology sector driving employment, low interest rates and an increase in household formation. The housing premium in Seattle is rooted in shorter commute times to job centers, high walk scores and hip urban centers. The premium is real though, with the median home price over the last 12 months in Seattle reaching $528,000 – up 13% from the previous 12 months.
In Snohomish County inventory is still tight, with an average of two months of available inventory this year. Inventory has been somewhat supported by new construction and improved equity levels for re-sale properties. The median home price over the last 12 months was $347,000 – 34% less than Seattle. Median price growth is up 9% complete year-over-year.
What should we expect going forward into 2016? In both counties there was an increase in inventory in the third quarter. This is a promising indicator that folks are feeling more comfortable coming to market due to price increases after a booming spring market and healthier overall economic environment. Where this market is different from the bubbly market of 2007 are the drivers of the strong local economy, low interest rates and job growth, versus the unsustainable lending standards of the sub-prime loan movement. I believe we will see more homes come to market, especially as we head into the spring 2016 market. Folks are ready to move on to what is next for them, and recouped prices are enabling those choices. This increase will be welcomed as it will provide more options for buyers and will start to temper price growth, which is a good thing.
Where this market has gotten a bit tricky, is where one goes once their home sells. The low inventory has made this challenging, but with any market challenge you find creative and strategic ways to maneuver through and find success for your clients. Windermere has a great Bridge Loan product to utilize, temporary moves have solved these transitions, and longer closings with seller rent-backs have also been widely used to help make seamless transitions. This an exciting market to participate in, and creative strategy is the name of the game. Please contact one of our agents if you would like to know more about the current market conditions and how they relate to your bottom line and lifestyle decisions.
