
 Facebook
 X
X
 Pinterest
 Copy Link
Quarterly Market Trends: Seattle Metro
Q4 2017
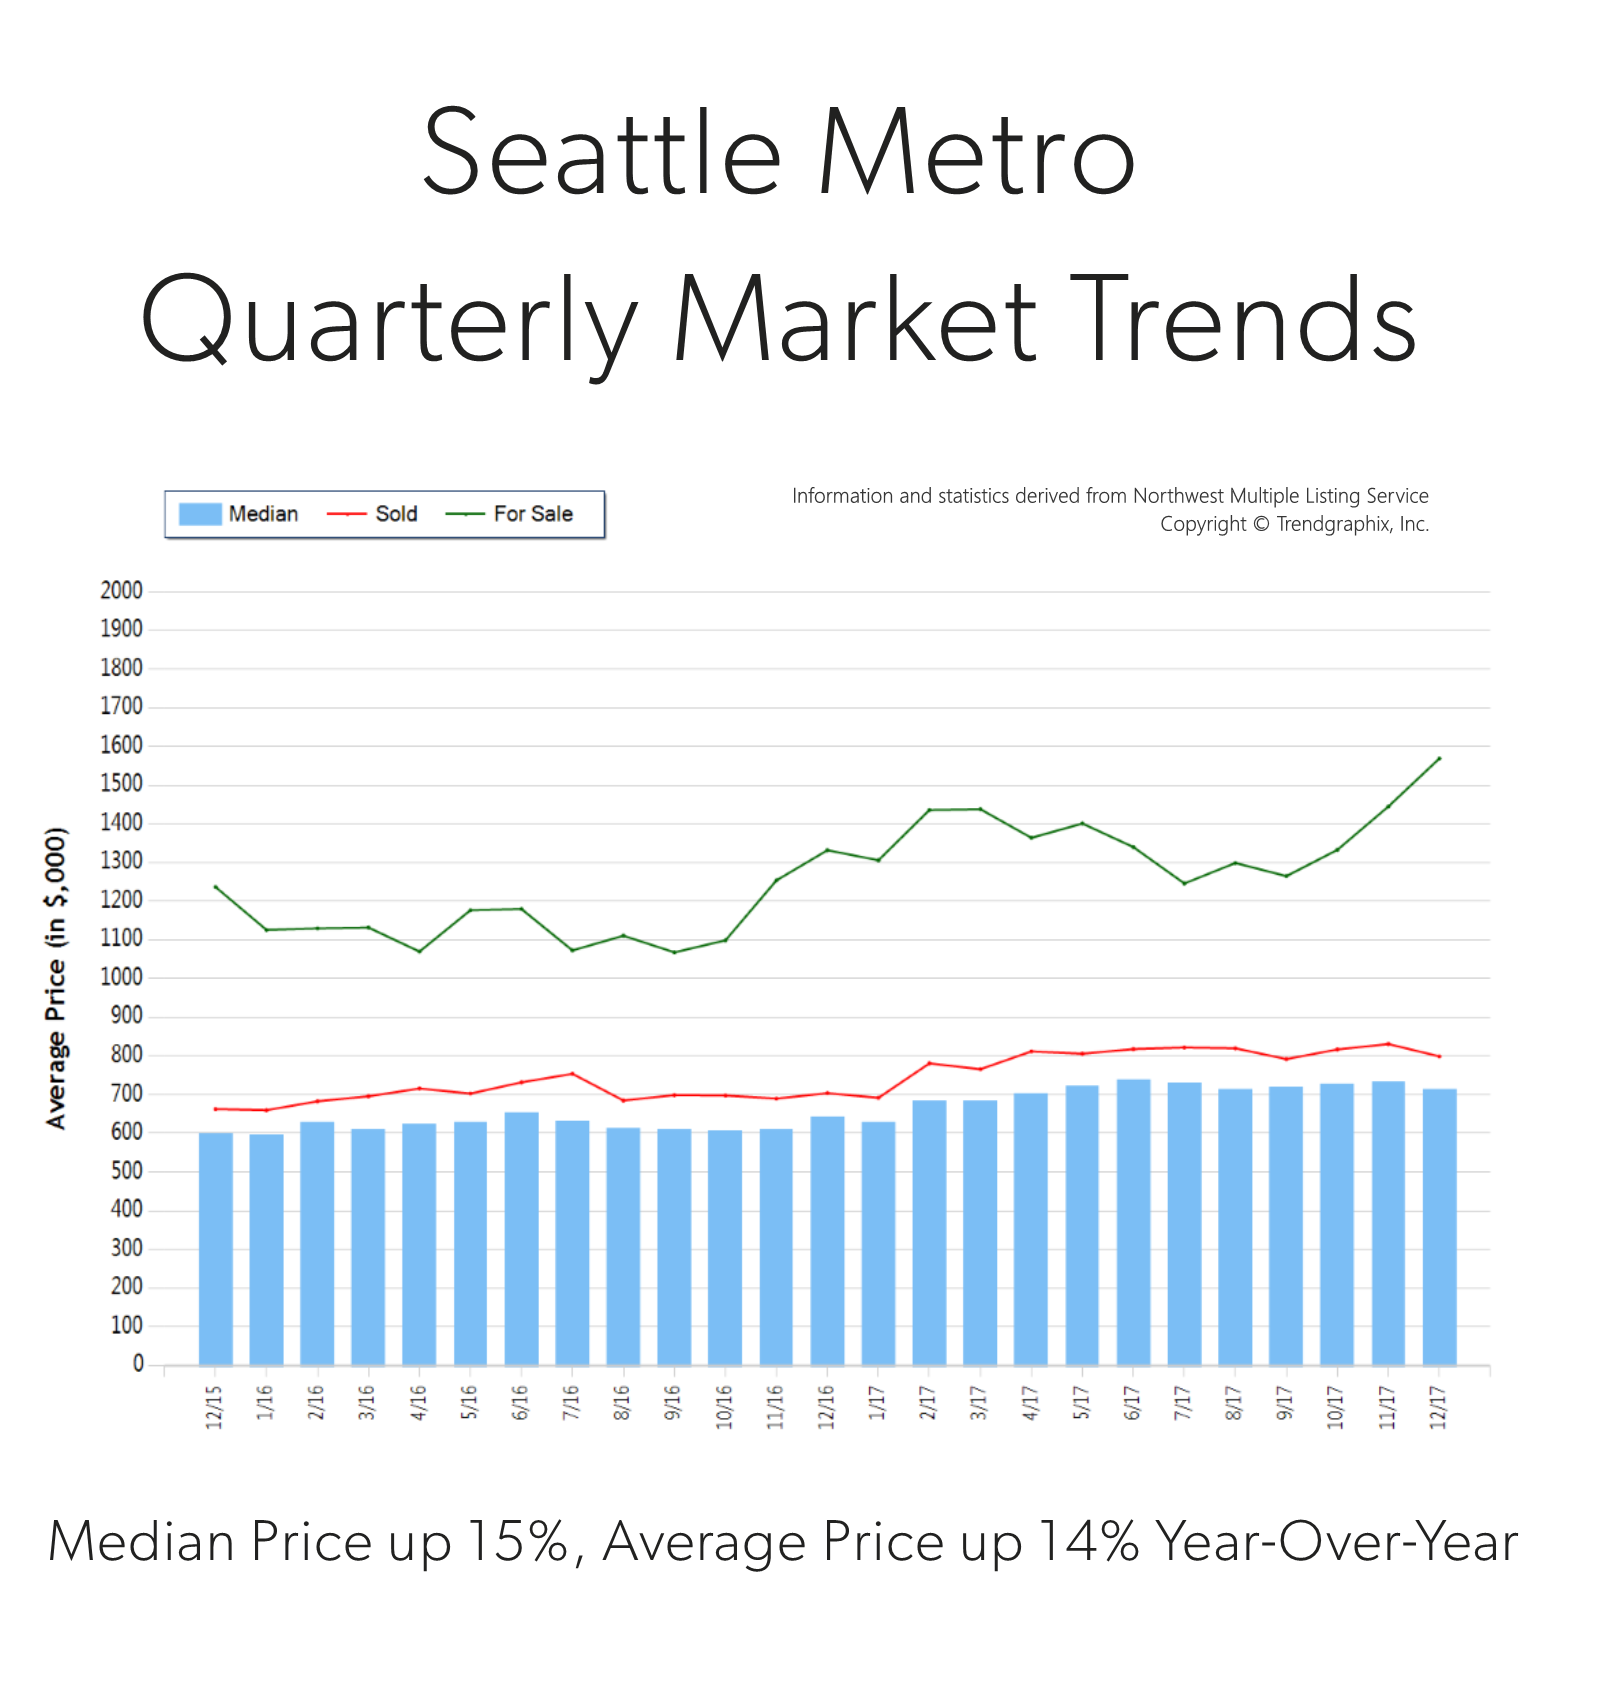
 Price growth was particularly strong in 2017! Median was up 15% and average price up 14% over 2016. Median price in 2017 landed at $710,000 and the average at $801,000. The average amount of days it took to sell a house in 2017 was 18 days, which is 10% faster than 2016. The average list-to-sale price ratio over the last year was 103%, with the spring months as high as 106%! In 2017, inventory growth continued to be a challenge, with a 3% decrease in new listings compared to 2016. Even with inventory limitations there were 4% more sales! This phenomenon illustrates strong buyer demand and a need for more listings.
Demand for Seattle Metro area real estate has grown due to close proximity to job centers. Over the last year, Seattle Metro was 40% more expensive than south Snohomish County and 75% over south King County. Historically low interest rates continue to drive the market as well, they have helped offset the increase in prices. Sellers are enjoying great returns due to this phenomenon and buyers are securing mortgages with minor debt service.
This is only a snapshot of the trends in the Seattle Metro area; please contact us if you would like further explanation of how the latest trends relate to you.
Quarterly Market Trends: North King County

Q4 2017
 Price growth was particularly strong in 2017! Median and average prices were up 14% over 2016. Median price in 2017 landed at $715,000 and the average at $787,000. The average amount of days it took to sell a house in 2017 was 17 days, which is 19% faster than 2016. The average list-to-sale price ratio over the last year was 104%, with the spring months as high as 107%! In 2017, inventory growth continued to be a challenge, with a 4% decrease in new listings compared to 2016. Even with inventory limitations there were a near equal amount sales! This phenomenon illustrates strong buyer demand and a need for more listings.
Demand for north King County real estate has grown due to close proximity to job centers while maintaining a neighborhood feel. Over the last year, north King County was 41% more expensive than south Snohomish County and 77% over south King County. Historically low interest rates continue to drive the market as well, they have helped offset the increase in prices. Sellers are enjoying great returns due to this phenomenon and buyers are securing mortgages with minor debt service.
This is only a snapshot of the trends in north King County; please contact us if you would like further explanation of how the latest trends relate to you.
Quarterly Market Trends: South Snohomish County
Q4 2017
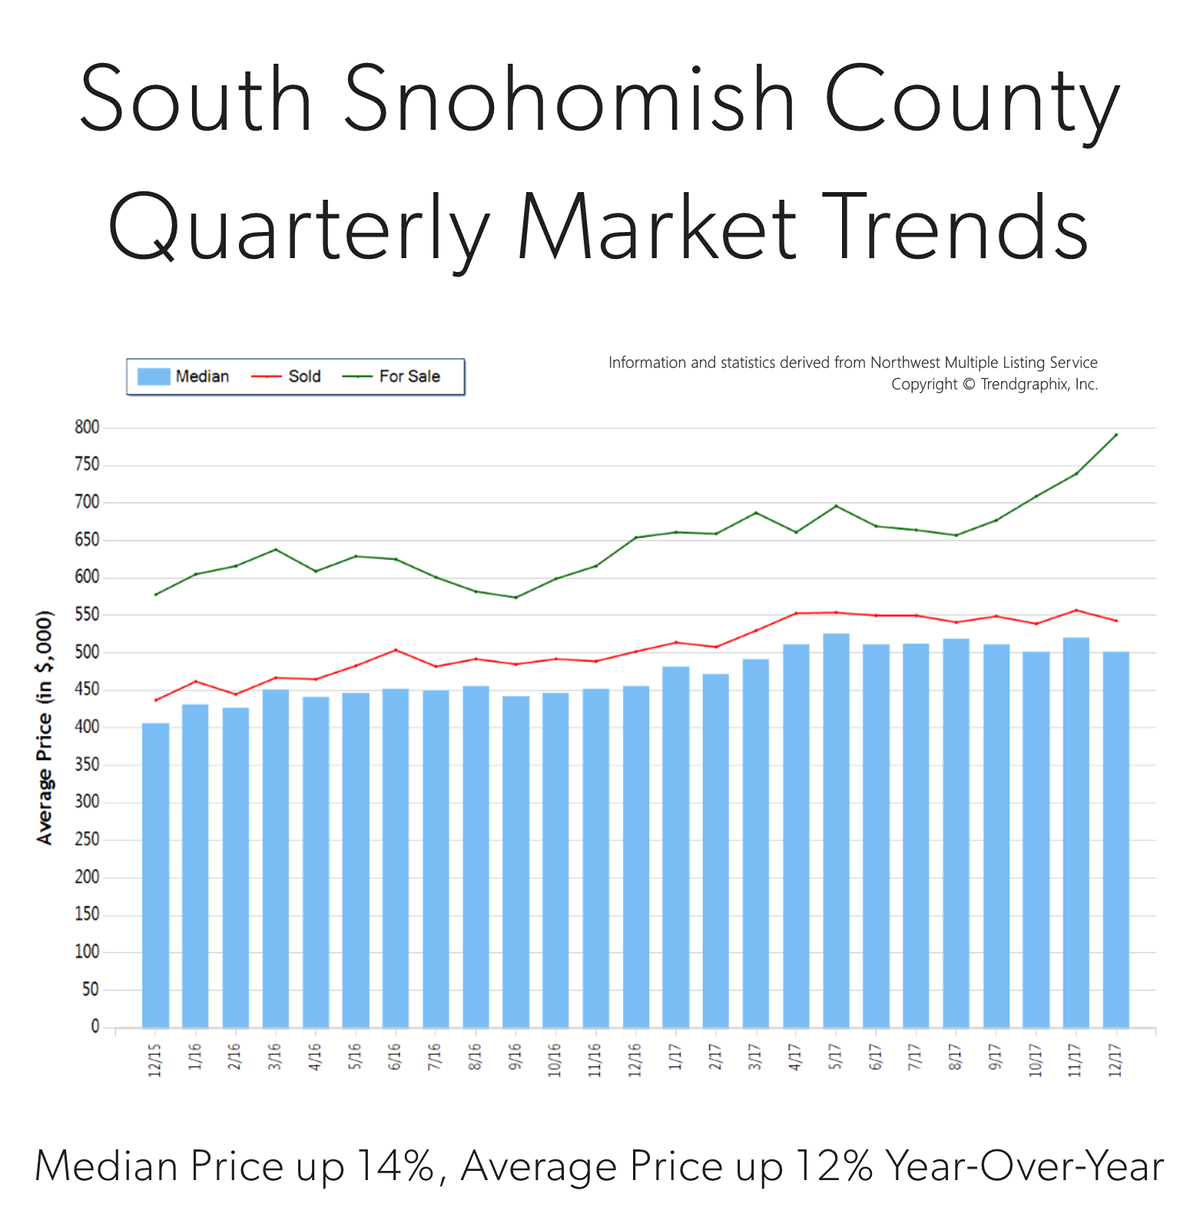
 Price growth was particularly strong in 2017! Median was up 14% and average price up 12% over 2016. Median price in 2017 landed at $508,000 and the average at $543,000. The average amount of days it took to sell a house in 2017 was 24 days, which is 17% faster than 2016. The average list-to-sale price ratio over the last year was 101%, with the spring months as high as 103%! In 2017, inventory growth continued to be a challenge, with a 1% decrease in new listings compared to 2016. Even with inventory limitations there were 4% more sales! This phenomenon illustrates strong buyer demand and a need for more listings.
South Snohomish County real estate has seen a steady stream of buyers come our way due to affordability, reasonable commute times to job centers and quality of life. In fact, the median price in 2017 was 41% higher in north King County. Historically low interest rates continue to drive the market as well, they have helped offset the increase in prices. Sellers are enjoying great returns due to this phenomenon and buyers are securing mortgages with minor debt service.
This is only a snapshot of the trends in south Snohomish County; please contact us if you would like further explanation of how the latest trends relate to you.
3 Reasons why we are NOT Headed Towards Another Bubble


Are we headed for another housing collapse?
We get asked this question often, and we can understand why. With the 2008 Great Recession not too far back in our rear-view mirror it is understandable that folks don’t want history to repeat itself, as that was a very painful time for many. Also, price appreciation has been rapid across the country, but especially in our region. The large price gains might seem familiar to the gains of the previous up market of 2004-2007, but the environment is much different. Here are three reasons why we are not headed towards (or in) another real estate bubble:
1. Lending Requirements
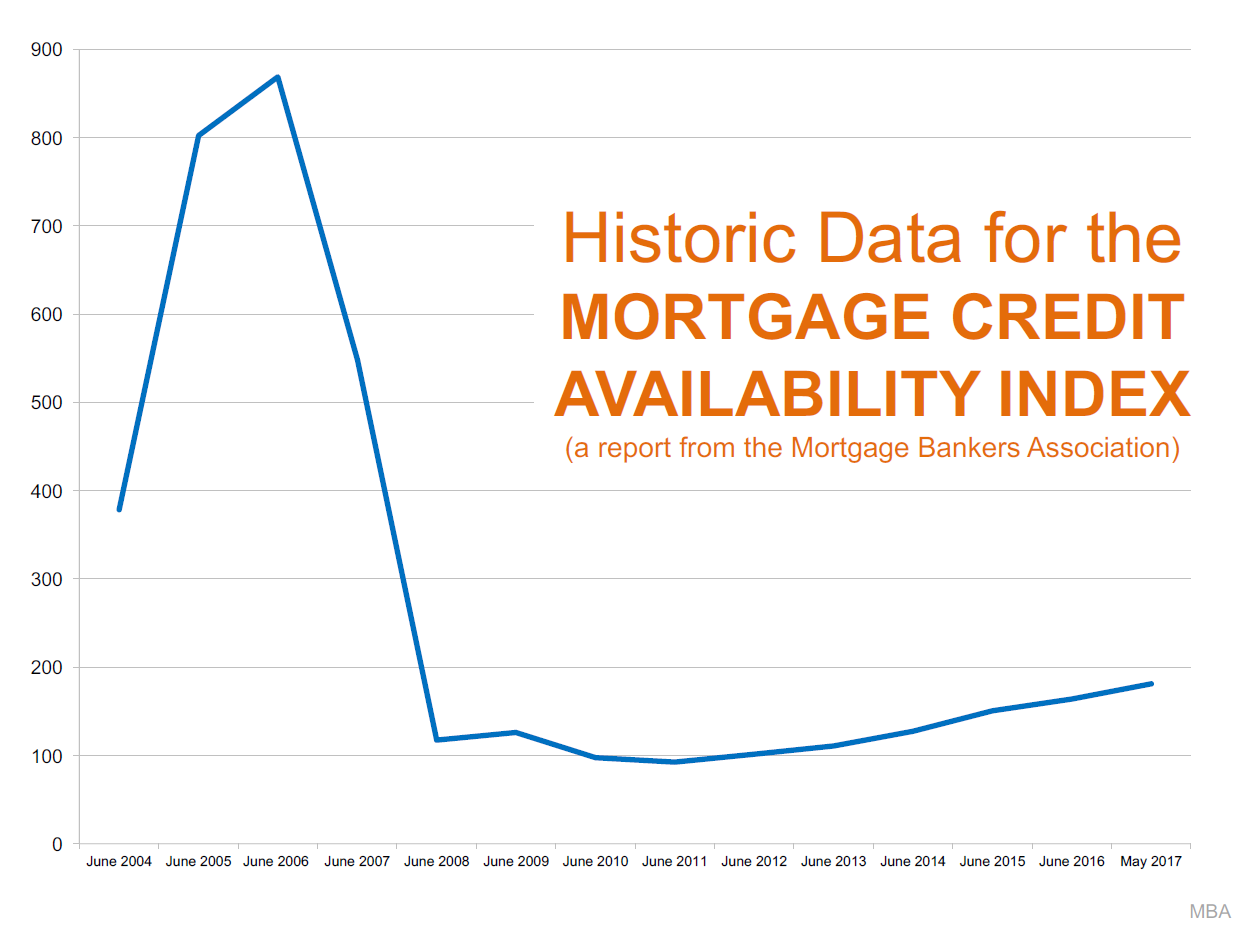 As this graph shows, lending requirements are much more stringent now than what they were prior to the fall of the housing market.
Previous lending practices allowed people to get into homes with risky debt-to-income ratios, low credit scores and undocumented incomes. They called this sub-prime lending. A large part of why the housing bubble burst 10 years ago was due to people getting into mortgages they were not equipped to handle, which lend to the eventual fall of sub-prime lending. Currently, the average credit score of secured mortgages over the last 12 months according to Ellie Mae was 724. During the days of sub-prime lending people were funding loans with scores as low as 560! This, coupled with many zero-down loan programs and the risky terms mentioned above left many new homeowners with little to no equity. When you have little or no equity it very easy to just walk away.
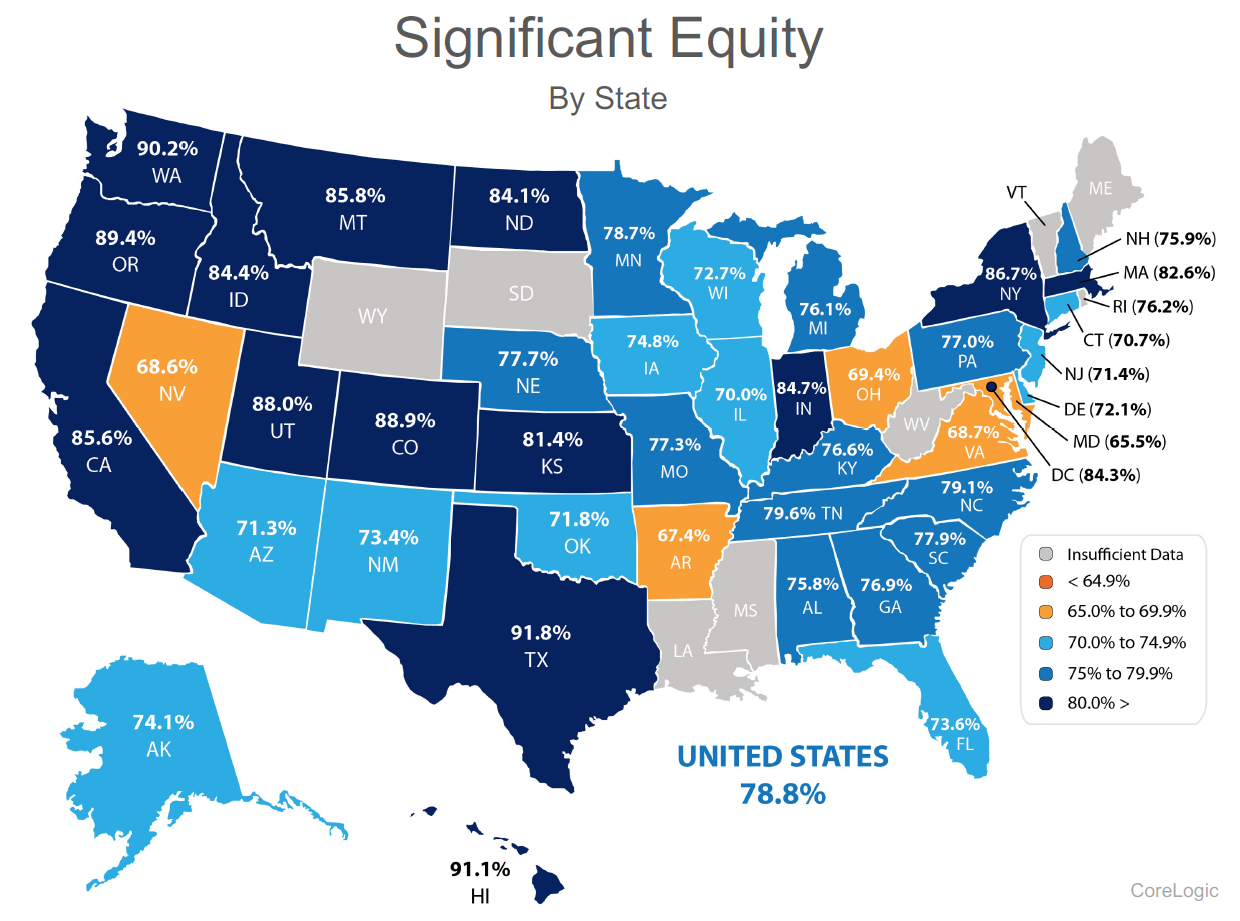
The graph above shows the percentage of homes in our state with significant equity (20% or more) according to CoreLogic. Today many homeowners, especially in our region are making large down payments to begin with. Believe me, when competing with multiple offers on a house, the size of down payment matters – hence many buyers landing homes today are making large down payments. Unlike the market prior to the crash, when people have high equity levels they are not likely to abandon their home or miss payments.
2. Inventory Levels & 3. Our Job Market
The biggest challenge in our market has been low inventory levels and high housing demand. It’s simply the concept of supply and demand. Our thriving job market has afforded folks already in our area the ability to make moves, and it is bringing people into our area from other parts of the country. Washington State’s net in-migration is 43% higher than it was 10 years ago. This has created increased demand, especially for homes closer to job centers resulting is shorter commutes. When you have increased demand and not enough homes to absorb the buyers, prices go up. Over the last three years we have easily seen a 10% increase in prices year-over-year. That is above the norm and should slow down as inventory increases. As inventory increases we anticipate a leveling out of appreciation rates to historical norms of 3-4% annually, but not decreasing home values like the 2008-2010 crash.
 We understand that the recent increase in home prices has been big and that it might remind you of the previous up market before the crash. Hopefully digging into the topics above has shed some light on how it is different. According to Matthew Gardner, Windermere’s Chief Economist and nationally sought after expert on all things real estate, buyers should not wait this market out, due to future price appreciation and today’s historically low interest rates. Check out his latest vlog that addresses this topic.
As always, it is our goal to help keep the community informed, and empower strong decisions. Please let us know if we can answer any questions or help you or anyone you know with their real estate needs.
Demand is High, Inventory Low… Here we Go!
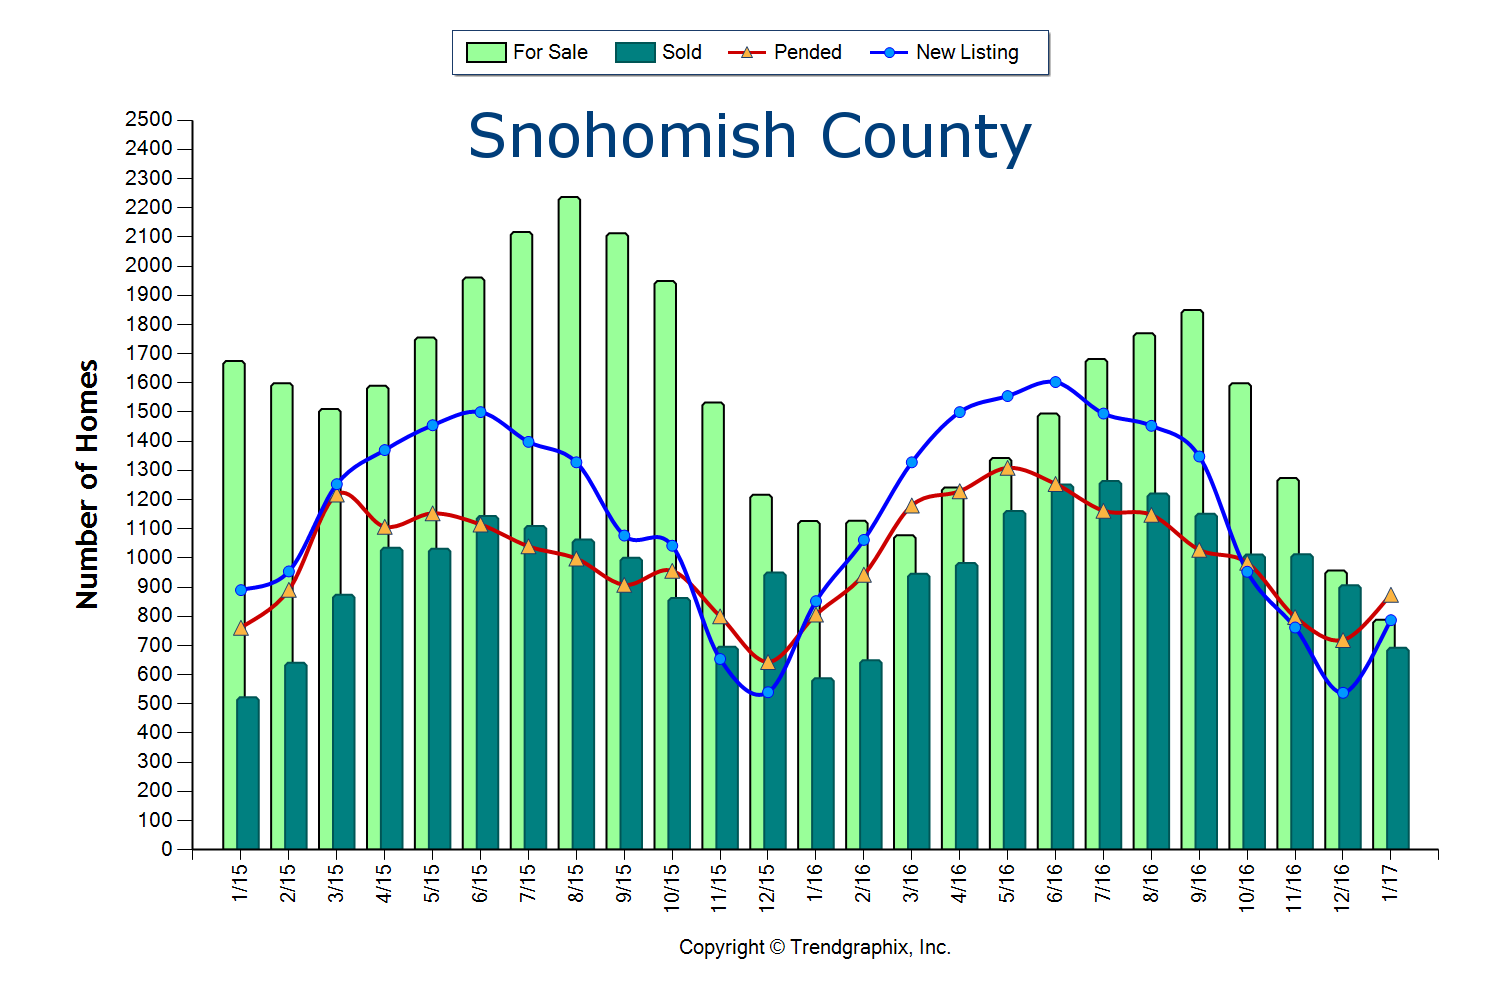
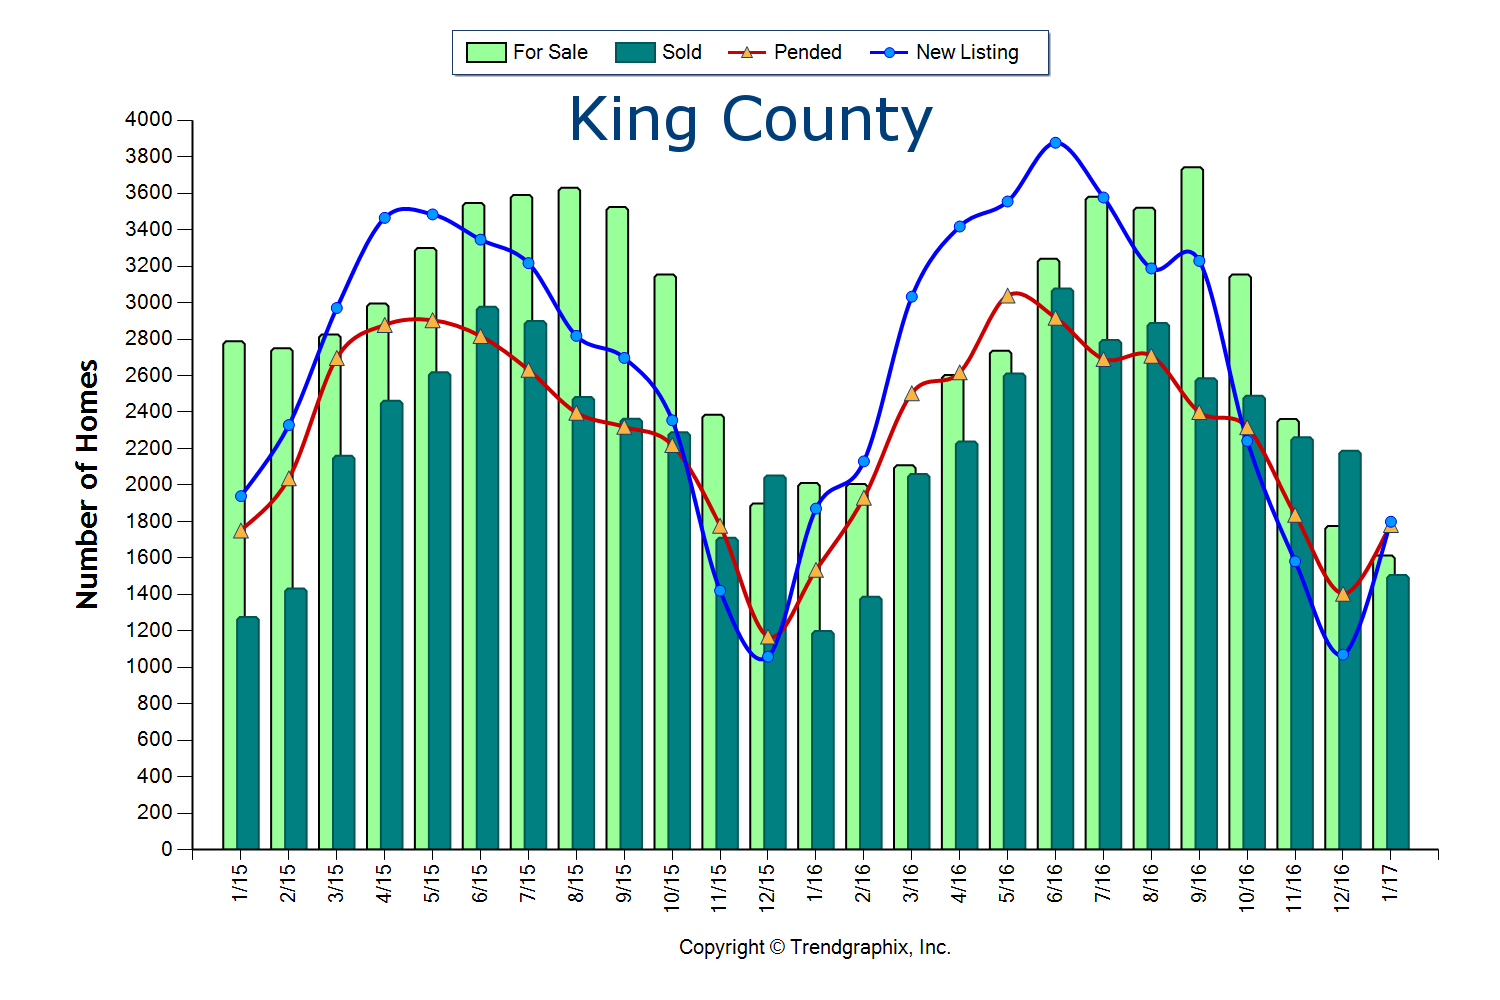
The two graphs here illustrate the amount of homes for sale, the amount of homes that sold, pending sales and new listings over the past two years in King and Snohomish Counties. This gives us a good look at the simple principle of supply and demand. We are currently experiencing one of the strongest Seller’s markets in recent history. A Seller’s market is defined by having three or less months of available inventory. Currently, King and Snohomish counties have only 0.9 months of inventory based on pending sales. This means that if no new homes came to market, we would be sold out of homes in less than a month. What is crazy is that this inventory count is down 30% from the year prior, which was also an extreme Seller’s market!
 Where this particular Seller’s market is unique, is that a decrease in new listings is not creating this environment, but very high buyer demand is. In fact, King County new listings were up 5% over the last year, but so were sales. In Snohomish County new listings were up 7% over last year, but sales were up 11%! Despite the increase in homes coming to market, demand has matched or outpaced, leaving us with the lowest inventory levels ever.
We can thank our local, thriving job market. So much so, that many people from out-of-state are relocating here to be a part of our economy and the quality of life the Greater Seattle area has to offer. We also have poised move-up buyers ready to cash in on their equity and first-timers ready for action. Combine the healthy local economy with strong equity levels and still historically low interest rates, and the audience for homes that come to market is huge!
Multiple offers are very common and prices are increasing. Median price is up complete year over year in King County by 13% and Snohomish County by 10%. This growth in equity has provided home owners the option to make the moves they have been waiting for, such as a move-up, right-size or relocating out of the area for retirement.
These graphs predict that we will see an increase in new listings as we head into the Spring and Summer months, which is needed to meet demand. If you are considering putting your home on the market this year I would advise the sooner the better, as buyers did not hibernate for the winter and will not be worried about flowers blooming in your front yard. Sellers that beat the second quarter increase in listings will enjoy a larger audience due to less competition.
 The importance of both buyers and sellers aligning with a knowledgeable, well-researched and responsive broker is paramount. One might think that it is “easy” to sell a house in this market, but how the preparation, exposure, marketing, management of all the communication and negotiations are handled can make or break a seller’s net return on the sale. While market times are short, they are intense! Negotiations are starting as soon as the property hits the market by educating buyers and their brokers on exactly what a seller would like by the time offers are due. The goal is to bring the sellers I work with not only the highest price, but the best-termed offer that I know is going to close.
If you’re a buyer, it is overwhelmingly important that you are aligned with an agent that knows how to win in this market. Terms, negotiations, financial preparation, communication, responsiveness and market knowledge are what set a highly capable selling agent apart, and are required to prevail. While the market for buyers is fierce, we can assure you that with a well thought out and executed plan, we have helped buyers win.
If you have any curiosities or questions regarding the value of your current home or purchase opportunities in today’s market, please contact us. It is my goal to help keep you informed and empower strong decisions.
You Don’t Need Tulips for a Strong Home Sale
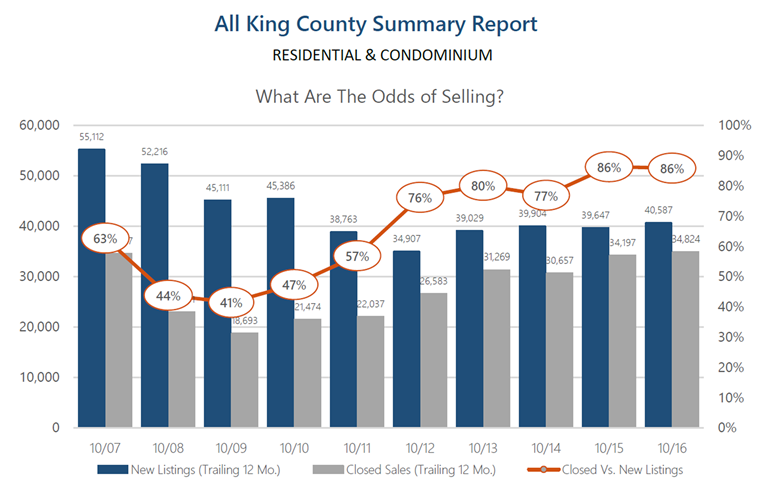
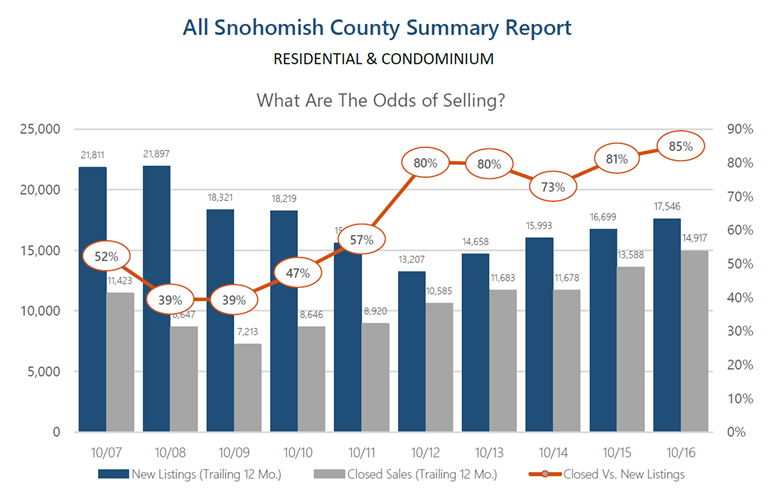 These graphs (click to view larger) above provide a 10-year history of the odds of selling in the month of October for both King and Snohomish Counties. As you can see, the odds of selling are at a 10-year high, hitting 86% in King and 85% in Snohomish. These are quite favorable odds for sellers and indicate what one might expect moving toward 2017.
Buyer demand remains very strong! In fact, pending sales reached peak levels in May of this year and continued with steady momentum throughout the summer and fall. Every month this year recorded a higher pending level than the same month the previous year. This illustrates strong buyer demand and is coupled with lower inventory levels than the year before. This combination has created very low months of available inventory, and we anticipate this continuing as we complete 2016 and head into 2017. For a potential seller, this means the market is in your favor, and waiting until the tulips bloom in April might have you lined up against more competition. Historically, we see inventory peak April through June, however pending sales have closely matched supply all throughout the year. With that said, one might consider bringing their home to market in the first quarter of the year versus the second, because they will have less competition, but still enjoy an engaged buyer audience.
Most recently we have seen interest rates bump up a bit, and this has created more urgency in the market. While still historically low, buyers are smart enough to know that cheap money is a huge long-term savings. Paying attention to all of these market factors will empower one to make the best real estate decisions. Please reach out if you are considering a move over the next year, and I’d be happy to apply this research and weigh in on your options.
Affordability: Commute Times & Interest Rates
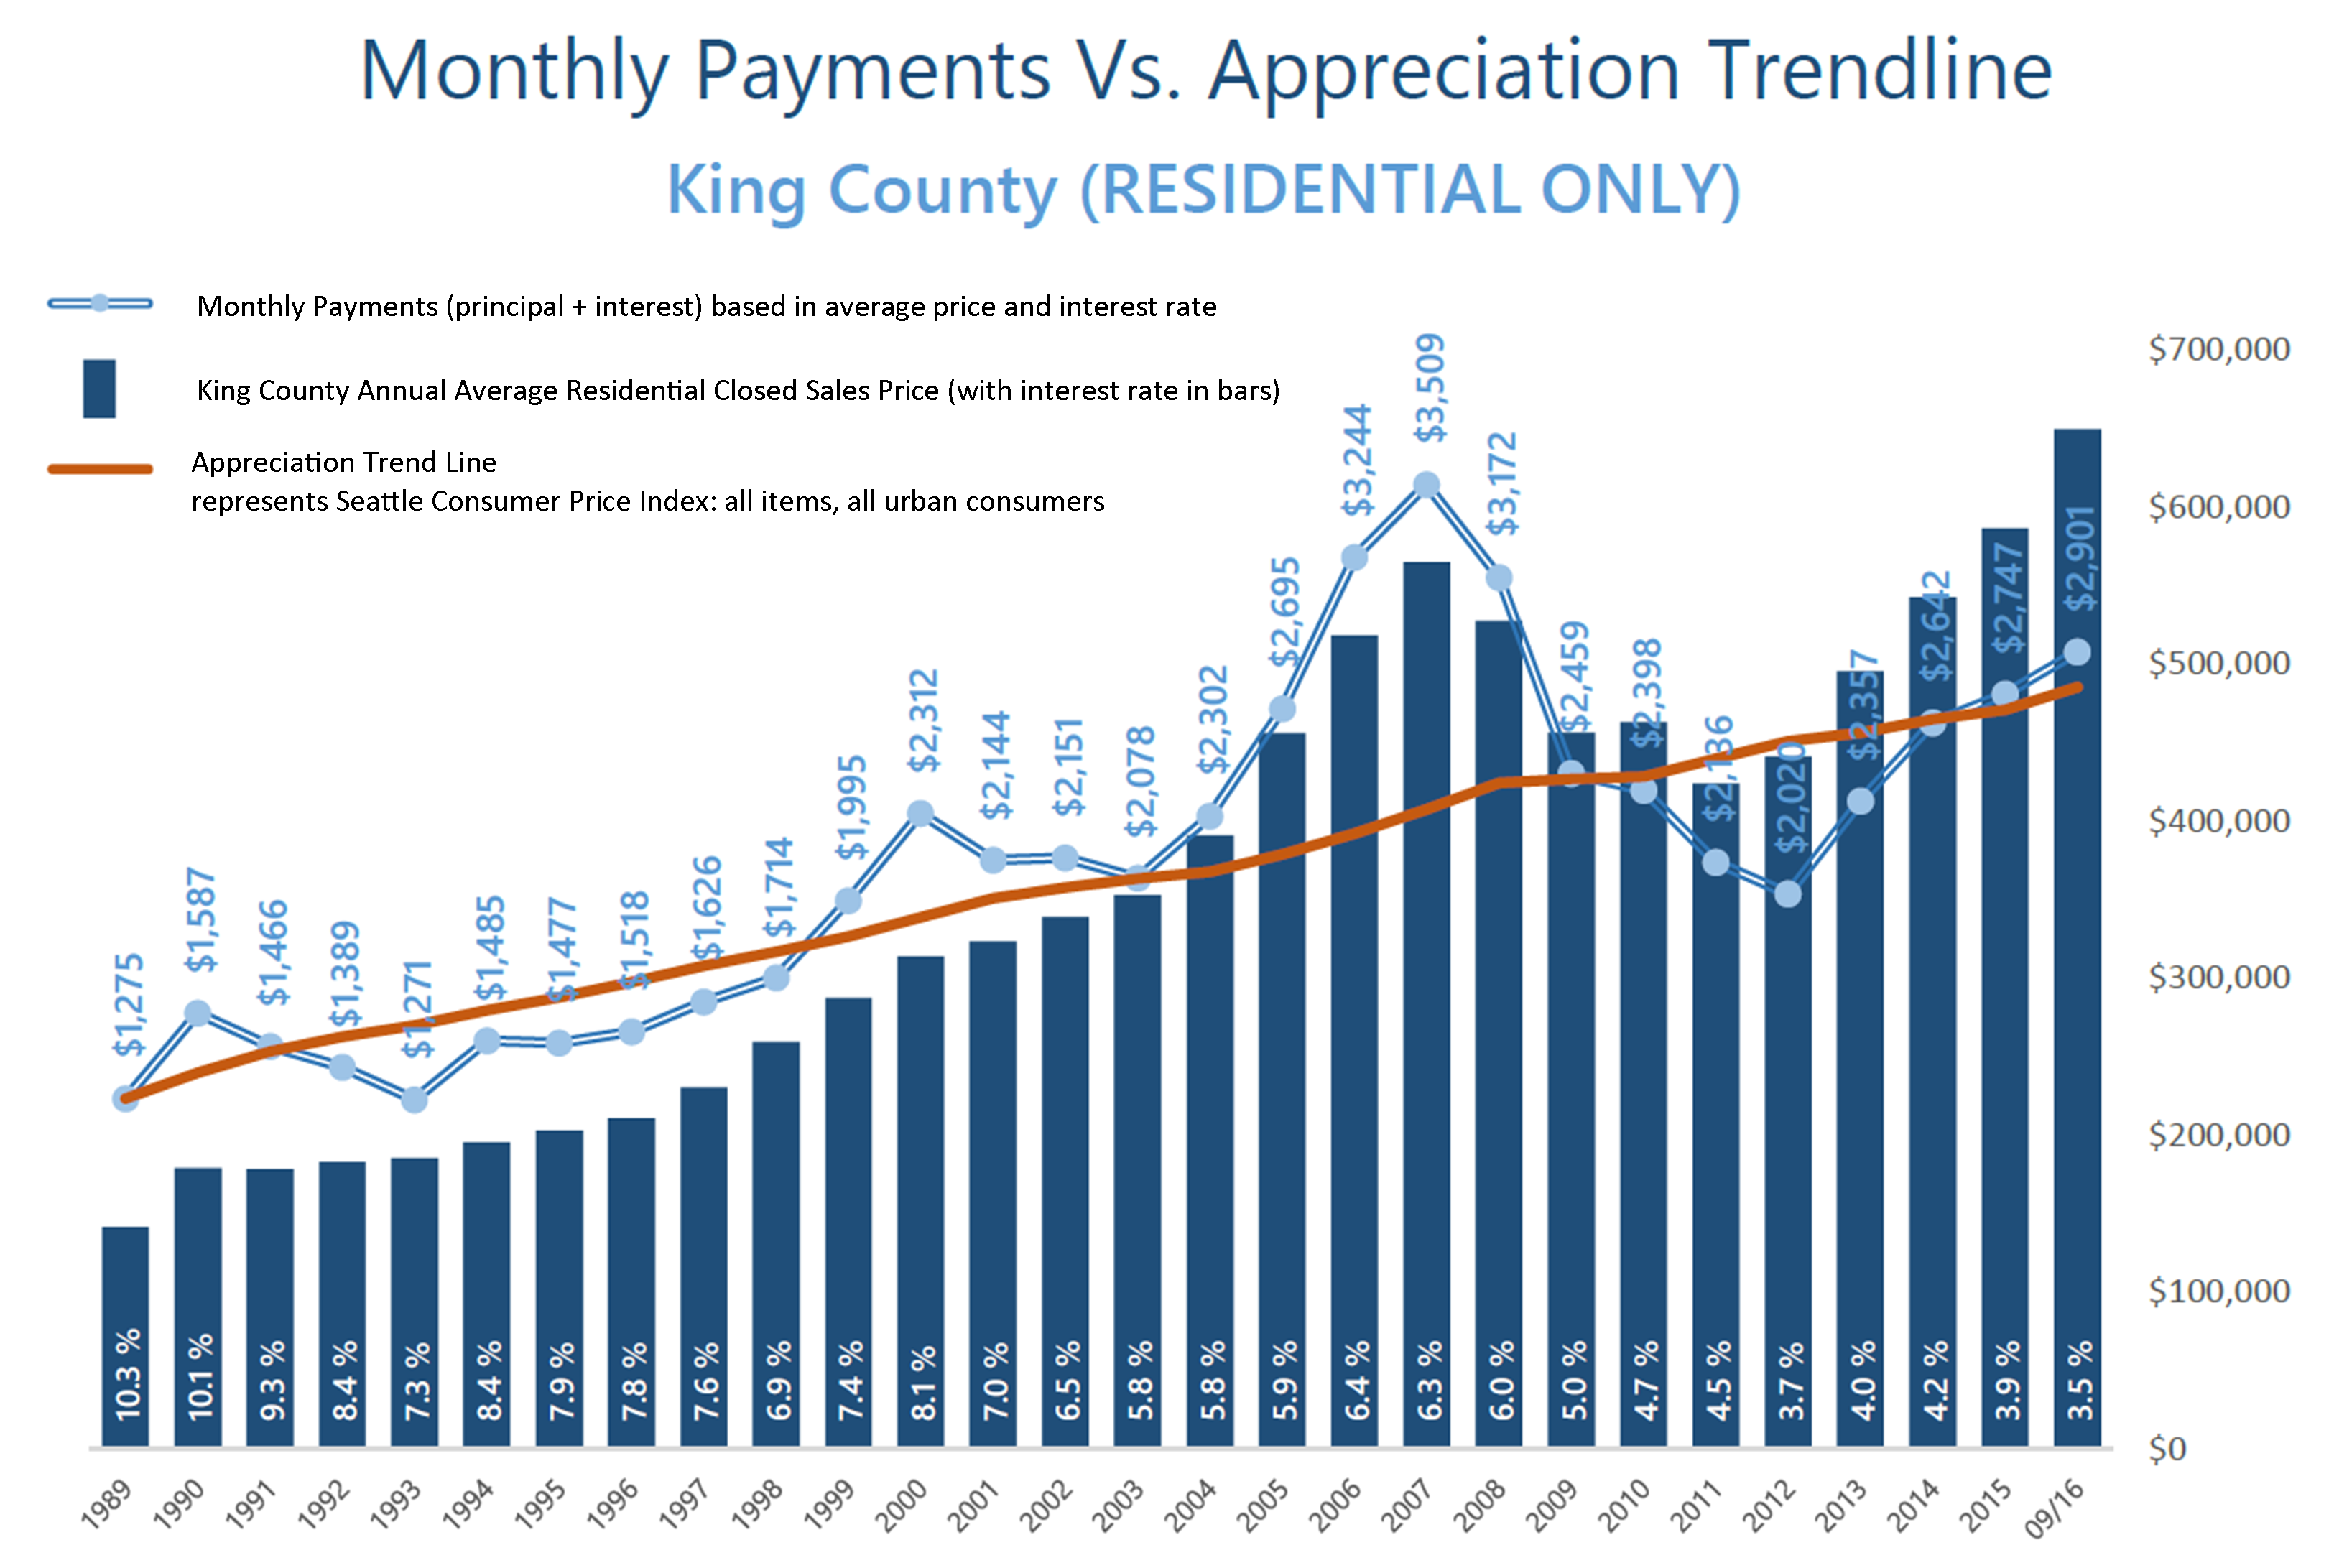
 These graphs illustrate the brass tacks of affordability between King and Snohomish Counties, measured by the average monthly payment. Most recently in September, the average monthly payment was 35% higher in King County compared to Snohomish County. What is fascinating, though, is comparing today’s average monthly payment to peak monthly payments back in 2007! In King County, monthly payments are currently 21% less than during the peak, and in Snohomish County, 36% less. That is a lot of saved monthly overhead. Note that this has everything to do with today’s historical interest rates, as average prices are higher now than in 2007. When one buys or refinances a house, they are not only securing the property, but securing the rate for the life of the loan.
Close proximity to the work place and affordability is often near the top of a buyer’s list of preferred features. 2016 has continued to be a year when commute times to major job centers widened the price divide between key market areas in the greater Seattle area. Over the last 12 months, the average sales price for a single-family residential home in the Seattle Metro area was $696,000! In south Snohomish County (Everett to the King County line), the average sales price for a single-family residential home was $471,000 – 48% less than Seattle Metro. Further, if you jump across Lake Washington to the Eastside, the average sales price for a single-family residential home was $881,000 – 27% more than Seattle Metro!
The “drive to qualify” mentality has been proven by the pending sales rate in south Snohomish County over the last 12 months. Pending sales are up 7% complete year-over-year, whereas in Seattle Metro pending sales are down 1%, and down 2% on the Eastside. We believe this is a result of affordability, more inventory choices in south Snohomish County, new construction options, lower taxes, strong school district choices, and manageable commute times. Newer transit centers and telecommuting have also opened up doors to King County’s little brother to the north as well. If you are curious about possible commute times, you can search for properties on our website based on commutes times, which is a feature provided by INRIX Drive Time. Also, we track the market in several ways, so if the graphs here are interesting to you, any of our agents would be happy to provide additional information relative to your specific neighborhood. Please contact us anytime, as it is our goal to help keep you informed and empower you to make strong real estate decisions.
