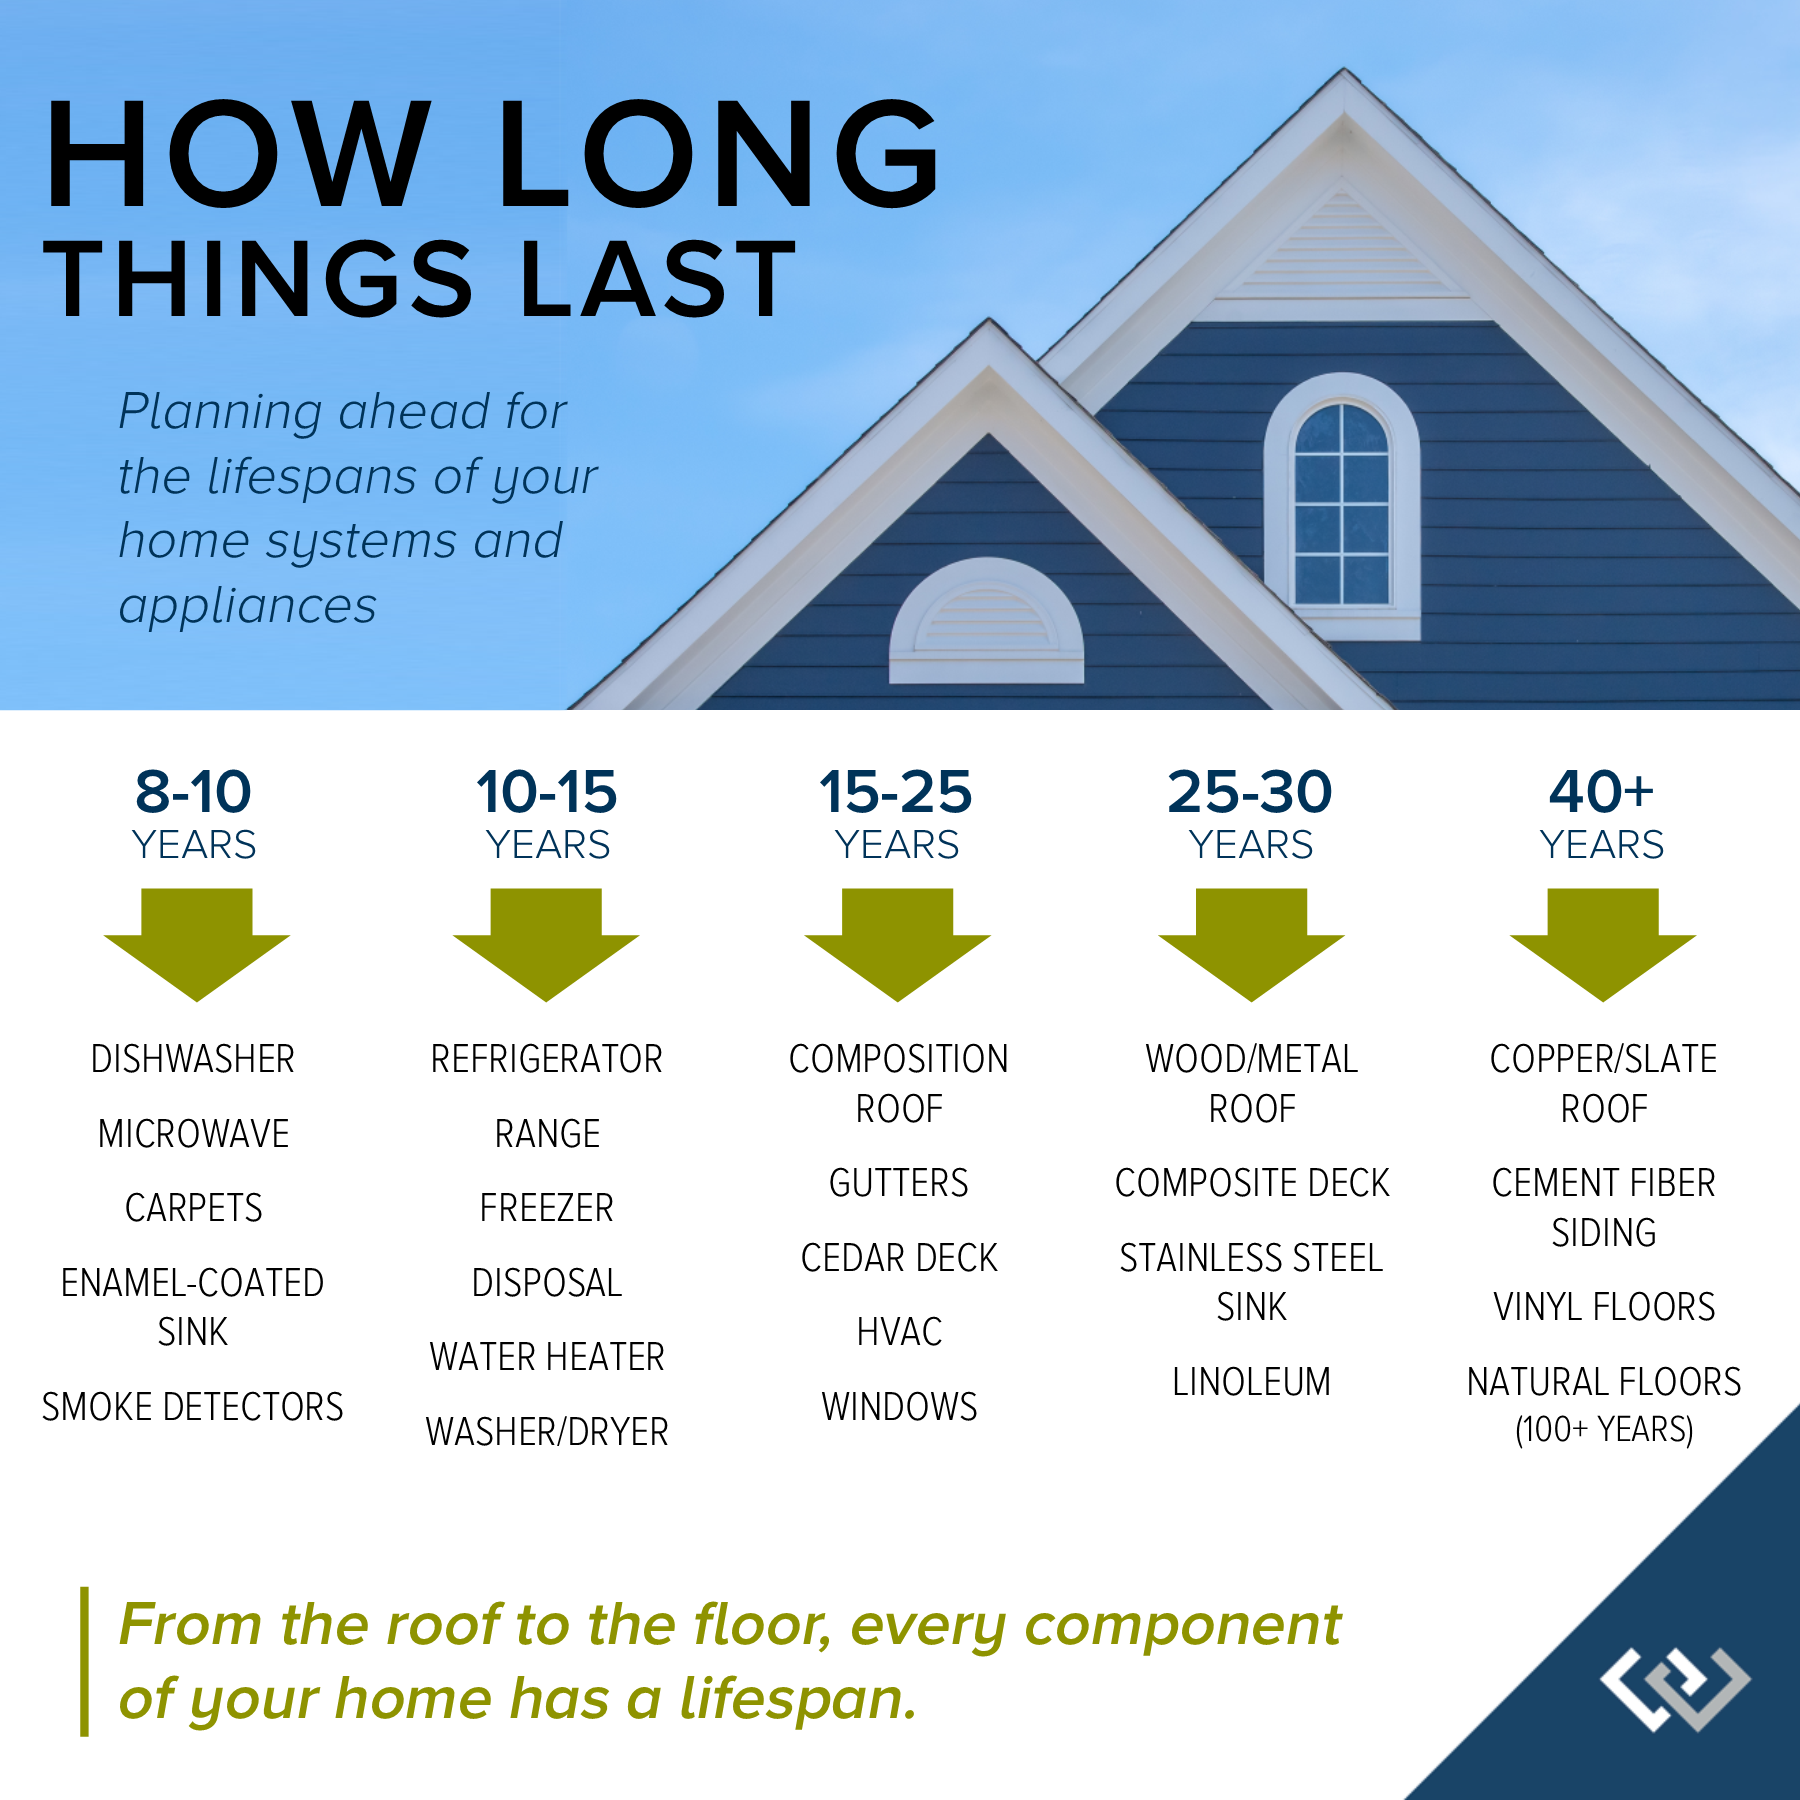
WINDERMERE NORTH BLOG

Eastside Quarterly Market Trends – Q2 2019

2019 provided a very healthy and more balanced spring market! Median price is up 2% year-over-year at $925,000. Prices have started to find their balance as more inventory has come to market compared to the scarcity of years past. While buyers have had more choices over the last year, it is still a seller’s market with just […]
Read More

Seattle Metro Quarterly Market Trends – Q2 2019

2019 provided a very healthy and more balanced spring market! Median price is even year-over-year at $750,000. Prices have started to find their balance as more inventory has come to market compared to the scarcity of years past. While buyers have had more choices over the last year, it is still a seller’s market with […]
Read More

North King County Quarterly Market Trends – Q2 2019

2019 provided a very healthy and more balanced spring market! Median price is up 1% year-over-year at $760,000. Prices have started to find their balance as more inventory has come to market compared to the scarcity of years past. While buyers have had more choices over the last year, it is still a seller’s market with […]
Read More

South Snohomish County Quarterly Market Trends – Q2 2019

2019 provided a very healthy and more balanced spring market! Median price is up 3% complete year-over-year and up 1% from last June. Prices have started to find their balance as more inventory has come to market compared to the scarcity of years past. While buyers have had more choices over the last year, it […]
Read More

North Snohomish County Quarterly Market Trends – Q2 2019

2019 provided a very healthy and more balanced spring market! Median price is up 8% complete year-over-year and up 3% from last June. Prices have started to find their balance as more inventory has come to market compared to the scarcity of years past. While buyers have had more choices over the last year, it is […]
Read More

Monthly Newsletter – June 2019

Changes are coming: The Washington State Legislature is changing the way in which real estate excise taxes (REET) are calculated. REET are different from your annual property taxes; they are the tax that a seller pays when they sell their home, based on the sale price. Currently, the Washington State excise tax is 1.28 percent. […]
Read More

Sending Kids to Summer Camp

Every year, our office comes together to provide summer camp scholarships for local kids who may not otherwise have the opportunity to experience the adventures of overnight camp. We partner with YMCA Camp Orkila and Camp Colman; local programs dedicated to nurturing the potential of youth, promoting healthy living, and fostering social responsibility. This year, […]
Read More

Monthly Newsletter – May 2019

The generational shift that is happening in our country right now is having a strong influence on demand for real estate. As the Millennials gain a stronger foothold into their adulthood, Generation X settles in with family, Boomers move towards retirement and the Silent Generation find themselves making moves for health reasons, the desire to […]
Read More

Seed Drive!

We are collecting vegetable seeds and starts for the Martha Perry Garden, where volunteers grow thousands of pounds of fresh produce every year for local food banks.   My office will be spending a volunteer day in the garden for our annual Community Service Day in June. In addition to our labor, we will gift […]
Read More

Monthly Newsletter – April 2019

We are pleased to present the first-quarter 2019 edition of the Gardner Report, which provides insights into select counties of the Western Washington housing market. This analysis is provided by Windermere Real Estate Chief Economist Matthew Gardner. We hope that this information will assist you with making better-informed real estate decisions. For further information about […]
Read More

Quarterly Reports: Q1 2019 South Snohomish

Q1: January 1 – March 31, 2019   SOUTH SNOHOMISH COUNTY: Months of inventory was reduced as we finished out the first quarter of 2019. Months of inventory is the amount of months it would take to sell out of homes if no new listings came to market. This illustrates the balance between supply and […]
Read More

Quarterly Reports: Q1 2019 North King County

Q1: January 1 – March 31, 2019   NORTH KING COUNTY: Months of inventory was reduced as we finished out the first quarter of 2019. Months of inventory is the amount of months it would take to sell out of homes if no new listings came to market. This illustrates the balance between supply and […]
Read More

Quarterly Reports: Q1 2019 Seattle Metro

Q1: January 1 – March 31, 2019   SEATTLE METRO: Months of inventory was reduced as we finished out the first quarter of 2019. Months of inventory is the amount of months it would take to sell out of homes if no new listings came to market. This illustrates the balance between supply and demand. We […]
Read More

Quarterly Reports: Q1 2019 Eastside

Q1: January 1 – March 31, 2019   EASTSIDE: Months of inventory has reduced as we finished out the first quarter of 2019. Months of inventory is the amount of months it would take to sell out of homes if no new listings came to market. This illustrates the balance between supply and demand. We peaked […]
Read More

Quarterly Reports: Q1 2019 North Snohomish County

Q1: January 1 – March 31, 2019   NORTH SNOHOMISH COUNTY: Months of inventory was reduced as we finished out the first quarter of 2019. Months of inventory is the amount of months it would take to sell out of homes if no new listings came to market. This illustrates the balance between supply and […]
Read More

Quarterly Reports: Q1 2019 South King County

Q1: January 1 – March 31, 2019   SOUTH KING COUNTY: Months of inventory was reduced as we finished out the first quarter of 2019. Months of inventory is the amount of months it would take to sell out of homes if no new listings came to market. This illustrates the balance between supply and […]
Read More

Consulting your trusted advisor vs following the media

  Spring is in the air! The bulbs are starting to poke out of the ground and we recently hit 70 degrees in the Greater Seattle area. This is the time of year, due to weather and the end of the school year approaching, that the local real estate market starts to take off with activity. Not […]
Read More

Is it better to rent or own?

The current break-even horizon* in the Seattle Metro area is 1.69 years!   *The amount of time you need to own your home in order for owning to be a superior financial decision. With expensive rental rates, historically low interest rates, and home prices softening, there are advantages to buying versus renting. In fact, the Seattle Metro […]
Read More

Monthly Newsletter – February 2019

Most recently, we have experienced an uptick in market activity. In fact, in King and Snohomish counties we saw a 53% increase in pending sales from December to January. While it is seasonally normal to see activity increase at the first of the year, it was 16% higher than the previous January. This increase is being driven […]
Read More

Get a Jump on Spring Cleaning

  Whether you hire an outside professional for help, or tackle the project yourself, now is a great time to get a jump on spring cleaning. Many people wait for warmer temps to start cleaning, but I think most everyone can agree that those weekends would be better spent outdoors, soaking up that sun. So, […]
Read More

Monthly Newsletter – January 2019

Happy 2019! As we head into the New Year, it’s a great time to look ahead to what the real estate market has in store. Just last week, I had the pleasure of hosting an Economic Forecast Event with Windermere’s Chief Economist, Matthew Gardner, and soaked up his knowledge and predictions. Below are his general […]
Read More

Quarterly Reports: Q4 South King County

Q4: October 1 – December 31, 2018   SOUTH KING COUNTY: 2018 was a year of change and growth. The market shifted from an extreme seller’s market, but still had strong gains. Year-over-year, median price is up 9% and since 2012 has increased 89%! Over the last 19 years, the average year-over-year price increase has been 6%. This puts into perspective the growth we have […]
Read More

Quarterly Reports: Q4 Eastside

Q4: October 1 – December 31, 2018   EASTSIDE: 2018 was a year of change and growth. The market shifted from an extreme seller’s market, but still had strong gains. Year-over-year, median price is up 8% and since 2012 has increased 87%! Over the last 19 years, the average year-over-year price increase has been 6%. This puts into perspective the growth we have experienced, resulting […]
Read More

Quarterly Reports: Q4 Seattle Metro

Q4: October 1 – December 31, 2018   SEATTLE METRO: 2018 was a year of change and growth. The market shifted from an extreme seller’s market, but still had strong gains. Year-over-year, median price is up 9% and since 2012 has increased 93%! Over the last 19 years, the average year-over-year price increase has been 6%. This puts into perspective the growth we have experienced, […]
Read More

Quarterly Reports: Q4 North King County

Q4: October 1 – December 31, 2018   NORTH KING COUNTY: 2018 was a year of change and growth. The market shifted from an extreme seller’s market, but still had strong gains. Year-over-year, median price is up 9% and since 2012 has increased 92%! Over the last 19 years, the average year-over-year price increase has been 6%. This puts into perspective the growth we […]
Read More

Quarterly Reports: Q4 North Snohomish County

Q4: October 1 – December 31, 2018   NORTH SNOHOMISH COUNTY: 2018 was a year of change and growth. The market shifted from an extreme seller’s market, but still had strong gains. Year-over-year, median price is up 9% and since 2012 has increased 88%! Over the last 19 years, the average year-over-year price increase has been 6%. This puts into perspective the growth we have […]
Read More

Quarterly Reports: Q4 South Snohomish County

Q4: October 1 – December 31, 2018   SOUTH SNOHOMISH COUNTY: 2018 was a year of change and growth. The market shifted from an extreme seller’s market, but still had strong gains.  Year-over-year, median price is up 9% and since 2012 has increased 85%! Over the last 19 years, the average year-over-year price increase has been 6%. This puts into perspective the growth […]
Read More