
 Facebook
 X
X
 Pinterest
 Copy Link
Quarterly Reports: Q4 South King County
Q4: October 1 – December 31, 2018
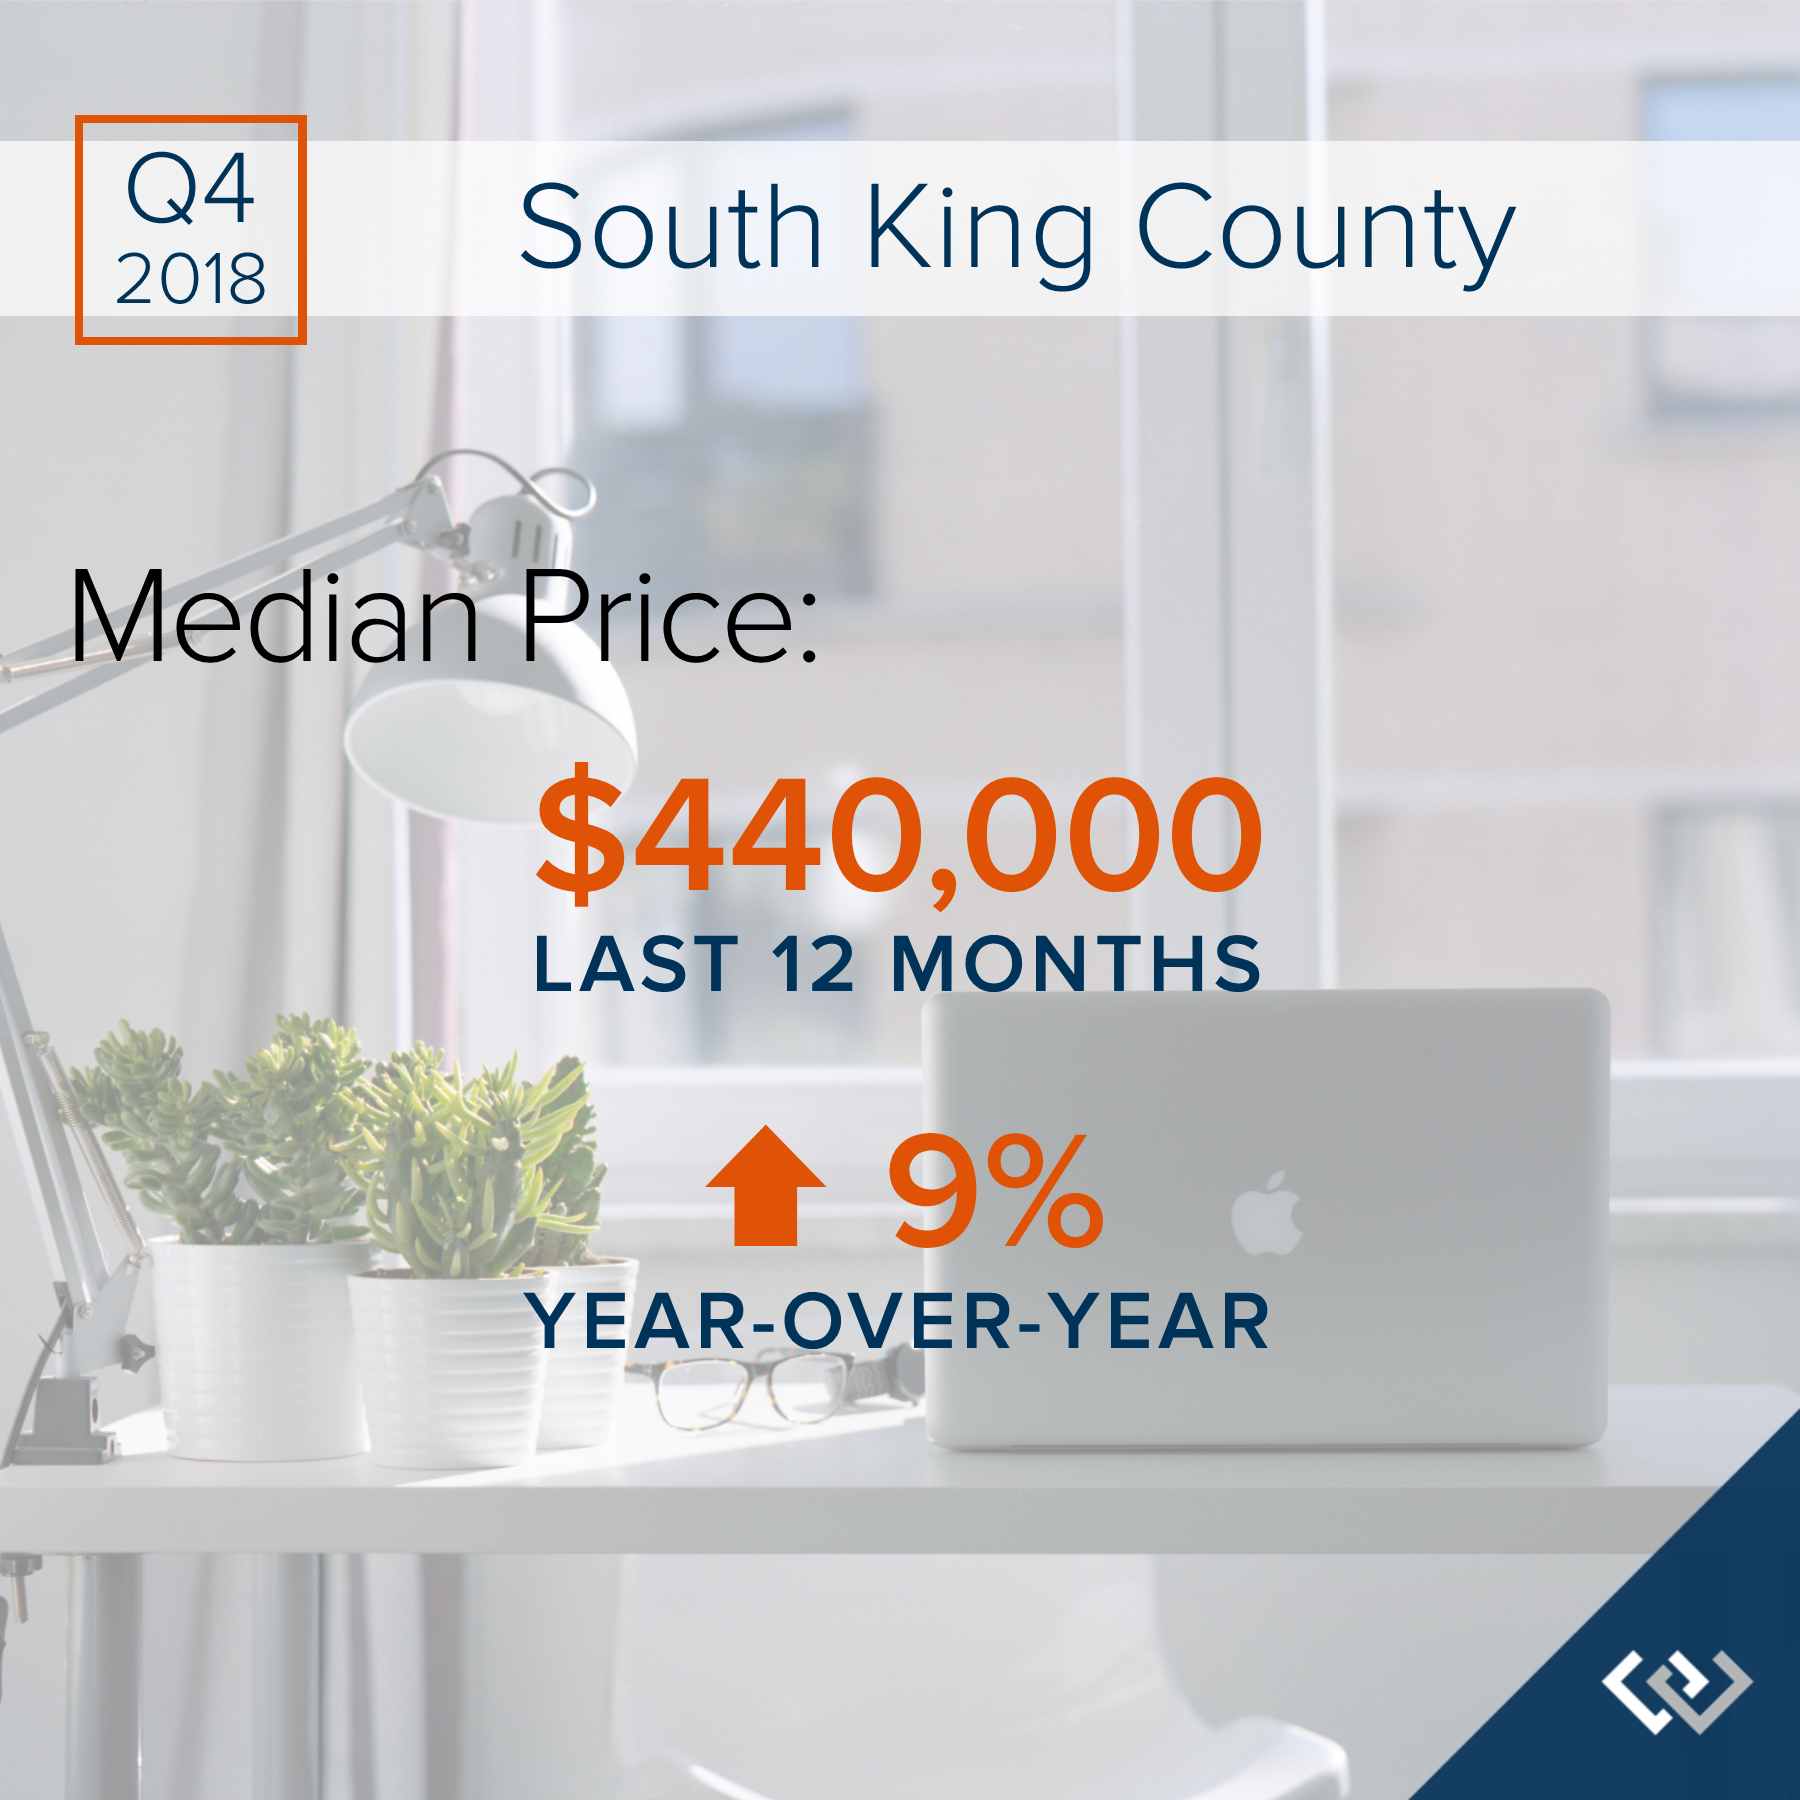
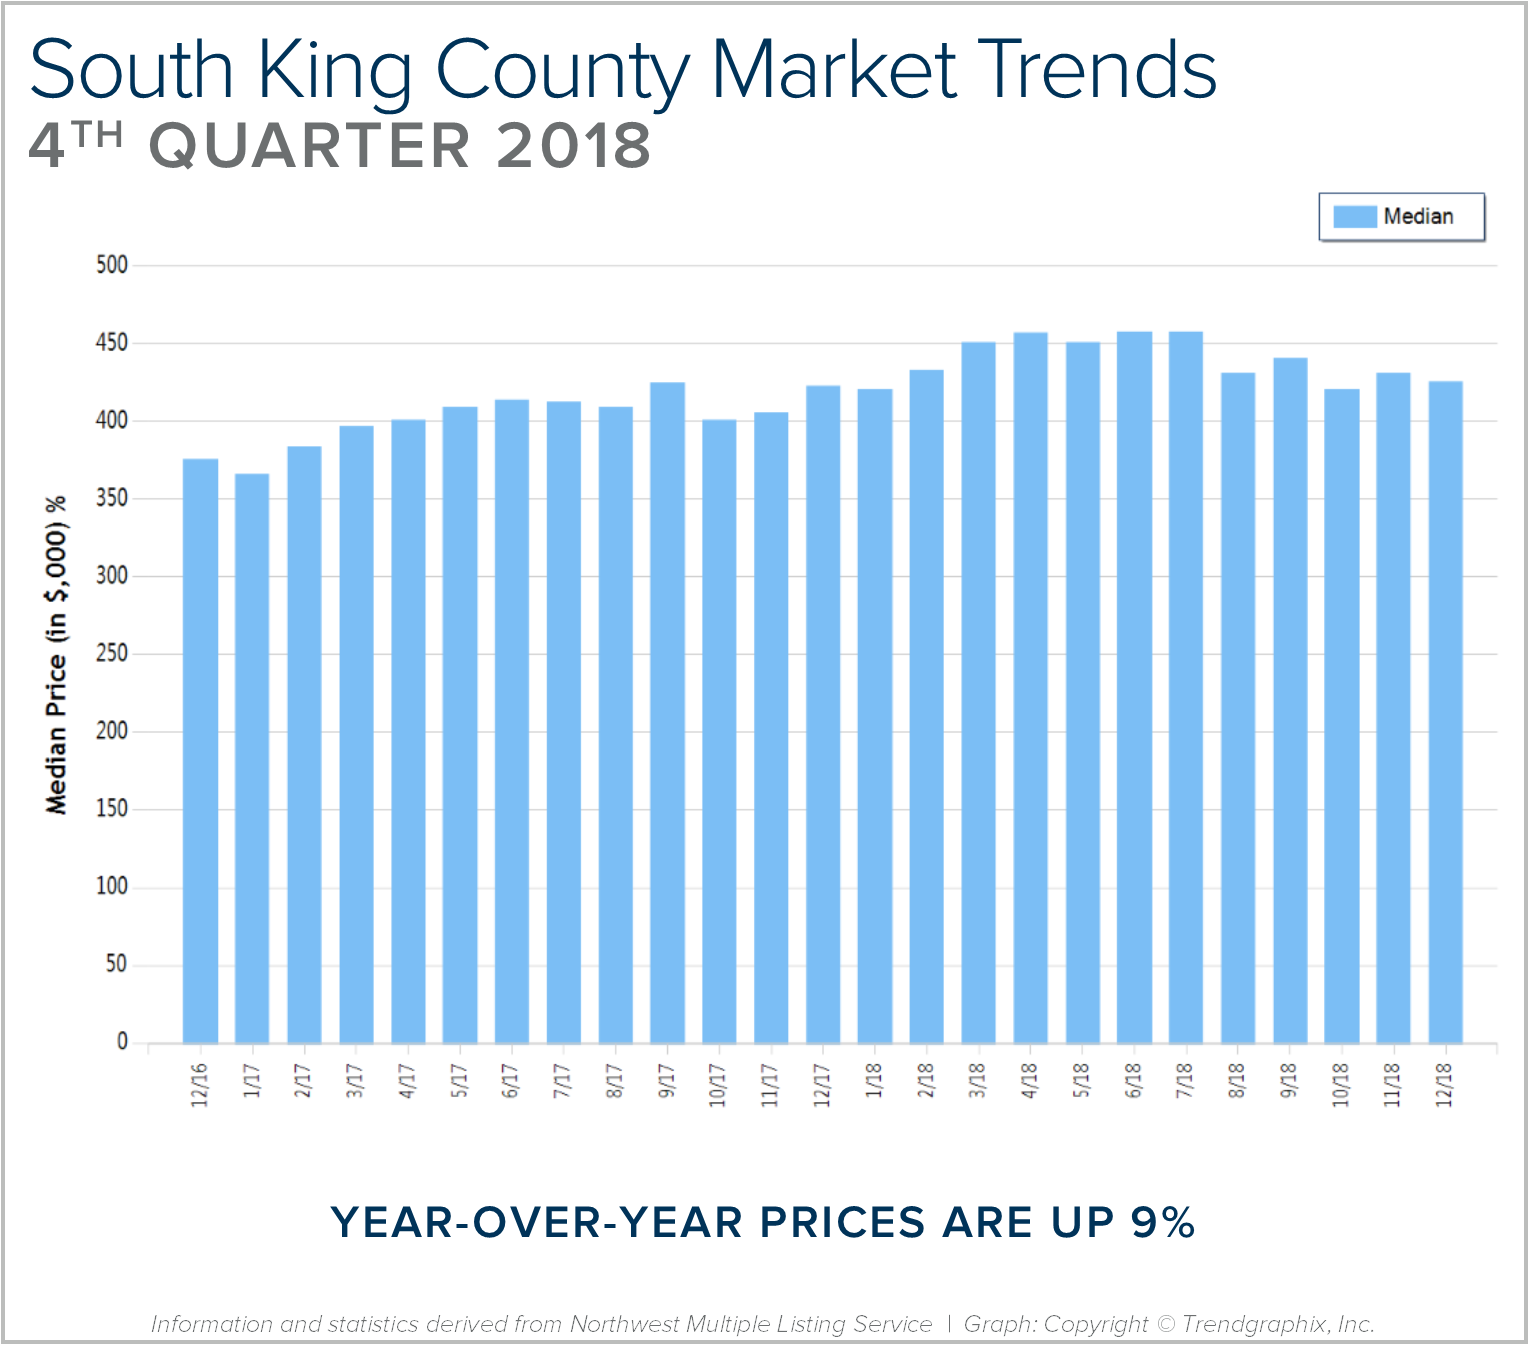
SOUTH KING COUNTY: 2018 was a year of change and growth. The market shifted from an extreme seller’s market, but still had strong gains. Year-over-year, median price is up 9% and since 2012 has increased 89%! Over the last 19 years, the average year-over-year price increase has been 6%. This puts into perspective the growth we have experienced, resulting in well-established equity levels. In 2018, inventory averaged 1.7 months, 30% more than 2017. This caused the month-over-month price gains to slow, and we experienced a price correction over the second half of the year. We expect to see more average levels of price appreciation in 2019 as the market continues to balance out.
After six years of expansion resulting in an extreme seller’s market, in 2018 we encountered a market shift in the late spring. Inventory increased, interest rates took a jump, and demand took a step back to re-evaluate the new playing field. This resulted in a tempering of month-over-month price appreciation, and has established some long-awaited balance. This balance has brought opportunities for both buyers and sellers. Buyers have more selection and are negotiating terms like inspection items and concessions. Sellers are sitting on 6+ years of equity growth, and are now able to sell their home and make a move without fearing where they will land next. Interest rates are still well below the 30-year average, currently hovering just under 5%. We are seeing demand start to re-engage now that the new normal has settled in.
This is only a snapshot of the trends in south King County; please contact us if you would like further explanation of how the latest trends relate to you.
Quarterly Reports: Q4 Eastside
Q4: October 1 – December 31, 2018
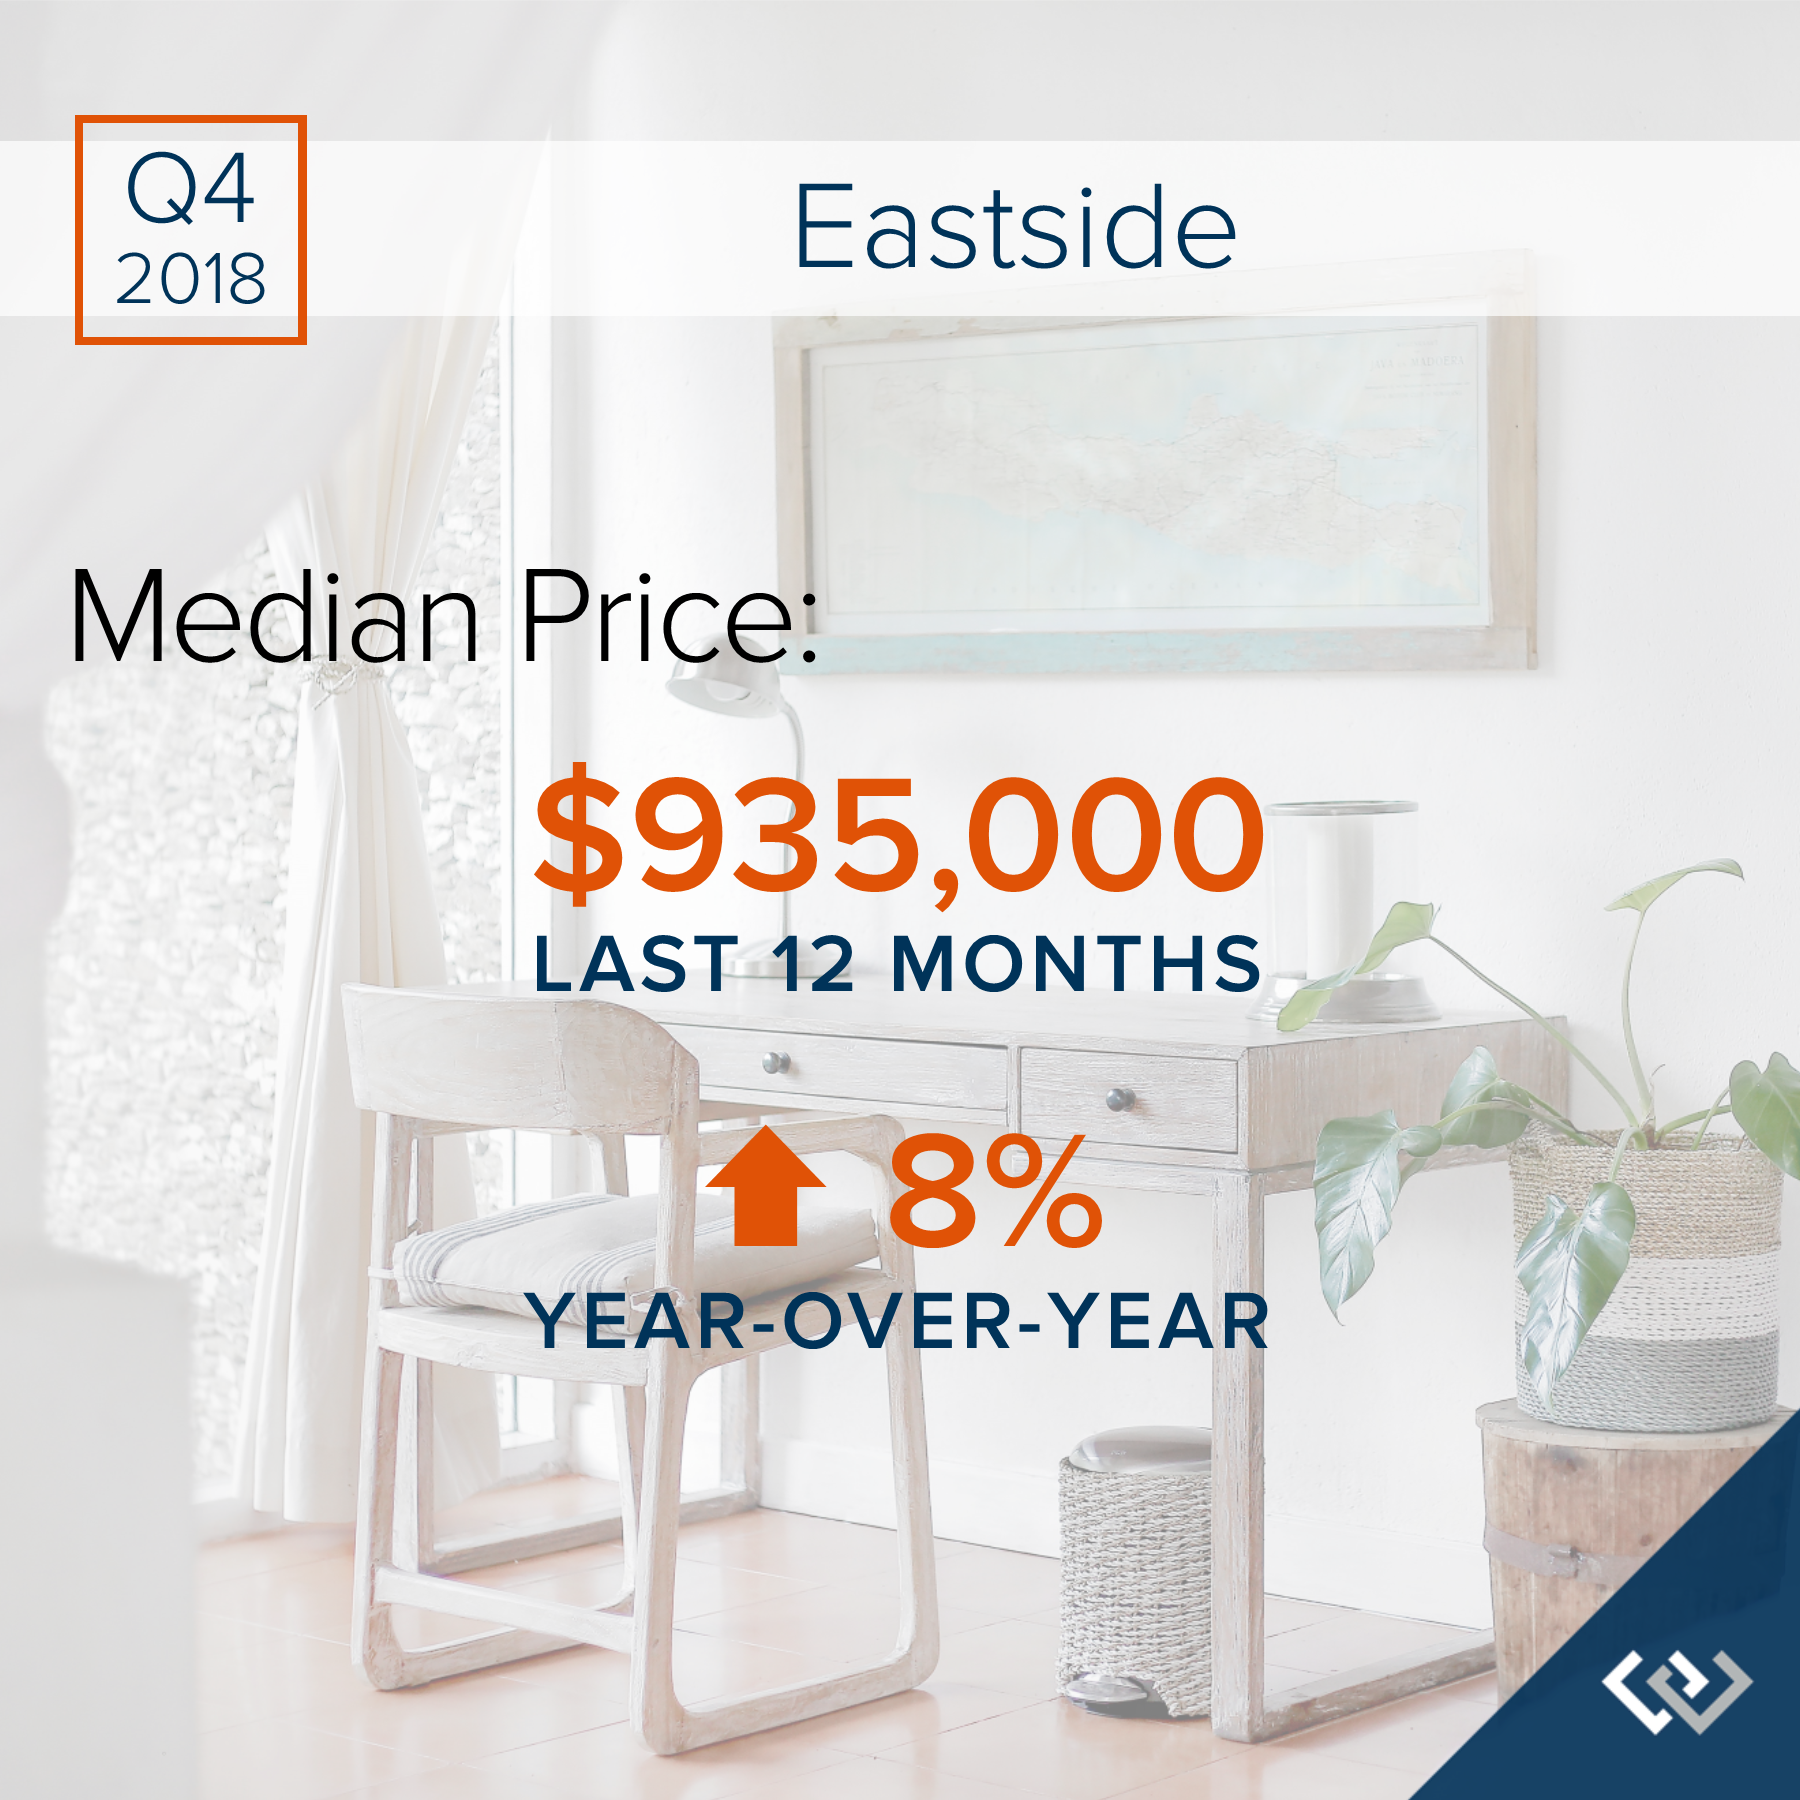
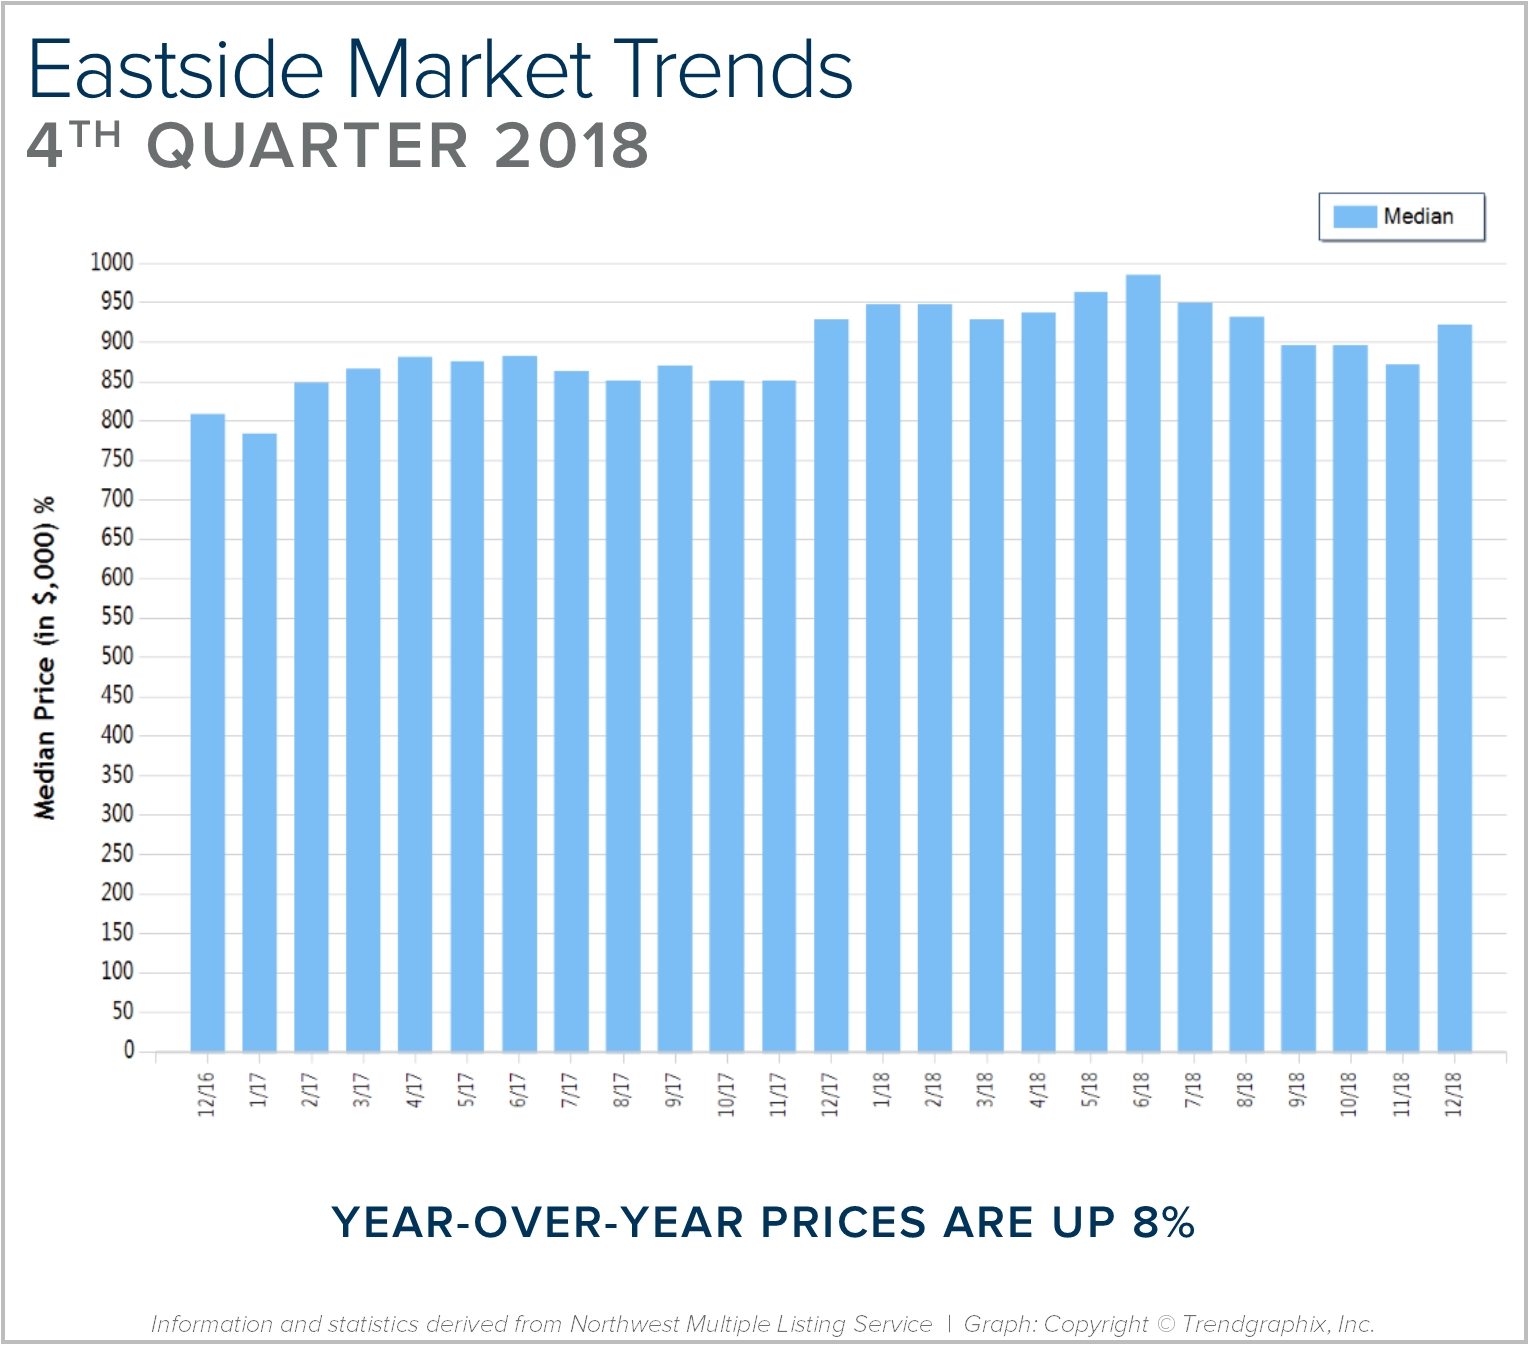
EASTSIDE: 2018 was a year of change and growth. The market shifted from an extreme seller’s market, but still had strong gains. Year-over-year, median price is up 8% and since 2012 has increased 87%! Over the last 19 years, the average year-over-year price increase has been 6%. This puts into perspective the growth we have experienced, resulting in well-established equity levels. In 2018, inventory averaged 2 months, double that of 2017. This caused the month-over-month price gains to slow, and we experienced a price correction over the second half of the year. We expect to see more average levels of price appreciation in 2019 as the market continues to balance out.
After six years of expansion resulting in an extreme seller’s market, in 2018 we encountered a market shift in the late spring. Inventory increased, interest rates took a jump, and demand took a step back to re-evaluate the new playing field. This resulted in a tempering of month-over-month price appreciation, and has established some long-awaited balance. This balance has brought opportunities for both buyers and sellers. Buyers have more selection and are negotiating terms like inspection items and concessions. Sellers are sitting on 6+ years of equity growth, and are now able to sell their home and make a move without fearing where they will land next. Interest rates are still well below the 30-year average, currently hovering just under 5%. We are seeing demand start to re-engage now that the new normal has settled in.
This is only a snapshot of the trends on the Eastside; please contact us if you would like further explanation of how the latest trends relate to you.
Quarterly Reports: Q3 North Snohomish
Q3: July 1 – September 30, 2018
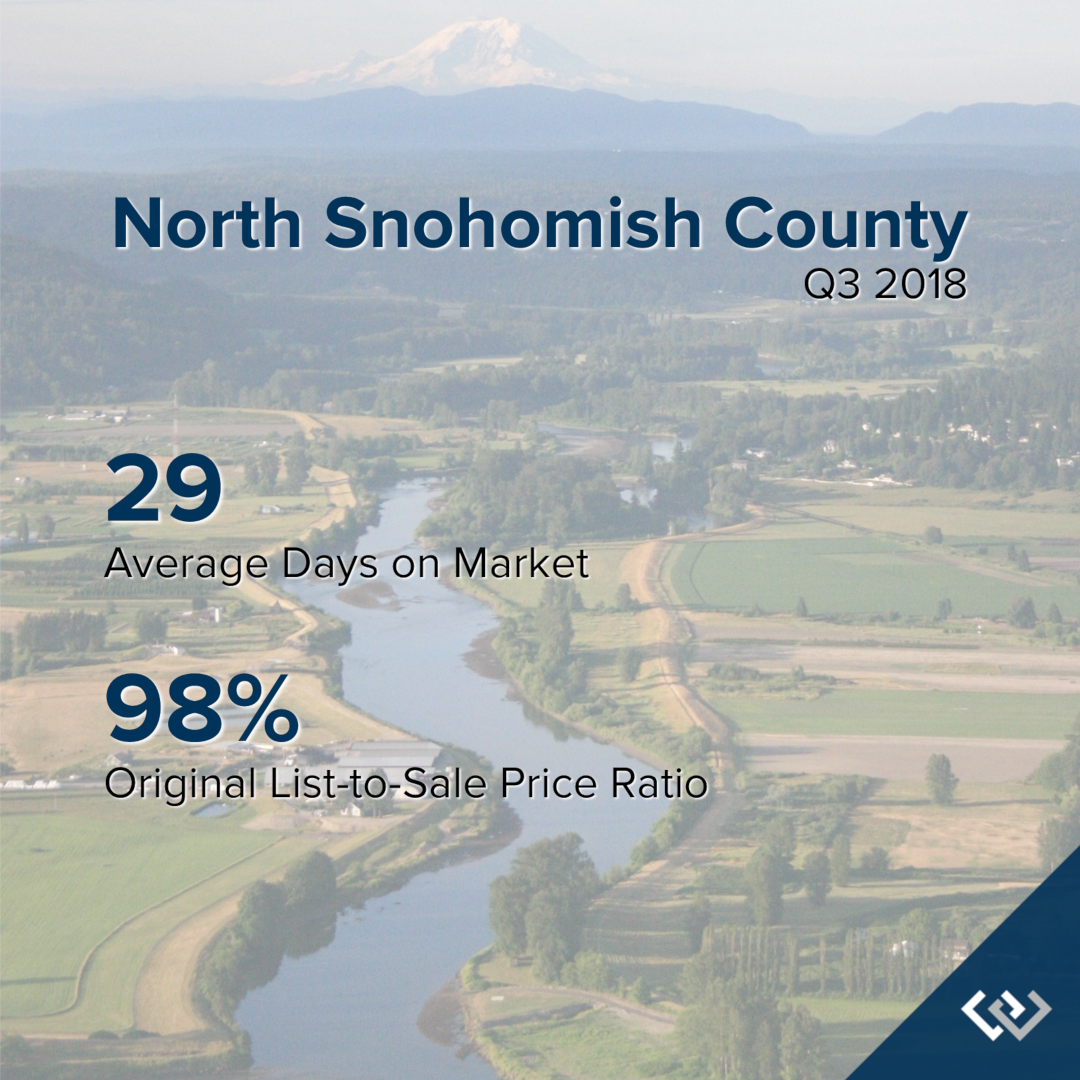
NORTH SNOHOMISH COUNTY: In September, the average days on market landed at 29 days and the original list-to-sale price ratio at 98%. Since May, inventory growth has been noticeable, and has given buyers more options. This has led to more negotiations and fewer bidding wars, which is tempering month-over-month price growth to a more sustainable level.
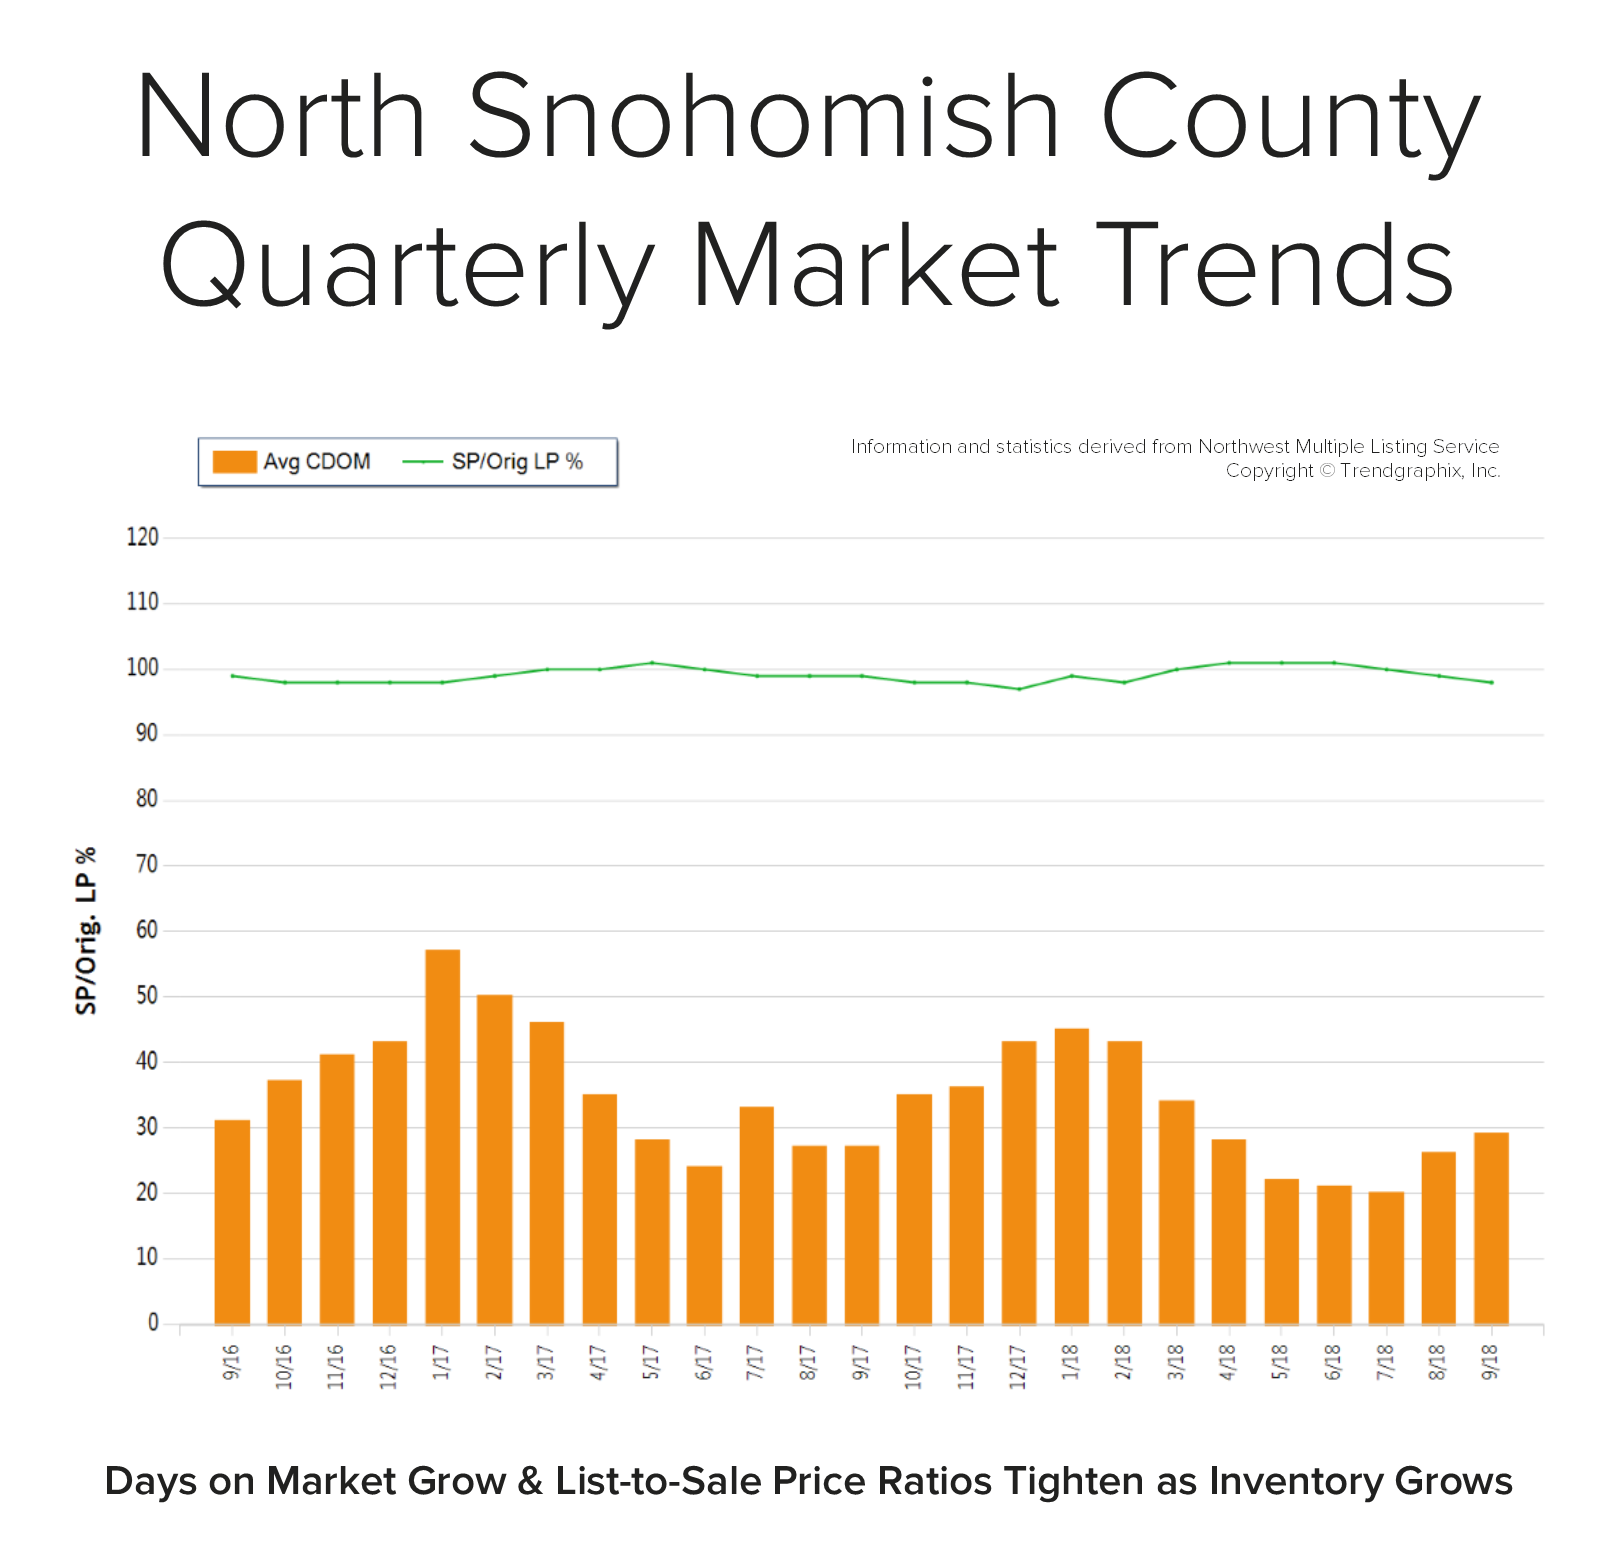 Back in May, the average days on market was 22 days and the original list-to-sale price ratio 101%; but months of inventory based on pending sales was 1 month compared to 2.3 months currently. Year-over-year, prices are up 11%, still well above the historical norm of 3%-5% year-over-year gains—but note that the majority of this growth happened during the spring, due to constricted inventory levels.
Supply has increased, creating more options for buyers and helping to buffer affordability issues. Many sellers are deciding to make moves and cash in on the equity gained over the last six years. An average original list-to-sale price ratio of 98% is a positive return, yet illustrates a softening in the market after some very extreme times. With 11% price growth over the last 12-months in a seller’s favor, the increase in selection has led to more nimble moves from one house to another. Where sellers need to be careful is anticipating the month-over-month price growth we saw prior to the shift in inventory. Prospective buyers would be smart to take advantage of today’s historically low interest rates and the added inventory selection.
This is only a snapshot of the trends in north Snohomish County; please contact me if you would like further explanation of how the latest trends relate to you.
Quarterly Market Trends: North Snohomish County
Q4 2017
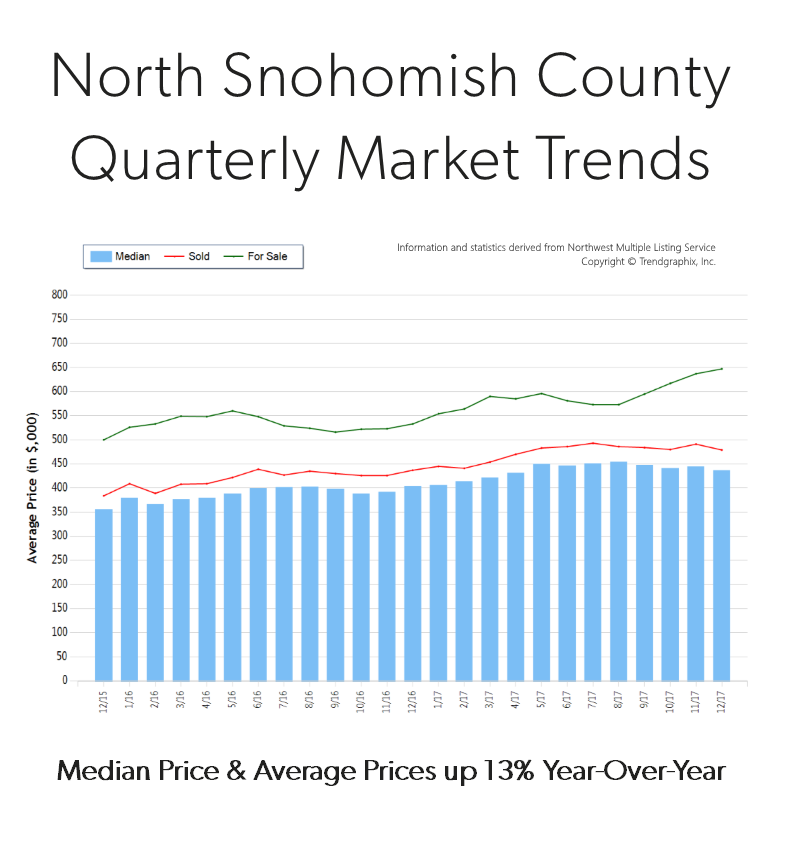
 Price growth was particularly strong in 2017! Median and average prices were up 13% over 2016. Median price in 2017 landed at $371,000 and the average at $400,000. The average amount of days it took to sell a house in 2017 was 35 days, which is 10% faster than 2016. The average list-to-sale price ratio over the last year was 99%, with the spring months as high as 101%! In 2017, inventory growth continued to be a challenge, with an 8% decrease in new listings compared to 2016. Even with inventory limitations there were 3% more sales! This phenomenon illustrates strong buyer demand and a need for more listings.
North Snohomish County real estate has seen a steady stream of buyers come our way due to affordability and quality of life. In fact, the median price in 2017 was 37% higher in south Snohomish County. Historically low interest rates continue to drive the market as well, they have helped offset the increase in prices. Sellers are enjoying great returns due to this phenomenon and buyers are securing mortgages with minor debt service.
This is only a snapshot of the trends in north Snohomish County; please contact us if you would like further explanation of how the latest trends relate to you.
Demystifying the Zestimate®

 Knowing the value of your home is helpful in many ways. It can help determine one’s net worth, help decide if a home sale or purchase is a financially feasible move, determine the ability to get a loan – and it’s just nice to know where your largest investment stands. Consumers have the option to access websites such as Zillow® to search the Zestimate® or other Automated Valuation Model (AVM) on their property.
A Zestimate is an AVM. The product of an automated valuation technology comes from analysis of public record data and computer decision logic combined to provide a calculated estimate of a probable selling price of a residential property. An AVM generally uses a combination of two types of evaluation, a hedonic model and a repeat sales index. The results of each are weighted, analyzed and then reported as a final estimate of value based on a requested date.
Often times when we talk with potential sellers, their Zestimate (or other AVMs) come up in the overall conversation, which is understandable. This information is relatively easy to access and gives the seller a starting point on the value of their home. Where an AVM can become dangerous is when a consumer thinks it’s accurate. Even worse, when a consumer makes a major financial decision solely based on this information. According to Zillow, less than half of all Zestimates in the Seattle metro area are even within 5.4% of the actual value, and they only give themselves a 2-star (fair) rating on their accuracy. In fact, they publish an accuracy report that you can view here.
In August, the average home price in the Seattle Metro area was $824,000. With less than half of all Zestimates within 5% of the actual value, that is a beginning margin of error of $41,200! Further, they claim that 72.3% of their Zestimates are within 10% of the actual value, which is a marked difference – up to $82,400. Where AVMs are incomplete is that the basis of their formula is tax records, which in our experience are often inaccurate. Also, and most importantly, an AVM does not take into consideration the condition of the home, the neighborhood and other environmental impacts such as school district, road noise and unsightly neighboring homes, to name a few.
At the end of the day, to give an accurate accounting of the value of a home in today’s market requires actually physically touring the home and the surrounding homes that compare. As well as considering current market conditions such as supply and demand and seasonality. An algorithm cannot accomplish this, but a real estate broker can.
So why does the Zestimate exist? Zillow is a publicly traded company (ZG) and their website is their vehicle to create profit. The Zestimate drives consumers to the website who are often dipping their toe in the pool to see what their home might be worth, or searching available homes for sale. When a consumer is searching on the website they are surrounded by real estate broker and mortgage broker ads on every page. These real estate brokers and mortgage brokers are paying for that advertising space, which is how Zillow makes its money and why there is a Zestimate. The Zestimate is not a public service, it is a widget to bring eyes to their advertising space which in turn, sells more ads.
Another important item to note is that Zillow does NOT have all available inventory in the Greater Seattle area on their website. In May, they cut off access to manually input listings, leaving some real estate firms unable to get their listings on the site any longer. Some firms just plainly chose not to syndicate to them. It is estimated that Zillow has between 70%-80% of the total available inventory on their site. In an inventory-tight market like the one we are in now, it is important for consumers to understand that if Zillow is the only source they are searching with, they may be missing out. Brokerage firm websites such as ours have a direct IDX feed from the Northwest Multiple Listing Service which refreshes every 15 minutes, insuring the accuracy and completeness of all listing data.

The moral of the story is this: use Zillow as one of the many tools in your real estate evaluation and search toolbox. Zillow provides a great starting point and contains a ton of information to whet your palate when embarking on a real estate endeavor. However, we live in a time of information overload and we are overstimulated at best. Nothing beats the evaluation and discernment of a knowledgeable and experienced real estate broker to help you determine accuracy, which will lead to the empowerment of clarity.
If you are curious about the value of your home in today’s market, please contact us. Any one of our experienced agents can provide an annual real estate review of all of your real estate holdings, or even dive deep into a complete comparative market analysis if you would find that helpful. It is our goal to help keep our clients informed and empower strong decisions.
Zillow® and Zestimate® are trademarks of Zillow, Inc.
Demand is High, Inventory Low… Here we Go!
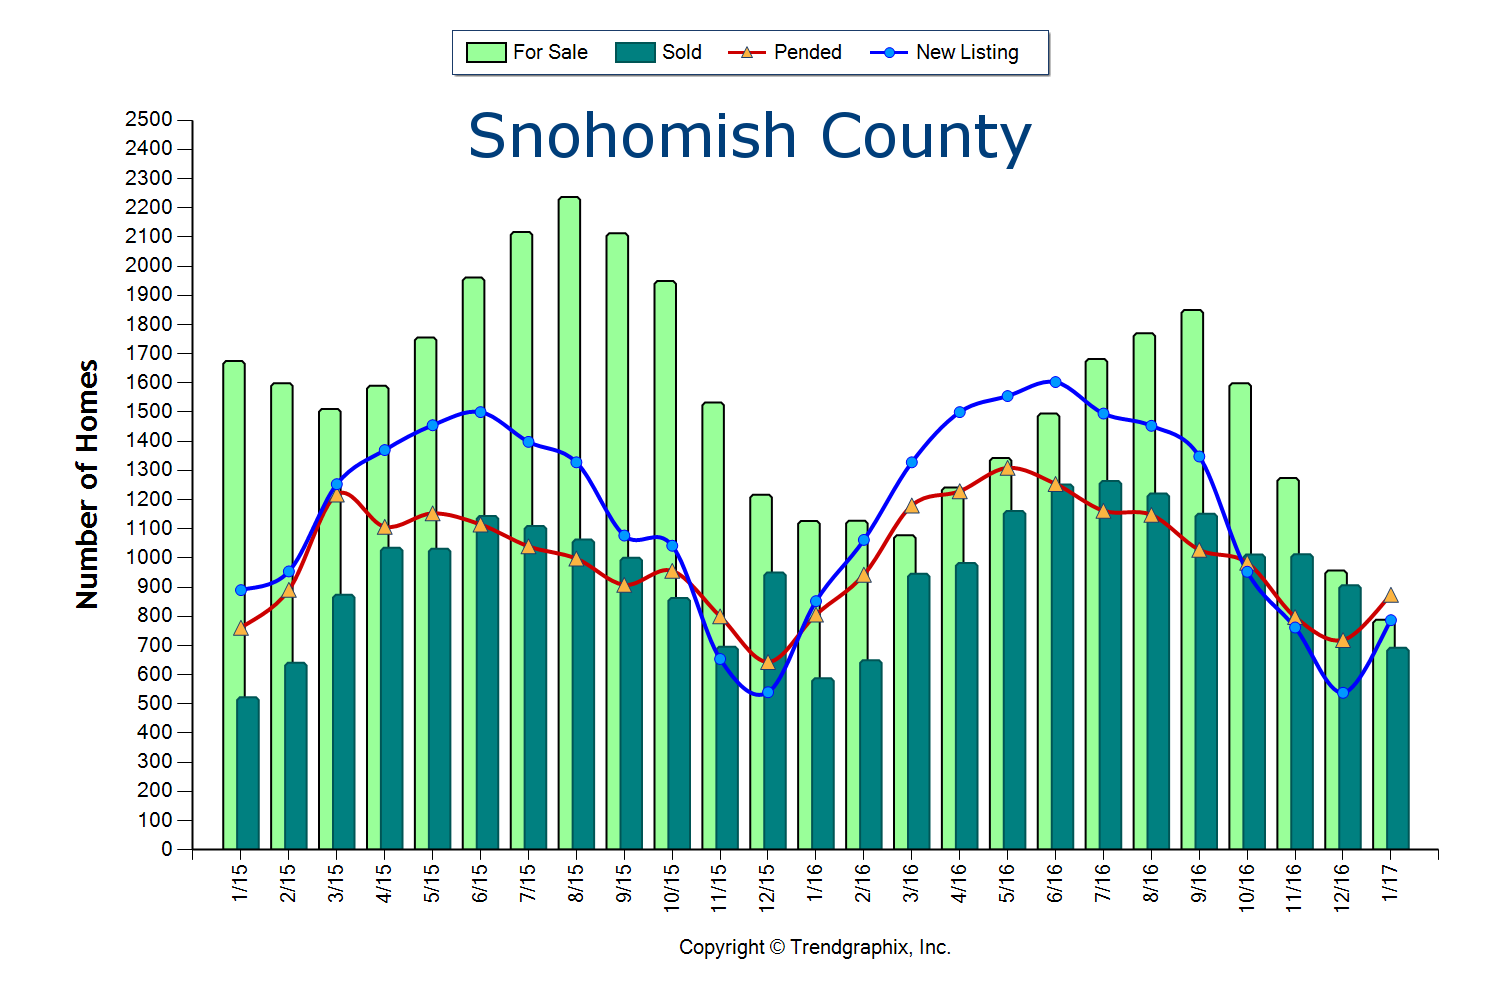
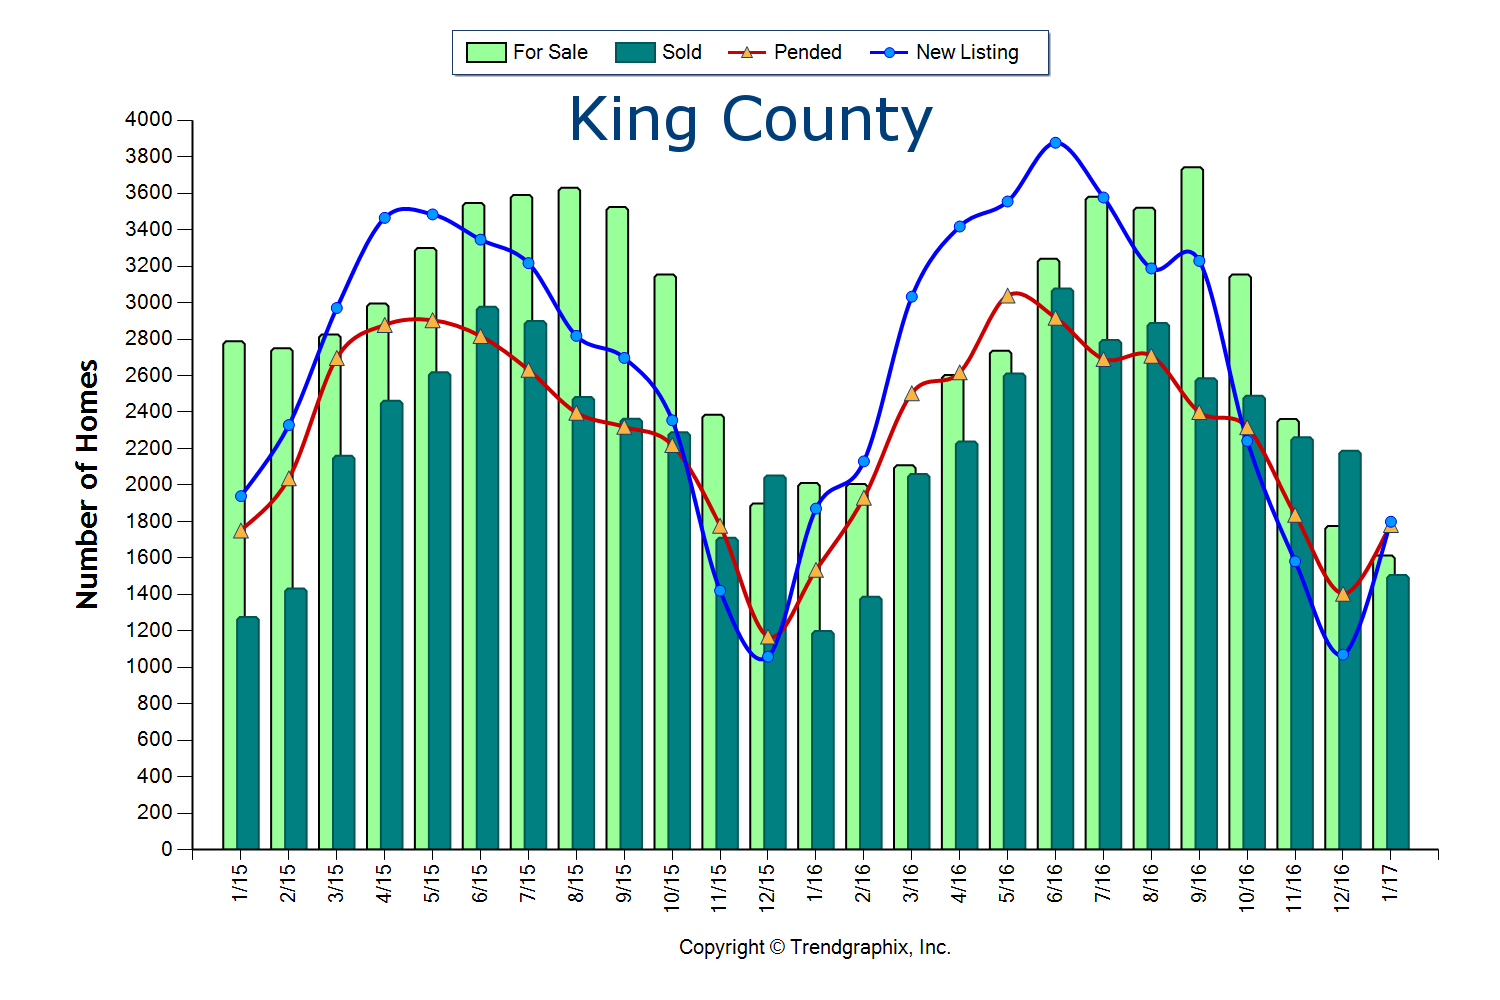
The two graphs here illustrate the amount of homes for sale, the amount of homes that sold, pending sales and new listings over the past two years in King and Snohomish Counties. This gives us a good look at the simple principle of supply and demand. We are currently experiencing one of the strongest Seller’s markets in recent history. A Seller’s market is defined by having three or less months of available inventory. Currently, King and Snohomish counties have only 0.9 months of inventory based on pending sales. This means that if no new homes came to market, we would be sold out of homes in less than a month. What is crazy is that this inventory count is down 30% from the year prior, which was also an extreme Seller’s market!
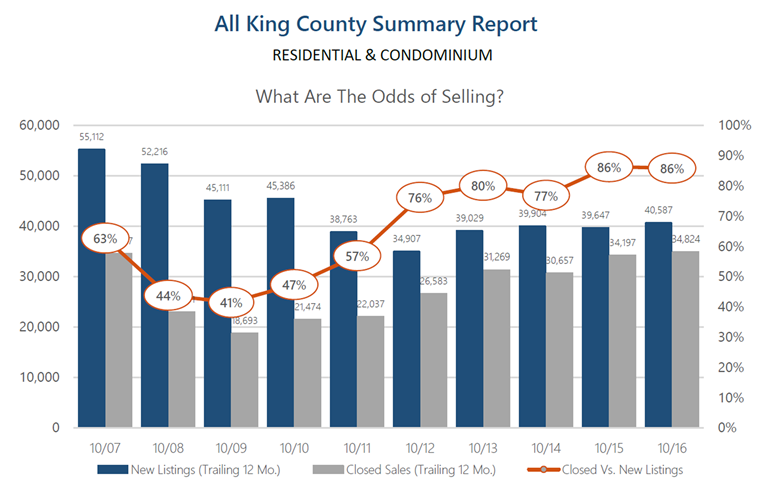
 Where this particular Seller’s market is unique, is that a decrease in new listings is not creating this environment, but very high buyer demand is. In fact, King County new listings were up 5% over the last year, but so were sales. In Snohomish County new listings were up 7% over last year, but sales were up 11%! Despite the increase in homes coming to market, demand has matched or outpaced, leaving us with the lowest inventory levels ever.
We can thank our local, thriving job market. So much so, that many people from out-of-state are relocating here to be a part of our economy and the quality of life the Greater Seattle area has to offer. We also have poised move-up buyers ready to cash in on their equity and first-timers ready for action. Combine the healthy local economy with strong equity levels and still historically low interest rates, and the audience for homes that come to market is huge!
Multiple offers are very common and prices are increasing. Median price is up complete year over year in King County by 13% and Snohomish County by 10%. This growth in equity has provided home owners the option to make the moves they have been waiting for, such as a move-up, right-size or relocating out of the area for retirement.
These graphs predict that we will see an increase in new listings as we head into the Spring and Summer months, which is needed to meet demand. If you are considering putting your home on the market this year I would advise the sooner the better, as buyers did not hibernate for the winter and will not be worried about flowers blooming in your front yard. Sellers that beat the second quarter increase in listings will enjoy a larger audience due to less competition.
 The importance of both buyers and sellers aligning with a knowledgeable, well-researched and responsive broker is paramount. One might think that it is “easy” to sell a house in this market, but how the preparation, exposure, marketing, management of all the communication and negotiations are handled can make or break a seller’s net return on the sale. While market times are short, they are intense! Negotiations are starting as soon as the property hits the market by educating buyers and their brokers on exactly what a seller would like by the time offers are due. The goal is to bring the sellers I work with not only the highest price, but the best-termed offer that I know is going to close.
If you’re a buyer, it is overwhelmingly important that you are aligned with an agent that knows how to win in this market. Terms, negotiations, financial preparation, communication, responsiveness and market knowledge are what set a highly capable selling agent apart, and are required to prevail. While the market for buyers is fierce, we can assure you that with a well thought out and executed plan, we have helped buyers win.
If you have any curiosities or questions regarding the value of your current home or purchase opportunities in today’s market, please contact us. It is my goal to help keep you informed and empower strong decisions.
You Don’t Need Tulips for a Strong Home Sale
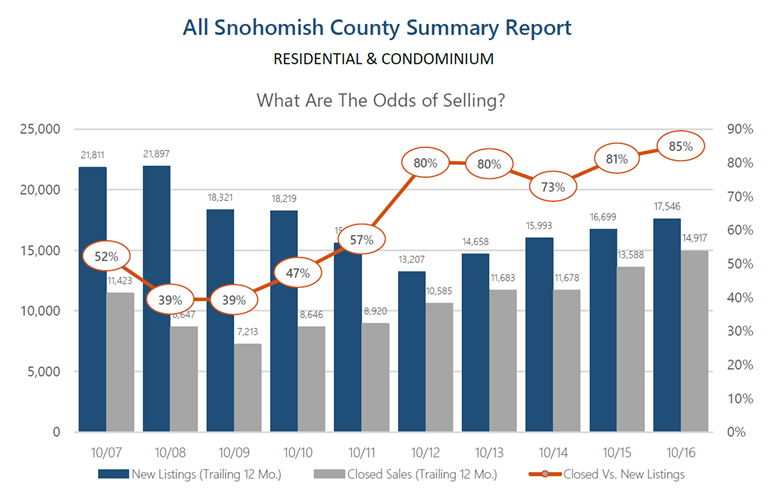 These graphs (click to view larger) above provide a 10-year history of the odds of selling in the month of October for both King and Snohomish Counties. As you can see, the odds of selling are at a 10-year high, hitting 86% in King and 85% in Snohomish. These are quite favorable odds for sellers and indicate what one might expect moving toward 2017.
Buyer demand remains very strong! In fact, pending sales reached peak levels in May of this year and continued with steady momentum throughout the summer and fall. Every month this year recorded a higher pending level than the same month the previous year. This illustrates strong buyer demand and is coupled with lower inventory levels than the year before. This combination has created very low months of available inventory, and we anticipate this continuing as we complete 2016 and head into 2017. For a potential seller, this means the market is in your favor, and waiting until the tulips bloom in April might have you lined up against more competition. Historically, we see inventory peak April through June, however pending sales have closely matched supply all throughout the year. With that said, one might consider bringing their home to market in the first quarter of the year versus the second, because they will have less competition, but still enjoy an engaged buyer audience.
Most recently we have seen interest rates bump up a bit, and this has created more urgency in the market. While still historically low, buyers are smart enough to know that cheap money is a huge long-term savings. Paying attention to all of these market factors will empower one to make the best real estate decisions. Please reach out if you are considering a move over the next year, and I’d be happy to apply this research and weigh in on your options.
Strategy is Key in an Extreme Market
 The beginning of 2016 has been quite the ride so far in our local real estate market. It has been the most extreme seller's market we've ever seen. At the end of February, both King and Snohomish Counties ended the month with only one month of inventory based on pending sales. Pending numbers (the amount of homes going under contract) were up 35% in King County from the previous month and up 24% in Snohomish over the previous month. Demand is strong! How we manage that demand is critical. Every type of market calls upon different skills to achieve the best outcome for our clients. In this extreme seller's market the strategy one creates for their sellers to gain the best possible outcome is a fine-tuned, high-effort approach.
First, market research and price positioning not only takes studying the history of the market, but anticipating what is next, so no opportunities are missed. Second, properly bringing the home to market is still paramount. Even though there are less homes to choose from in this market, how a home "shows up" could make a difference of thousands of dollars in return for a seller. An investment in professional photography, staging and marketing only adds to the exposure, increasing interest from the buying public. Third, managing the demand – this is huge! This is where communication and being the calm in the storm is key. It is always our goal to harness control and bring calm during the intense initial market time. It is not our goal to take the first offer that comes our seller's way. Instead it is our goal to massage what the home has to offer over a set period of time in order to garner a great price for our Sellers, but also superior terms, such as waived contingencies. Fourth, it is our goal to end with a contract that has a great price, but also one that will make it to the closing table. There are obstacles in this accelerating market, such as passing appraisal, which we anticipate up front to insure a smooth journey through closing.
 By completing extensive market research, studying upcoming trends, highlighting a property's features with superior marketing, executing a strategy to manage the demand and negotiating the best terms for our sellers, we are creating above market-average results! In the first two months of 2016, the average cumulative days on market in King County was 40.5 days and Snohomish County was 50.5. My office averaged 23 days and 25 days respectively. In those same two months the list to sale price ratio in King County was 100.5% and 99.5% in Snohomish County. My office averaged 101.2% and 103.1% respectively. Saved market time and higher price acceleration is resulting in a better bottom line for our clients.
These results do not come without a refined, strategic approach. Understanding the nuances that each market brings equals results in the best interest of our clients. If you or any one you know is contemplating participating in this extreme seller's market please contact one of our agents. It would be our honor to have the opportunity to help create and navigate a successful strategy resulting in a win.
