
 Facebook
 X
X
 Pinterest
 Copy Link
Consulting your trusted advisor vs following the media


Spring is in the air! The bulbs are starting to poke out of the ground and we recently hit 70 degrees in the Greater Seattle area. This is the time of year, due to weather and the end of the school year approaching, that the local real estate market starts to take off with activity. Not only is the sun thawing out gardens and backyard patios, helping to ready homes for market, but interest rates are continuing to fall, providing a heyday for buyers and sellers.
Spring is the time of year we see more homes come to market providing more selection for buyers. This is what we call our peak season. This spring, however, is especially meaningful due to the recent decrease in interest rates. Seasonality naturally brings more activity, but 2019 has started out with a downward trajectory in regards to interest rates, which has been a welcome shift after watching rates increase by almost an entire point over the course of 2018.
According to Ycharts.com, as of March 14th the US 30-year mortgage rate is at 4.31%, compared to 4.41% the week prior and 4.46% last year. This is quite a bit lower than the long term average of 8.07%. Additionally, rates are now over half a point lower than they were just four months ago, which gives buyers 5% more buying power. Meaning they can increase their price range by 5% and keep the same mortgage payment.
We are beginning to see a ton of activity at open houses, market times are starting to shrink, and multiple offers are popping up again. Demand is on the rise, with first-time home buyers out in full-force along with move-up and down-size buyers all going after the same inventory. Price appreciation will start to happen again month-over-month as the tulips start to open and veggie gardens start sprouting.
This assessment is not only factual and researched, it is anecdotal. You see, statistics are only reported monthly from the NWMLS, so the stories from the streets tell the real story of where we have been, what’s happening now, and where we are headed in the real estate market. My daily engagement with the market, either helping buyers or sellers, researching values, showing properties, negotiating contracts, and working on inspections and appraisals helps me to be informed of the trends before they are even reported.
Around the third of each month, the NWMLS distributes a press release to the media reporting the previous month’s statistics. The media grabs the numbers that are most exciting to them to craft a story around. They create headlines to entice readership, which in turn sells advertising. The problem is that these news stories often only tell part of the story.
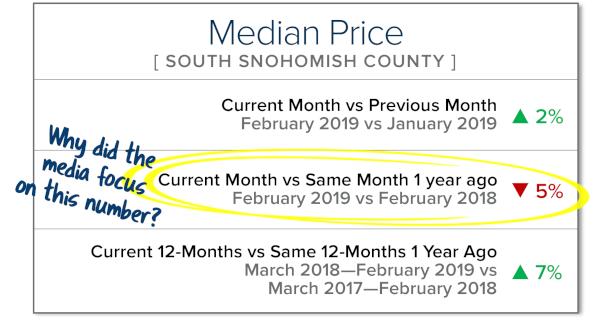
A classic example of cherry picked statistics used to create a headline came earlier this month. The Seattle Times reported in a sub-headline that Snohomish County home prices were falling at their fastest rate in seven years. This is simply not the whole truth. This is a common tactic of the media often only using month-over-month numbers (comparing the current month to the same month a year ago) versus a complete year-over-year analysis. Real estate is a long-term investment, and month-over-month numbers tend to provide more of a snapshot rather than a longer-term analysis of data and what influenced it.
We need to look at the data from all angles. Where were we a year ago, what has happened over the course of the last year in comparison to the previous year, and what happened this month compared to last month? Real-time experiences matter too, as the market changes weekly and even daily. Interactions throughout the month help me understand what opportunities the current environment will provide before the ink even dries on the media release. All of this helps us understand where we have come from and where we are headed. Couple that with front-line, daily experiences, and your trusted advisor can help you determine how all of this relates to your bottom line much more effectively than an article in the newspaper.
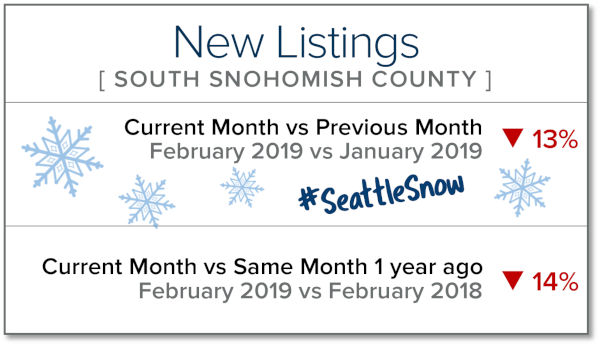
Another important factor to consider is that the bulk of the statistics reported in that monthly NWMLS press release are based on closed sales. While closed sales are very important, we must also closely track pending sales activity (homes currently under contract). Closed sales show where we have been and pending sales indicate where we are headed. February was a misleading month because of Snowmageddon. It halted new inventory reaching the market and kept buyers at home. The second half of February once the roads were cleared, had buyers lined up. Many of those buyers are anxiously waiting for that seasonal surge in inventory as we head into spring. This is indicated by conversations being had at open houses and one-on-one encounters with clients. Buyers want to take advantage of these surprisingly low interest rates now and sellers are enjoying the audience they are providing.
Unfortunately, the media is the initial source of information, and sometimes the only source a consumer considers when making such big decisions. I can’t tell you how often I encounter people that are grossly misled by alarming headlines and bite-sized bits of media when it comes to their largest asset, or the consideration of entering into home ownership.
Supply and demand illustrates where we are at in the market, and factors such as interest rates, the local and global economy, and simple things like weather and consumer mindset drive the market. Consumer mindset is influenced by the media. Take it a step further and make sure you are aligned with a professional who is committed to tracking all of this and can help explain how it all relates to you. Everyone has their own goals and their own concerns; it is the analysis of a well-researched trusted advisor that can help you navigate these meaningful financial decisions. It is our goal to provide our clients with the most up-to-date information to help empower strong decisions. If you are curious how this all relates to you, please reach out. We would be happy to connect you with agent who can discuss and help educate.
Quarterly Reports: Q4 South King County
Q4: October 1 – December 31, 2018
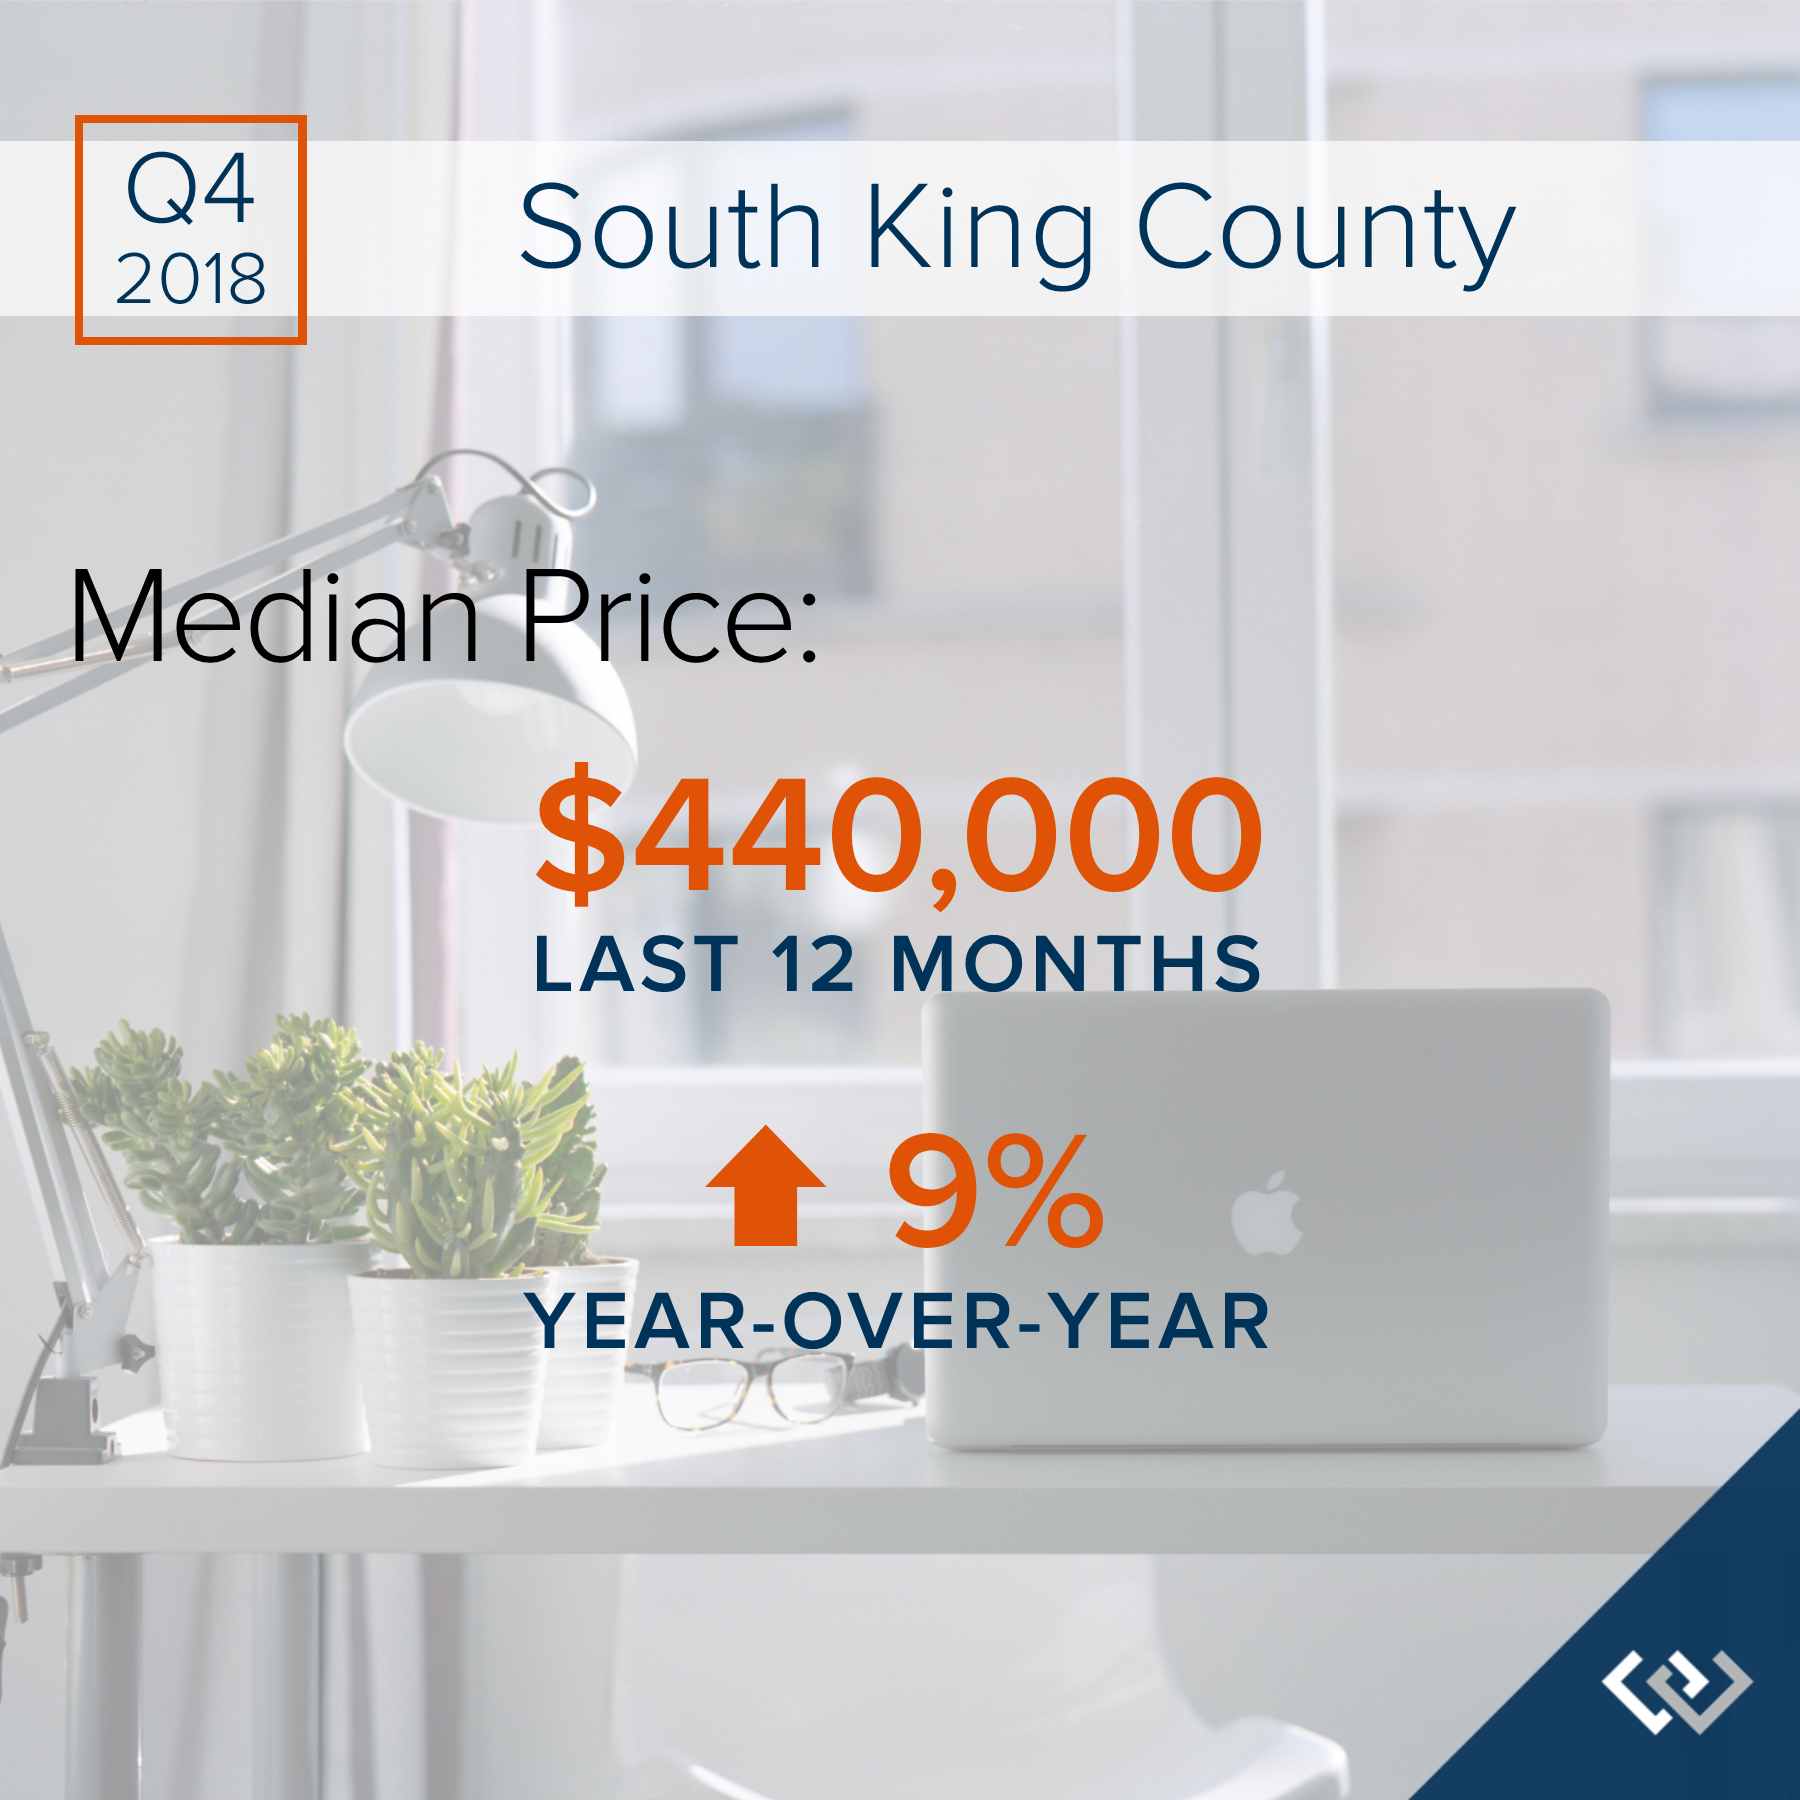
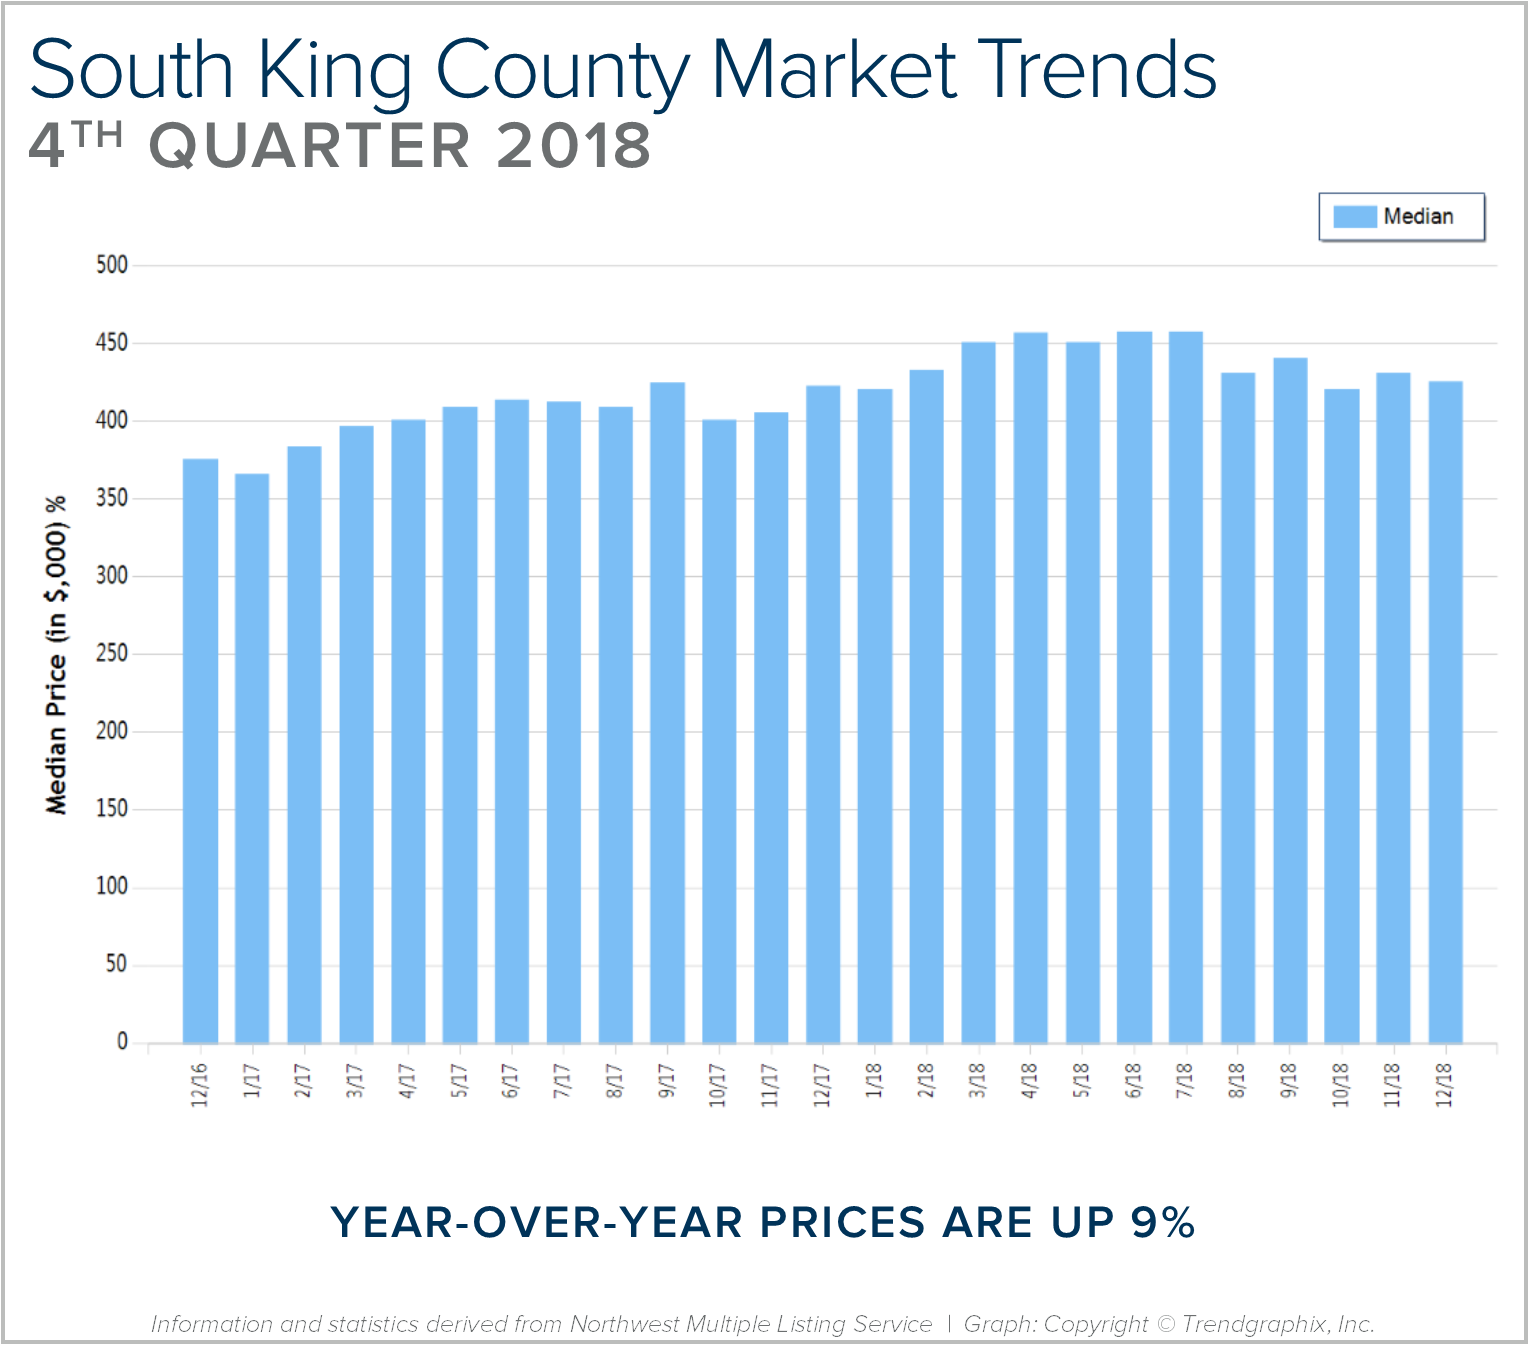
SOUTH KING COUNTY: 2018 was a year of change and growth. The market shifted from an extreme seller’s market, but still had strong gains. Year-over-year, median price is up 9% and since 2012 has increased 89%! Over the last 19 years, the average year-over-year price increase has been 6%. This puts into perspective the growth we have experienced, resulting in well-established equity levels. In 2018, inventory averaged 1.7 months, 30% more than 2017. This caused the month-over-month price gains to slow, and we experienced a price correction over the second half of the year. We expect to see more average levels of price appreciation in 2019 as the market continues to balance out.
After six years of expansion resulting in an extreme seller’s market, in 2018 we encountered a market shift in the late spring. Inventory increased, interest rates took a jump, and demand took a step back to re-evaluate the new playing field. This resulted in a tempering of month-over-month price appreciation, and has established some long-awaited balance. This balance has brought opportunities for both buyers and sellers. Buyers have more selection and are negotiating terms like inspection items and concessions. Sellers are sitting on 6+ years of equity growth, and are now able to sell their home and make a move without fearing where they will land next. Interest rates are still well below the 30-year average, currently hovering just under 5%. We are seeing demand start to re-engage now that the new normal has settled in.
This is only a snapshot of the trends in south King County; please contact us if you would like further explanation of how the latest trends relate to you.
A Love Letter to Buyers

We often share the advantages of this market for home sellers, which is unbelievably positive. However we thought it was time to give the potential buyers in our marketplace some love, hope, and of course data!
 Dear Greater Seattle Home Buyer,
Let’s just be up front: buying a home in today’s market is not easy. Quite frankly, it can be a wild roller coaster ride with twists and turns; but remember, folks pay a lot of money and stand in long lines for roller coaster rides. Imagine the excited pit in your stomach as the cart clicks up to the highest point before you plunge down a steep drop, and the thrill of raising your hands up because you trust that you are going to be okay. These emotions also accurately reflect the feelings of today’s home buyer – it can be a wild ride! Let’s also note that many roller coaster riders return to the back of the line right after getting off. Home ownership is also a good exercise to repeat and is often the investment that leads to the most built wealth in one’s life.
So how does one ensure that they are not the Nervous Nelly who stands in line for over an hour, finally makes it to the front to be strapped in to the cart, but who then chooses to bow out? The one that sits on the sidelines watching others throw up their hands with a thrill in their eye; the one with that tinge of regret as their friends rejoin them back on hallowed ground to recount their adventure. Wow, this is getting dramatic! Here are a few tips to follow that will ensure that one can find success securing a home in today’s market and get on the equity building train.
![]() Waiting is Even More Expensive
Waiting is Even More Expensive
In 2017, the year-over-year median price gains across our region were strong. In fact, here is a little break down.
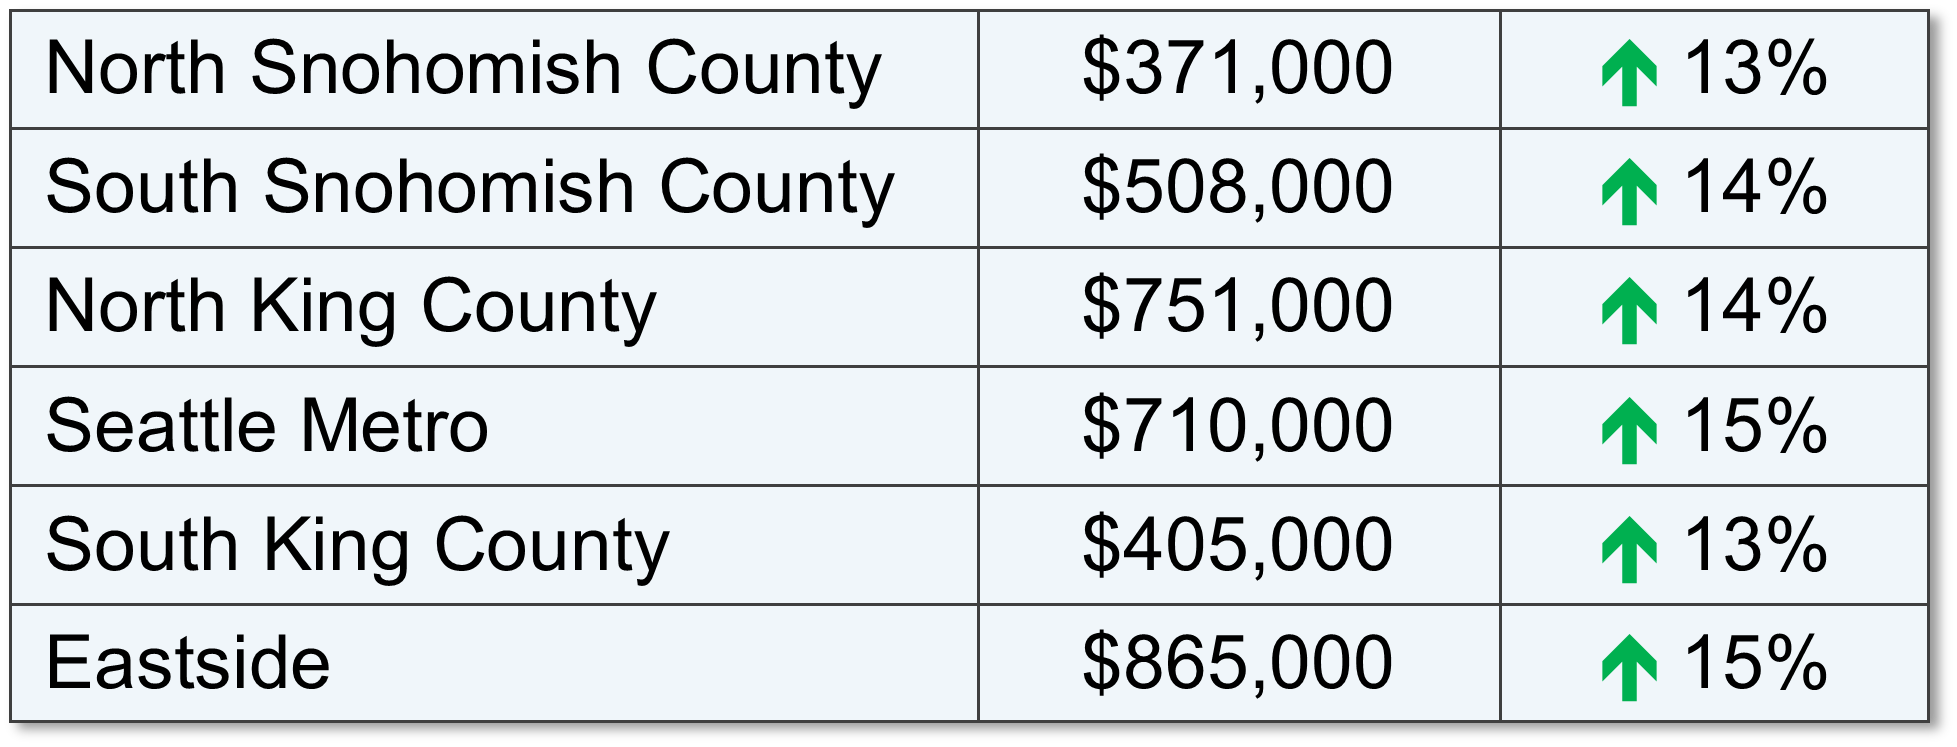
The appreciation is for real and as each month ticks by, prices are going up. That is why it is incredibly important to have a plan and realistic expectations. In referring to the chart above, it is plain to see the affordability of each area. Buyers have had to get creative and honest with themselves regarding the city or neighborhood in which they land. Commute times are one of the biggest indicators of home cost. It is paramount to line your budget up with a realistic commute time and then dig in. Too often we’ve seen buyers tightly grip to the idea of an in-city commute, only to have it end up being a more suburban choice in the end. The months wasted trying to perform in a market that didn’t match their budget ended up costing them at least 1% a month, based on last year’s appreciation. Getting real saves time, money, and heartache.
![]() Interest Rates are Rising
Interest Rates are Rising
This aspect is actually one to pay very close attention to. We have been amazingly spoiled with historically low interest rates over the last five years. In fact, there is an entire generation of buyers who only know rates that have hovered from 3.5 – 4.5% – that is close to 3 points under the 30-year average! A good rule of thumb regarding interest rates, is that for each 1-point increase a buyer loses 10% of their buying power. That means that if you have a $500,000 budget and the rate goes up by a point, that you are now shopping for a $450,000 house if you want the same payment. Note, that shift does not take appreciation into consideration. Today’s rates have helped buyers bear the home prices in our area. It is predicted that rates will rise in 2018 by .5 to 1%.
![]() Rents are High and Don’t Build Wealth
Rents are High and Don’t Build Wealth
Seattle is now the 5th most expensive city to rent in the country according to the US Census Bureau. With rising rental rates, still historically low interest rates, and home prices on the rise, the advantage of buying versus renting has become clear for folks who have a down payment saved, good debt-to-income ratios and strong credit. Currently, the breakeven horizon (the amount of time you need to own your home in order for owning to be a superior financial decision vs. renting) in the Greater Seattle area is 1.6 years according to Zillow research.
![]() Partner with a Broker Who Will Get the Job Done
Partner with a Broker Who Will Get the Job Done
A broker that has a process is key! It starts with an initial buyer consultation. I liken the buyer consultation to the seat belt you would wear on the roller coaster ride. The buyer consultation aims to unearth a buyer’s goals, research the areas they are interested in, address financing, and illustrate the challenges of the environment, so one can be successful. Time is money, and this consultation brings clarity, efficiency and trust. This upfront education coupled with a high level of communication and availability is paramount. The depth of the relationship will lead to success, and is the ingredient that enables a buyer to throw up their hands and take the thrilling plunge. It is hard to do that without a seat belt!
![]()
Get Your Finances in Order
Aligning with a trusted real estate professional is key, but so is aligning with a reputable and responsive mortgage lender. Getting pre-approved is the minimum, but getting pre-underwritten is a game changer. Finding a lender that is willing to put in the work up-front to vet credit, income, savings, debt, and all other financial indicators will lead to being pre-underwritten, which listing agents and sellers appreciate! Also, be aware that you do not always need to have a huge down payment to make a purchase work. Employment, assets, credit, and what you have saved all work into your ability to acquire a loan. I have seen plenty of people secure a home with 3-5% down. Education and awareness create clarity, and investing into understanding your financial footing equals empowered and more efficient decisions. Note that I mentioned “responsive”. This is a 24/7 market, and lenders who don’t work evenings and weekends can get in the way of a buyer securing a home. If you need a short list of lenders that fit this description, please contact me.
![]() ‘Tis the Season – Inventory is Coming
‘Tis the Season – Inventory is Coming
Have hope! This is the time of year where we see inventory climb month over month. There will be more selection, but bear in mind it is also the time of year that the appreciation push happens. If you are feeling 75-80% in love with a home, it is one to act on. You’re never going to “get it all”, so a willingness to focus on priorities will pay off, because waiting will have an expense.
If you or someone you know is considering a purchase in today’s market, please contact us. It is our pleasure to take the time to educate, devise a plan, and help buyers find success in a challenging, yet advantageous market.
Commute Times & Price Premiums: The Value of Location, Location, Location

It is the time of year when we like to re-cap the price premiums in our area based on commute times. The price divide continued in 2017 between key market areas in the Greater Seattle area based on proximity to major job centers. These pricing premiums have cemented the drive-to-qualify market. Seattle proper has always been more expensive than its neighboring suburbs, but the most current prices illustrate the extreme value of a shorter commute.
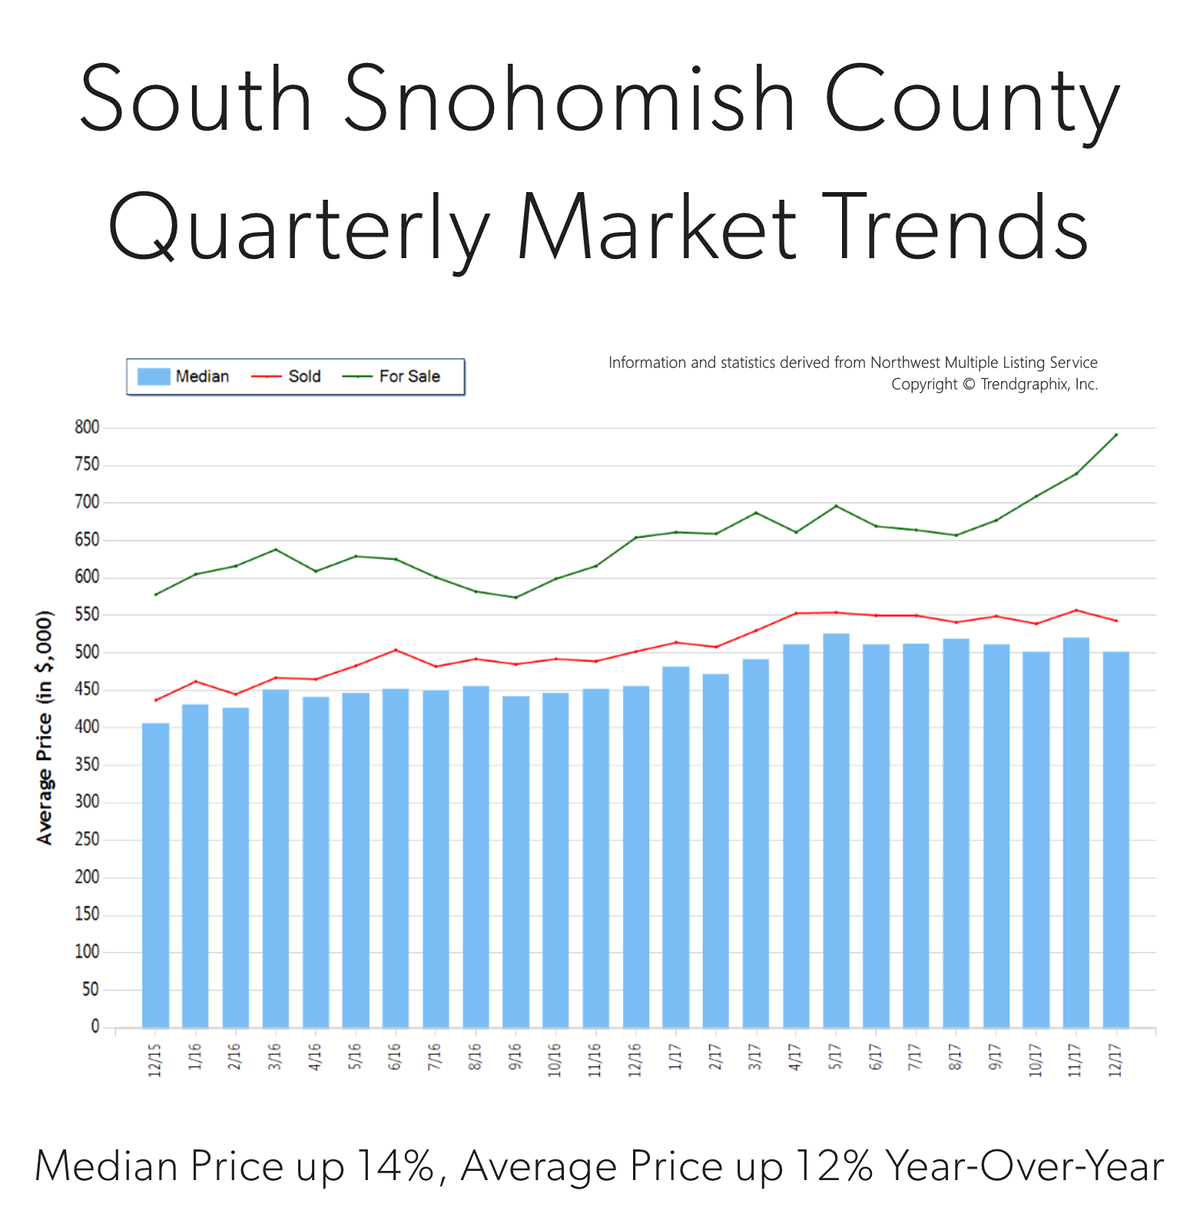
 In 2017, the average sales price for a single-family residential home in the Seattle Metro area was $801,000, up 14% from the year prior! In south Snohomish County (Everett to the King County line) the average sales price for a single-family residential home in 2017 was $543,000, up 12% from the year prior, however 48% less expensive than Seattle Metro.
Further, if you jump across Lake Washington to the Eastside, the average sales price in 2017 for a single-family residential home was $1,049,000, up 16% from the year prior and 31% more expensive than Seattle Metro! The Eastside has the infrastructure to support their own job centers, making it a second “Seattle”, with the benefit of newer and larger housing stock, which reflects the pricing. Many folks are living and working on the Eastside, or using the 520 toll bridge to jump over to Seattle.
In 2017, closed transactions were up 4% in south Snohomish County despite fewer new listings coming to market, which I think was driven by its affordability compared to Seattle and the Eastside. Snohomish County offers lower prices, larger houses and yards, new construction, lower taxes, strong school district options and longer, yet manageable commute times. Newer transit centers and telecommuting have also opened up doors to King County’s little brother to the north.
Another hot button that has continued to influence pricing is the future expansion of Light Rail and the locations of the planned stations. We have seen home values in these areas sell at a premium as consumers anticipate the shorter commute times the rail will bring. These neighborhoods are experiencing zoning changes now and the additional expansion is being phased in over the course of the next 15 years. There will be more multi-family and commercial development in these areas, creating more density to serve the public using these commuting services. This has created great appeal for homeowners that want to get in on the ease of nearby public transportation, and developers eager to be part of the infrastructure growth. Stations at Northgate, 145th & 185th in Shoreline, Mountlake Terrace and Lynnwood are all slated to open over the next 3-6 years.
No matter what neighborhood you are interested in learning about, in either King or Snohomish County, we are happy to provide a 2017 re-cap of that market. We work in both counties and understand each of their nuances. 2017 was another eventful year in real estate and we are looking for that to continue in 2018. With these strong market prices, we hope to see an increase in inventory levels, providing more options for buyers and allowing price growth to temper to sustainable levels.
Here’s to a successful 2018!
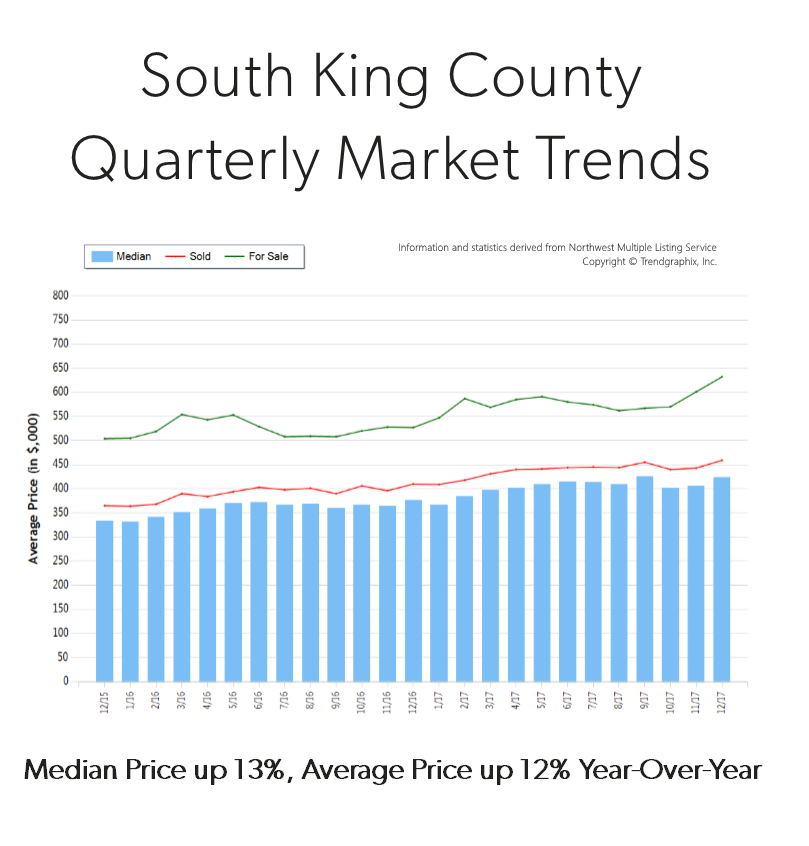
Quarterly Market Trends: South King County
 Q4 2017
 Q4 2017
Price growth was particularly strong in 2017! Median was up 13% and average price up 12% over 2016. Median price in 2017 landed at $405,000 and the average at $440,000. The average amount of days it took to sell a house in 2017 was 30 days which is 9% faster than 2016. The average list-to-sale price ratio over the last year was 100%, with the spring months as high as 102%! In 2017, inventory growth continued to be a challenge, with a 7% decrease in new listings compared to 2016. Even with inventory limitations there were 2% more sales! This phenomenon illustrates strong buyer demand and a need for more listings.
South King County real estate has seen a steady stream of buyers come our way due to affordability, reasonable commute times and quality of life. In fact, the median price in 2017 was 75% higher in Seattle Metro. Historically low interest rates continue to drive the market as well, they have helped offset the increase in prices. Sellers are enjoying great returns due to this phenomenon and buyers are securing mortgages with minor debt service.
This is only a snapshot of the trends in south King County; please contact me if you would like further explanation of how the latest trends relate to you.
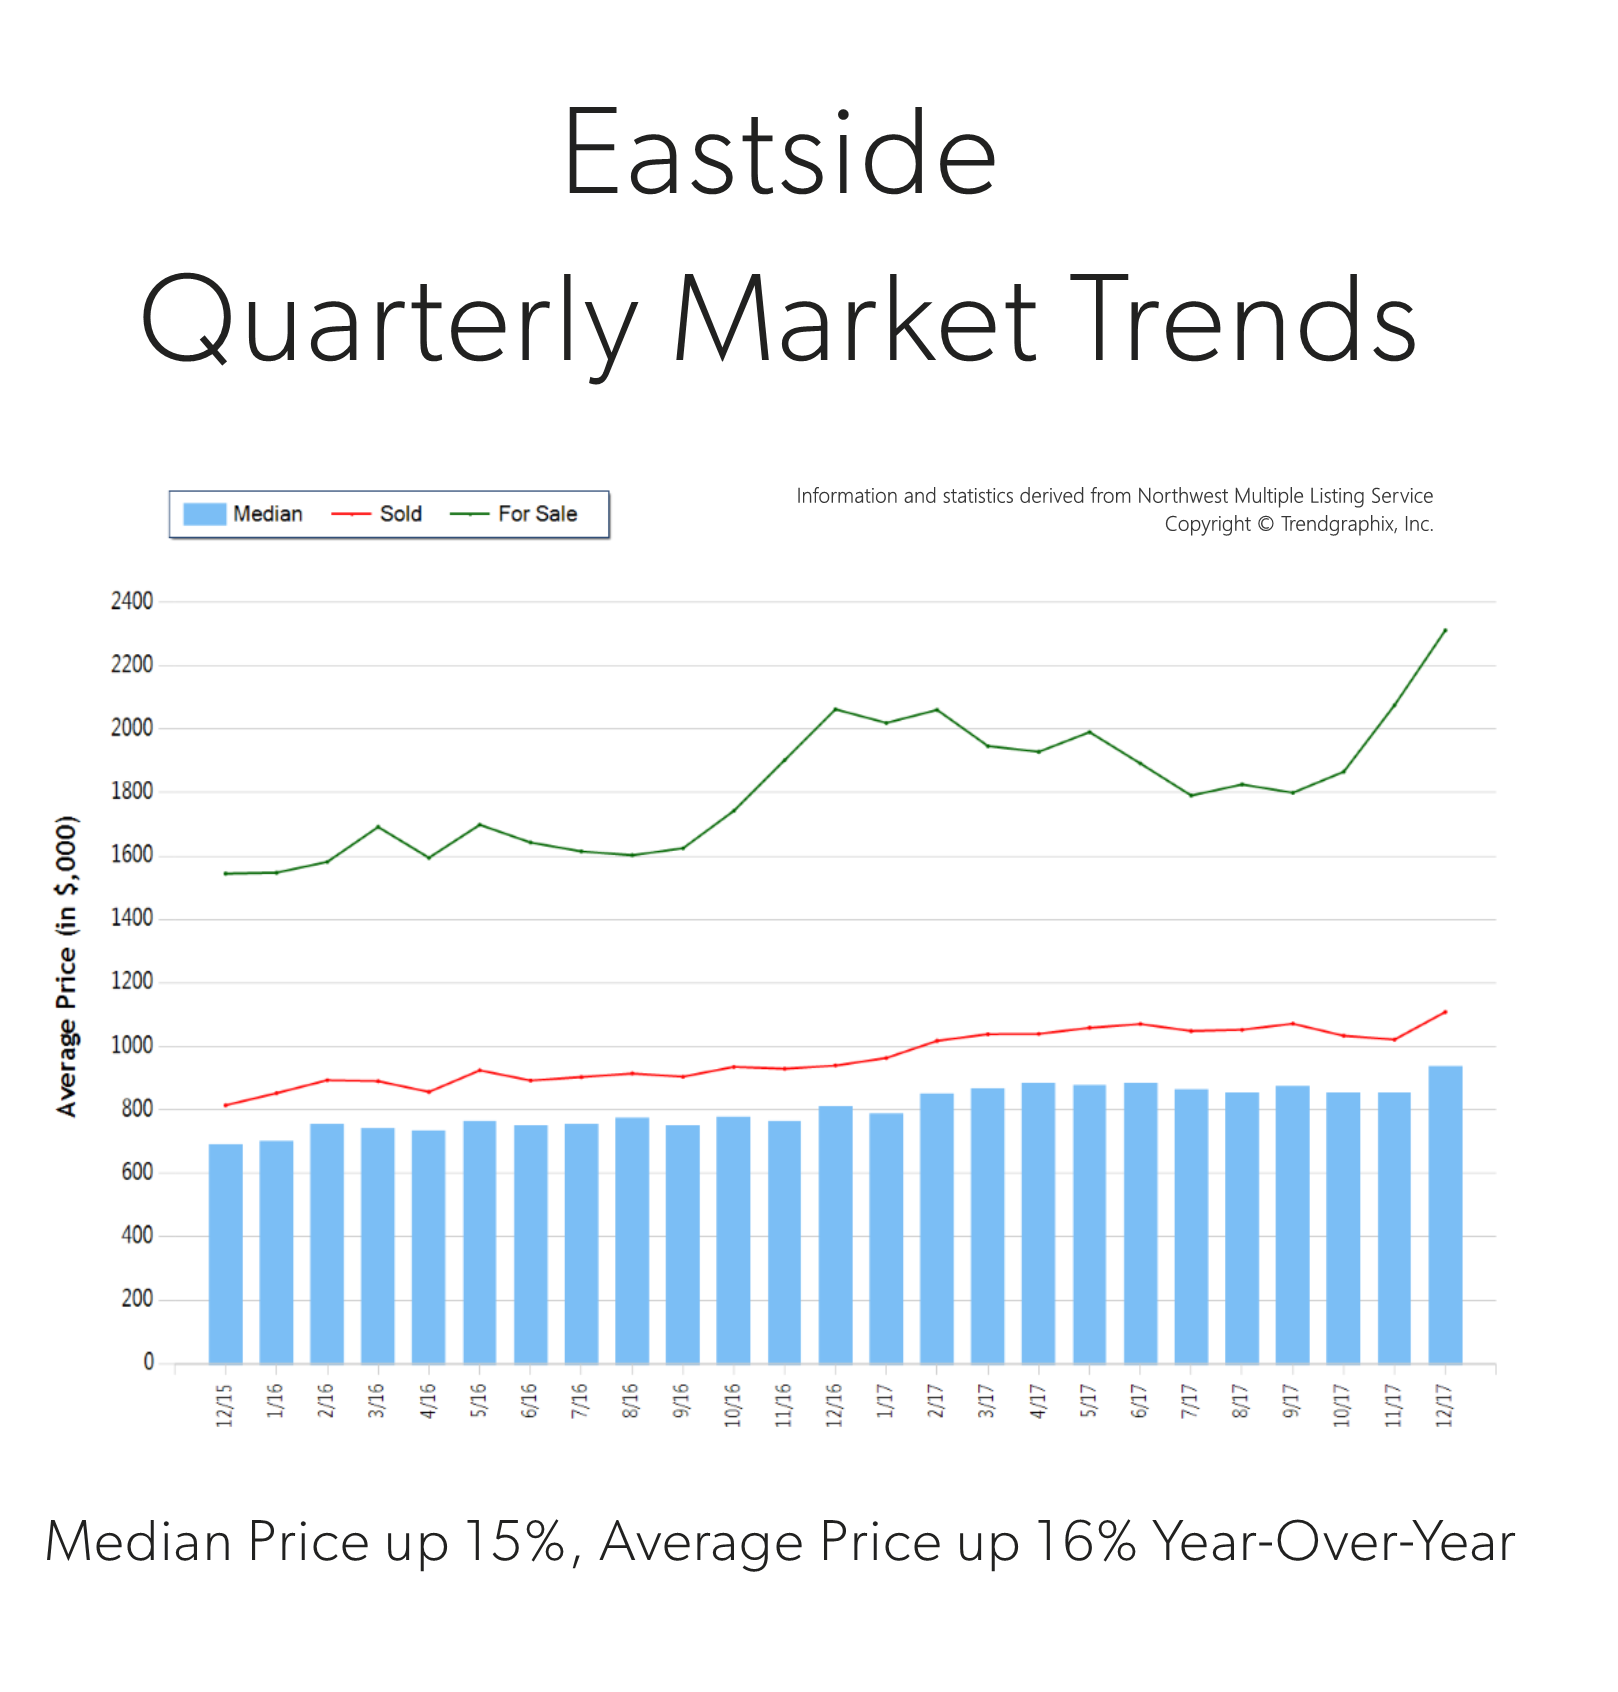
Quarterly Market Trends: Eastside
Q4 2017
 Price growth was particularly strong in 2017! Median was up 15% and average price up 16% over 2016. Median price in 2017 landed at $865,000 and the average at $1,049,000. The average amount of days it took to sell a house in 2017 was 24 days, which is 17% faster than 2016. The average list-to-sale price ratio over the last year was 101%, with the spring months as high as 103%! In 2017, inventory growth continued to be a challenge, with a 4% decrease in new listings compared to 2016. Even with inventory limitations there were a near equal amount of sales! This phenomenon illustrates strong buyer demand and a need for more listings.
Demand for Eastside real estate has grown due to close proximity to job centers, great schools and quality of life. Over the last year, the Eastside was 70% more expensive than south Snohomish County and 22% over Seattle Metro. Historically low interest rates continue to drive the market as well, they have helped offset the increase in prices. Sellers are enjoying great returns due to this phenomenon and buyers are securing mortgages with minor debt service.
This is only a snapshot of the trends on the Eastside area; please contact us if you would like further explanation of how the latest trends relate to you.
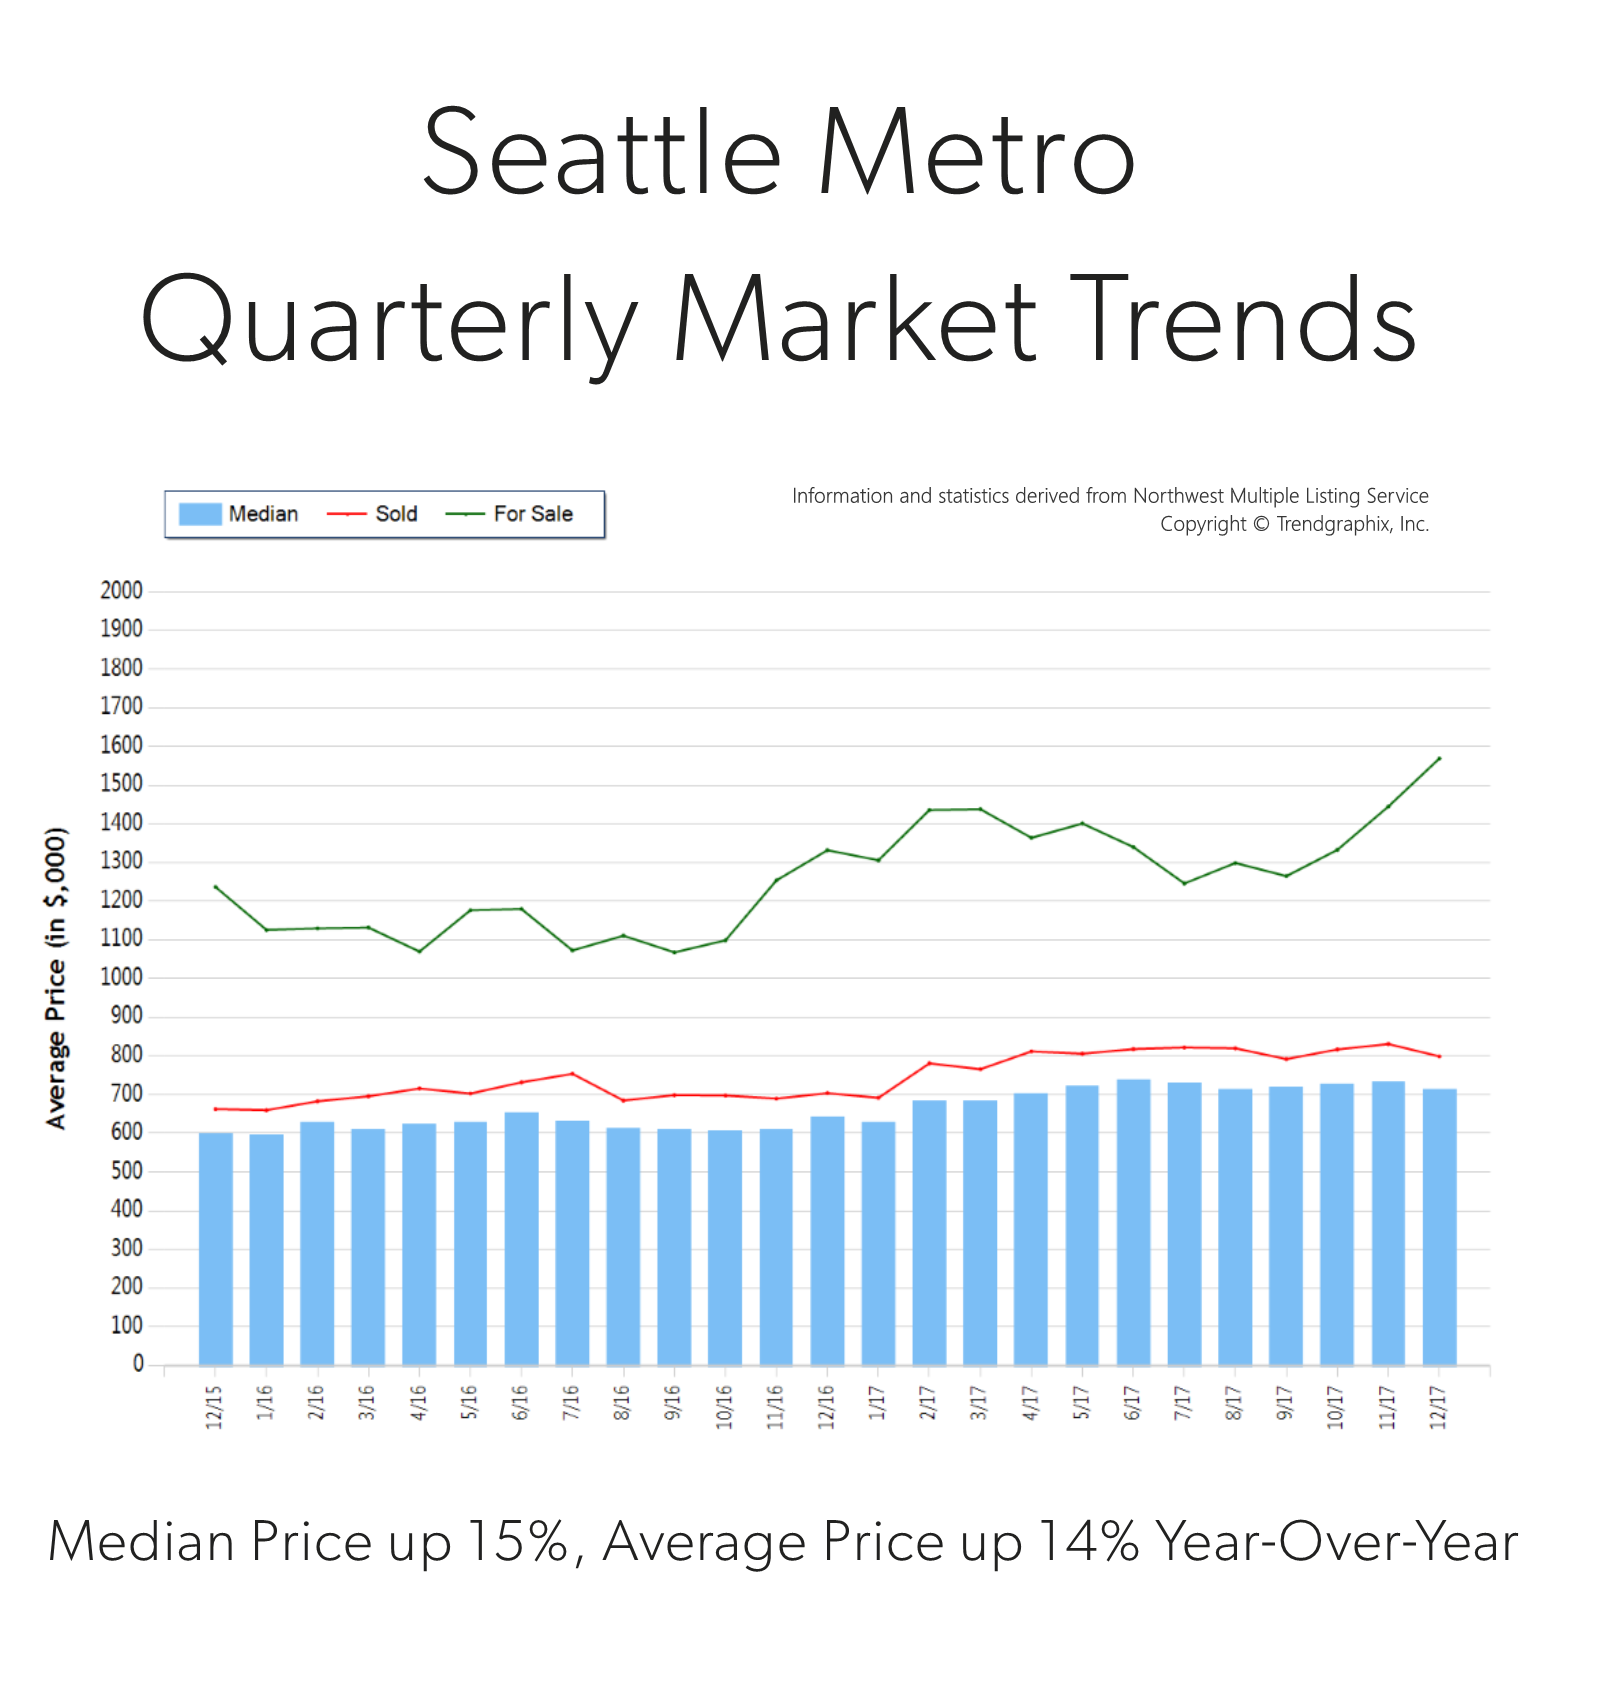
Quarterly Market Trends: Seattle Metro
Q4 2017
 Price growth was particularly strong in 2017! Median was up 15% and average price up 14% over 2016. Median price in 2017 landed at $710,000 and the average at $801,000. The average amount of days it took to sell a house in 2017 was 18 days, which is 10% faster than 2016. The average list-to-sale price ratio over the last year was 103%, with the spring months as high as 106%! In 2017, inventory growth continued to be a challenge, with a 3% decrease in new listings compared to 2016. Even with inventory limitations there were 4% more sales! This phenomenon illustrates strong buyer demand and a need for more listings.
Demand for Seattle Metro area real estate has grown due to close proximity to job centers. Over the last year, Seattle Metro was 40% more expensive than south Snohomish County and 75% over south King County. Historically low interest rates continue to drive the market as well, they have helped offset the increase in prices. Sellers are enjoying great returns due to this phenomenon and buyers are securing mortgages with minor debt service.
This is only a snapshot of the trends in the Seattle Metro area; please contact us if you would like further explanation of how the latest trends relate to you.
Quarterly Market Trends: North King County

Q4 2017
 Price growth was particularly strong in 2017! Median and average prices were up 14% over 2016. Median price in 2017 landed at $715,000 and the average at $787,000. The average amount of days it took to sell a house in 2017 was 17 days, which is 19% faster than 2016. The average list-to-sale price ratio over the last year was 104%, with the spring months as high as 107%! In 2017, inventory growth continued to be a challenge, with a 4% decrease in new listings compared to 2016. Even with inventory limitations there were a near equal amount sales! This phenomenon illustrates strong buyer demand and a need for more listings.
Demand for north King County real estate has grown due to close proximity to job centers while maintaining a neighborhood feel. Over the last year, north King County was 41% more expensive than south Snohomish County and 77% over south King County. Historically low interest rates continue to drive the market as well, they have helped offset the increase in prices. Sellers are enjoying great returns due to this phenomenon and buyers are securing mortgages with minor debt service.
This is only a snapshot of the trends in north King County; please contact us if you would like further explanation of how the latest trends relate to you.
Quarterly Market Trends: South Snohomish County
Q4 2017
 Price growth was particularly strong in 2017! Median was up 14% and average price up 12% over 2016. Median price in 2017 landed at $508,000 and the average at $543,000. The average amount of days it took to sell a house in 2017 was 24 days, which is 17% faster than 2016. The average list-to-sale price ratio over the last year was 101%, with the spring months as high as 103%! In 2017, inventory growth continued to be a challenge, with a 1% decrease in new listings compared to 2016. Even with inventory limitations there were 4% more sales! This phenomenon illustrates strong buyer demand and a need for more listings.
South Snohomish County real estate has seen a steady stream of buyers come our way due to affordability, reasonable commute times to job centers and quality of life. In fact, the median price in 2017 was 41% higher in north King County. Historically low interest rates continue to drive the market as well, they have helped offset the increase in prices. Sellers are enjoying great returns due to this phenomenon and buyers are securing mortgages with minor debt service.
This is only a snapshot of the trends in south Snohomish County; please contact us if you would like further explanation of how the latest trends relate to you.
3 Reasons why we are NOT Headed Towards Another Bubble


Are we headed for another housing collapse?
We get asked this question often, and we can understand why. With the 2008 Great Recession not too far back in our rear-view mirror it is understandable that folks don’t want history to repeat itself, as that was a very painful time for many. Also, price appreciation has been rapid across the country, but especially in our region. The large price gains might seem familiar to the gains of the previous up market of 2004-2007, but the environment is much different. Here are three reasons why we are not headed towards (or in) another real estate bubble:
1. Lending Requirements
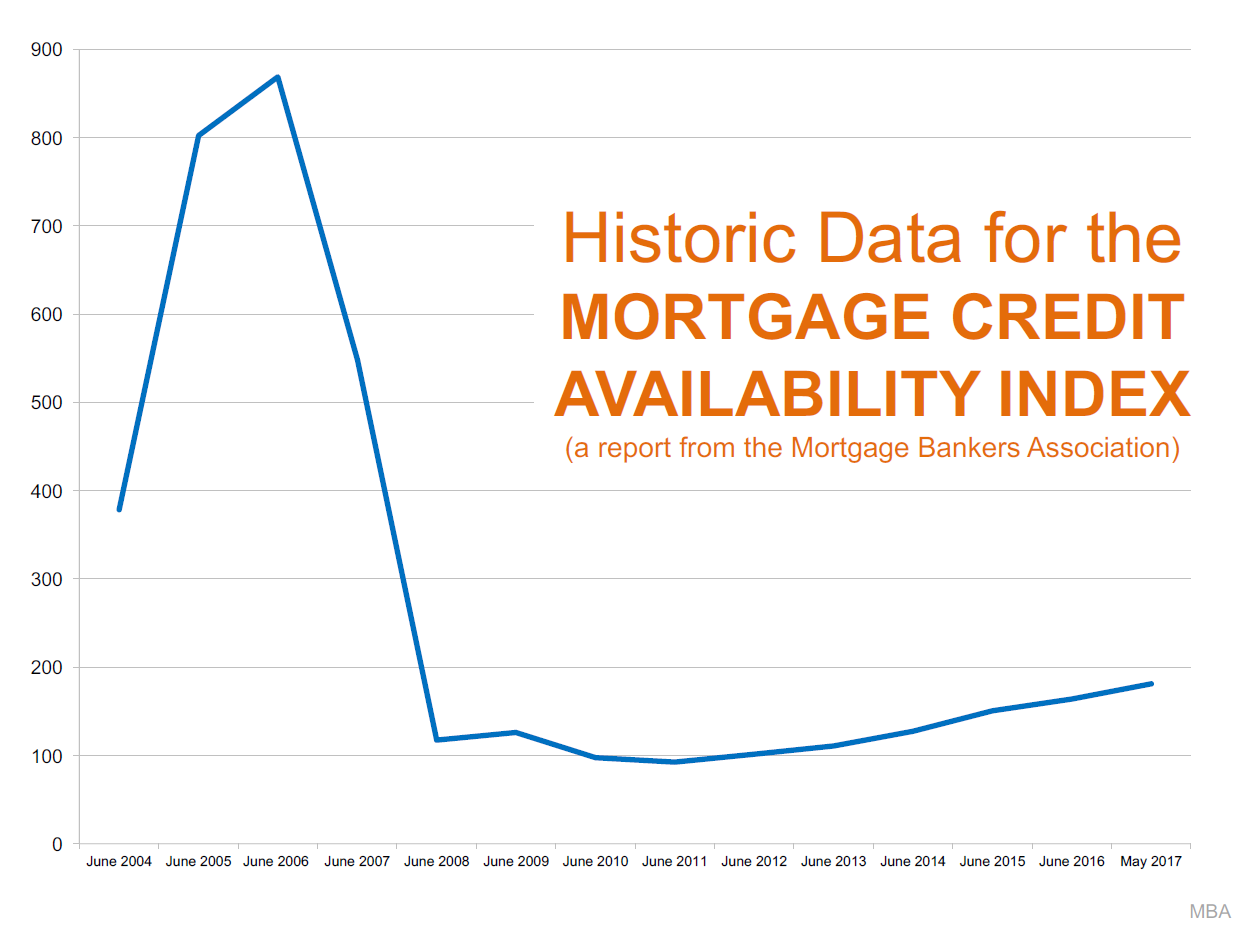 As this graph shows, lending requirements are much more stringent now than what they were prior to the fall of the housing market.
Previous lending practices allowed people to get into homes with risky debt-to-income ratios, low credit scores and undocumented incomes. They called this sub-prime lending. A large part of why the housing bubble burst 10 years ago was due to people getting into mortgages they were not equipped to handle, which lend to the eventual fall of sub-prime lending. Currently, the average credit score of secured mortgages over the last 12 months according to Ellie Mae was 724. During the days of sub-prime lending people were funding loans with scores as low as 560! This, coupled with many zero-down loan programs and the risky terms mentioned above left many new homeowners with little to no equity. When you have little or no equity it very easy to just walk away.
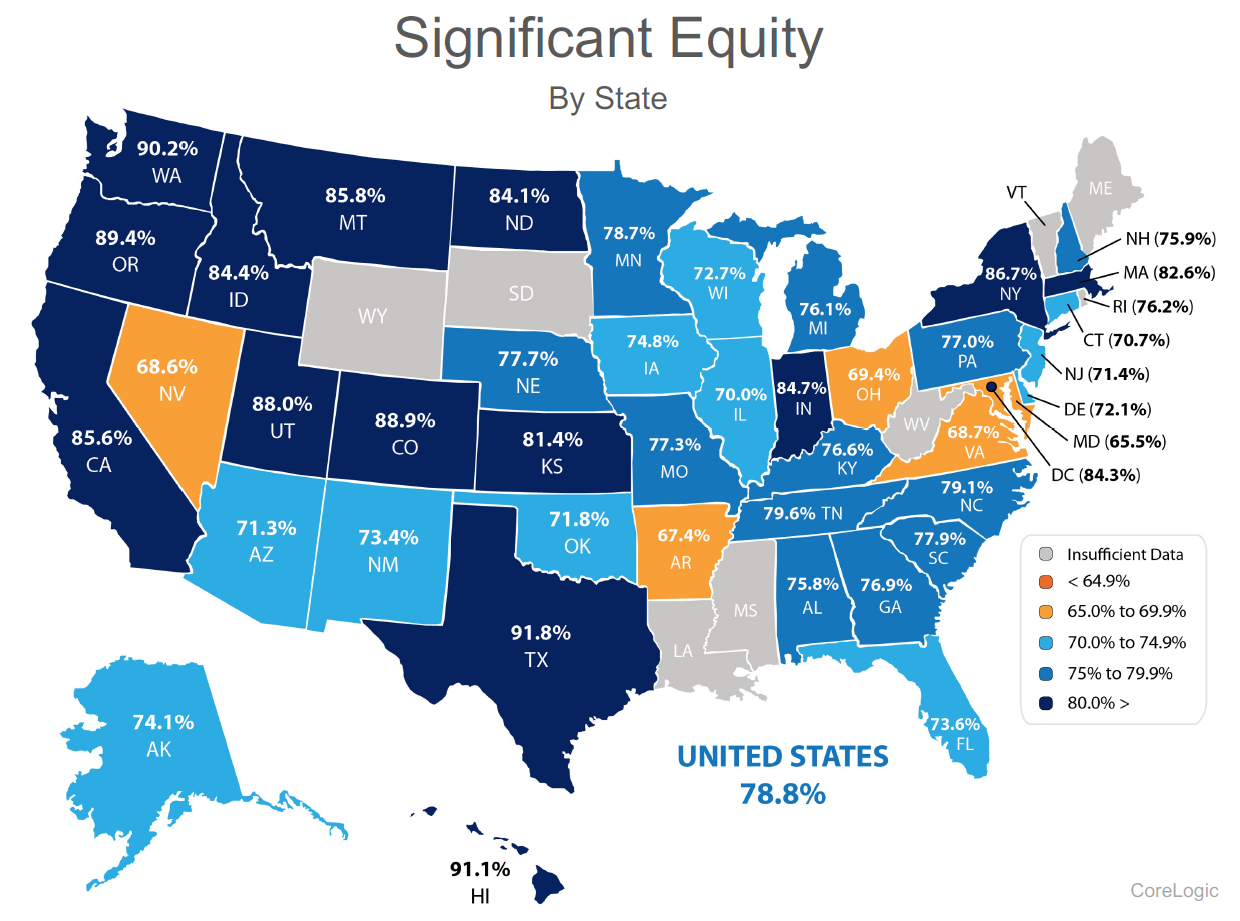
The graph above shows the percentage of homes in our state with significant equity (20% or more) according to CoreLogic. Today many homeowners, especially in our region are making large down payments to begin with. Believe me, when competing with multiple offers on a house, the size of down payment matters – hence many buyers landing homes today are making large down payments. Unlike the market prior to the crash, when people have high equity levels they are not likely to abandon their home or miss payments.
2. Inventory Levels & 3. Our Job Market
The biggest challenge in our market has been low inventory levels and high housing demand. It’s simply the concept of supply and demand. Our thriving job market has afforded folks already in our area the ability to make moves, and it is bringing people into our area from other parts of the country. Washington State’s net in-migration is 43% higher than it was 10 years ago. This has created increased demand, especially for homes closer to job centers resulting is shorter commutes. When you have increased demand and not enough homes to absorb the buyers, prices go up. Over the last three years we have easily seen a 10% increase in prices year-over-year. That is above the norm and should slow down as inventory increases. As inventory increases we anticipate a leveling out of appreciation rates to historical norms of 3-4% annually, but not decreasing home values like the 2008-2010 crash.
 We understand that the recent increase in home prices has been big and that it might remind you of the previous up market before the crash. Hopefully digging into the topics above has shed some light on how it is different. According to Matthew Gardner, Windermere’s Chief Economist and nationally sought after expert on all things real estate, buyers should not wait this market out, due to future price appreciation and today’s historically low interest rates. Check out his latest vlog that addresses this topic.
As always, it is our goal to help keep the community informed, and empower strong decisions. Please let us know if we can answer any questions or help you or anyone you know with their real estate needs.
