
 Facebook
 X
X
 Pinterest
 Copy Link
Quarterly Reports: Q4 South King County
Q4: October 1 – December 31, 2018
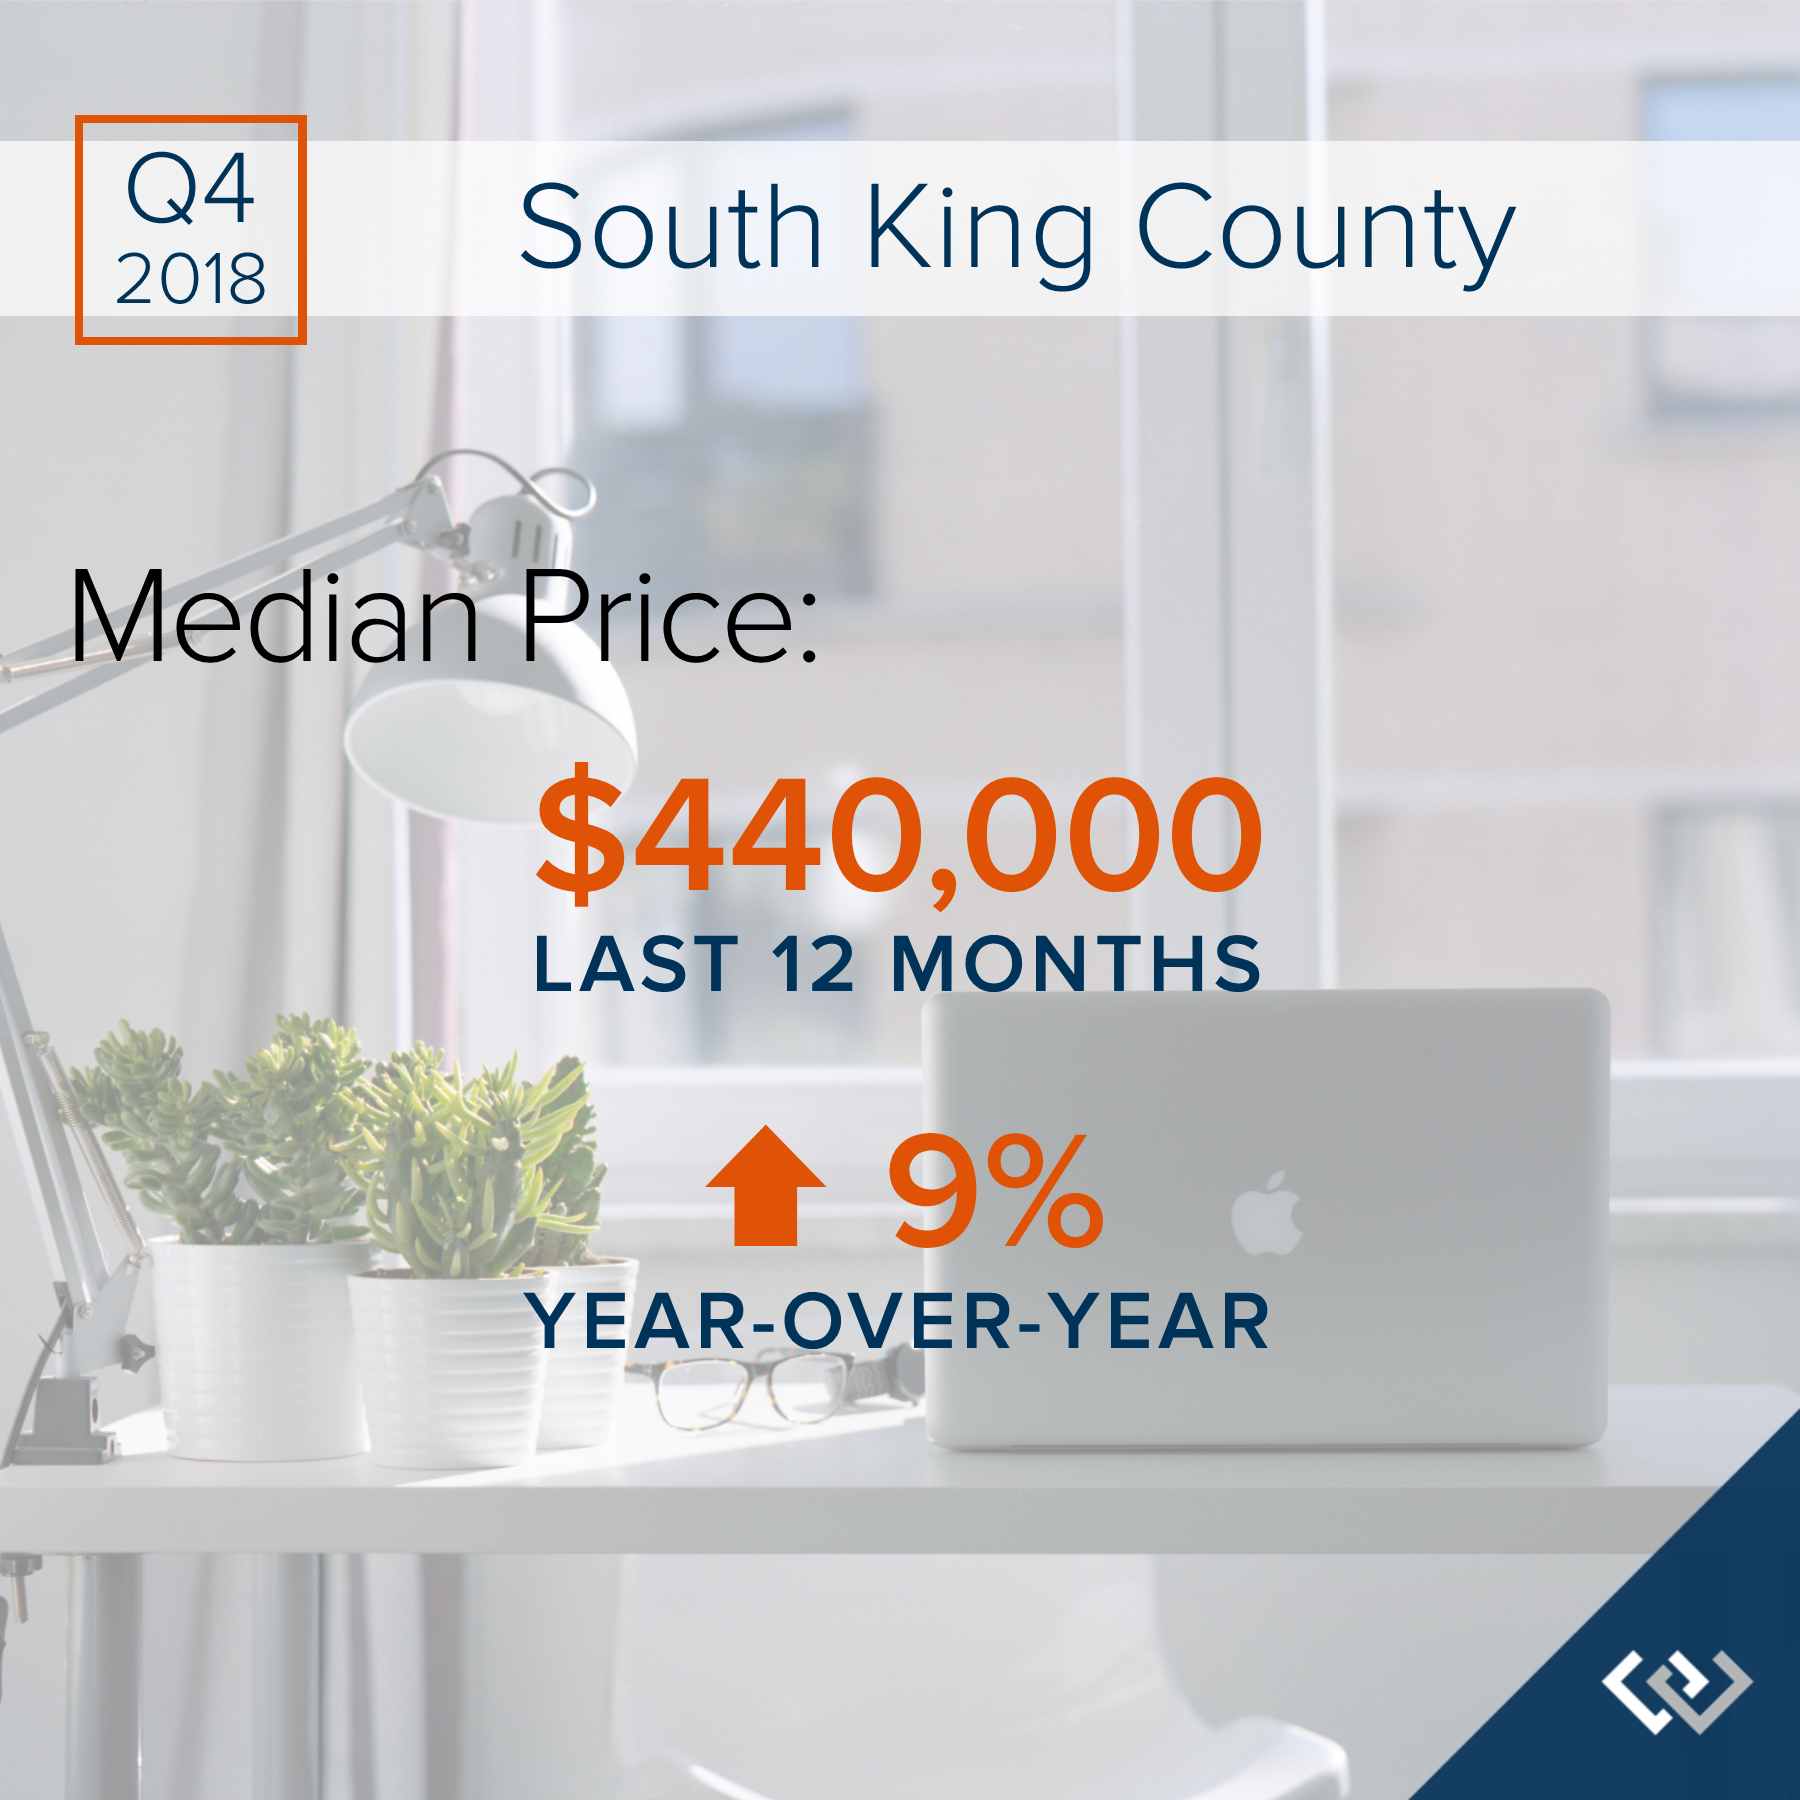
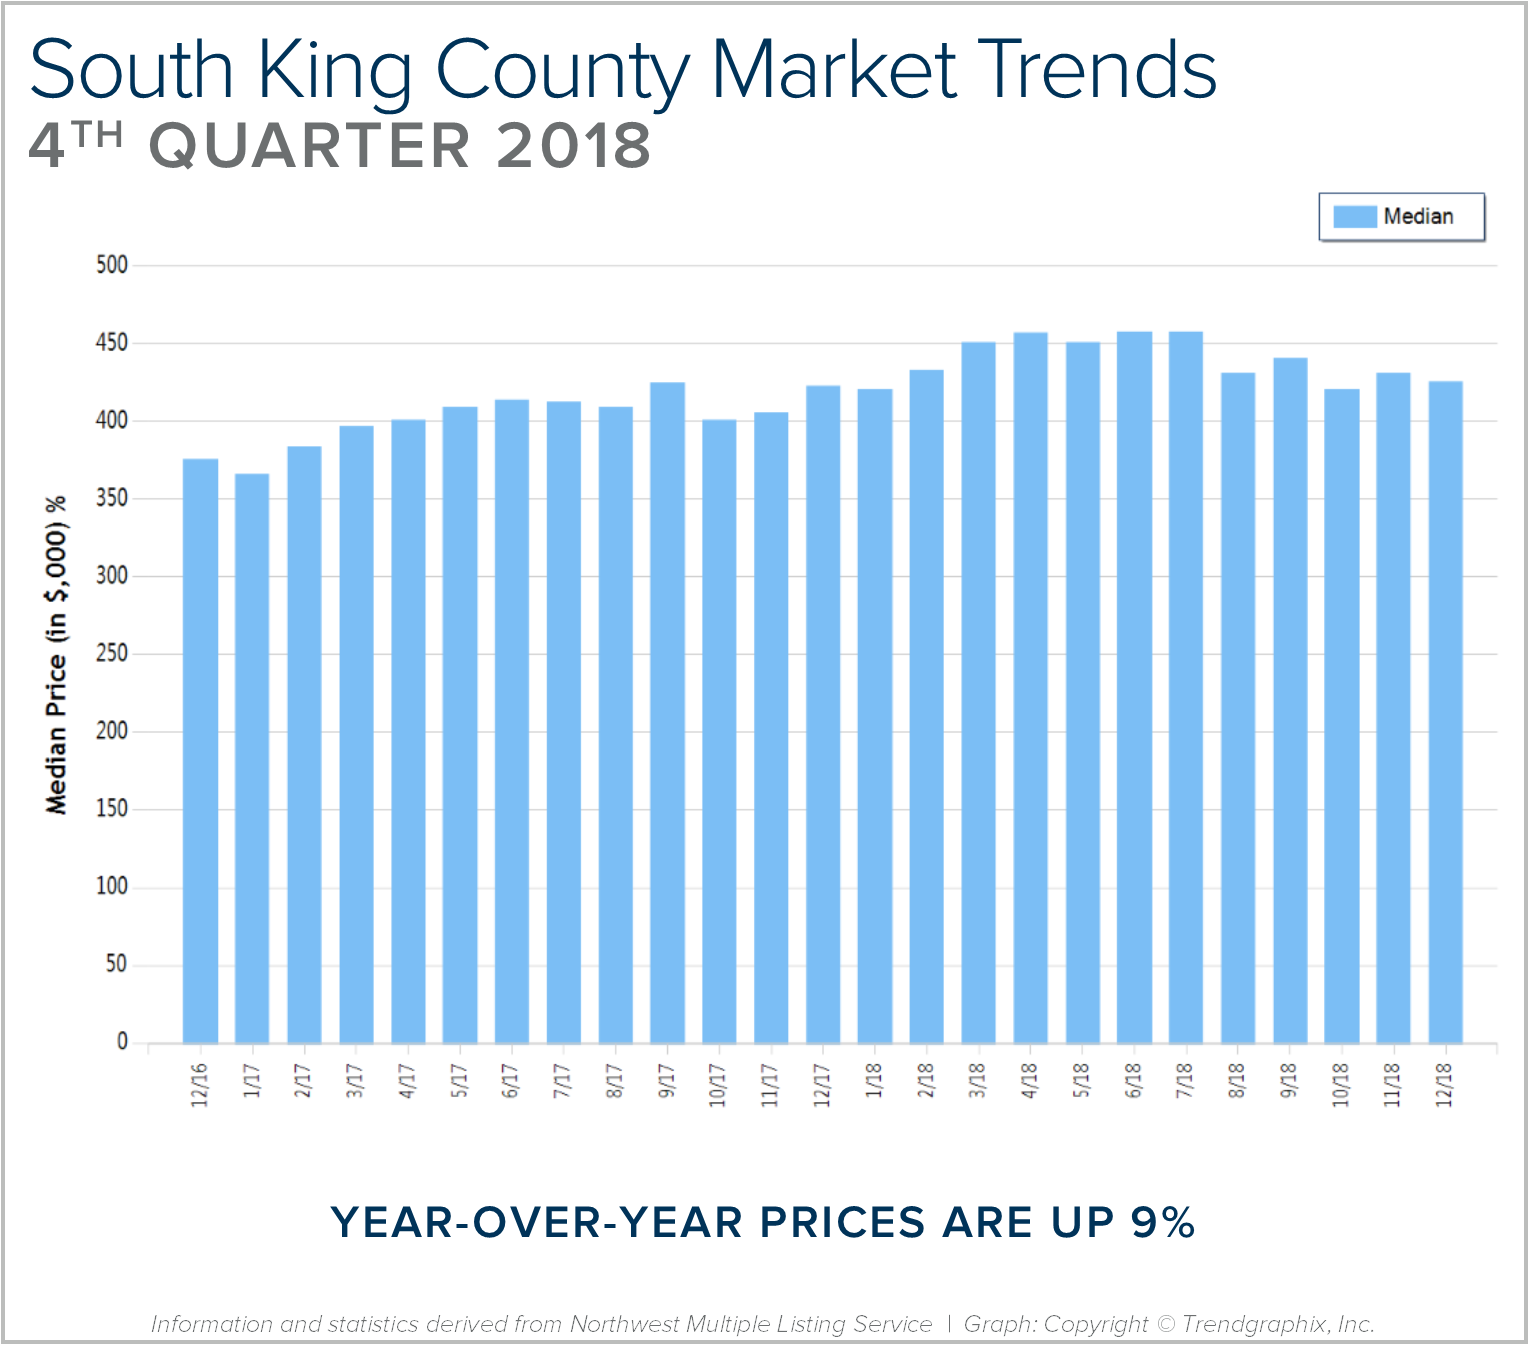
SOUTH KING COUNTY: 2018 was a year of change and growth. The market shifted from an extreme seller’s market, but still had strong gains. Year-over-year, median price is up 9% and since 2012 has increased 89%! Over the last 19 years, the average year-over-year price increase has been 6%. This puts into perspective the growth we have experienced, resulting in well-established equity levels. In 2018, inventory averaged 1.7 months, 30% more than 2017. This caused the month-over-month price gains to slow, and we experienced a price correction over the second half of the year. We expect to see more average levels of price appreciation in 2019 as the market continues to balance out.
After six years of expansion resulting in an extreme seller’s market, in 2018 we encountered a market shift in the late spring. Inventory increased, interest rates took a jump, and demand took a step back to re-evaluate the new playing field. This resulted in a tempering of month-over-month price appreciation, and has established some long-awaited balance. This balance has brought opportunities for both buyers and sellers. Buyers have more selection and are negotiating terms like inspection items and concessions. Sellers are sitting on 6+ years of equity growth, and are now able to sell their home and make a move without fearing where they will land next. Interest rates are still well below the 30-year average, currently hovering just under 5%. We are seeing demand start to re-engage now that the new normal has settled in.
This is only a snapshot of the trends in south King County; please contact us if you would like further explanation of how the latest trends relate to you.
Quarterly Reports: Q4 Eastside
Q4: October 1 – December 31, 2018
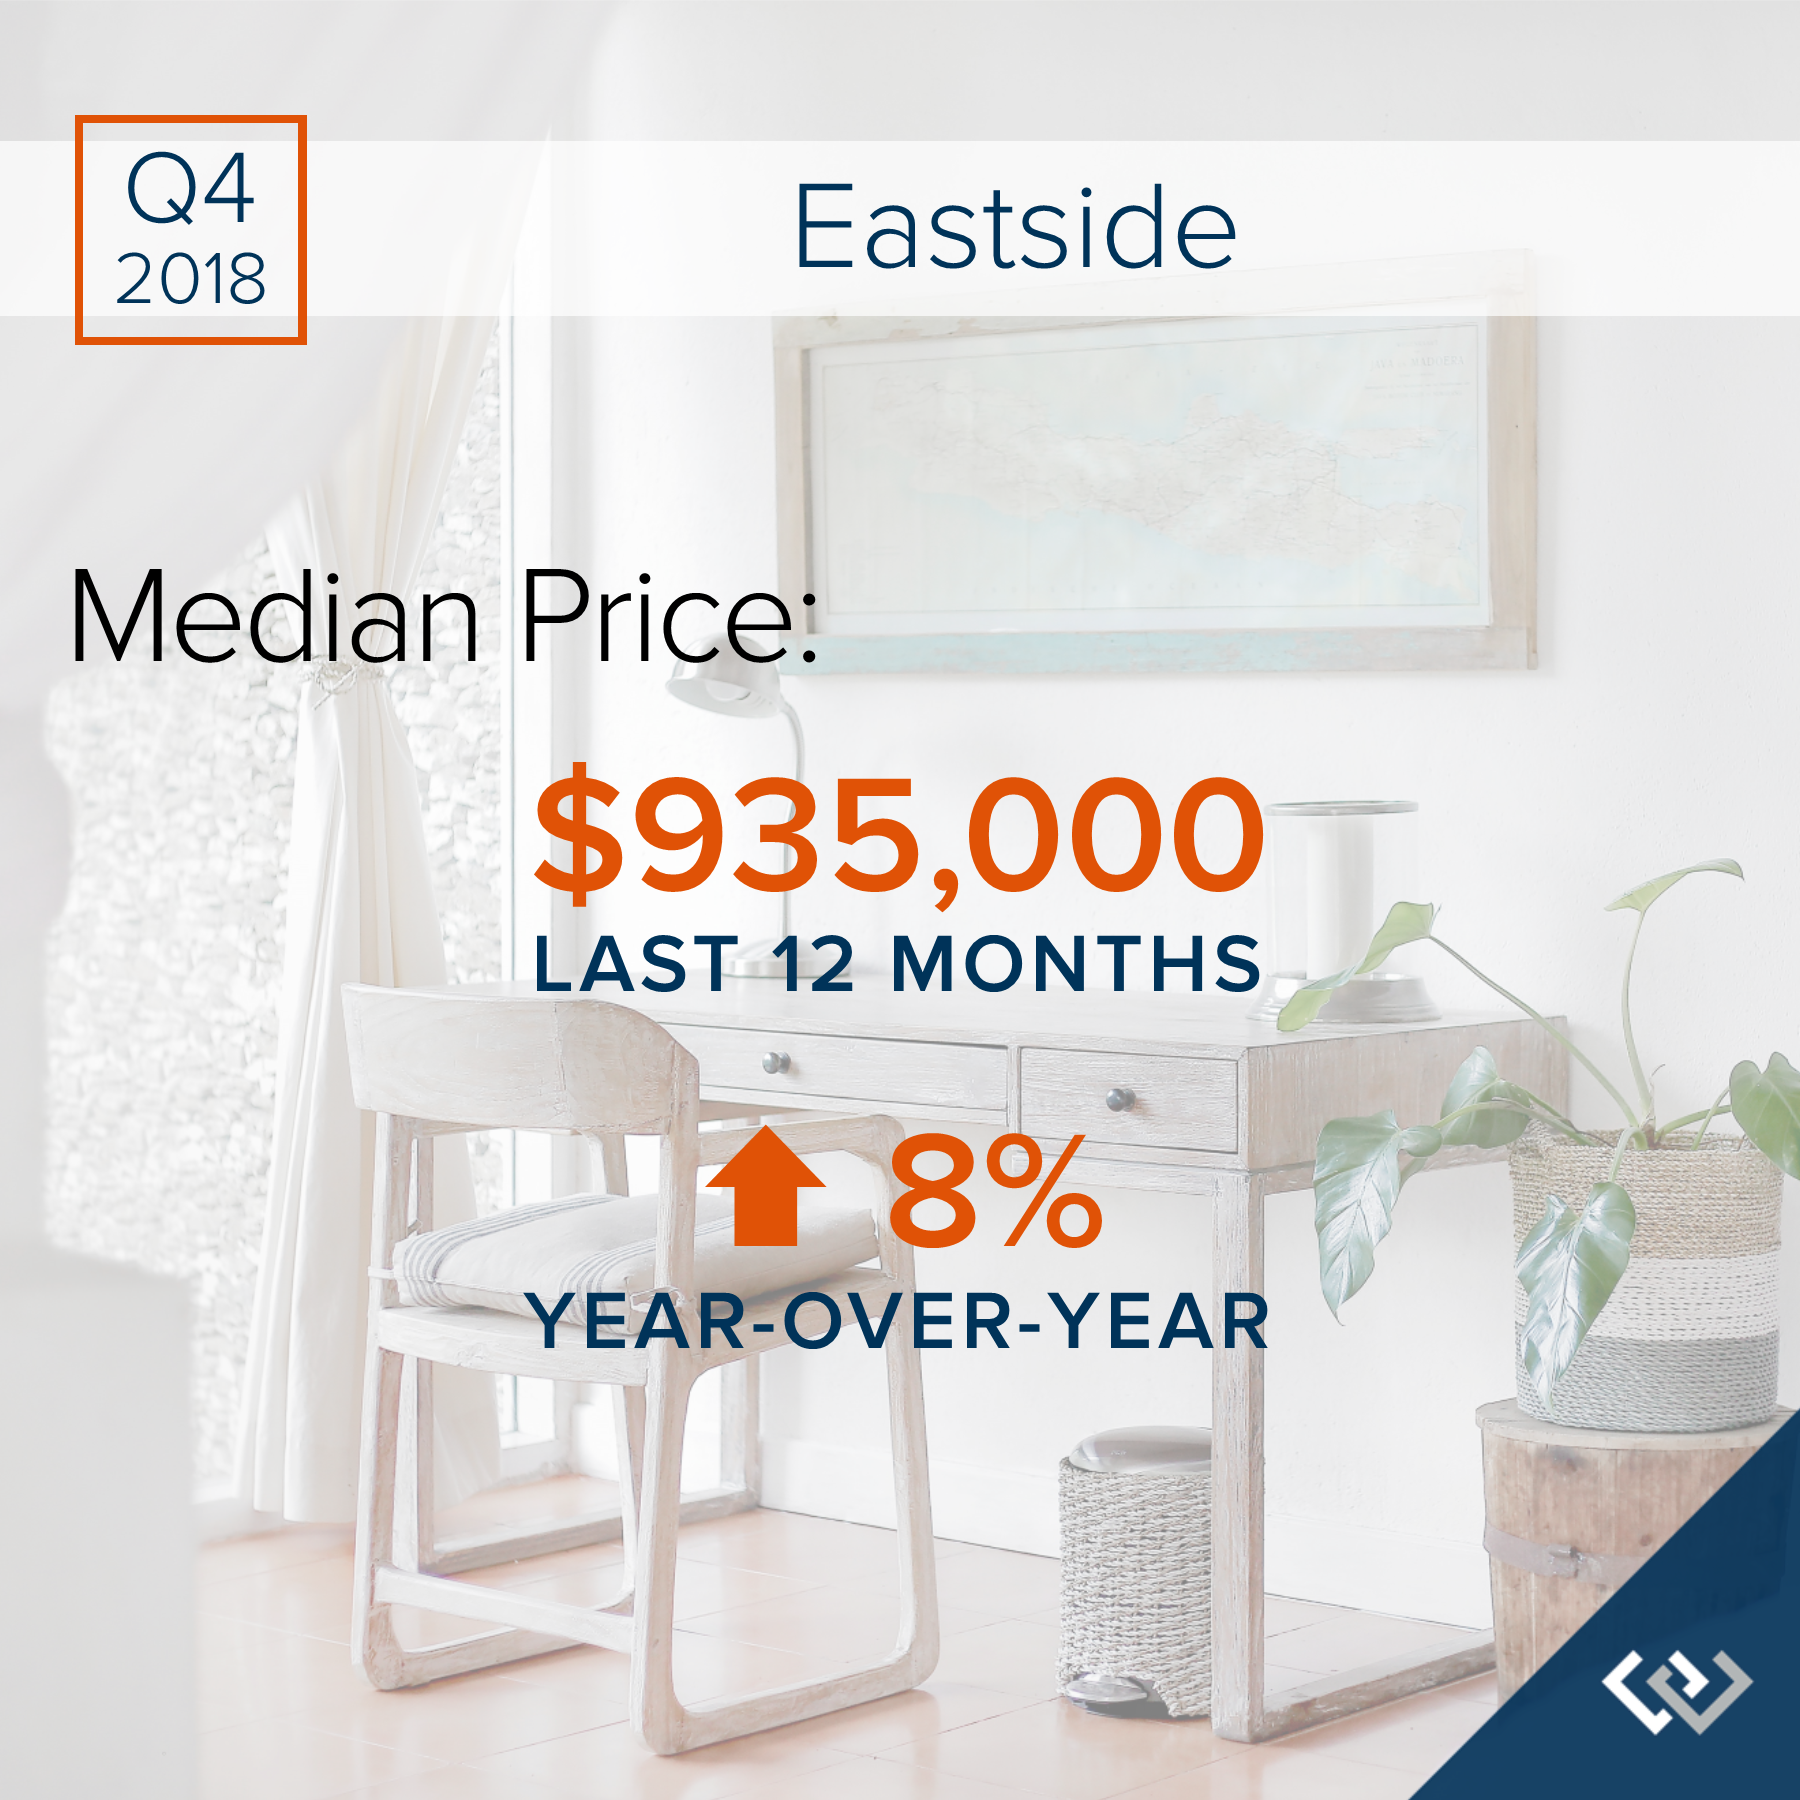
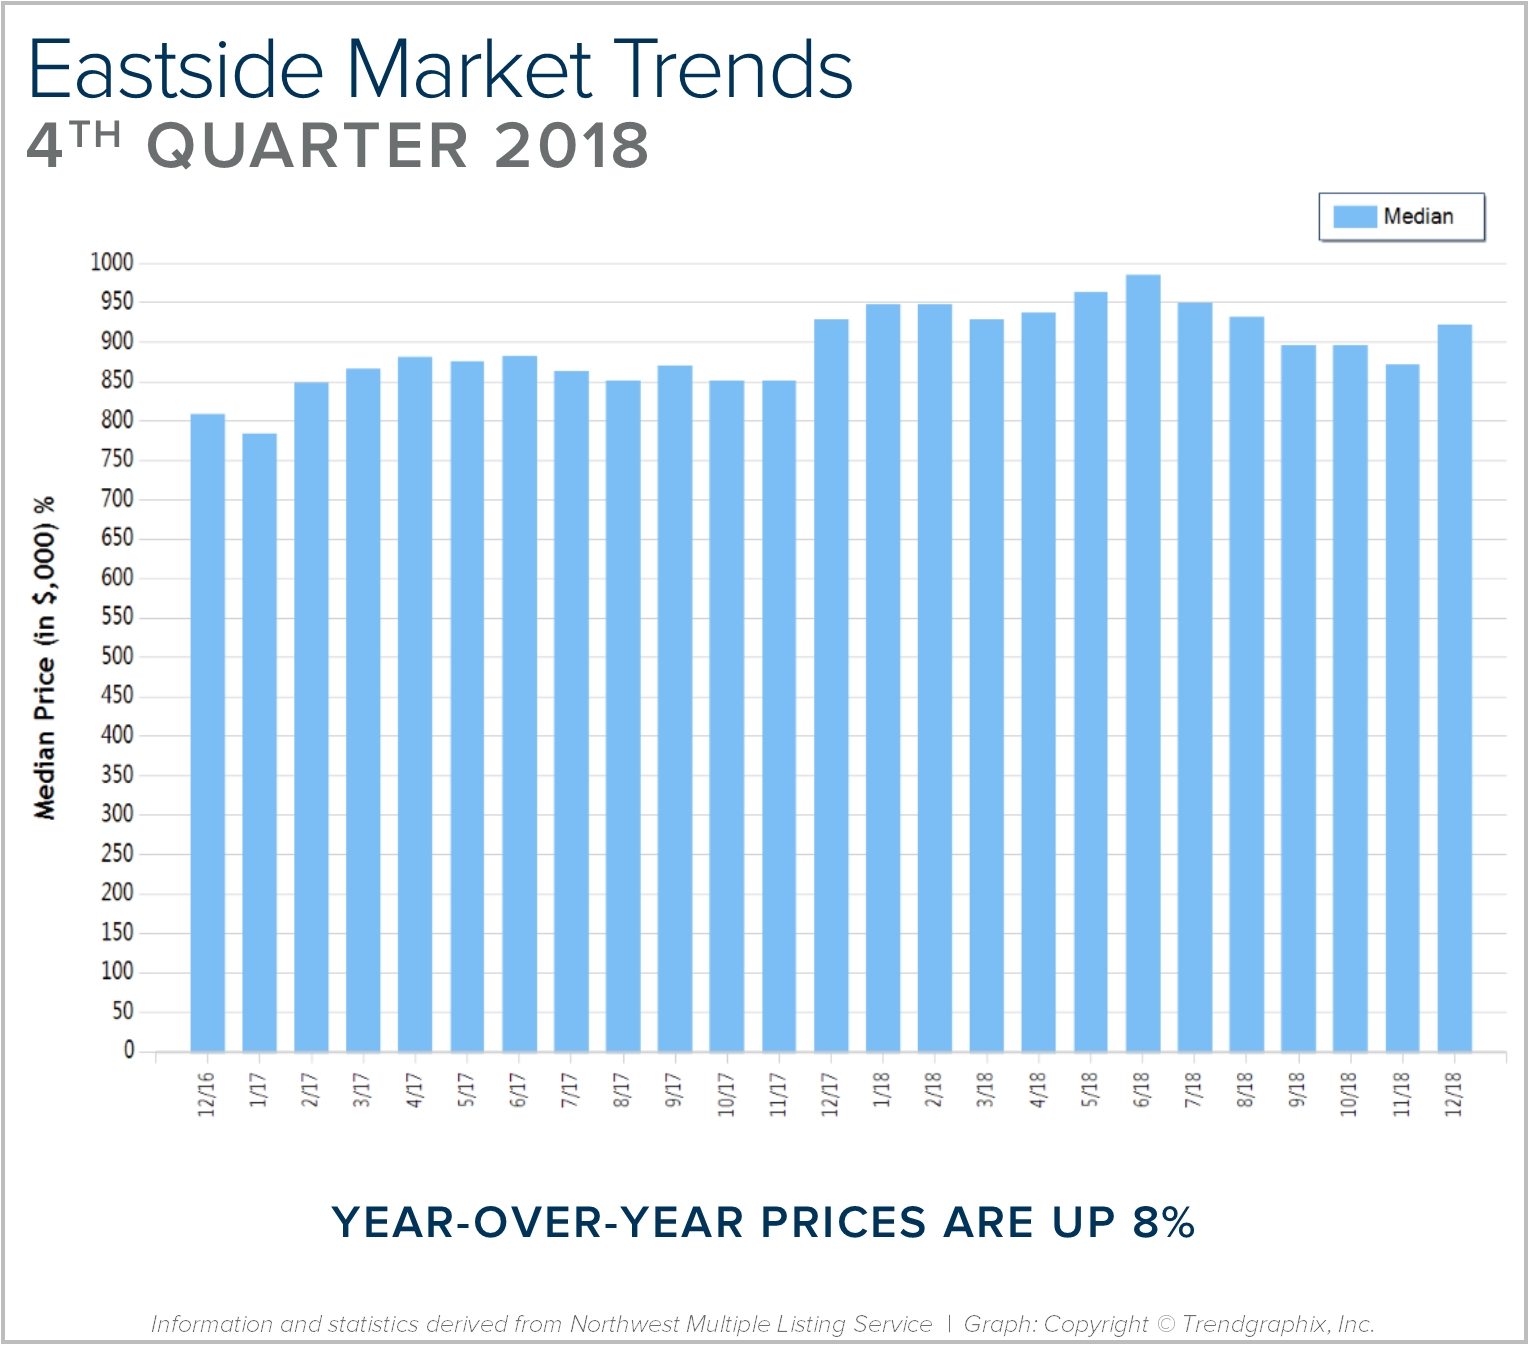
EASTSIDE: 2018 was a year of change and growth. The market shifted from an extreme seller’s market, but still had strong gains. Year-over-year, median price is up 8% and since 2012 has increased 87%! Over the last 19 years, the average year-over-year price increase has been 6%. This puts into perspective the growth we have experienced, resulting in well-established equity levels. In 2018, inventory averaged 2 months, double that of 2017. This caused the month-over-month price gains to slow, and we experienced a price correction over the second half of the year. We expect to see more average levels of price appreciation in 2019 as the market continues to balance out.
After six years of expansion resulting in an extreme seller’s market, in 2018 we encountered a market shift in the late spring. Inventory increased, interest rates took a jump, and demand took a step back to re-evaluate the new playing field. This resulted in a tempering of month-over-month price appreciation, and has established some long-awaited balance. This balance has brought opportunities for both buyers and sellers. Buyers have more selection and are negotiating terms like inspection items and concessions. Sellers are sitting on 6+ years of equity growth, and are now able to sell their home and make a move without fearing where they will land next. Interest rates are still well below the 30-year average, currently hovering just under 5%. We are seeing demand start to re-engage now that the new normal has settled in.
This is only a snapshot of the trends on the Eastside; please contact us if you would like further explanation of how the latest trends relate to you.
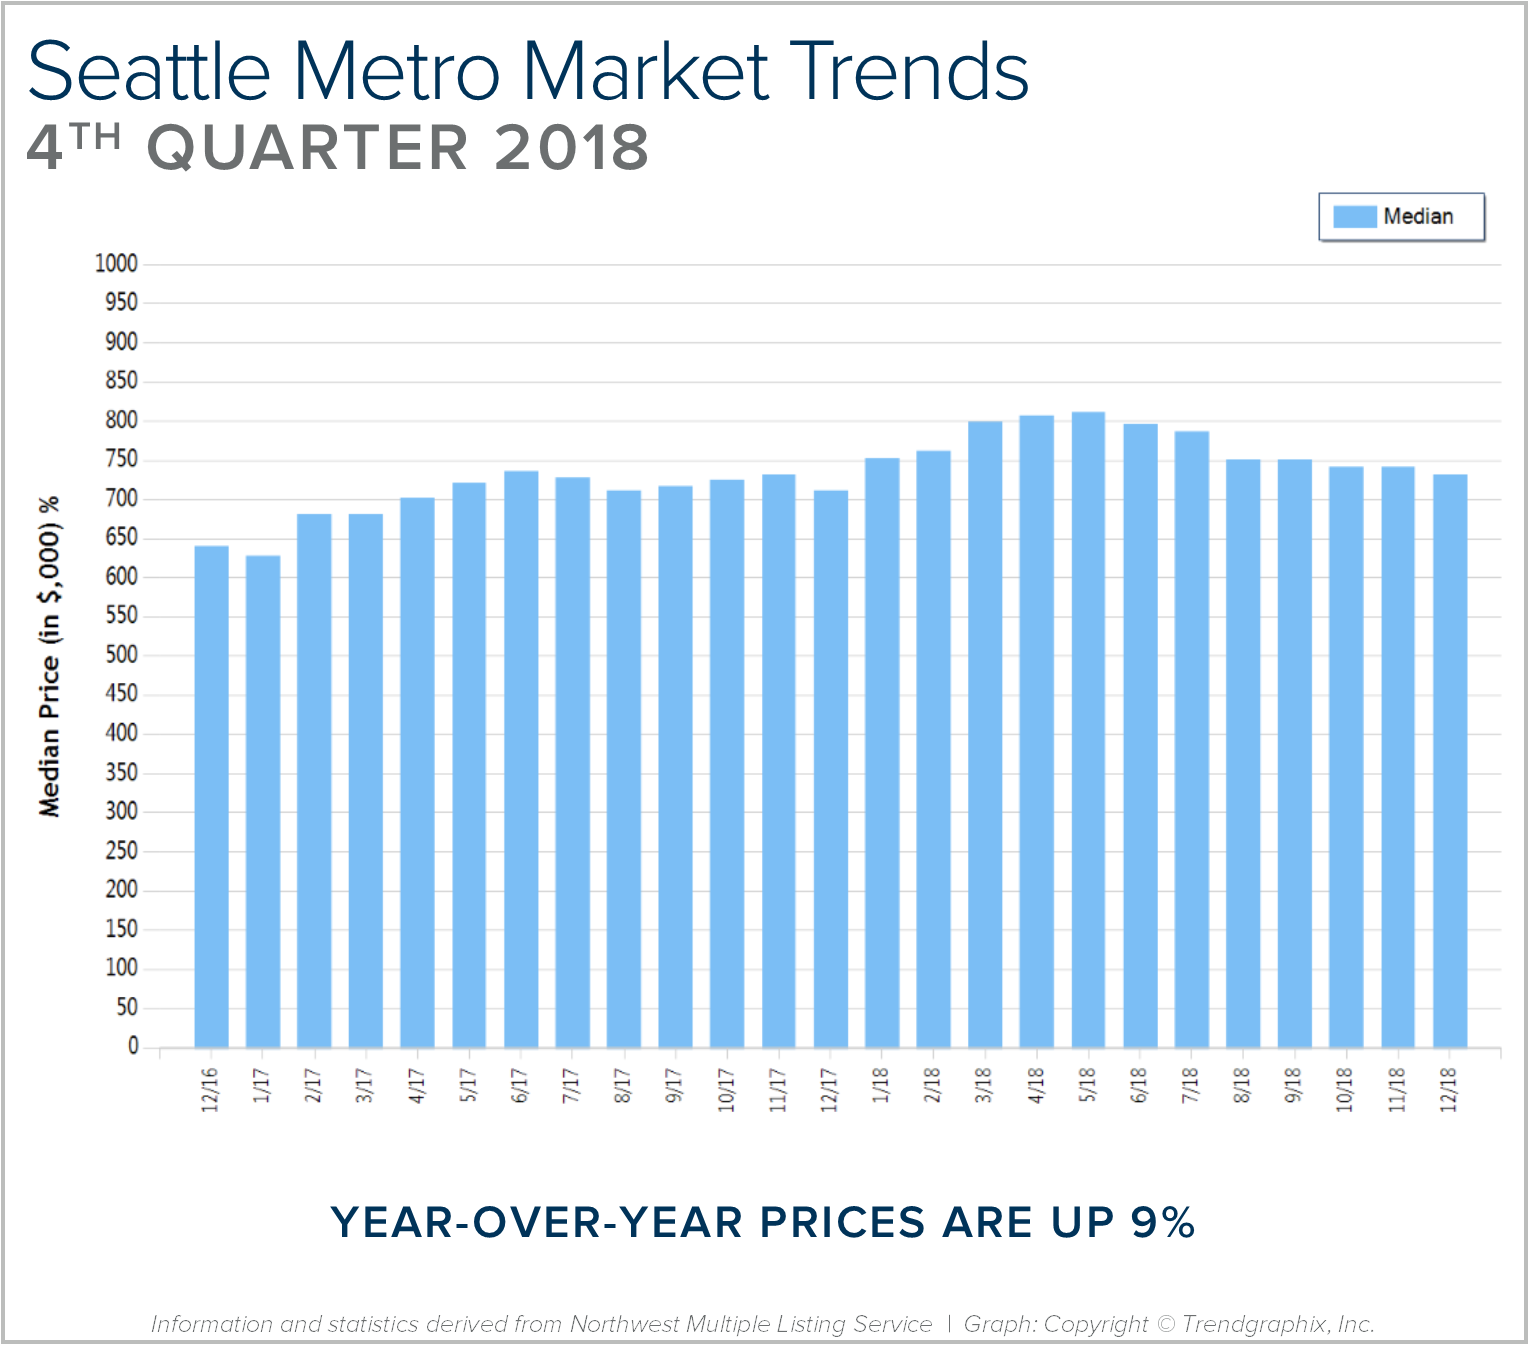
Quarterly Reports: Q4 Seattle Metro
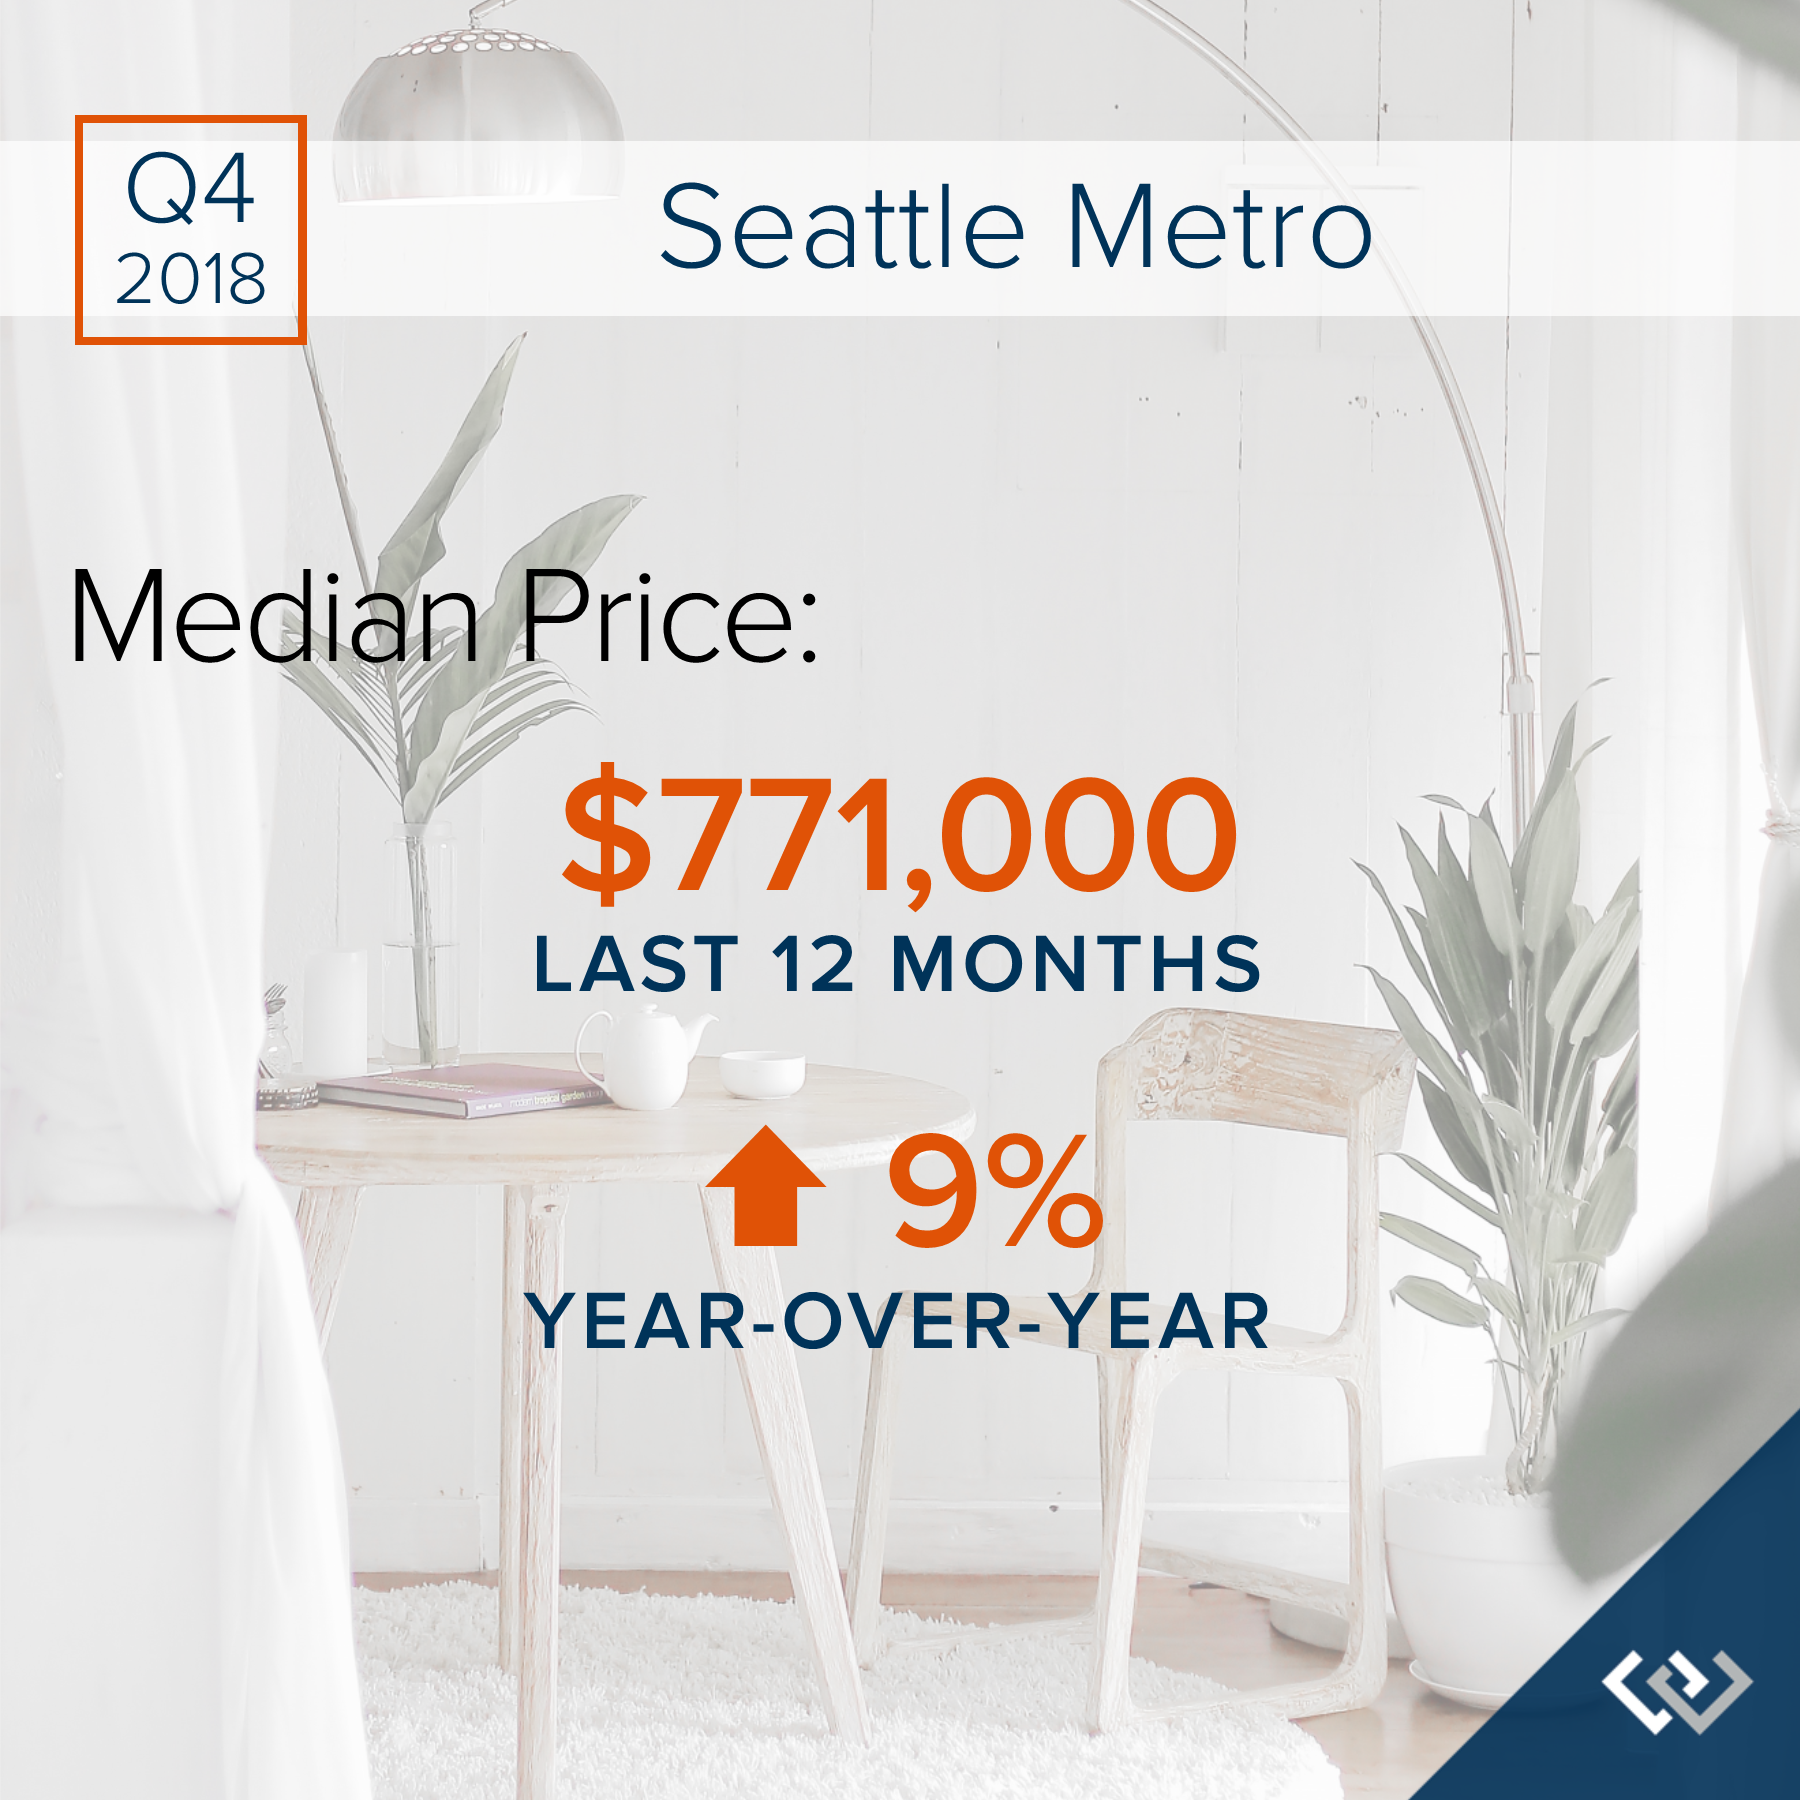
Q4: October 1 – December 31, 2018
SEATTLE METRO: 2018 was a year of change and growth. The market shifted from an extreme seller’s market, but still had strong gains. Year-over-year, median price is up 9% and since 2012 has increased 93%! Over the last 19 years, the average year-over-year price increase has been 6%. This puts into perspective the growth we have experienced, resulting in well-established equity levels. In 2018, inventory averaged 1.5 months, double that of 2017. This caused the month-over-month price gains to slow, and we experienced a price correction over the second half of the year. We expect to see more average levels of price appreciation in 2019 as the market continues to balance out.
After six years of expansion resulting in an extreme seller’s market, in 2018 we encountered a market shift in the late spring. Inventory increased, interest rates took a jump, and demand took a step back to re-evaluate the new playing field. This resulted in a tempering of month-over-month price appreciation, and has established some long-awaited balance. This balance has brought opportunities for both buyers and sellers. Buyers have more selection and are negotiating terms like inspection items and concessions. Sellers are sitting on 6+ years of equity growth, and are now able to sell their home and make a move without fearing where they will land next. Interest rates are still well below the 30-year average, currently hovering just under 5%. We are seeing demand start to re-engage now that the new normal has settled in.
This is only a snapshot of the trends the Seattle Metro area; please contact us if you would like further explanation of how the latest trends relate to you.
Quarterly Reports: Q4 North King County
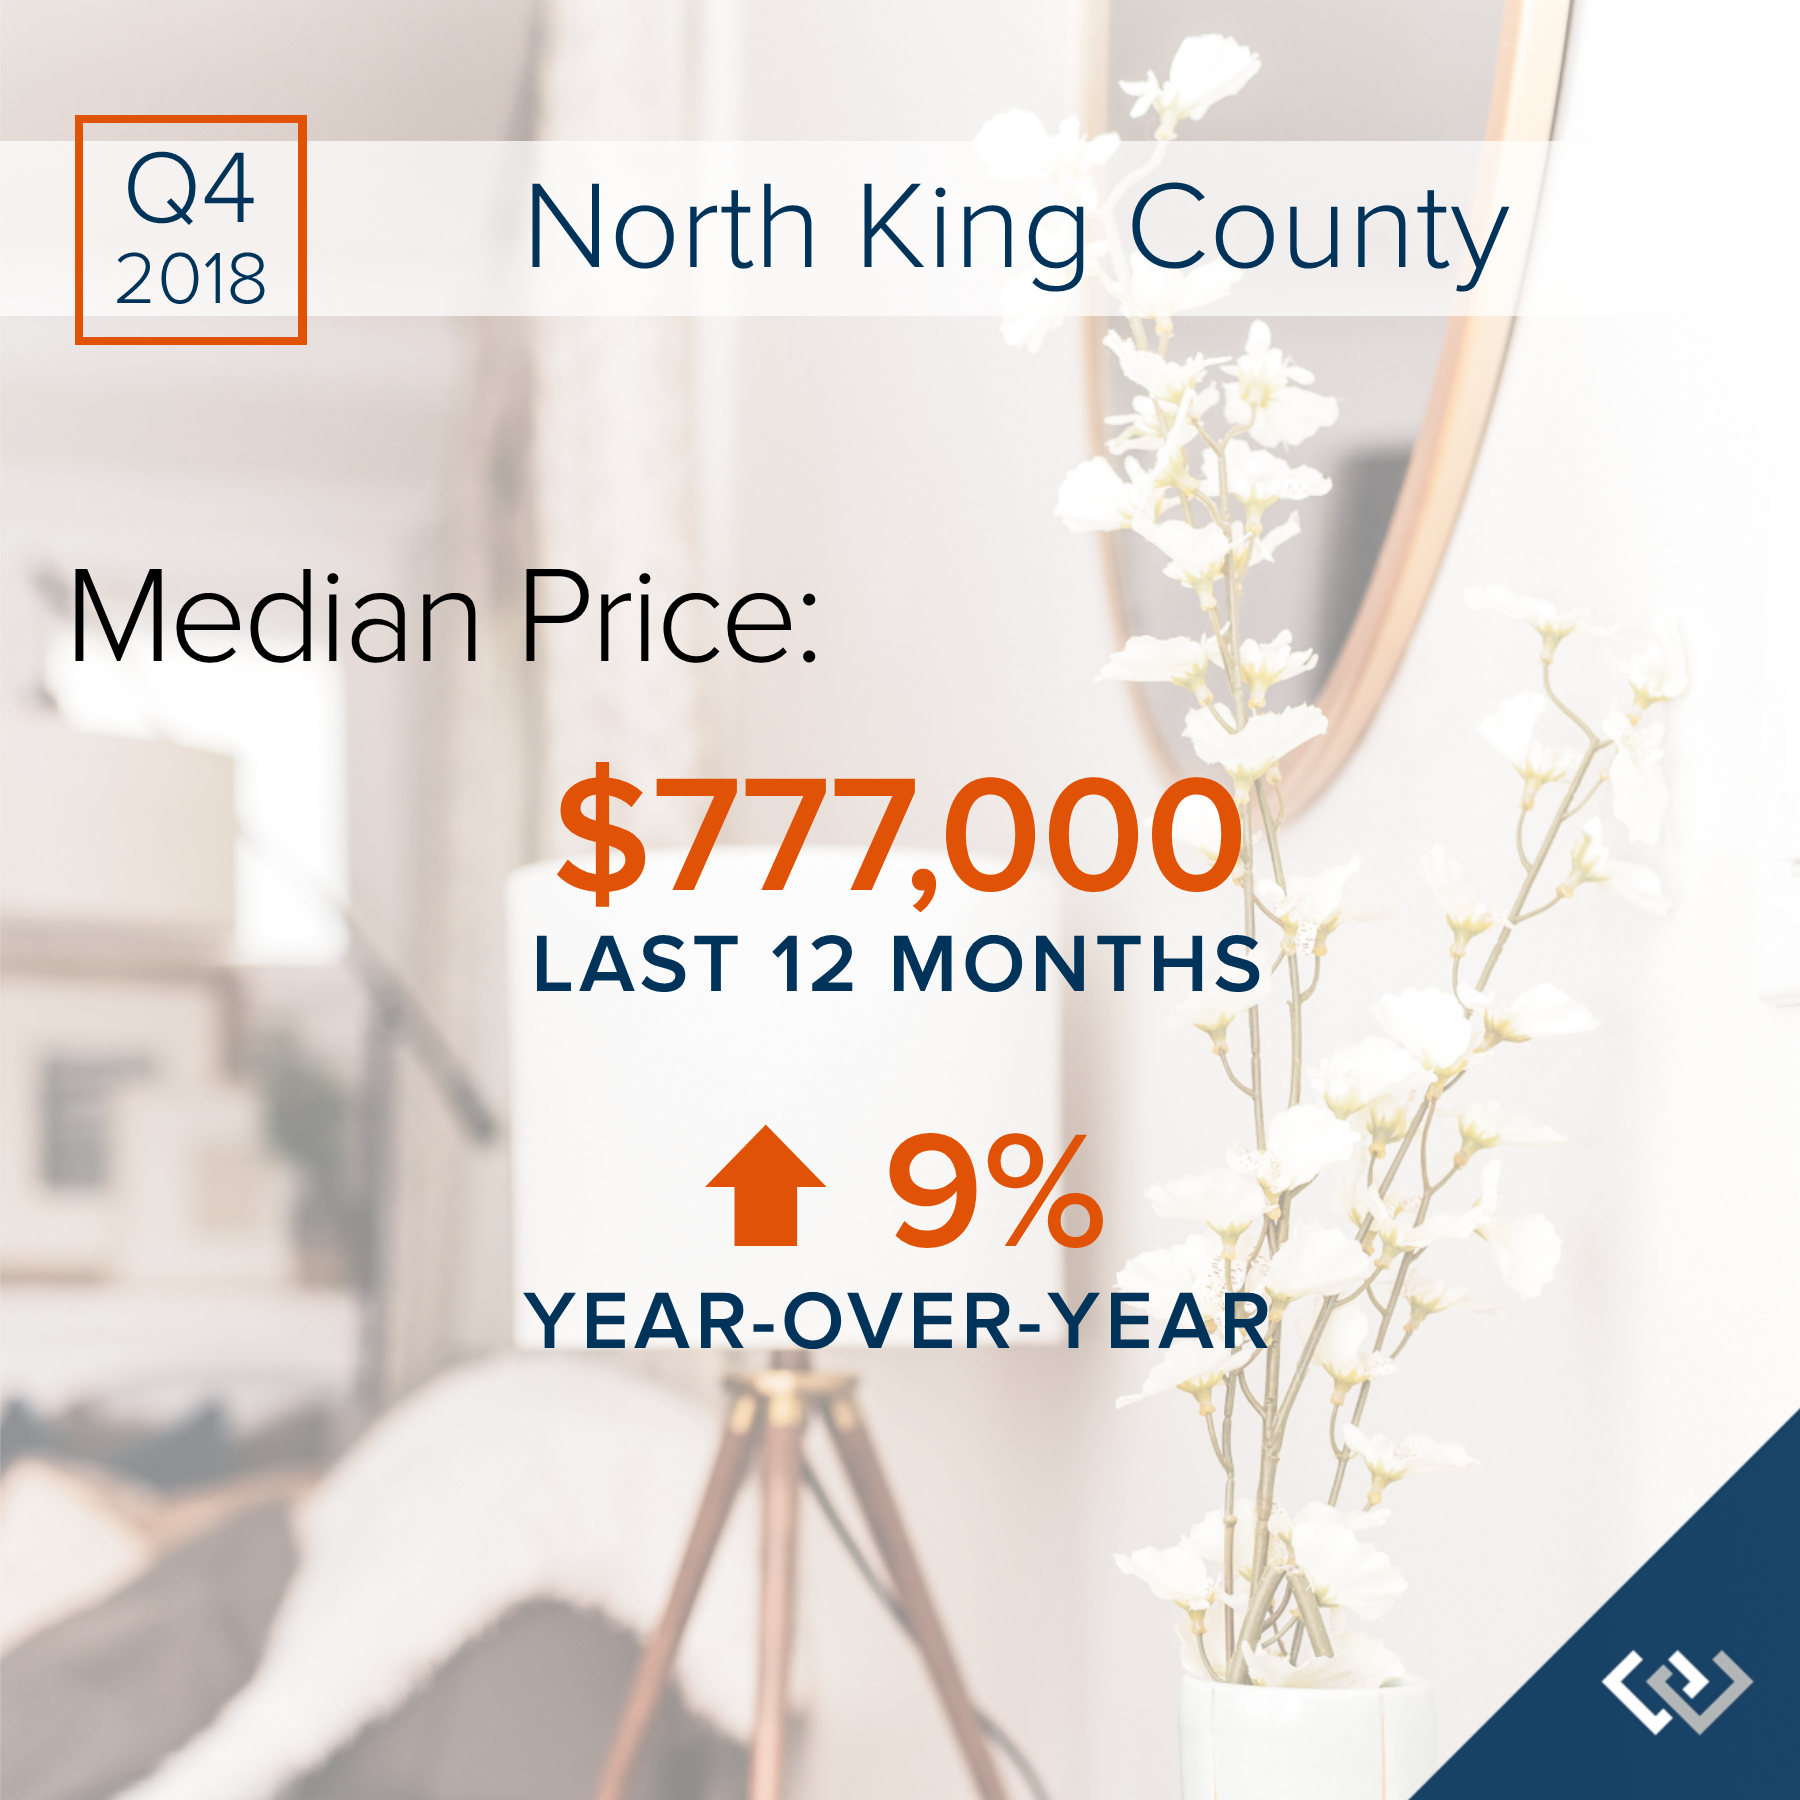
Q4: October 1 – December 31, 2018
NORTH KING COUNTY: 2018 was a year of change and growth. The market shifted from an extreme seller’s market, but still had strong gains. Year-over-year, median price is up 9% and since 2012 has increased 92%! Over the last 19 years, the average year-over-year price increase has been 6%. This puts into perspective the growth we have experienced, resulting in well-established equity levels. In 2018, inventory averaged 1.5 months, double that of 2017. This caused the month-over-month price gains to slow, and we experienced a price correction over the second half of the year. We expect to see more average levels of price appreciation in 2019 as the market continues to balance out.

After six years of expansion resulting in an extreme seller’s market, in 2018 we encountered a market shift in the late spring. Inventory increased, interest rates took a jump, and demand took a step back to re-evaluate the new playing field. This resulted in a tempering of month-over-month price appreciation, and has established some long-awaited balance. This balance has brought opportunities for both buyers and sellers. Buyers have more selection and are negotiating terms like inspection items and concessions. Sellers are sitting on 6+ years of equity growth, and are now able to sell their home and make a move without fearing where they will land next. Interest rates are still well below the 30-year average, currently hovering just under 5%. We are seeing demand start to re-engage now that the new normal has settled in.
This is only a snapshot of the trends in north King County; please contact us if you would like further explanation of how the latest trends relate to you.
Quarterly Reports: Q4 South Snohomish County
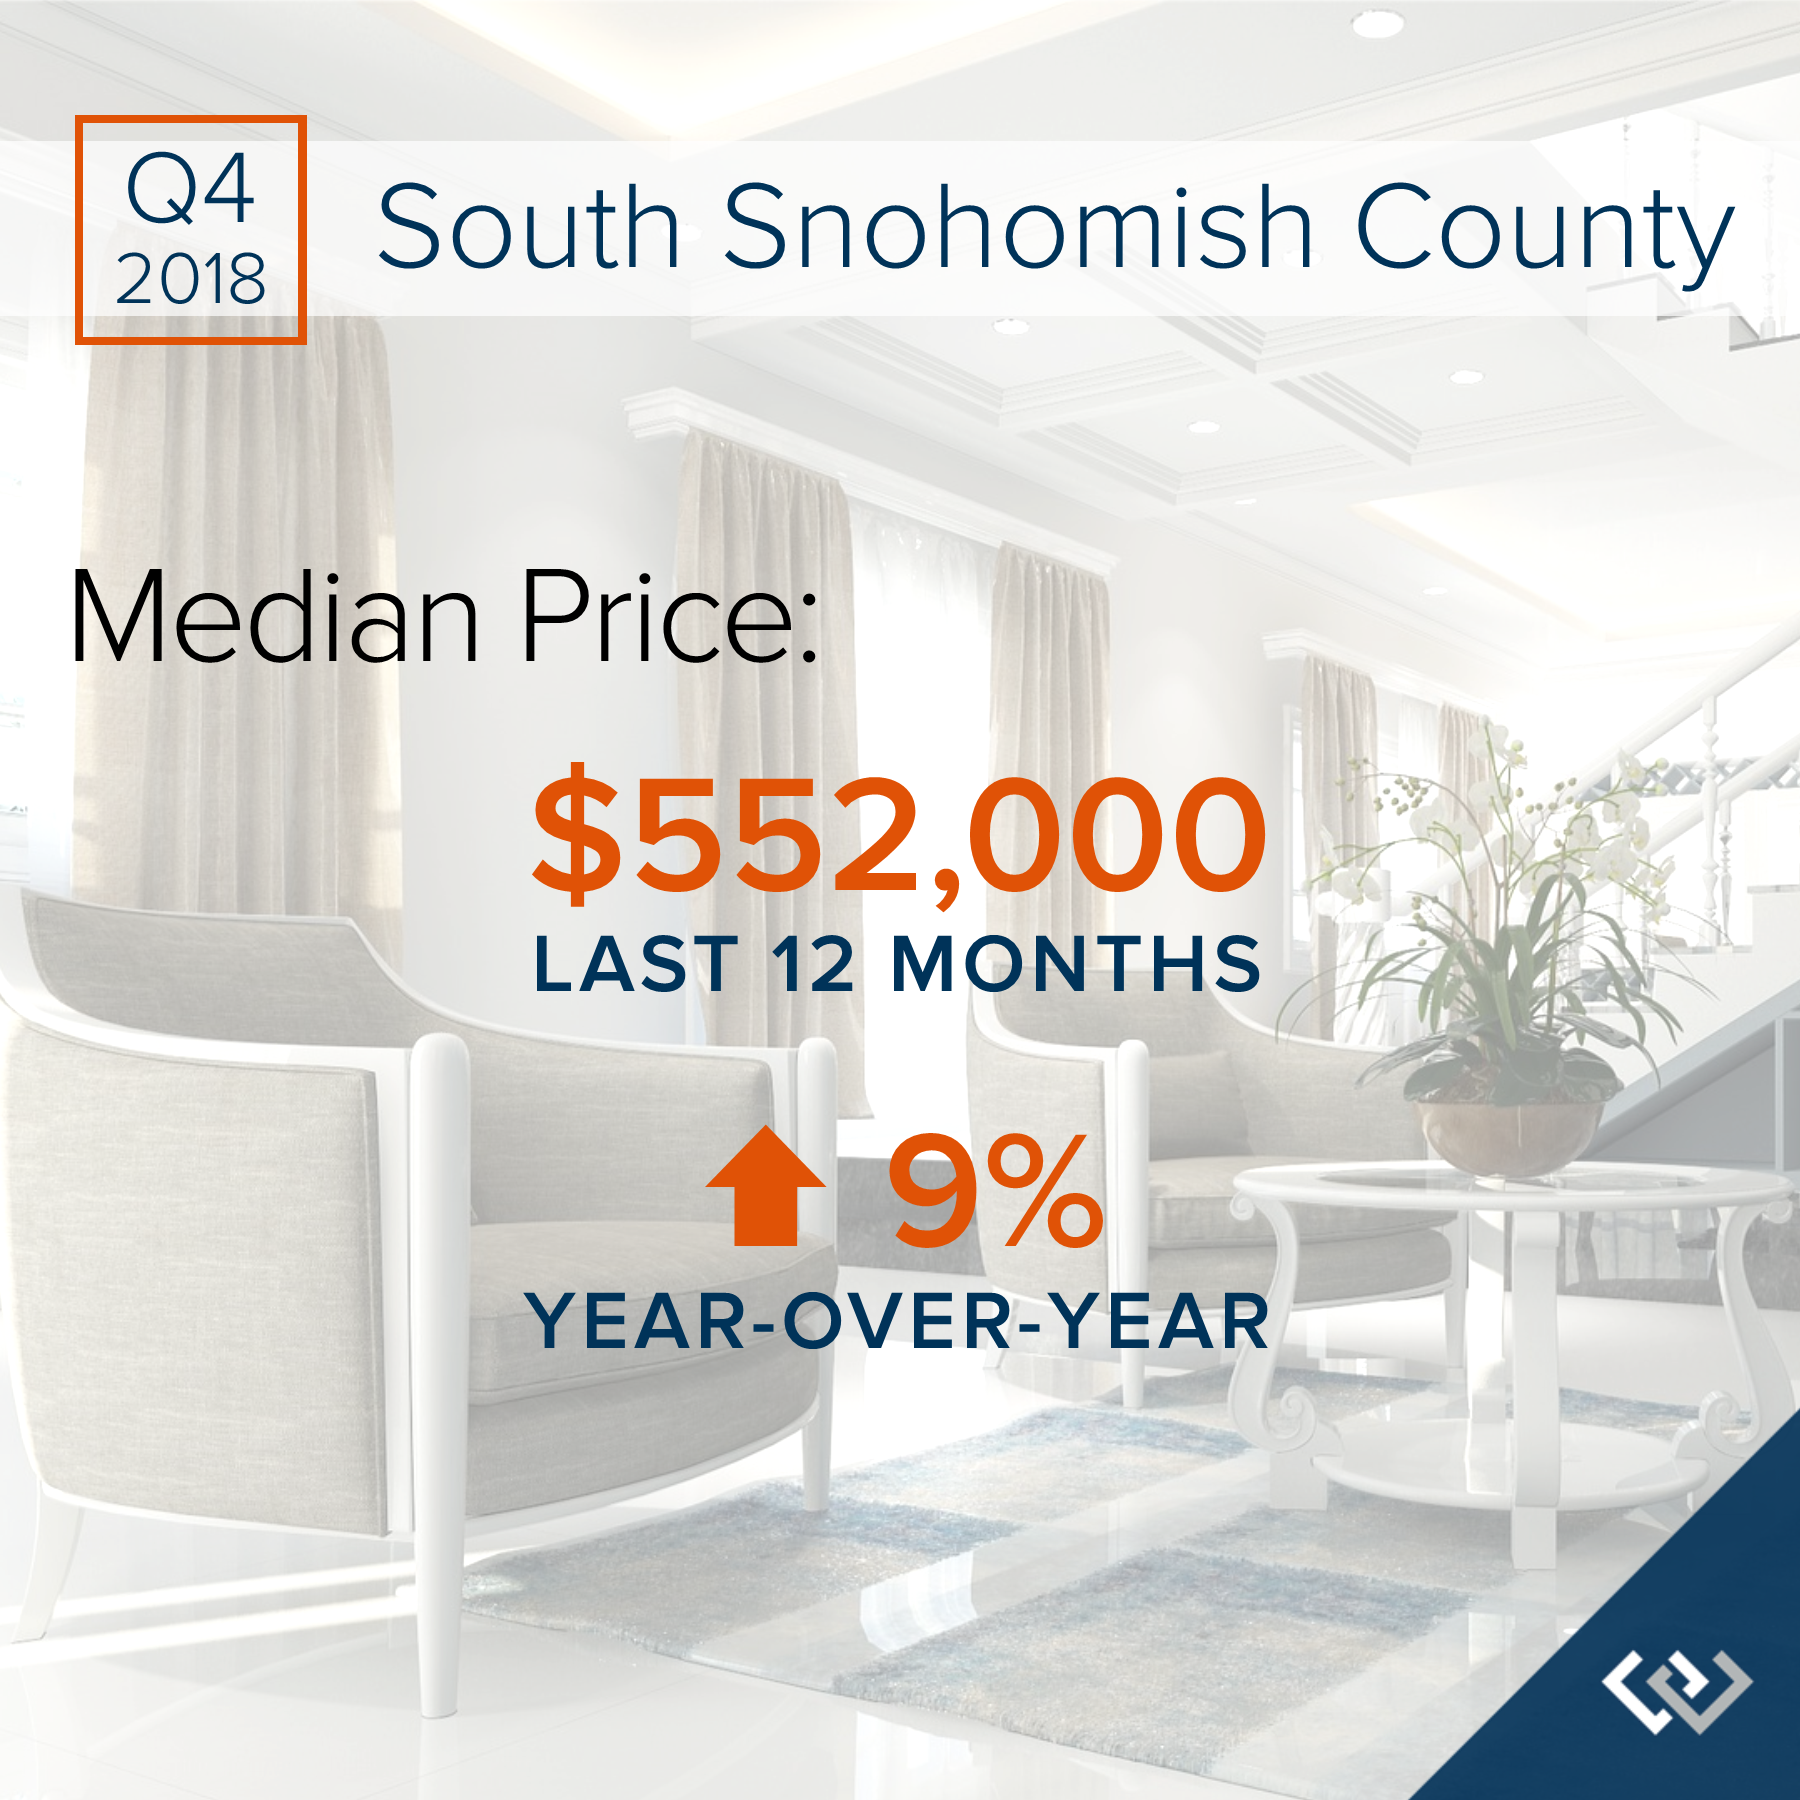
Q4: October 1 – December 31, 2018
SOUTH SNOHOMISH COUNTY: 2018 was a year of change and growth. The market shifted from an extreme seller’s market, but still had strong gains. Year-over-year, median price is up 9% and since 2012 has increased 85%! Over the last 19 years, the average year-over-year price increase has been 6%. This puts into perspective the growth we have experienced, resulting in well-established equity levels. In 2018, inventory averaged 1.5 months, double that of 2017. This caused the month-over-month price gains to slow, and we experienced a price correction over the second half of the year. We expect to see more average levels of price appreciation in 2019 as the market continues to balance out.
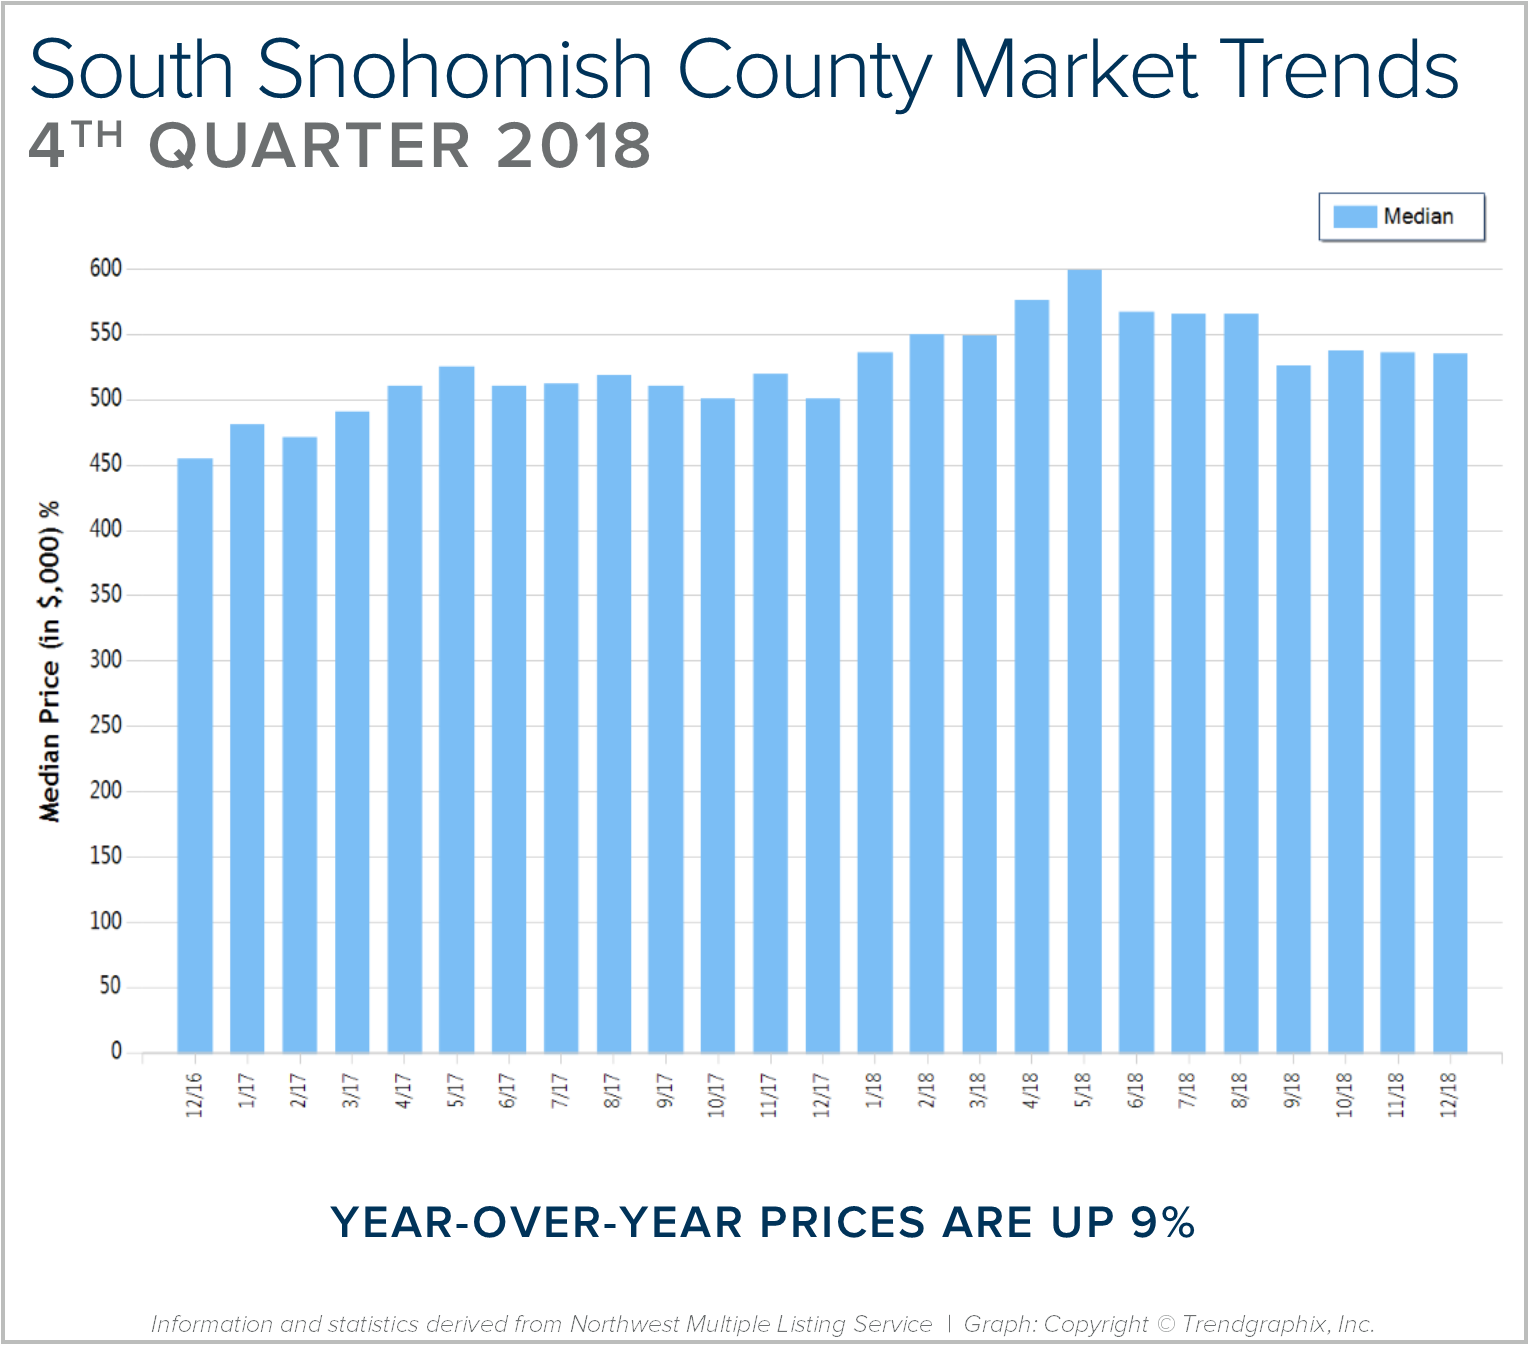
After six years of expansion resulting in an extreme seller’s market, in 2018 we encountered a market shift in the late spring. Inventory increased, interest rates took a jump, and demand took a step back to re-evaluate the new playing field. This resulted in a tempering of month-over-month price appreciation, and has established some long-awaited balance. This balance has brought opportunities for both buyers and sellers. Buyers have more selection and are negotiating terms like inspection items and concessions. Sellers are sitting on 6+ years of equity growth, and are now able to sell their home and make a move without fearing where they will land next. Interest rates are still well below the 30-year average, currently hovering just under 5%. We are seeing demand start to re-engage now that the new normal has settled in.
This is only a snapshot of the trends in south Snohomish County; please contact us if you would like further explanation of how the latest trends relate to you.
Quarterly Reports: Q3 South Snohomish
Q3: July 1 – September 30, 2018
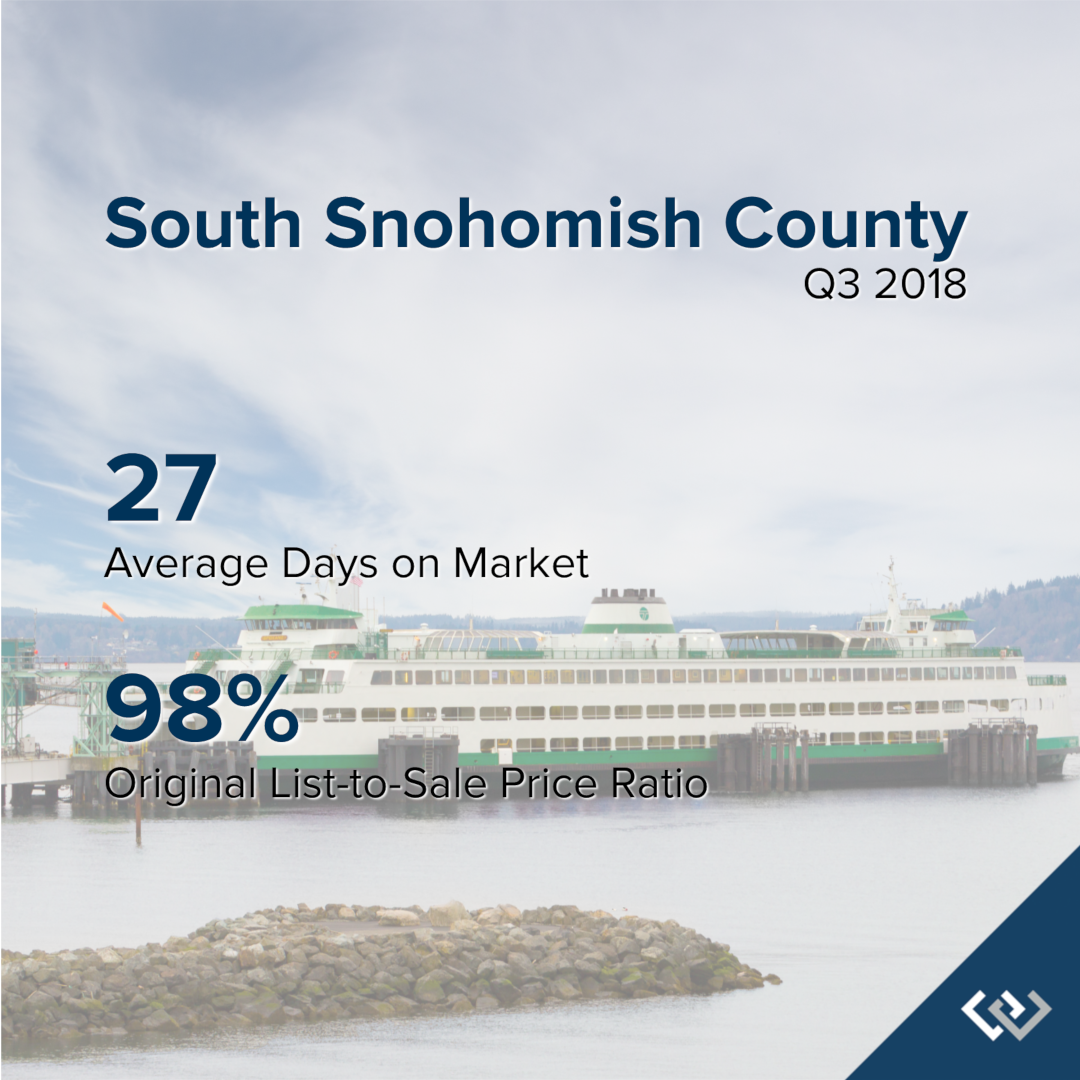
SOUTH SNOHOMISH COUNTY: In September, the average days on market landed at 27 days and the original list-to-sale price ratio 98%. Since May, inventory growth has been noticeable, and has given buyers more options. This has led to more negotiations and fewer bidding wars, which is tempering month-over-month price growth to a more sustainable level.
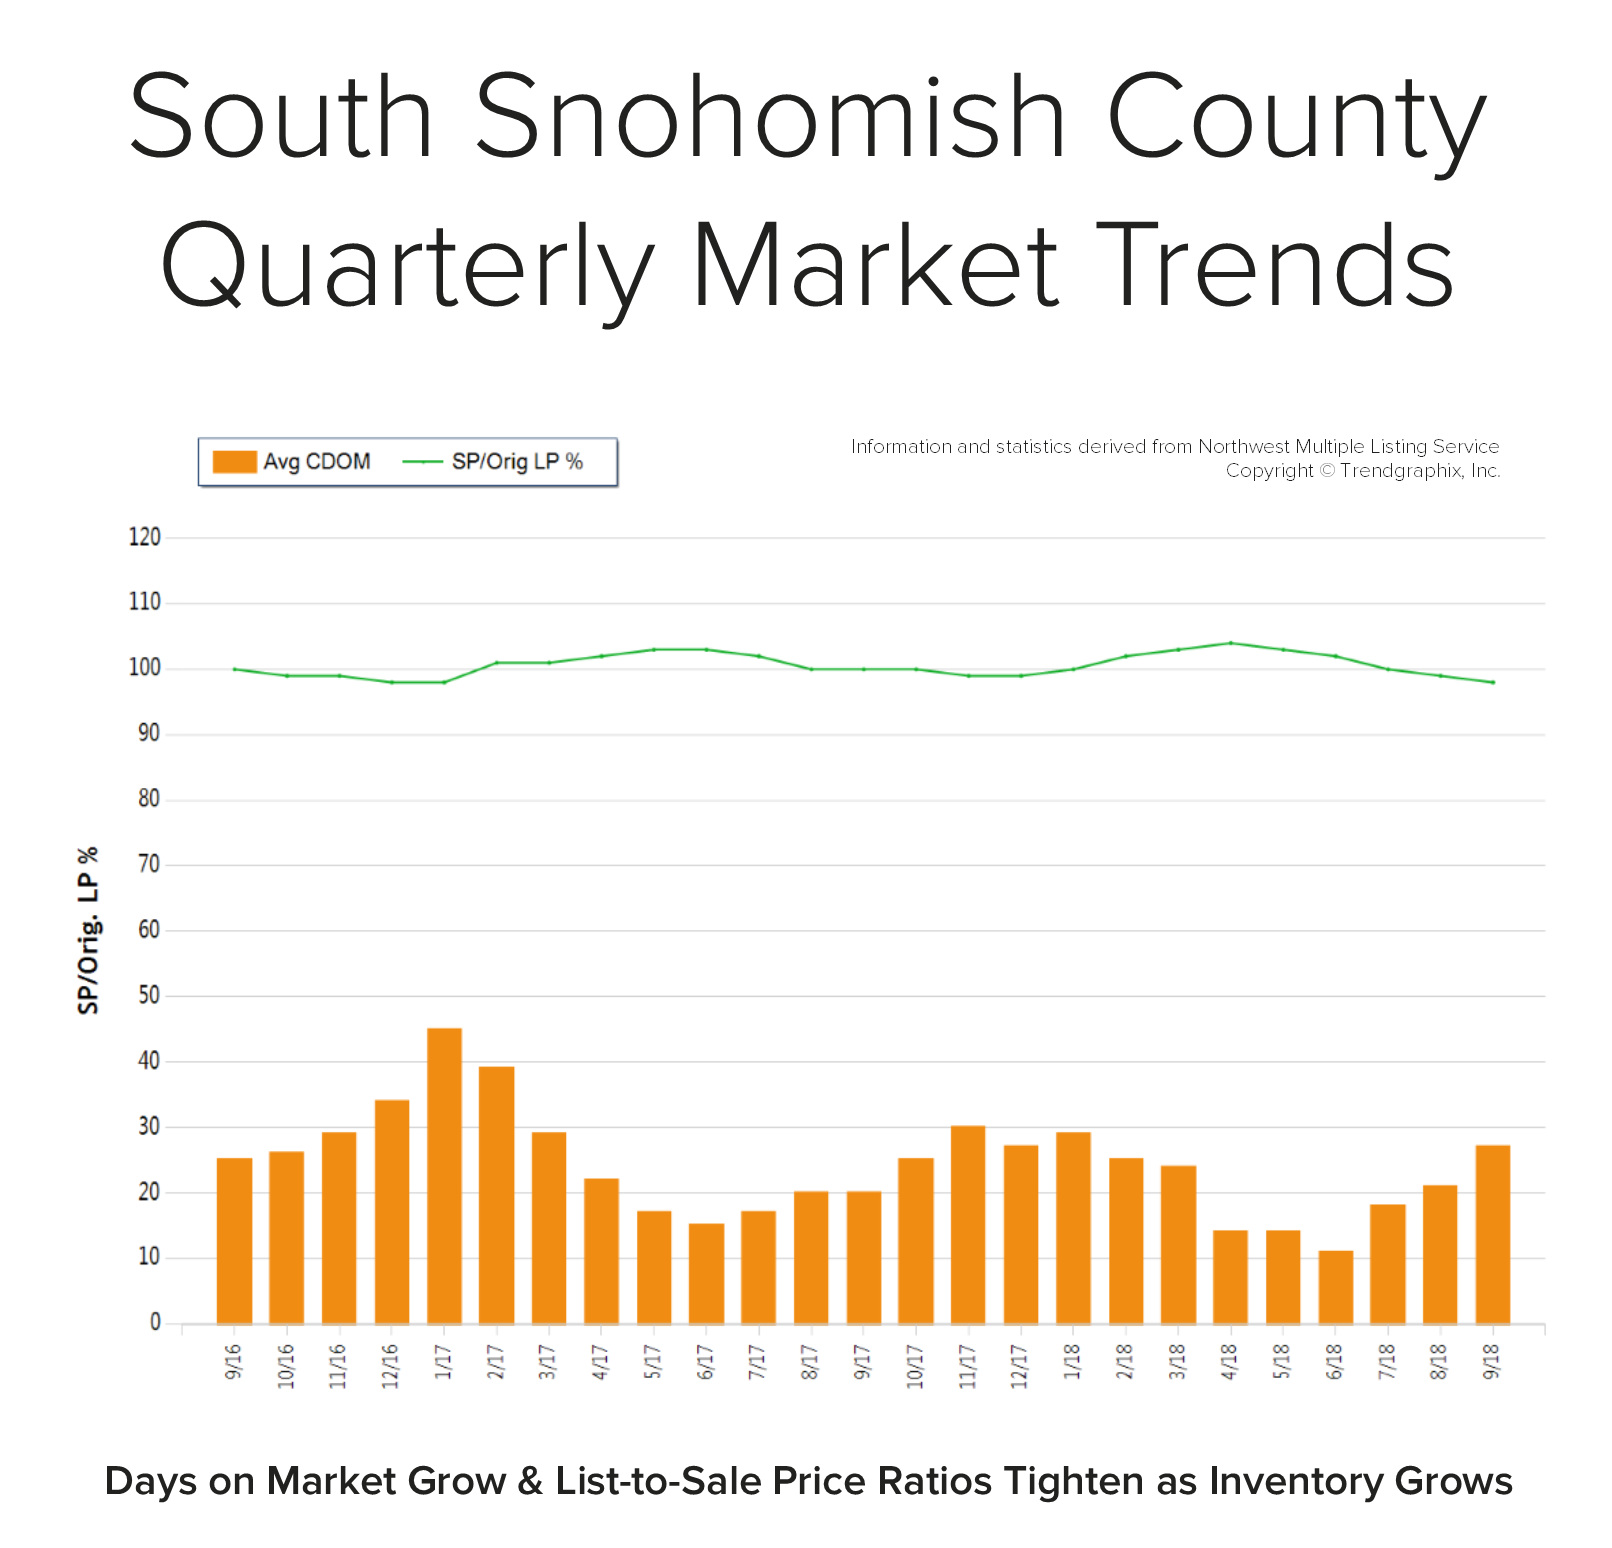 Back in April, the average days on market was 14 days and the original list-to-sale price ratio 104%; but months of inventory based on pending sales was 0.8 months, compared to 2.5 months currently. Year-over-year, prices are up 11%, still well above the historical norm of 3%-5% year-over-year gains—but note that the majority of this growth happened during the spring, due to constricted inventory levels.
Supply has increased, creating more options for buyers and helping to buffer affordability issues. Many sellers are deciding to make moves and cash in on the equity gained over the last six years. An average original list-to-sale price ratio of 98% is a positive return, yet illustrates a softening in the market after some very extreme times. With 11% price growth over the last 12-months in a seller’s favor, the increase in selection has led to more nimble moves from one house to another. Where sellers need to be careful is anticipating the month-over-month price growth we saw prior to the shift in inventory. Prospective buyers would be smart to take advantage of today’s historically low interest rates and the added inventory selection.
This is only a snapshot of the trends in south Snohomish County; please contact us if you would like further explanation of how the latest trends relate to you.
Wealth-Building Opportunities Abound for First Time Home Buyers


With the sharpest increase of available homes for sale in years, more opportunities are now available for buyers, including first-timers. Many first-time home buyers have sat on the sidelines and remained renters due to the constriction of inventory, which put major pressure on price affordability. Not only has affordability been an issue, but the terms required to prevail in a multiple-offer situation were often not within reach for someone entering the market for the first time.
For example, over the last 12 months in the Seattle Metro area we have seen a 66% increase in the selection of homes for buyers to choose from. There is currently 1.8 months of available inventory based on pending sales versus 0.8 months that was available the same month last year. This is still a seller’s market (0-3 months), but it is providing more than twice as much selection than a year ago. This loosening up of the market has helped to temper price growth by reducing the amount of price escalations and the need to have super aggressive financing terms in order to secure a home.
You see, over the last 3-4 years we have experienced double-digit price appreciation (10-14%) year-over-year, each year. A normal rate of appreciation is 3-5%. Minimal amounts of available inventory, low interest rates, and rapid job growth lead to this increase in prices. Now that more homes are coming to market and job growth has stabilized a bit (still growing, but not as fast), price growth has slowed. This is good news for sustainability and affordability. Here’s the deal though – we are still experiencing growth in values, making home ownership a sound investment over renting.
According to the most recent survey from rentcafe.com, the average rent for an apartment in Seattle is $1,906 with an average square footage of 736 sq. ft. That is quite a bit of money for not a ton of space. Further, that monthly expenditure does not create any wealth for the renter, only for the landlord. With renting, rates can be increased at any time, and you are paying down someone else’s asset, not your own. Also, owning gives the homeowner control of their overhead, while getting to make their house their home by adding improvements such as painting.
There are several factors to consider that will lead a person to make the best decision for their lifestyle and their financial bottom line. One of the biggest factors is interest rates! Currently, the rate for a 30-year fixed, conventional, conforming loan is hovering around 4.88%. Up from earlier this year and predicted to rise, but still historically low over the course of the last 30 years. These rates need to be considered the greatest opportunity of them all! With prices tempering and rates still under the 30-year average of 6.65%, buyers are able to secure a sound investment with very low debt service.
With interest rates predicted to rise over the next year, a good rule of thumb to remember is that for every one-point increase in rate, a buyer loses 10% of their buying power. For example, if the rate jumps from 4.75% to 5.75% and one wants to keep the same monthly payment, they must adjust their price point down by 10%. So, a $450,000 budget becomes a $405,000 budget, and that isn’t taking appreciation into consideration. If you assume an average appreciation rate of 4% year-over-year, today’s $450,000 house will be $468,000 next year. What side of the equity growth do you want to be on? As an owner now, or a buyer a year from now, when prices are higher and interest rates are most likely higher as well?
Once you secure a mortgage, the payment stays the same over the term of the entire loan. The long-term benefits of owning are abundant, including the stability of not being asked to move. These are important factors to consider for everyone, but especially millennials, who are enjoying the benefits of Seattle’s attractive job market. One myth to address is the common belief that you must have a 20% down payment in order to buy a home. That is simply not true. There are loan programs as low as 3% down, decreasing the need to have a large sum of money saved up before being able to buy.
Where folks are having to compromise the most due to affordability is commute times, and settling in less-urban neighborhoods. Worth pointing out, is the average home price in south Snohomish County is 34% less than Seattle Metro – that is a huge savings! Further, south King County is 74% more affordable than Seattle. Some people, mainly millennials, have not been willing to give up living in the core urban neighborhoods that have high walk scores and shorter commute times. That should be apt to change with more selection available in the purchase market, coupled with low interest rates. The advantages of moving out a little further and securing a home will start people on the track of building long-term wealth. If you or anyone you know is currently renting and is considering a change, please let me know, as I would be happy to get their questions answered and help them make an informed decision.
Commute Times & Price Premiums: The Value of Location, Location, Location

It is the time of year when we like to re-cap the price premiums in our area based on commute times. The price divide continued in 2017 between key market areas in the Greater Seattle area based on proximity to major job centers. These pricing premiums have cemented the drive-to-qualify market. Seattle proper has always been more expensive than its neighboring suburbs, but the most current prices illustrate the extreme value of a shorter commute.
 In 2017, the average sales price for a single-family residential home in the Seattle Metro area was $801,000, up 14% from the year prior! In south Snohomish County (Everett to the King County line) the average sales price for a single-family residential home in 2017 was $543,000, up 12% from the year prior, however 48% less expensive than Seattle Metro.
Further, if you jump across Lake Washington to the Eastside, the average sales price in 2017 for a single-family residential home was $1,049,000, up 16% from the year prior and 31% more expensive than Seattle Metro! The Eastside has the infrastructure to support their own job centers, making it a second “Seattle”, with the benefit of newer and larger housing stock, which reflects the pricing. Many folks are living and working on the Eastside, or using the 520 toll bridge to jump over to Seattle.
In 2017, closed transactions were up 4% in south Snohomish County despite fewer new listings coming to market, which I think was driven by its affordability compared to Seattle and the Eastside. Snohomish County offers lower prices, larger houses and yards, new construction, lower taxes, strong school district options and longer, yet manageable commute times. Newer transit centers and telecommuting have also opened up doors to King County’s little brother to the north.
Another hot button that has continued to influence pricing is the future expansion of Light Rail and the locations of the planned stations. We have seen home values in these areas sell at a premium as consumers anticipate the shorter commute times the rail will bring. These neighborhoods are experiencing zoning changes now and the additional expansion is being phased in over the course of the next 15 years. There will be more multi-family and commercial development in these areas, creating more density to serve the public using these commuting services. This has created great appeal for homeowners that want to get in on the ease of nearby public transportation, and developers eager to be part of the infrastructure growth. Stations at Northgate, 145th & 185th in Shoreline, Mountlake Terrace and Lynnwood are all slated to open over the next 3-6 years.
No matter what neighborhood you are interested in learning about, in either King or Snohomish County, we are happy to provide a 2017 re-cap of that market. We work in both counties and understand each of their nuances. 2017 was another eventful year in real estate and we are looking for that to continue in 2018. With these strong market prices, we hope to see an increase in inventory levels, providing more options for buyers and allowing price growth to temper to sustainable levels.
Here’s to a successful 2018!
Quarterly Market Trends: South King County
 Q4 2017
 Q4 2017
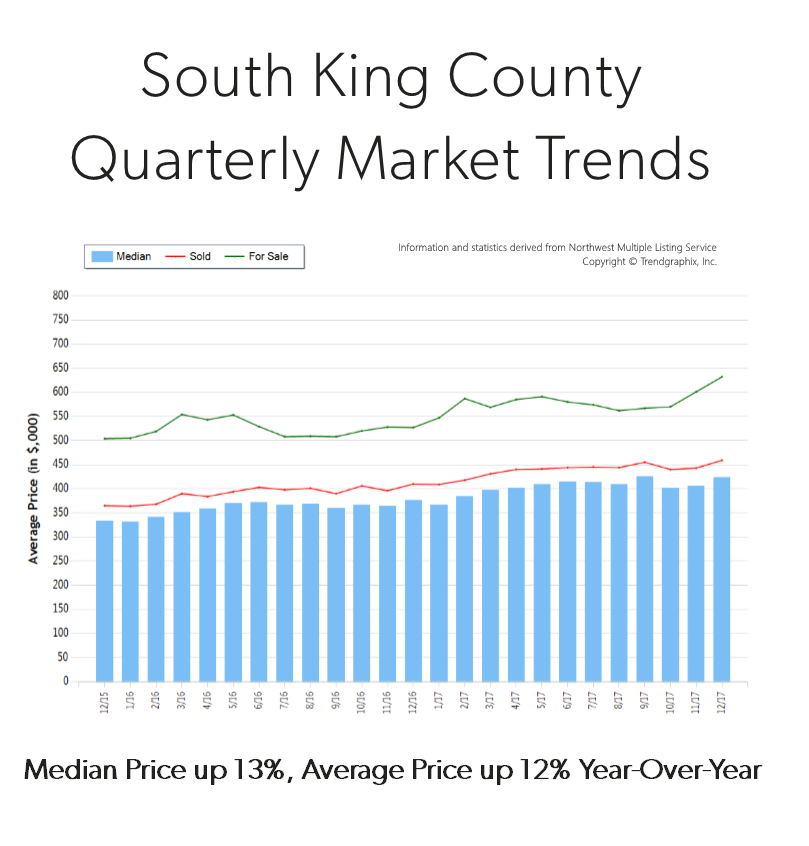
Price growth was particularly strong in 2017! Median was up 13% and average price up 12% over 2016. Median price in 2017 landed at $405,000 and the average at $440,000. The average amount of days it took to sell a house in 2017 was 30 days which is 9% faster than 2016. The average list-to-sale price ratio over the last year was 100%, with the spring months as high as 102%! In 2017, inventory growth continued to be a challenge, with a 7% decrease in new listings compared to 2016. Even with inventory limitations there were 2% more sales! This phenomenon illustrates strong buyer demand and a need for more listings.
South King County real estate has seen a steady stream of buyers come our way due to affordability, reasonable commute times and quality of life. In fact, the median price in 2017 was 75% higher in Seattle Metro. Historically low interest rates continue to drive the market as well, they have helped offset the increase in prices. Sellers are enjoying great returns due to this phenomenon and buyers are securing mortgages with minor debt service.
This is only a snapshot of the trends in south King County; please contact me if you would like further explanation of how the latest trends relate to you.
Quarterly Market Trends: Seattle Metro
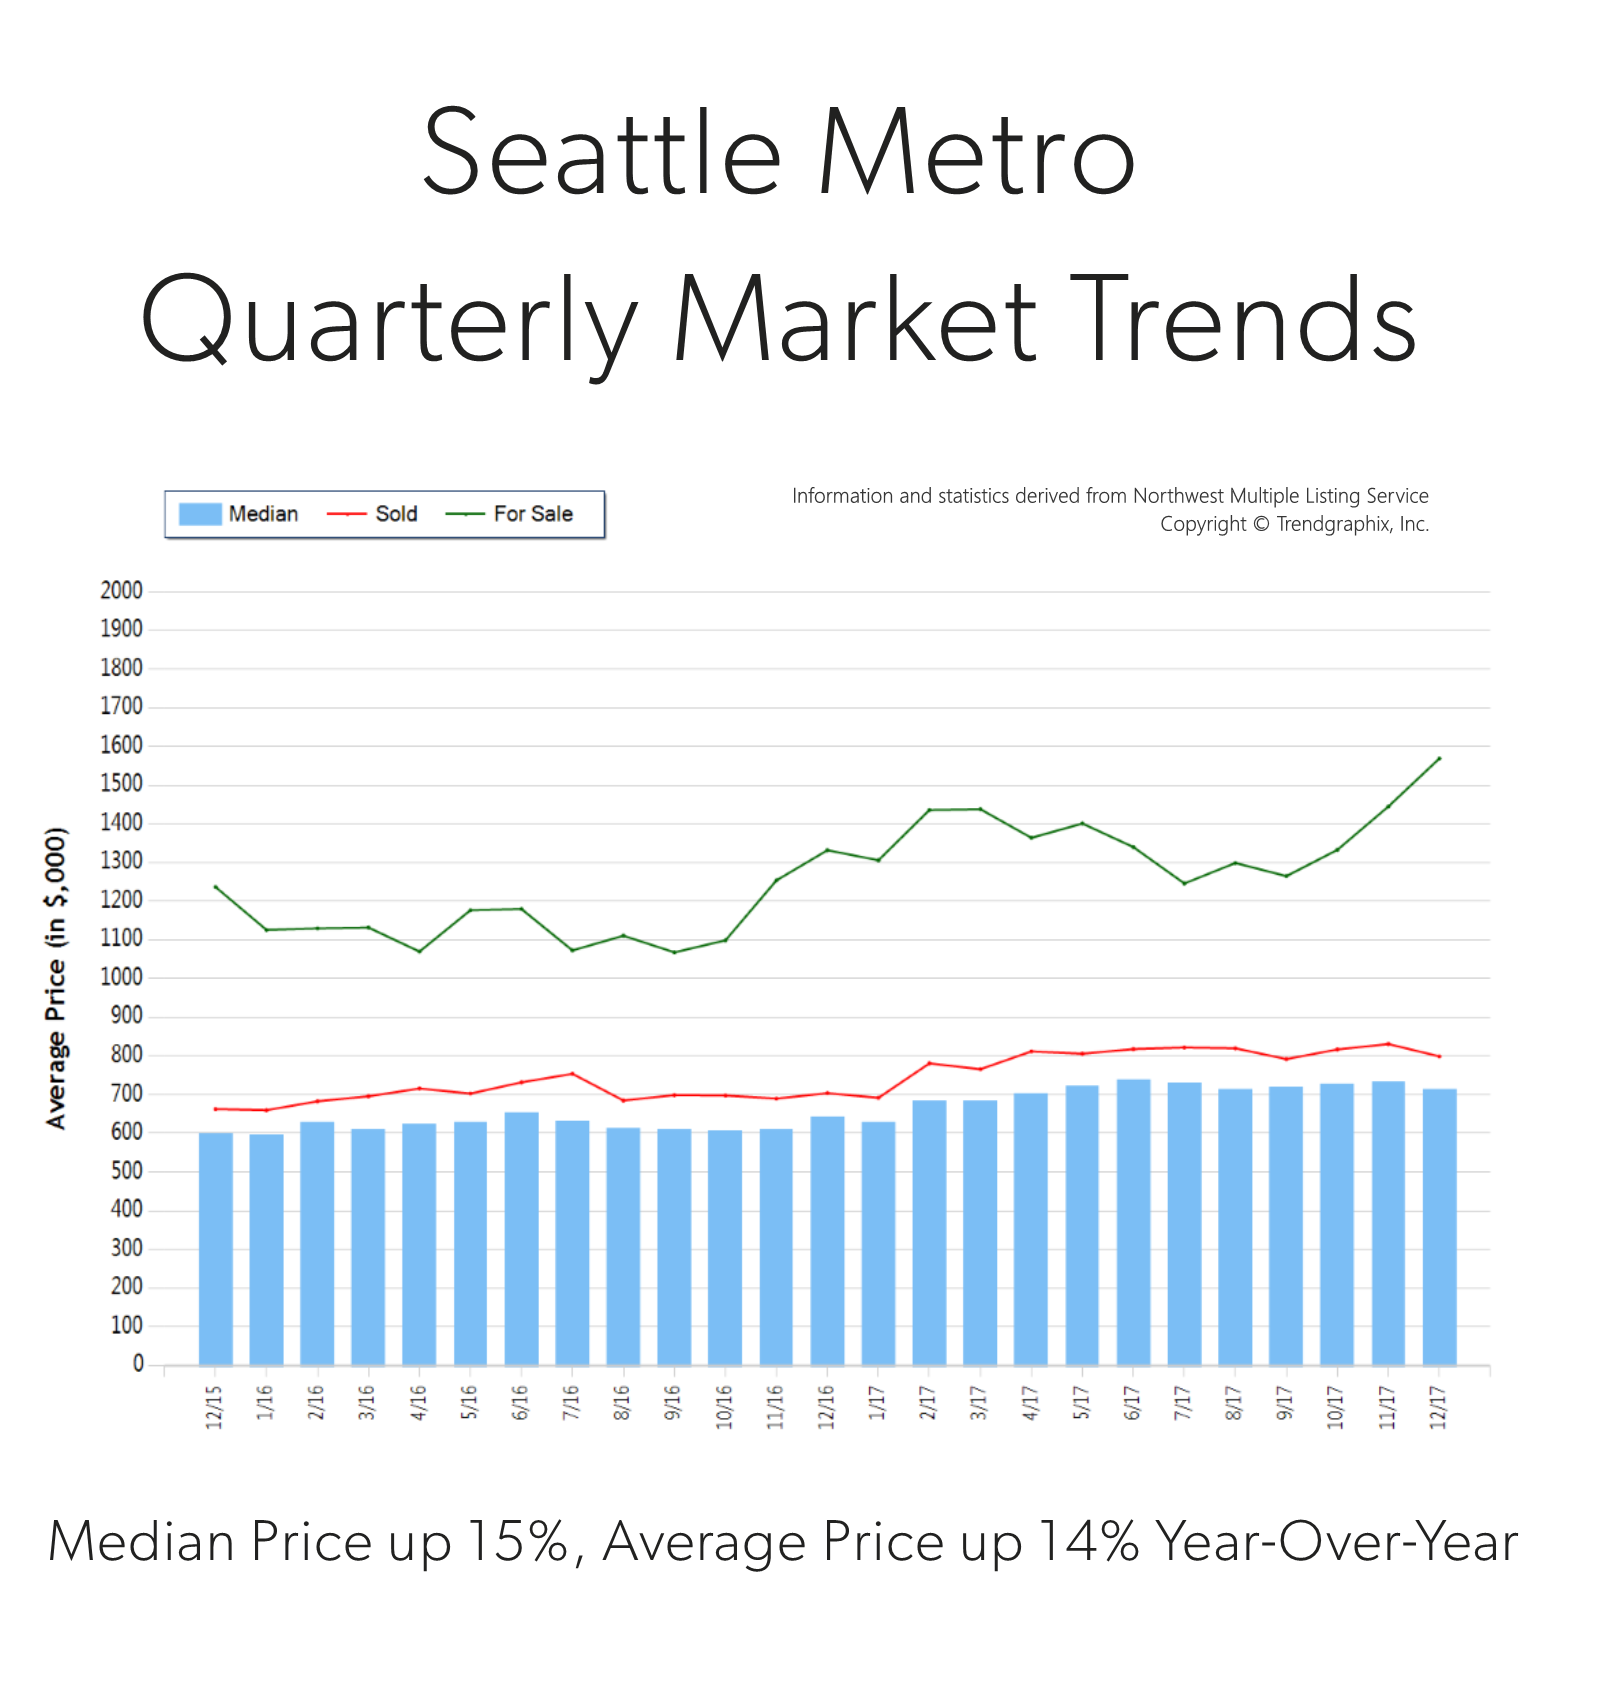
Q4 2017
 Price growth was particularly strong in 2017! Median was up 15% and average price up 14% over 2016. Median price in 2017 landed at $710,000 and the average at $801,000. The average amount of days it took to sell a house in 2017 was 18 days, which is 10% faster than 2016. The average list-to-sale price ratio over the last year was 103%, with the spring months as high as 106%! In 2017, inventory growth continued to be a challenge, with a 3% decrease in new listings compared to 2016. Even with inventory limitations there were 4% more sales! This phenomenon illustrates strong buyer demand and a need for more listings.
Demand for Seattle Metro area real estate has grown due to close proximity to job centers. Over the last year, Seattle Metro was 40% more expensive than south Snohomish County and 75% over south King County. Historically low interest rates continue to drive the market as well, they have helped offset the increase in prices. Sellers are enjoying great returns due to this phenomenon and buyers are securing mortgages with minor debt service.
This is only a snapshot of the trends in the Seattle Metro area; please contact us if you would like further explanation of how the latest trends relate to you.
