
 Facebook
 Twitter
 Pinterest
 Copy Link
Snohomish County
Seasonal patterns are returning after the market’s fall and recovery
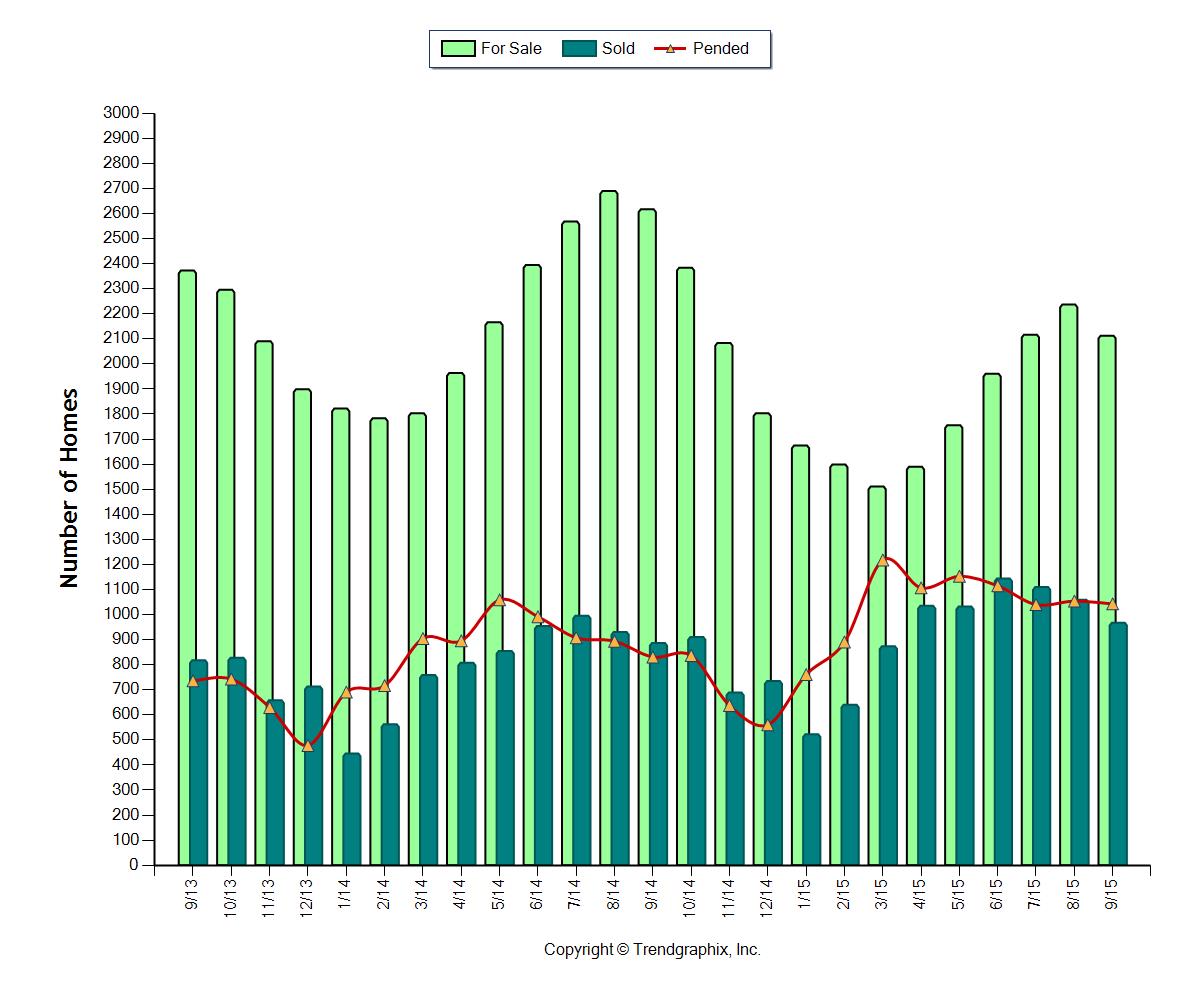
The graph above shows a two-year history of the market, where we have clearly seen a surge of inventory from March to August. In fact we saw a 48% increase in inventory during this time period. While that is a welcome increase, inventory growth was down 1% from the year prior, all while closed sales were up 18%! Months of Inventory based on pending sales has held steady at an average of two months over the last year. Due to demand outweighing supply we continue to see above-normal price growth, with both median and average prices up 9% complete year-over-year.
South Snohomish County
Seasonal patterns are returning after the market’s fall and recovery
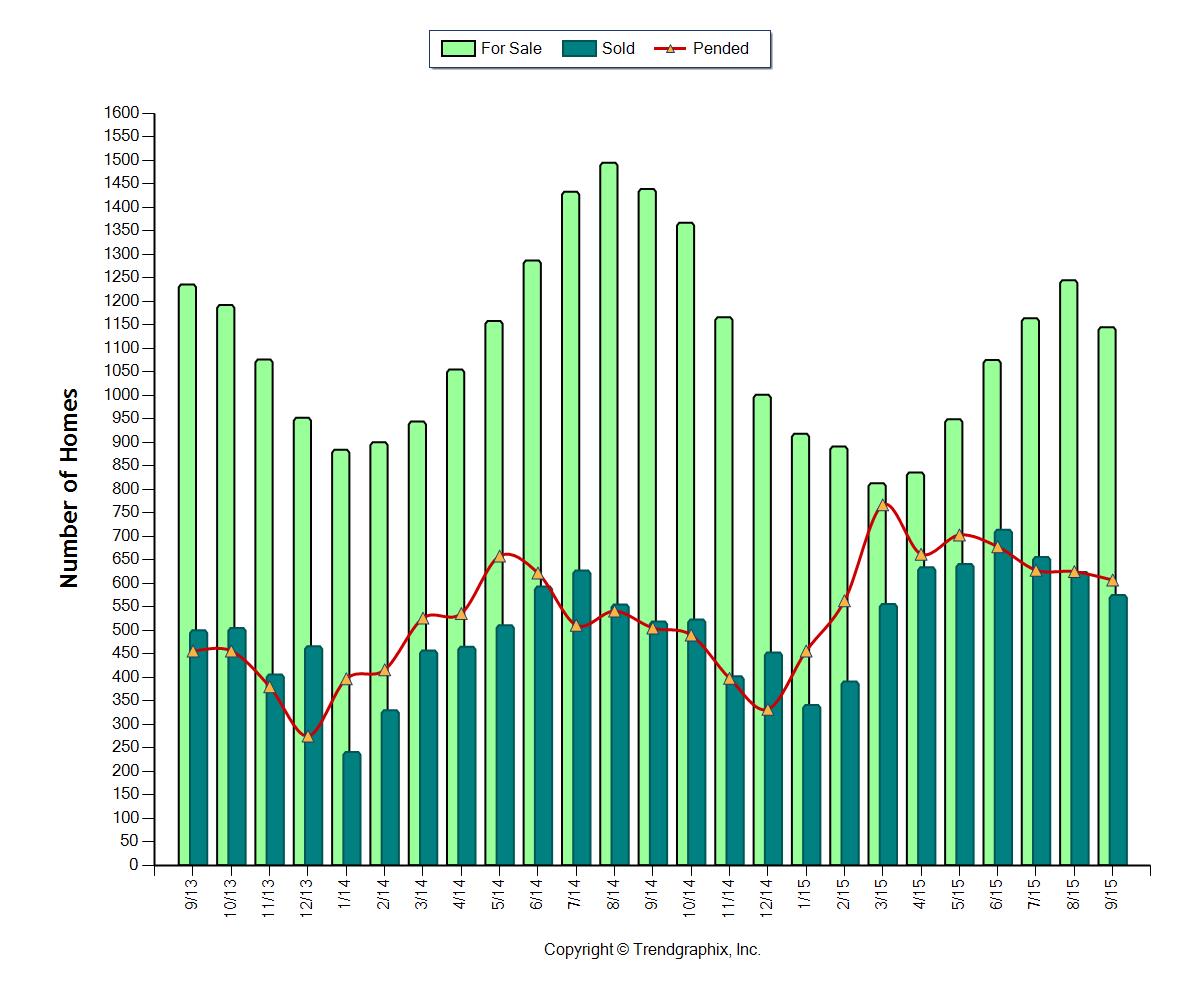
You can see in the graph above a clear surge of inventory came to market from March to August. In fact we saw a 53% increase in inventory during this time period. While that is a welcome increase, inventory growth was down 5% from the year prior, all while closed sales were up 19%! Months of Inventory based on pending sales has held steady at an average of two months over the last year. Due to demand outweighing supply we continue to see above-normal price growth, with both median and average prices up 9% complete year-over-year.
North King County
Price increases are strong due to high demand and low inventory
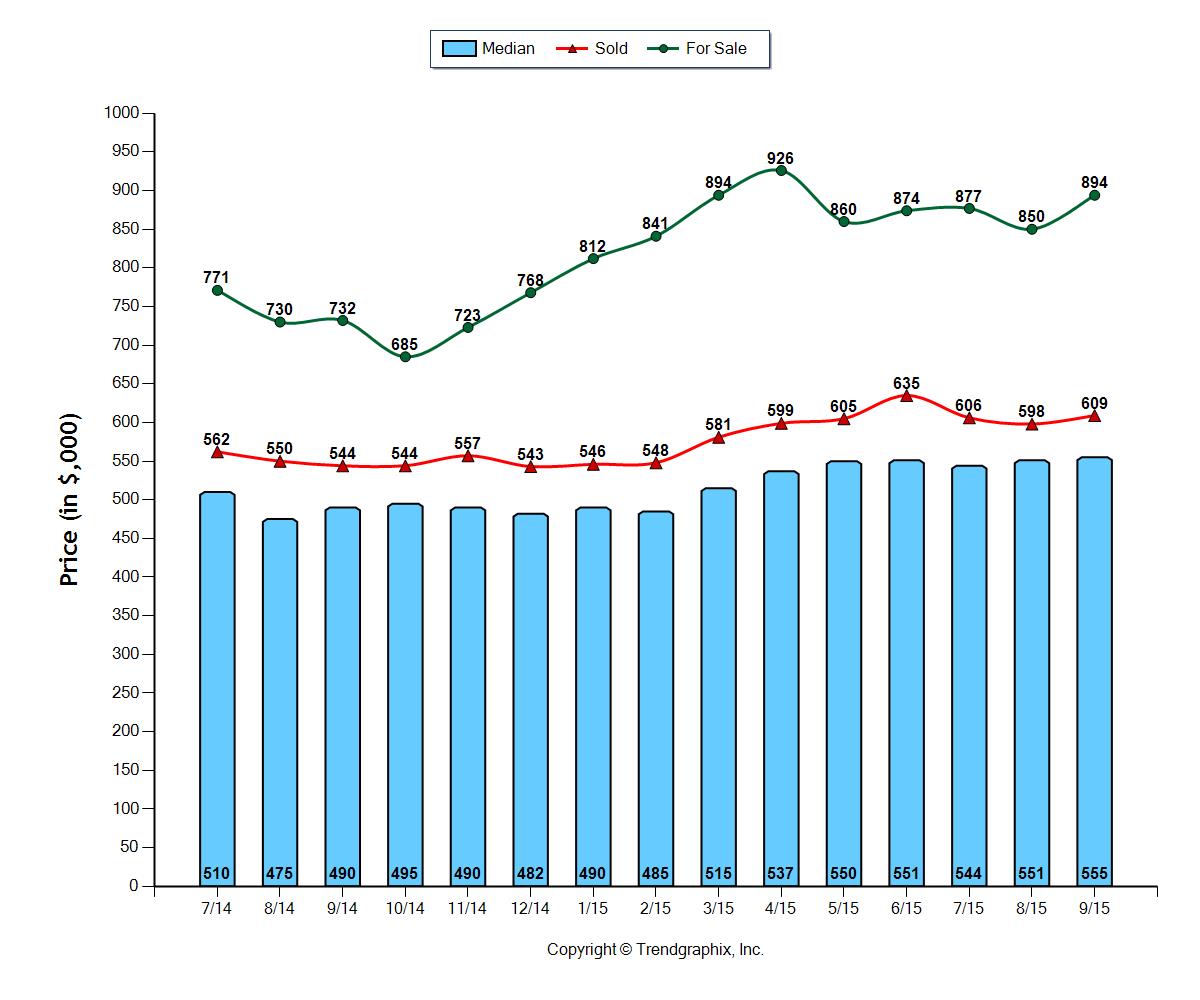
All indicators, such as sold median price, sold average price and sold price per square foot point to a 10% increase in prices complete year-over-year. The median price in North King County this September was $555,000 and the average was $609,000. Average days on market have shrunk to as low as 22 days this last month, and the list to sale price ratio was 101%. Lack of supply and high demand is the gas in this market’s engine. Months of inventory based on pending sales finally crested one month after a small surge of additional inventory in the third quarter.
Eastside
Seasonal patterns are returning after the market’s fall and recovery
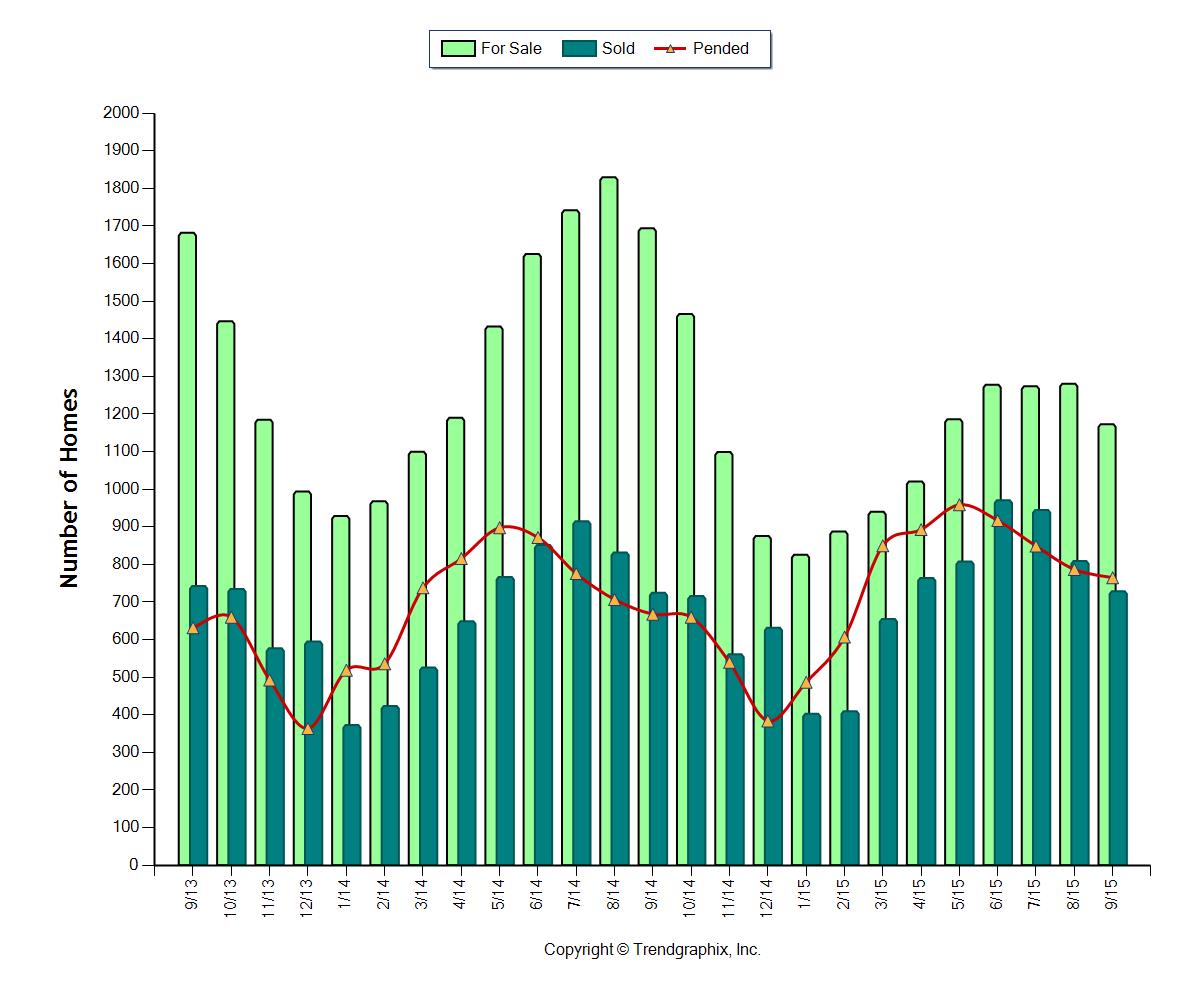
The graph above shows a two-year history of the market, where we have clearly seen a surge of inventory from February to August. In fact we saw a 44% increase in inventory during this time period. While that is a welcome increase, inventory growth was down 45% from the year prior, all while closed sales were up 10%! Months of Inventory based on pending sales has held steady at an average of 1.5 months over the last year. Due to demand outweighing supply we continue to see above normal price growth, with both median and average prices up 9% complete year-over-year.
Seattle Metro
Price increases are strong due to high demand and low inventory
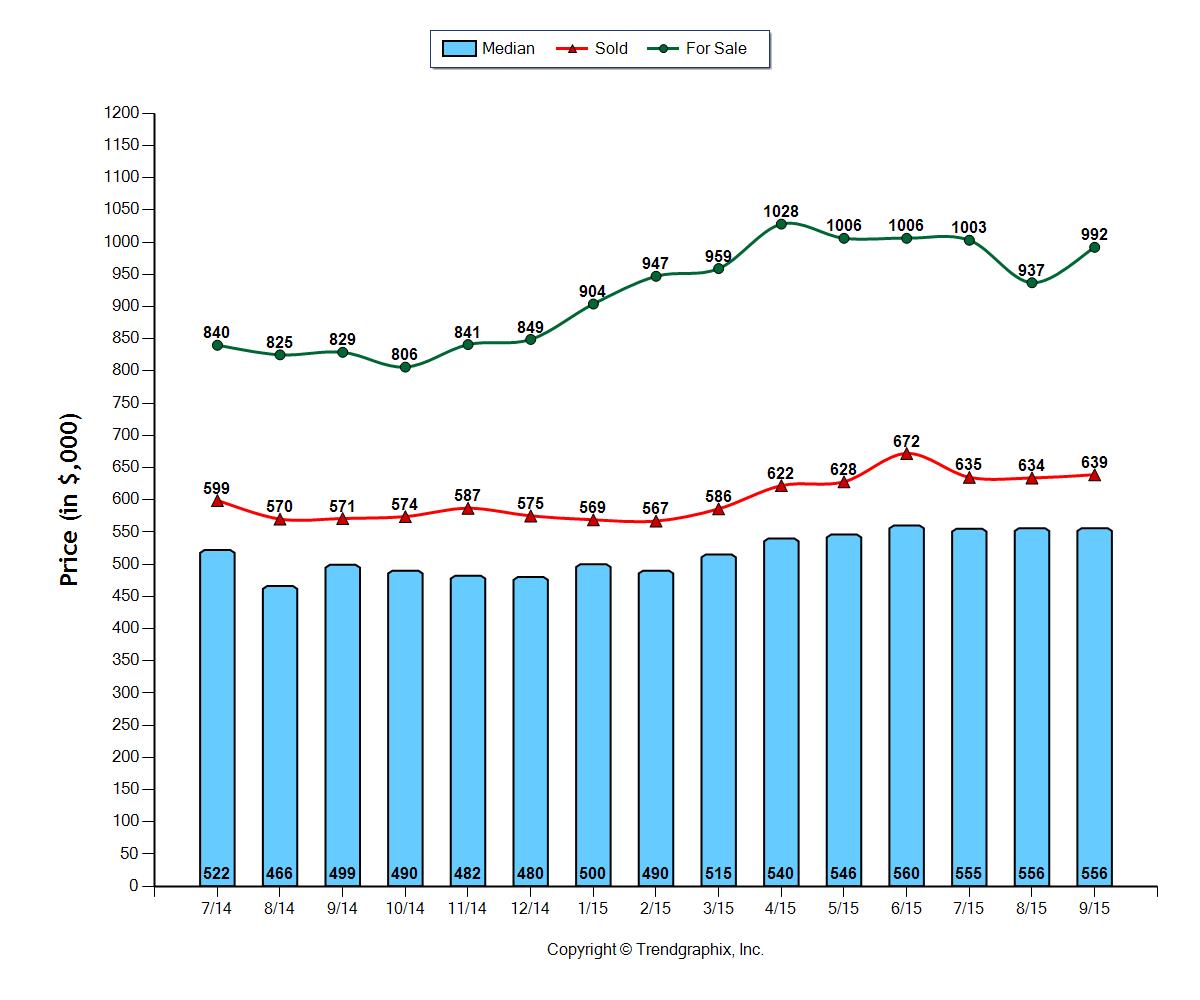
All indicators, such as sold median price, sold average price and sold price per square foot point to an 11% increase in prices complete year-over-year. The median price in the Seattle Metro area this September was $556,000 and the average was $639,000. Average days on market have shrunk to as low as 22 days this last month, and the list to sale price ratio was 101%. Lack of supply and high demand is the gas in this market’s engine. Months of inventory based on pending sales finally crested one month after a small surge of additional inventory in the third quarter.
South King County
Price increases are strong due to high demand and low inventory

All indicators point to strong price increases with median price up 11%, average price up 8% and average price per square foot up 8% complete year-over-year. The median price in South King County this September was $335,000 and the average was $358,000. Average days on market have shrunk to as low as 36 days this last month, and the list to sale price ratio was 99%. Lack of supply and high demand is the gas in this market’s engine. Months of inventory based on pending sales finally crested 1.5 months after a small surge of additional inventory in the third quarter.
This is only snapshots of the trends in our area. Please contact one of our agents if you would like further explanation of how the latest trends relate to you.
